Grundlæggende statistik
| Institutionelle ejere | 335 total, 335 long only, 0 short only, 0 long/short - change of -0,30% MRQ |
| Gennemsnitlig porteføljeallokering | 0.3308 % - change of -31,17% MRQ |
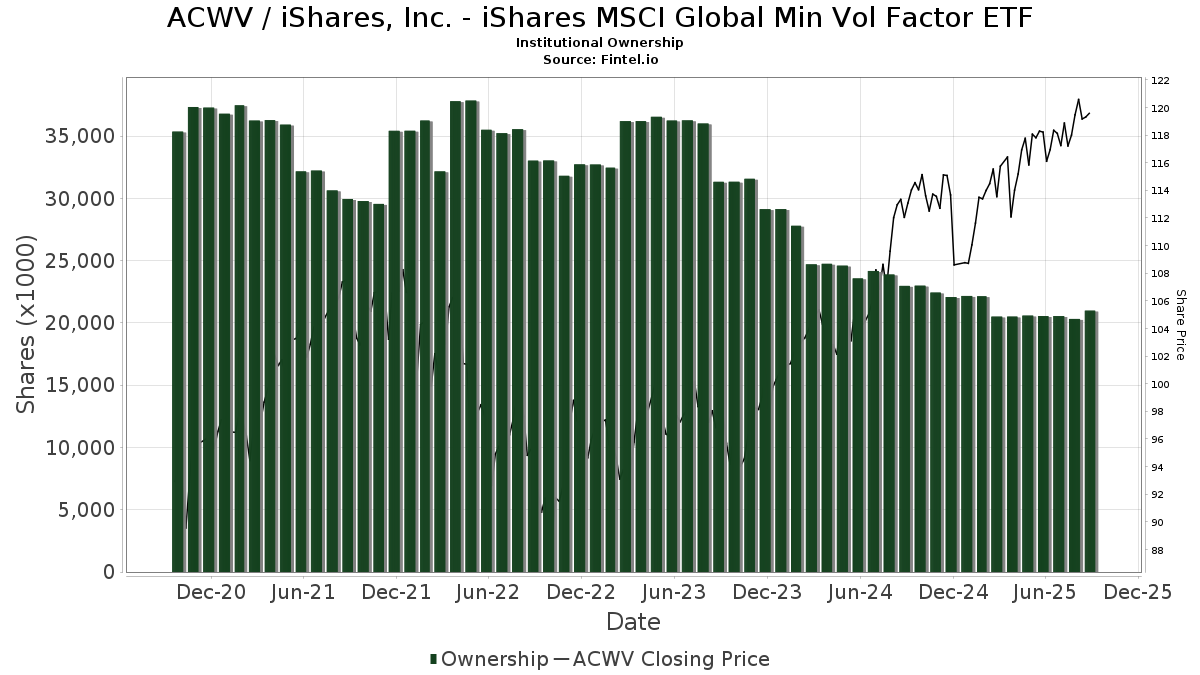
| Institutionelle aktier (lange) | 16.379.439 (ex 13D/G) - change of -3,33MM shares -16,91% MRQ |
| Institutionel værdi (lang) | $ 1.900.167 USD ($1000) |
Institutionelt ejerskab og aktionærer
iShares, Inc. - iShares MSCI Global Min Vol Factor ETF (US:ACWV) har 335 institutionelle ejere og aktionærer, der har indsendt 13D/G- eller 13F-formularer til Securities Exchange Commission (SEC). Disse institutioner har i alt 16,379,439 aktier. Største aktionærer omfatter Sei Investments Co, Aspiriant, Llc, BlackRock, Inc., Bank Of America Corp /de/, 1832 Asset Management L.P., LPL Financial LLC, RMEAX - Aspiriant Risk-Managed Equity Allocation Fund Advisor Shares, Morgan Stanley, UBS Group AG, and Ameriprise Financial Inc .
iShares, Inc. - iShares MSCI Global Min Vol Factor ETF (BATS:ACWV) institutionel ejerskabsstruktur viser aktuelle positioner i virksomheden efter institutioner og fonde, samt seneste ændringer i positionsstørrelse. Større aktionærer kan omfatte individuelle investorer, investeringsforeninger, hedgefonde eller institutioner. Skema 13D angiver, at investoren besidder (eller besidder) mere end 5 % af virksomheden og har til hensigt (eller har til hensigt at) aktivt at forfølge en ændring i forretningsstrategi. Skema 13G indikerer en passiv investering på over 5%.
The share price as of February 20, 2026 is 123,61 / share. Previously, on February 24, 2025, the share price was 114,17 / share. This represents an increase of 8,27% over that period.
Fondens stemningsscore
Fund Sentiment Score (fka Ownership Accumulation Score) finder de aktier, der bliver mest købt af fonde. Det er resultatet af en sofistikeret, multi-faktor kvantitativ model, der identificerer virksomheder med de højeste niveauer af institutionel akkumulering. Scoringsmodellen bruger en kombination af den samlede stigning i oplyste ejere, ændringerne i porteføljeallokeringer i disse ejere og andre målinger. Tallet går fra 0 til 100, hvor højere tal indikerer et højere niveau af akkumulering for sine jævnaldrende, og 50 er gennemsnittet.
Opdateringsfrekvens: Dagligt
Se Ownership Explorer, som giver en liste over højest rangerende virksomheder.
AI+ Ask Fintel’s AI assistant about iShares, Inc. - iShares MSCI Global Min Vol Factor ETF.
Select a question to share a public post with an AI-crafted answer.
Thinking of good questions…
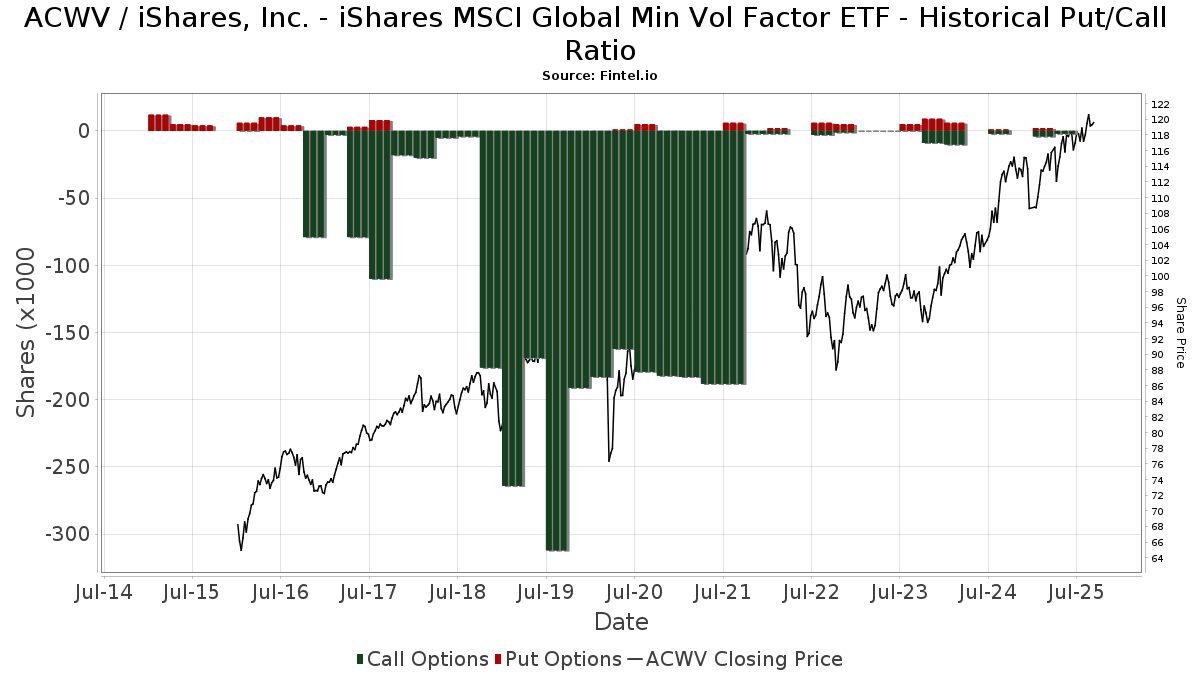
Institutionel Put/Call-forhold
Ud over at indberette standardaktie- og gældsudstedelser skal institutter med mere end 100 mill. aktiver under forvaltning også oplyse deres put- og call-optionsbeholdninger. Da salgsoptioner generelt indikerer negativ stemning, og købsoptioner indikerer positiv stemning, kan vi få en fornemmelse af den overordnede institutionelle stemning ved at plotte forholdet mellem put og kald. Diagrammet til højre viser det historiske put/call-forhold for dette instrument.
Brug af Put/Call Ratio som en indikator for investorernes stemning overvinder en af de vigtigste mangler ved at bruge totalt institutionelt ejerskab, som er, at en betydelig mængde af aktiver under forvaltning investeres passivt for at spore indekser. Passivt forvaltede fonde køber typisk ikke optioner, så indikatoren for put/call-forholdet følger mere nøje følelsen af aktivt forvaltede fonde.
13F og NPORT arkivering
Detaljer om 13F-arkivering er gratis. Detaljer om NP-ansøgninger kræver et premium-medlemskab. Grønne rækker angiver nye positioner. Røde rækker angiver lukkede positioner. Klik på linket ikon for at se den fulde transaktionshistorik.
Opgrader
for at låse premium-data op og eksportere til Excel ![]() .
.
| Fil dato | Kilde | Investor | Type | Gennemsnitlig pris (Øst) |
Aktier | Δ Aktier (%) |
Rapporteret Værdi ($1000) |
Δ Værdi (%) |
Port Alloc (%) |
|
|---|---|---|---|---|---|---|---|---|---|---|
| 2025-10-28 | 13F | BRYN MAWR TRUST Co | 670 | 0,00 | 80 | 1,27 | ||||
| 2026-02-10 | 13F/A | Northwestern Mutual Wealth Management Co | 89.232 | 1,64 | 10.596 | 0,65 | ||||
| 2026-02-12 | 13F | CIBC Private Wealth Group, LLC | 681 | -63,03 | 81 | -63,64 | ||||
| 2026-01-14 | 13F | Cox Capital Mgt LLC | 3.665 | 3,07 | 438 | 2,58 | ||||
| 2026-01-27 | 13F | Evergreen Capital Management Llc | 2.136 | 0,00 | 254 | -1,17 | ||||
| 2026-02-09 | 13F | Coldstream Capital Management Inc | 6.078 | 6,15 | 722 | 5,10 | ||||
| 2026-02-13 | 13F | Selby Wealth Management, LLC | 23.187 | 2.754 | ||||||
| 2026-01-26 | 13F | AE Wealth Management LLC | 3.384 | 0,45 | 402 | -0,74 | ||||
| 2026-02-13 | 13F | Manufacturers Life Insurance Company, The | 0 | -100,00 | 0 | |||||
| 2026-01-28 | 13F | Aureum Wealth Management, LLC | 2.250 | 267 | ||||||
| 2026-02-12 | 13F | Moneta Group Investment Advisors Llc | 6.779 | 1,07 | 805 | 0,12 | ||||
| 2025-11-07 | 13F | Atticus Wealth Management, Llc | 0 | -100,00 | 0 | |||||
| 2026-02-09 | 13F | Huntington National Bank | 20 | -13,04 | ||||||
| 2026-02-18 | 13F/A | Pinnacle Financial Partners, Inc. | 9.624 | 1.143 | ||||||
| 2026-02-13 | 13F | Resources Investment Advisors, LLC. | 5.045 | -10,34 | 599 | -11,13 | ||||
| 2025-11-03 | 13F | J. Safra Sarasin Holding AG | 0 | -100,00 | 0 | |||||
| 2026-02-11 | 13F | Vermillion Wealth Management, Inc. | 145 | 0,69 | 17 | 0,00 | ||||
| 2026-01-15 | 13F | SILVER OAK SECURITIES, Inc | 5.886 | 21,69 | 702 | 21,03 | ||||
| 2026-02-06 | 13F | HighTower Advisors, LLC | 33.698 | -1,86 | 4.002 | -2,82 | ||||
| 2026-02-09 | 13F | Harbour Investments, Inc. | 10.590 | -0,08 | 1.258 | -1,02 | ||||
| 2026-01-22 | 13F | Iron Financial, LLC | 52.209 | -0,91 | 6.200 | -1,88 | ||||
| 2026-01-06 | 13F | Fulcrum Equity Management | 0 | -100,00 | 0 | |||||
| 2026-02-11 | 13F | Jpmorgan Chase & Co | 169.870 | -8,42 | 20.172 | -9,31 | ||||
| 2026-02-10 | 13F | Sfmg, Llc | 2.099 | -4,20 | 249 | -4,96 | ||||
| 2026-02-02 | 13F | Mutual Advisors, LLC | 9.660 | 5,84 | 1.147 | 4,56 | ||||
| 2026-02-13 | 13F | Smartleaf Asset Management LLC | 1.166 | -20,84 | 139 | -20,57 | ||||
| 2026-02-17 | 13F | Alliancebernstein L.p. | 42.163 | -39,88 | 5.007 | -40,48 | ||||
| 2026-01-13 | 13F | CoreCap Advisors, LLC | 78 | -4,88 | 9 | 0,00 | ||||
| 2025-11-14 | 13F | Flow Traders U.s. Llc | 0 | -100,00 | 0 | |||||
| 2026-01-29 | 13F | Sanctuary Advisors, LLC | 15.277 | -3,53 | 1.814 | -4,48 | ||||
| 2026-02-06 | 13F | Kingdom Financial Group LLC. | 28 | 3 | ||||||
| 2026-01-26 | 13F | Whittier Trust Co Of Nevada Inc | 4.440 | 0,00 | 529 | -0,75 | ||||
| 2026-02-17 | 13F | Cetera Investment Advisers | 58.921 | 2,05 | 6.997 | 1,04 | ||||
| 2025-08-26 | NP | EQ ADVISORS TRUST - Equitable Moderate Growth MF/ETF Portfolio Class K | 18.060 | 1,69 | 2.141 | 3,63 | ||||
| 2026-02-17 | 13F | Boreal Capital Management LLC | 0 | -100,00 | 0 | |||||
| 2026-02-13 | 13F | Wells Fargo & Company/mn | 138.514 | 41,35 | 16.448 | 39,97 | ||||
| 2026-01-29 | 13F | UBS Group AG | 367.255 | -0,87 | 43.612 | -1,84 | ||||
| 2026-01-21 | 13F | Flagship Harbor Advisors, Llc | 23 | 3 | ||||||
| 2026-02-11 | 13F | O'shaughnessy Asset Management, Llc | 6 | 0,00 | 1 | |||||
| 2026-01-30 | 13F | Sigma Planning Corp | 1.946 | 15,90 | 231 | 14,93 | ||||
| 2026-02-10 | 13F | Tidemark, LLC | 656 | 0,00 | 78 | -1,28 | ||||
| 2026-02-13 | 13F | Y-Intercept (Hong Kong) Ltd | 1.773 | 0,00 | 211 | -0,94 | ||||
| 2026-01-26 | 13F | Ckw Financial Group | 4.767 | -3,87 | 1 | |||||
| 2026-02-12 | 13F | Steward Partners Investment Advisory, Llc | 2.367 | -16,39 | 281 | -17,11 | ||||
| 2026-01-13 | 13F | Well Done, LLC | 6.398 | -2,62 | 760 | -3,56 | ||||
| 2026-02-17 | 13F | Private Advisor Group, LLC | 4.500 | -3,91 | 534 | -4,81 | ||||
| 2026-02-17 | 13F | Susquehanna International Group, Llp | Call | 4.000 | 90,48 | 475 | 89,24 | |||
| 2025-08-27 | NP | RMEAX - Aspiriant Risk-Managed Equity Allocation Fund Advisor Shares | 612.100 | 0,00 | 72.577 | 1,89 | ||||
| 2026-02-10 | 13F | Garde Capital, Inc. | 2.451 | -12,46 | 291 | -13,13 | ||||
| 2026-02-11 | 13F | Prudential Plc | 18.000 | -59,57 | 2.138 | -59,97 | ||||
| 2026-01-28 | 13F | Arkansas Financial Group, Inc. | 11.493 | 0,00 | 1.365 | -1,02 | ||||
| 2026-02-17 | 13F | Cahill Financial Advisors Inc | 2.063 | -5,93 | 245 | -6,87 | ||||
| 2026-01-29 | 13F | Comerica Bank | 6.202 | -0,47 | 737 | -1,47 | ||||
| 2026-02-12 | 13F | Principal Securities, Inc. | 0 | -100,00 | 0 | |||||
| 2026-02-17 | 13F | Captrust Financial Advisors | 31.281 | -56,53 | 3.715 | -56,96 | ||||
| 2026-01-23 | 13F | Armbruster Capital Management, Inc. | 5.160 | 0,00 | 613 | -0,97 | ||||
| 2026-01-28 | 13F | Turtle Creek Wealth Advisors, LLC | 4.601 | -87,34 | 546 | -87,47 | ||||
| 2026-02-06 | 13F | Eqis Capital Management, Inc. | 3.383 | 30,12 | 402 | 28,94 | ||||
| 2026-02-09 | 13F | Kingsview Wealth Management, LLC | 5.975 | -0,37 | 710 | -1,39 | ||||
| 2026-01-14 | 13F | Eastern Bank | 3.172 | 0,00 | 377 | -1,05 | ||||
| 2026-01-27 | 13F | TD Waterhouse Canada Inc. | 2.407 | -0,17 | 286 | -1,38 | ||||
| 2026-01-15 | 13F/A | Sherman Wealth Management LLC | 2.135 | 253 | ||||||
| 2026-02-12 | 13F | Colonial Trust Advisors | 1.000 | 0,00 | 119 | -0,84 | ||||
| 2026-02-13 | 13F | Acumen Wealth Advisors, LLC | 159 | 19 | ||||||
| 2026-02-03 | 13F | Sequoia Financial Advisors, LLC | 77.658 | 2,04 | 9.222 | 1,04 | ||||
| 2026-02-13 | 13F | Visionary Wealth Advisors | 13.227 | 0,04 | 1.571 | -0,95 | ||||
| 2026-02-13 | 13F | Mml Investors Services, Llc | 6.328 | 6,28 | 751 | 5,33 | ||||
| 2025-10-16 | 13F | Provident Wealth Management, LLC | 0 | -100,00 | 0 | -100,00 | ||||
| 2026-02-02 | 13F | Cornerstone Planning Group LLC | 303 | 1,00 | 37 | 2,86 | ||||
| 2026-02-04 | 13F | GGM Financials LLC | 59 | 1,72 | 7 | 0,00 | ||||
| 2025-08-26 | NP | EQ ADVISORS TRUST - 1290 VT DoubleLine Dynamic Allocation Portfolio Class IB | 31.700 | -9,69 | 3.759 | -7,98 | ||||
| 2026-02-11 | 13F | Parallel Advisors, LLC | 627 | 0,00 | 74 | -1,33 | ||||
| 2026-02-17 | 13F | Blair William & Co/il | 4.584 | -11,11 | 544 | -11,97 | ||||
| 2026-01-15 | 13F | Stewardship Advisors, LLC | 3.428 | 2,36 | 407 | 1,50 | ||||
| 2026-02-09 | 13F | Strategic Financial Concepts, LLC | 4.082 | 485 | ||||||
| 2026-01-28 | 13F | Old National Bancorp /in/ | 29.770 | 0,30 | 3.535 | -0,67 | ||||
| 2026-02-13 | 13F | SYM FINANCIAL Corp | 45.207 | 6,69 | 5.368 | 5,65 | ||||
| 2026-02-13 | 13F | Creekside Partners | 32.053 | 0,10 | 3.806 | -0,86 | ||||
| 2026-01-22 | 13F | Searcy Financial Services Inc /adv | 228.748 | 2,50 | 27.164 | 1,49 | ||||
| 2026-02-17 | 13F | Susquehanna International Group, Llp | 0 | -100,00 | 0 | |||||
| 2026-01-22 | 13F | Glass Jacobson Investment Advisors llc | 70 | 0,00 | 8 | 0,00 | ||||
| 2026-01-26 | 13F | PDS Planning, Inc | 4.012 | 0,55 | 476 | -0,42 | ||||
| 2026-02-04 | 13F | Community Bank, N.A. | 0 | -100,00 | 0 | |||||
| 2026-02-13 | 13F | Pacific Center for Financial Services | 1.262 | 0,00 | 151 | 0,00 | ||||
| 2026-02-13 | 13F | Ubs Asset Management Americas Inc | 12.062 | 1.432 | ||||||
| 2026-02-12 | 13F | Federation des caisses Desjardins du Quebec | 468 | 0,00 | 56 | -1,79 | ||||
| 2026-01-16 | 13F | Trust Co Of Vermont | 103 | 0,00 | 12 | 0,00 | ||||
| 2026-01-29 | 13F | TBH Global Asset Management, LLC | 2.970 | -11,76 | 353 | -12,66 | ||||
| 2026-01-15 | 13F | LifeGoal Wealth Advisors | 5.160 | -1,81 | 613 | -2,55 | ||||
| 2026-02-05 | 13F | Thrivent Financial For Lutherans | 9.697 | 9,51 | 1 | 0,00 | ||||
| 2026-01-26 | 13F | Patriot Financial Group Insurance Agency, LLC | 58.716 | 2,51 | 6.973 | 1,50 | ||||
| 2026-01-21 | 13F | Landaas & Co /wi /adv | 4.491 | 0,00 | 533 | -1,11 | ||||
| 2026-01-20 | 13F | Independence Bank of Kentucky | 0 | -100,00 | 0 | |||||
| 2026-02-11 | 13F | Ackerman Capital Advisors, LLC | 129.734 | -25,08 | 15.406 | -25,81 | ||||
| 2026-02-17 | 13F | Warren Averett Asset Management, LLC | 10.556 | 1,73 | 1.253 | 0,72 | ||||
| 2026-01-23 | 13F | Hudson Oak Wealth Advisory LLC | 18.150 | 2.155 | ||||||
| 2026-02-13 | 13F | Stifel Financial Corp | 5.720 | -1,53 | 679 | -2,44 | ||||
| 2026-01-28 | 13F | G&S Capital LLC | 0 | -100,00 | 0 | |||||
| 2026-02-13 | 13F | Magnolia Capital Advisors Llc | 4.220 | 39,78 | 501 | 38,40 | ||||
| 2025-11-12 | 13F | Transce3nd, LLC | 0 | -100,00 | 0 | |||||
| 2026-02-17 | 13F | Vertex Planning Partners, LLC | 0 | -100,00 | 0 | |||||
| 2026-02-03 | 13F | NewEdge Wealth, LLC | 11.963 | -6,27 | 1.421 | -5,84 | ||||
| 2025-11-07 | 13F | Financial Advisors, LLC | 14.303 | 0,00 | 1.715 | 1,18 | ||||
| 2026-02-06 | 13F | Pnc Financial Services Group, Inc. | 4.494 | -1,30 | 534 | -2,38 | ||||
| 2026-01-20 | 13F | Aspiriant, Llc | 2.406.100 | -0,56 | 285.725 | -1,53 | ||||
| 2026-02-12 | 13F | Bank Of Montreal /can/ | 3.635 | 0,22 | 432 | -0,69 | ||||
| 2026-02-17 | 13F | High Falls Advisors, Inc | 0 | -100,00 | 0 | |||||
| 2026-01-20 | 13F | Stratos Wealth Advisors, LLC | 15.731 | -2,81 | 1.868 | -3,76 | ||||
| 2026-02-10 | 13F | COFG Advisors, LLC | 3.016 | 358 | ||||||
| 2026-02-11 | 13F | Janney Montgomery Scott LLC | 10.838 | 2,18 | 1 | 0,00 | ||||
| 2026-02-11 | 13F | Sunrise Financial Services, LLC | 5.158 | 612 | ||||||
| 2025-10-28 | 13F | Pinnacle Financial Partners Inc | 9.468 | 0,00 | 1.135 | 1,16 | ||||
| 2026-02-12 | 13F | IFC & Insurance Marketing, Inc. | 40 | 0 | ||||||
| 2026-01-16 | 13F | Perigon Wealth Management, LLC | 21.602 | -0,31 | 2.565 | -1,27 | ||||
| 2026-02-12 | 13F | Brinker Capital Investments, LLC | 1.695 | 201 | ||||||
| 2026-02-18 | 13F | EP Wealth Advisors, Inc. | 0 | -100,00 | 0 | |||||
| 2026-02-17 | 13F | Snowden Capital Advisors LLC | 9.419 | 0,17 | 1.119 | -0,80 | ||||
| 2026-01-20 | 13F | Philip James Wealth Mangement, LLC | 9.744 | -12,29 | 1.157 | -13,14 | ||||
| 2025-11-13 | 13F | Richard Bernstein Advisors LLC | 0 | -100,00 | 0 | |||||
| 2026-01-26 | 13F | DORVAL Corp | 175.929 | 5,49 | 20.892 | 4,46 | ||||
| 2026-02-12 | 13F | Rik Saylor Financial, Inc. | 10.769 | -2,60 | 1.279 | -3,55 | ||||
| 2025-11-04 | 13F | Pineridge Advisors LLC | 277 | 0,00 | 33 | 3,13 | ||||
| 2026-01-05 | 13F | GAMMA Investing LLC | 154 | 0,00 | 18 | 0,00 | ||||
| 2026-02-06 | 13F | Cvfg Llc | 2.685 | 0,00 | 319 | -0,93 | ||||
| 2026-01-26 | 13F | Consolidated Portfolio Review Corp | 0 | -100,00 | 0 | |||||
| 2026-02-11 | 13F | J.w. Cole Advisors, Inc. | 10.783 | -2,66 | 481 | -63,78 | ||||
| 2025-11-04 | 13F | Tsfg, Llc | 0 | -100,00 | 0 | |||||
| 2026-01-08 | 13F | GSG Advisors LLC | 32.868 | -1,93 | 3.903 | -2,89 | ||||
| 2026-02-12 | 13F | Compass Capital Corp /ma/ /adv | 1.805 | -0,88 | 222 | 1,83 | ||||
| 2025-11-12 | 13F | Creekmur Asset Management LLC | 1.766 | 0,00 | 212 | 0,96 | ||||
| 2026-02-05 | 13F | Allworth Financial LP | 1.423 | 0,00 | 169 | -1,18 | ||||
| 2025-11-06 | 13F | Whipplewood Advisors, LLC | 0 | -100,00 | 0 | |||||
| 2025-11-12 | 13F | CIBC Bancorp USA Inc. | 1.842 | 221 | ||||||
| 2026-02-13 | 13F | Colony Group, LLC | 10.843 | 142,95 | 1.288 | 140,56 | ||||
| 2026-01-26 | 13F | Private Trust Co Na | 688 | -19,53 | 82 | -20,59 | ||||
| 2026-01-26 | 13F | Merit Financial Group, LLC | 30.277 | 0,07 | 3.595 | -0,91 | ||||
| 2026-01-30 | 13F | Caldwell Securities, Inc | 162 | 0,00 | 19 | 0,00 | ||||
| 2026-02-04 | 13F | Independent Advisor Alliance | 2.183 | -2,89 | 259 | -3,72 | ||||
| 2026-02-11 | 13F | Fiera Capital Corp | 67.230 | 0,00 | 7.984 | -0,98 | ||||
| 2026-01-23 | 13F | Financial Connections Group, Inc. | 44.976 | -1,59 | 5 | 0,00 | ||||
| 2026-02-12 | 13F | Jane Street Group, Llc | 94.773 | 134,25 | 11.254 | 131,99 | ||||
| 2026-01-26 | 13F | Annex Advisory Services, LLC | 49.822 | 5.916 | ||||||
| 2026-02-18 | 13F | GWM Advisors LLC | 29.089 | 0,74 | 3.454 | -0,23 | ||||
| 2026-02-17 | 13F | Millennium Management Llc | 5.520 | 656 | ||||||
| 2026-01-14 | 13F | Accurate Wealth Management, LLC | 2.171 | 0,60 | 259 | 0,39 | ||||
| 2026-02-17 | 13F | Royal Bank Of Canada | 80.116 | 6,43 | 9.514 | 5,38 | ||||
| 2026-01-27 | 13F | Symmetry Partners, LLC | 1.830 | -1,72 | 217 | -2,69 | ||||
| 2026-01-13 | 13F | Mather Group, Llc. | 0 | -100,00 | 0 | |||||
| 2026-01-22 | 13F | Trilogy Capital Inc. | 2.382 | 9,22 | 283 | 8,05 | ||||
| 2026-02-11 | 13F | West Family Investments, Inc. | 5.169 | 0,00 | 795 | 0,89 | ||||
| 2026-02-03 | 13F | Tranquility Partners, LLC | 2.669 | 0,00 | 317 | -1,25 | ||||
| 2026-01-23 | 13F | Twelve Points Wealth Management LLC | 2.070 | -3,59 | 247 | -3,89 | ||||
| 2025-11-04 | 13F | Buck Wealth Strategies, LLC | 0 | -100,00 | 0 | |||||
| 2025-11-13 | 13F | Hsbc Holdings Plc | 0 | -100,00 | 0 | |||||
| 2026-02-10 | 13F | Basepoint Wealth LLC | 194 | 23 | ||||||
| 2026-02-02 | 13F | CENTRAL TRUST Co | 269 | 0,00 | 32 | -3,12 | ||||
| 2026-01-06 | 13F | Investors Research Corp | 209 | 0,00 | 25 | -4,00 | ||||
| 2026-02-03 | 13F | Vantage Financial Partners, LLC | 15.792 | 0,77 | 1.875 | -0,21 | ||||
| 2026-02-06 | 13F | GPS Wealth Strategies Group, LLC | 0 | -100,00 | 0 | |||||
| 2026-02-17 | 13F | Glenmede Trust Co Na | 87.698 | -12,30 | 10.414 | -10,50 | ||||
| 2026-02-05 | 13F | Soltis Investment Advisors LLC | 1.925 | 1,05 | 229 | 0,00 | ||||
| 2026-02-17 | 13F | Bank Of America Corp /de/ | 1.246.290 | -0,09 | 147.997 | -1,06 | ||||
| 2026-02-06 | 13F | VSM Wealth Advisory, LLC | 388 | 46 | ||||||
| 2026-02-09 | 13F | Hantz Financial Services, Inc. | 92 | 0 | ||||||
| 2026-02-10 | 13F | Argent Trust Co | 2.300 | 0,00 | 273 | -0,73 | ||||
| 2026-02-17 | 13F | Qube Research & Technologies Ltd | 43 | 5 | ||||||
| 2025-08-26 | NP | Forethought Variable Insurance Trust - Global Atlantic BlackRock Selects Managed Risk Portfolio (formerly Global Atlantic BlackRock Global Allocation Managed Risk Portfolio) Global Atlantic BlackRock Global Allocation Managed Risk Portfolio | 38.698 | 25,14 | 4.588 | 27,52 | ||||
| 2026-02-13 | 13F | MAI Capital Management | 7.041 | 22,15 | 836 | 20,98 | ||||
| 2026-02-05 | 13F | Lynx Investment Advisory | 2.170 | 22,88 | 258 | 21,80 | ||||
| 2026-01-23 | 13F | Legacy Advisory Services, LLC | 2.047 | -1,11 | 243 | -2,02 | ||||
| 2026-01-23 | 13F | Patriot Investment Management Inc. | 2.569 | 0,00 | 305 | -0,97 | ||||
| 2026-01-26 | 13F | Asset Dedication, LLC | 3.647 | -0,87 | 433 | -1,81 | ||||
| 2025-12-01 | 13F | Syverson Strege & Co | 0 | -100,00 | 0 | |||||
| 2026-01-15 | 13F | Brookstone Capital Management | 34.182 | 9,16 | 4.059 | 8,10 | ||||
| 2025-11-14 | 13F | Old Mission Capital Llc | 0 | -100,00 | 0 | |||||
| 2026-01-23 | 13F | BSW Wealth Partners | 2.302 | 0,00 | 273 | -1,09 | ||||
| 2026-02-09 | 13F | Hartland & Co., LLC | 13.662 | 33,11 | 1.622 | 31,87 | ||||
| 2026-02-11 | 13F | Cerity Partners LLC | 10.581 | 32,13 | 1.256 | 30,83 | ||||
| 2026-02-02 | 13F | Balentine LLC | 16.549 | -21,44 | 1.965 | -22,21 | ||||
| 2026-02-11 | 13F | M Holdings Securities, Inc. | 37.721 | 0,01 | 4 | 0,00 | ||||
| 2026-02-13 | 13F | Safeguard Investment Advisory Group, LLC | 1.739 | -0,91 | 207 | -1,90 | ||||
| 2026-02-13 | 13F | Quarry LP | 130 | 15 | ||||||
| 2026-02-11 | 13F | Empowered Funds, LLC | 1.782 | 212 | ||||||
| 2026-01-05 | 13F | Garrett Investment Advisors LLC | 2.186 | -20,80 | 260 | -21,52 | ||||
| 2026-01-09 | 13F | Graves-Light Private Wealth Management, Inc. | 2.145 | 0,00 | 255 | -1,17 | ||||
| 2026-01-26 | 13F | Independent Wealth Network Inc. | 1.850 | -3,19 | 220 | -4,37 | ||||
| 2026-02-11 | 13F | Modus Advisors, LLC | 480 | 57 | ||||||
| 2026-02-17 | 13F | Two Sigma Securities, Llc | 1.784 | 3,06 | 212 | 1,93 | ||||
| 2026-02-10 | 13F | CIBC World Markets Inc. | 15.473 | -0,03 | 1.837 | -1,02 | ||||
| 2026-02-13 | 13F | Kestra Advisory Services, LLC | 0 | -100,00 | 0 | |||||
| 2026-02-04 | 13F | Pure Financial Advisors, Inc. | 2.238 | -11,33 | 266 | -12,25 | ||||
| 2026-02-17 | 13F | Prelude Capital Management, Llc | 3.020 | 359 | ||||||
| 2026-02-17 | 13F | Toronto Dominion Bank | 1.687 | 200 | ||||||
| 2025-12-09 | 13F | Painted Porch Advisors LLC | 85 | 0,00 | 10 | 0,00 | ||||
| 2026-01-16 | 13F | Ronald Blue Trust, Inc. | 56 | -21,13 | 7 | -25,00 | ||||
| 2025-10-30 | 13F | WFA Asset Management Corp | 58.709 | -9,63 | 6.724 | -1,10 | ||||
| 2026-01-22 | 13F | Lee Financial Co | 1.934 | 0,00 | 230 | -0,87 | ||||
| 2025-10-30 | 13F | Arcus Capital Partners, LLC | 18.959 | 0,00 | 2.274 | 1,16 | ||||
| 2026-01-30 | 13F | Strategic Blueprint, LLC | 2.429 | -3,61 | 288 | -4,64 | ||||
| 2026-02-17 | 13F | Ameriprise Financial Inc | 240.891 | 0,74 | 28.606 | -0,24 | ||||
| 2026-02-17 | 13F | Mercer Global Advisors Inc /adv | 100.829 | 2,90 | 11.973 | 1,89 | ||||
| 2025-11-13 | 13F | Renaissance Technologies Llc | 0 | -100,00 | 0 | |||||
| 2026-01-28 | 13F | WP Advisors, LLC | 2.384 | 1,10 | 283 | 0,35 | ||||
| 2026-02-19 | 13F | CI Private Wealth, LLC | 6.390 | 759 | ||||||
| 2026-01-23 | 13F | Bryant Woods Investment Advisors, LLC | 5.674 | 0,00 | 674 | -1,03 | ||||
| 2026-02-12 | 13F | Wealthspire Advisors, LLC | 6.102 | -18,36 | 725 | -19,20 | ||||
| 2026-02-17 | 13F | United Capital Financial Advisers, Llc | 12.804 | -2,99 | 1.520 | -3,92 | ||||
| 2026-02-13 | 13F | Genesis Wealth Advisors, LLC | 2.272 | -3,40 | 270 | -4,61 | ||||
| 2026-02-17 | 13F | Northern Trust Corp | 5.235 | 35,59 | 622 | 34,13 | ||||
| 2026-02-11 | 13F | Allianz Asset Management GmbH | 28.700 | 3.408 | ||||||
| 2026-02-06 | 13F | Portland Financial Advisors Inc | 12.154 | 0,00 | 1.443 | -0,96 | ||||
| 2026-02-13 | 13F | Citigroup Inc | 2 | 0,00 | 0 | |||||
| 2026-01-20 | 13F | Signaturefd, Llc | 102 | 2,00 | 12 | 0,00 | ||||
| 2026-02-10 | 13F | Syntegra Private Wealth Group, LLC | 1.855 | -21,36 | 220 | -21,99 | ||||
| 2026-01-26 | 13F | XY Planning Network, Inc. | 15.191 | 0,60 | 1.804 | 0,73 | ||||
| 2026-02-17 | 13F | Raymond James Financial Inc | 108.452 | -31,30 | 12.879 | -31,97 | ||||
| 2026-02-13 | 13F | Gts Securities Llc | 3.916 | 465 | ||||||
| 2026-02-17 | 13F | Aqr Capital Management Llc | 7.586 | 8,65 | 901 | 7,53 | ||||
| 2026-02-17 | 13F | North Capital, Inc. | 0 | -100,00 | 0 | |||||
| 2026-02-03 | 13F | Coston, McIsaac & Partners | 66 | 1,54 | 0 | |||||
| 2026-02-11 | 13F | LPL Financial LLC | 702.659 | 2,17 | 83.441 | 1,18 | ||||
| 2026-01-09 | 13F | First Heartland Consultants, Inc. | 2.349 | 0,00 | 279 | -1,07 | ||||
| 2025-11-13 | 13F | GeoWealth Management, LLC | 0 | -100,00 | 0 | |||||
| 2026-02-12 | 13F | BlackRock, Inc. | 1.293.082 | -3,36 | 153.553 | -4,30 | ||||
| 2026-01-15 | 13F | Investment Partners Asset Management, Inc. | 3.228 | 0,00 | 383 | -1,03 | ||||
| 2026-01-29 | 13F | Tanglewood Wealth Management, Inc. | 0 | -100,00 | 0 | |||||
| 2026-02-10 | 13F | Parkway Wealth Management Group, LLC | 58.187 | 6.910 | ||||||
| 2026-02-05 | 13F | Western Wealth Management, LLC | 3.017 | 30,78 | 358 | 29,71 | ||||
| 2026-01-12 | 13F | Focus Financial Network, Inc. | 3.383 | -5,63 | 402 | -6,53 | ||||
| 2026-02-13 | 13F | Aptus Capital Advisors, LLC | 310 | -7,19 | 37 | -10,00 | ||||
| 2026-01-28 | 13F | HB Wealth Management, LLC | 126.408 | -2,40 | 15.011 | -3,35 | ||||
| 2026-02-06 | 13F | Signature Estate & Investment Advisors Llc | 11.826 | 0,36 | 1.404 | -0,64 | ||||
| 2026-02-11 | 13F | Aspetuck Financial Management LLC | 4.670 | 0,00 | 555 | -1,07 | ||||
| 2026-01-23 | 13F | Stanich Group LLC | 3.195 | -3,65 | 379 | -4,53 | ||||
| 2026-02-10 | 13F | Hilltop Partners LLC | 2.866 | 0,00 | 340 | -0,87 | ||||
| 2026-01-27 | 13F | Cfm Wealth Partners Llc | 1.708 | 0,00 | 203 | -0,98 | ||||
| 2026-01-26 | 13F | United Advisor Group, LLC | 5.201 | 3,30 | 618 | 2,32 | ||||
| 2026-01-13 | 13F | Cadent Capital Advisors, LLC | 40.283 | -3,38 | 4.784 | -4,32 | ||||
| 2026-02-06 | 13F | Global Retirement Partners, LLC | 2.838 | 337 | ||||||
| 2026-02-10 | 13F | Goldman Sachs Group Inc | 7.038 | 13,68 | 836 | 12,53 | ||||
| 2026-01-27 | 13F | GHP Investment Advisors, Inc. | 161 | 0,00 | 19 | 0,00 | ||||
| 2026-02-11 | 13F | Tacita Capital Inc | 88.082 | 2,62 | 10.460 | 1,62 | ||||
| 2026-01-21 | 13F | Planning Directions Inc | 11.406 | 0,79 | 1.354 | -0,22 | ||||
| 2026-02-06 | 13F | Granite FO LLC | 10.829 | 0,00 | 1.286 | -1,00 | ||||
| 2026-01-23 | 13F | U.S. Capital Wealth Advisors, LLC | 12.990 | -14,84 | 1.543 | -15,69 | ||||
| 2026-02-17 | 13F | Summit Global Investments | 0 | -100,00 | 0 | |||||
| 2026-02-13 | 13F | SRS Capital Advisors, Inc. | 2.420 | 287 | ||||||
| 2026-02-20 | 13F | Sunbelt Securities, Inc. | 21 | 0,00 | 2 | 0,00 | ||||
| 2026-02-12 | 13F | Commonwealth Equity Services, Llc | 102.939 | -2,55 | 12.224 | 101.766,67 | ||||
| 2026-02-17 | 13F | Hyundai Investments Co., Ltd. | 3.226 | 385 | ||||||
| 2025-10-17 | 13F | Optivise Advisory Services LLC | 0 | -100,00 | 0 | |||||
| 2026-01-30 | 13F | Exencial Wealth Advisors, Llc | 3.443 | 4,02 | 409 | 3,03 | ||||
| 2026-02-13 | 13F | Wealth Dimensions Group, Ltd. | 5.714 | 0,09 | 679 | -0,88 | ||||
| 2026-01-16 | 13F | Crewe Advisors LLC | 100 | 0,00 | 12 | 0,00 | ||||
| 2026-01-09 | 13F | Appleton Partners Inc/ma | 3.575 | 0,00 | 0 | |||||
| 2025-11-13 | 13F | Glenmede Investment Management, LP | 98.468 | -2,48 | 11.808 | -1,37 | ||||
| 2025-10-10 | 13F | Fifth Third Securities, Inc. | 0 | -100,00 | 0 | |||||
| 2026-01-16 | 13F | First Pacific Financial | 86 | 1,18 | 10 | 0,00 | ||||
| 2026-02-17 | 13F | Creative Planning | 8.791 | 2,01 | 1.044 | 0,97 | ||||
| 2026-02-13 | 13F | Centaurus Financial, Inc. | 8.689 | 8,75 | 1 | |||||
| 2026-02-17 | 13F | MGB Wealth Management, LLC | 2.267 | 269 | ||||||
| 2026-01-14 | 13F | Bond & Devick Financial Network, Inc. | 8.327 | 0,00 | 989 | -1,00 | ||||
| 2026-01-15 | 13F | Professional Financial Advisors, LLC | 10.321 | 1,93 | 1.226 | 0,91 | ||||
| 2026-02-13 | 13F | Ausdal Financial Partners, Inc. | 14.361 | 0,36 | 1.705 | -0,58 | ||||
| 2026-02-10 | 13F | Savant Capital, LLC | 11.636 | 63,50 | 1.382 | 61,90 | ||||
| 2026-02-13 | 13F | TFB Advisors LLC | 14.068 | 7,23 | 1.671 | 6,30 | ||||
| 2026-02-13 | 13F | Brown Advisory Inc | 2.100 | 0,00 | 249 | -0,80 | ||||
| 2026-01-27 | 13F | Prasad Wealth Partners, LLC | 0 | -100,00 | 0 | -100,00 | ||||
| 2026-02-14 | 13F | Rockefeller Capital Management L.P. | 154.025 | 84,66 | 18.291 | 82,86 | ||||
| 2026-02-10 | 13F | Thoroughbred Financial Services, Llc | 3.030 | -4,72 | 0 | |||||
| 2026-02-11 | 13F | OneAscent Wealth Management LLC | 1.981 | 0,00 | 235 | -0,84 | ||||
| 2026-01-29 | 13F | Concurrent Investment Advisors, LLC | 5.851 | 1,35 | 695 | 0,29 | ||||
| 2026-02-13 | 13F | Morgan Stanley | 401.887 | 3,38 | 47.724 | 2,37 | ||||
| 2026-02-17 | 13F | Citadel Advisors Llc | 12.403 | 324,91 | 1.473 | 320,57 | ||||
| 2026-02-13 | 13F | Mariner, LLC | 92.272 | -2,26 | 10.957 | -3,22 | ||||
| 2026-02-06 | 13F | Van Hulzen Asset Management, LLC | 3.470 | -8,44 | 412 | -9,25 | ||||
| 2026-02-17 | 13F | Fmr Llc | 11.878 | -9,99 | 1.411 | -10,87 | ||||
| 2026-01-08 | 13F | Wealth Enhancement Advisory Services, Llc | 100.637 | 0,88 | 12.001 | 0,23 | ||||
| 2026-01-26 | 13F | Milestones Private Investment Advisors LLC | 13.561 | -1,76 | 1.610 | -2,72 | ||||
| 2026-01-29 | 13F | Vanguard Group Inc | 1.795 | -0,06 | 213 | -0,93 | ||||
| 2025-10-20 | 13F | Keystone Global Partners, LLC | 0 | -100,00 | 0 | -100,00 | ||||
| 2026-02-17 | 13F | Common Fund For Nonprofit Organizations | 0 | -100,00 | 0 | |||||
| 2026-01-07 | 13F | Parisi Gray Wealth Management | 2.711 | 0,00 | 322 | -1,23 | ||||
| 2026-01-20 | 13F | Stratos Wealth Partners, LTD. | 7.500 | -0,82 | 891 | -1,77 | ||||
| 2026-01-20 | 13F | First American Bank | 2.500 | 0,00 | 297 | -1,00 | ||||
| 2026-01-26 | 13F | Cwm, Llc | 33.333 | 0,07 | 4 | 0,00 | ||||
| 2026-02-11 | 13F | Buckingham Strategic Partners | 2.670 | -34,07 | 317 | -34,23 | ||||
| 2026-01-26 | 13F | Wbh Advisory Inc | 9.125 | 0,01 | 1.084 | -1,01 | ||||
| 2026-01-28 | 13F | Alesco Advisors Llc | 10.441 | 0,00 | 1.240 | -1,04 | ||||
| 2026-01-14 | 13F | Spire Wealth Management | 787 | 0,00 | 93 | -1,06 | ||||
| 2025-11-14 | 13F | Strategic Wealth Partners, Ltd. | 9 | 1 | ||||||
| 2026-02-10 | 13F | JMG Financial Group, Ltd. | 1.738 | 0,00 | 206 | -0,96 | ||||
| 2026-02-10 | 13F | Operose Advisors LLC | 2.155 | 0,98 | 256 | 0,00 | ||||
| 2026-02-10 | 13F | Envestnet Asset Management Inc | 202.125 | -2,25 | 24.002 | -3,20 | ||||
| 2026-02-13 | 13F | Sei Investments Co | 2.602.166 | 2,05 | 309.024 | 1,06 | ||||
| 2026-02-12 | 13F | Summit Financial, LLC | 5.518 | -19,60 | 655 | -20,41 | ||||
| 2026-01-28 | 13F | WPG Advisers, LLC | 2.854 | 0,85 | 339 | -0,29 | ||||
| 2026-02-05 | 13F | Bessemer Group Inc | 168.189 | 0,00 | 20 | -5,00 | ||||
| 2026-02-06 | 13F | Creative Financial Designs Inc /adv | 319 | -19,04 | 38 | -21,28 | ||||
| 2026-02-06 | 13F | Keystone Financial Group | 2.842 | -14,40 | 338 | -15,33 | ||||
| 2026-01-21 | 13F | Petra Financial Advisors Inc | 1.935 | 12,57 | 230 | 11,17 | ||||
| 2026-02-06 | 13F/A | Rathbone Brothers plc | 3.177 | 15,70 | 377 | 14,59 | ||||
| 2026-02-03 | 13F | Apeiron RIA LLC | 1.768 | 1,61 | 210 | 0,48 | ||||
| 2026-01-29 | 13F | TKG Advisors, LLC | 0 | -100,00 | 0 | |||||
| 2026-02-13 | 13F | Integrated Wealth Concepts LLC | 6.381 | -8,74 | 758 | -9,67 | ||||
| 2026-02-02 | 13F | Sachetta, LLC | 411 | -3,52 | 49 | -5,88 | ||||
| 2026-02-03 | 13F | Patten & Patten Inc/tn | 2.018 | 0,00 | 240 | -0,83 | ||||
| 2026-02-02 | 13F | Truist Financial Corp | 80.725 | 0,90 | 9.586 | -0,08 | ||||
| 2026-01-28 | 13F | Family Wealth Group, LLC | 17.134 | 1,10 | 2.035 | 0,10 | ||||
| 2026-01-07 | 13F | Magnus Financial Group LLC | 1.861 | -0,64 | 221 | -1,79 | ||||
| 2026-02-13 | 13F | 1832 Asset Management L.P. | 931.806 | 110.652 | ||||||
| 2026-02-17 | 13F | Tower Research Capital LLC (TRC) | 2 | 0 | ||||||
| 2026-02-13 | 13F | National Bank Of Canada /fi/ | 42.641 | 19,84 | 5.056 | 18,50 | ||||
| 2026-02-11 | 13F | Dorsey & Whitney Trust CO LLC | 2.500 | 0,00 | 297 | -1,00 | ||||
| 2026-01-23 | 13F | Lester Murray Antman dba SimplyRich | 16.106 | 0,75 | 2 | 0,00 | ||||
| 2026-01-29 | 13F | Klingman & Associates, LLC | 0 | -100,00 | 0 | |||||
| 2026-02-12 | 13F | Triumph Capital Management | 1.016 | -0,39 | 121 | -1,64 | ||||
| 2026-01-05 | 13F | Holos Integrated Wealth LLC | 1.069 | -0,09 | 127 | 0,00 | ||||
| 2025-11-17 | 13F | LGT Financial Advisors LLC | 0 | -100,00 | 0 | |||||
| 2026-02-17 | 13F | Advisor Group Holdings, Inc. | 47.911 | -5,09 | 5.690 | -5,65 | ||||
| 2026-01-29 | 13F | Nbc Securities, Inc. | 294 | -27,76 | 35 | -29,17 | ||||
| 2026-02-06 | 13F | Csenge Advisory Group | 9.800 | 8,16 | 1.164 | 7,09 | ||||
| 2026-01-21 | 13F | Capital Investment Advisory Services, LLC | 1.011 | -32,87 | 120 | -33,33 | ||||
| 2026-01-27 | 13F | PFG Advisors | 17.576 | -1,51 | 2.087 | -2,43 | ||||
| 2026-02-13 | 13F | Baird Financial Group, Inc. | 2.186 | 0,00 | 260 | -1,15 | ||||
| 2026-01-26 | 13F | Valmark Advisers, Inc. | 20.504 | -54,64 | 2.435 | -55,10 | ||||
| 2026-02-09 | 13F | Bellwether Advisors, LLC | 7.877 | 7,68 | 935 | 6,61 | ||||
| 2026-02-13 | 13F | Perryman Financial Advisory Inc /ad | 3.025 | 359 | ||||||
| 2026-02-19 | 13F | Birchwood Financial Partners, Inc. | 2.764 | 328 | ||||||
| 2026-02-17 | 13F | Advisory Services Network, LLC | 2.147 | -2,36 | 255 | -3,04 | ||||
| 2025-10-03 | 13F | Smallwood Wealth Investment Management, LLC | 0 | -100,00 | 0 | |||||
| 2026-01-27 | 13F | BankPlus Trust Department | 52 | 0,00 | 6 | 0,00 | ||||
| 2026-02-04 | 13F | Ameritas Advisory Services, LLC | 10.902 | 501,66 | 1.295 | 496,31 | ||||
| 2026-02-10 | 13F | Calton & Associates, Inc. | 2.621 | -30,51 | 311 | -31,19 | ||||
| 2026-02-04 | 13F | MONECO Advisors, LLC | 3.149 | 0,57 | 374 | -0,53 | ||||
| 2026-01-22 | 13F | K2 Financial Inc. | 19.019 | -1,94 | 2.271 | -1,60 | ||||
| 2026-02-04 | 13F | Mascoma Wealth Management LLC | 1.860 | 0,00 | 221 | -1,35 | ||||
| 2026-01-28 | 13F | Geneos Wealth Management Inc. | 6.872 | 0,35 | 816 | -0,73 | ||||
| 2026-01-20 | 13F | BXM Wealth LLC | 0 | -100,00 | 0 | |||||
| 2026-02-11 | 13F | Franklin Resources Inc | 125 | 15 | ||||||
| 2026-02-06 | 13F | Tortoise Investment Management, LLC | 0 | -100,00 | 0 | |||||
| 2025-11-12 | 13F | Oak Grove Capital LLC | 0 | -100,00 | 0 | |||||
| 2026-02-17 | 13F | Wiley Bros.-aintree Capital, Llc | 35.786 | -3,94 | 4.250 | -4,88 | ||||
| 2026-01-23 | 13F | Diversify Advisory Services, LLC | 9.299 | 1.114 | ||||||
| 2026-01-28 | 13F | Diversified Enterprises, LLC | 5.983 | 27,46 | 710 | 26,33 | ||||
| 2026-01-23 | 13F | Assetmark, Inc | 753 | -4,68 | 89 | -5,32 | ||||
| 2026-02-06 | 13F | Baron Silver Stevens Financial Advisors, Llc | 141.078 | 1,08 | 16.753 | 0,10 | ||||
| 2026-01-23 | 13F | Farther Finance Advisors, LLC | 94 | 161,11 | 11 | 175,00 | ||||
| 2026-02-04 | 13F | Pensionmark Financial Group, Llc | 4.021 | 0,53 | 472 | -1,67 | ||||
| 2026-02-05 | 13F | Cambridge Investment Research Advisors, Inc. | 28.714 | -2,11 | 3 | 0,00 | ||||
| 2026-02-11 | 13F | Capital Analysts, Inc. | 0 | -100,00 | 0 | |||||
| 2026-01-29 | 13F | Warren Street Wealth Advisors, LLC | 0 | -100,00 | 0 | |||||
| 2026-01-28 | 13F | Barrett & Company, Inc. | 60 | 0,00 | 7 | 0,00 | ||||
| 2026-01-30 | 13F | Joel Isaacson & Co., LLC | 2.493 | 11,15 | 296 | 10,04 | ||||
| 2025-11-07 | 13F | Beacon Capital Management, LLC | 0 | -100,00 | 0 | |||||
| 2026-02-12 | 13F | Brown Brothers Harriman & Co | 7.868 | 0,00 | 934 | -0,95 | ||||
| 2026-01-23 | 13F | Vestment Financial LLC | 2.239 | -19,92 | 268 | -20,06 | ||||
| 2025-10-21 | 13F | Summit Wealth Partners, LLC | 0 | -100,00 | 0 | |||||
| 2026-02-11 | 13F | Daner Wealth Management, LLC | 1.795 | 0,00 | 221 | 2,31 | ||||
| 2025-11-06 | 13F | Asset Planning Corporation | 2.372 | 0,00 | 284 | 1,07 | ||||
| 2025-08-26 | NP | EQ ADVISORS TRUST - Equitable Growth MF/ETF Portfolio Class K | 28.060 | 4,86 | 3.327 | 6,84 | ||||
| 2026-02-06 | 13F | IFP Advisors, Inc | 564 | 0,00 | 67 | -1,49 | ||||
| 2026-01-30 | 13F | Us Bancorp \de\ | 3.874 | -33,92 | 460 | -34,57 | ||||
| 2026-01-23 | 13F | Keener Financial Planning LLC | 0 | -100,00 | 0 | |||||
| 2026-02-10 | 13F | Measured Wealth Private Client Group, LLC | 308 | 37 | ||||||
| 2026-02-05 | 13F | HighMark Wealth Management LLC | 60 | 0,00 | 7 | 0,00 | ||||
| 2026-02-17 | 13F | Cresset Asset Management, LLC | 2.100 | 0,00 | 249 | -0,80 | ||||
| 2026-02-17 | 13F | Equitable Holdings, Inc. | 100.944 | 6,85 | 11.987 | 5,81 | ||||
| 2026-02-18 | 13F | Beacon Pointe Advisors, LLC | 58.650 | 0,93 | 6.965 | -0,06 | ||||
| 2026-02-13 | 13F | Motiv8 Investments LLC | 1.190 | 0 | ||||||
| 2026-01-27 | 13F | Wealth Enhancement Trust Services, Inc. | 905 | 107 | ||||||
| 2026-02-10 | 13F | Bnp Paribas Arbitrage, Sa | 29 | 0,00 | 3 | 0,00 | ||||
| 2026-02-18 | 13F | Financial Advisory Service, Inc. | 4.289 | 0,94 | 509 | 0,00 | ||||
| 2026-01-27 | 13F | Avenue 1 Advisors, LLC | 1.983 | 0,00 | 235 | -0,84 | ||||
| 2026-01-20 | 13F | AdvisorNet Financial, Inc | 1.372 | -1,15 | 163 | -2,41 | ||||
| 2026-01-22 | 13F | Granite Harbor Advisors, Inc. | 6.962 | -0,34 | 827 | -1,31 | ||||
| 2026-01-20 | 13F | Chatterton & Associates Inc. | 12.559 | 1.491 | ||||||
| 2026-01-23 | 13F | DHJJ Financial Advisors, Ltd. | 6 | 0,00 | 1 | |||||
| 2026-02-17 | 13F | Jones Financial Companies Lllp | 37.766 | 26,85 | 4.485 | 26,38 | ||||
| 2026-01-28 | 13F | Lebenthal Global Advisors, LLC | 1.889 | 3,51 | 224 | 2,75 | ||||
| 2026-01-14 | 13F | Jfs Wealth Advisors, Llc | 4 | 0 | ||||||
| 2026-02-09 | 13F | Sensible Money, LLC | 3.647 | 0,00 | 433 | -0,92 | ||||
| 2026-02-17 | 13F | NorthRock Partners, LLC | 2.296 | 273 | ||||||
| 2026-02-17 | 13F | Cape Investment Advisory, Inc. | 861 | 0,00 | 102 | -0,97 | ||||
| 2026-01-09 | 13F | Dynamic Advisor Solutions LLC | 75.171 | -10,27 | 8.927 | -11,15 |