Grundlæggende statistik
| Institutionelle ejere | 381 total, 371 long only, 0 short only, 10 long/short - change of -3,92% MRQ |
| Gennemsnitlig porteføljeallokering | 0.3755 % - change of -15,71% MRQ |
| Institutionelle aktier (lange) | 1.226.107.402 (ex 13D/G) - change of -73,31MM shares -5,50% MRQ |
| Institutionel værdi (lang) | $ 8.647.255 USD ($1000) |
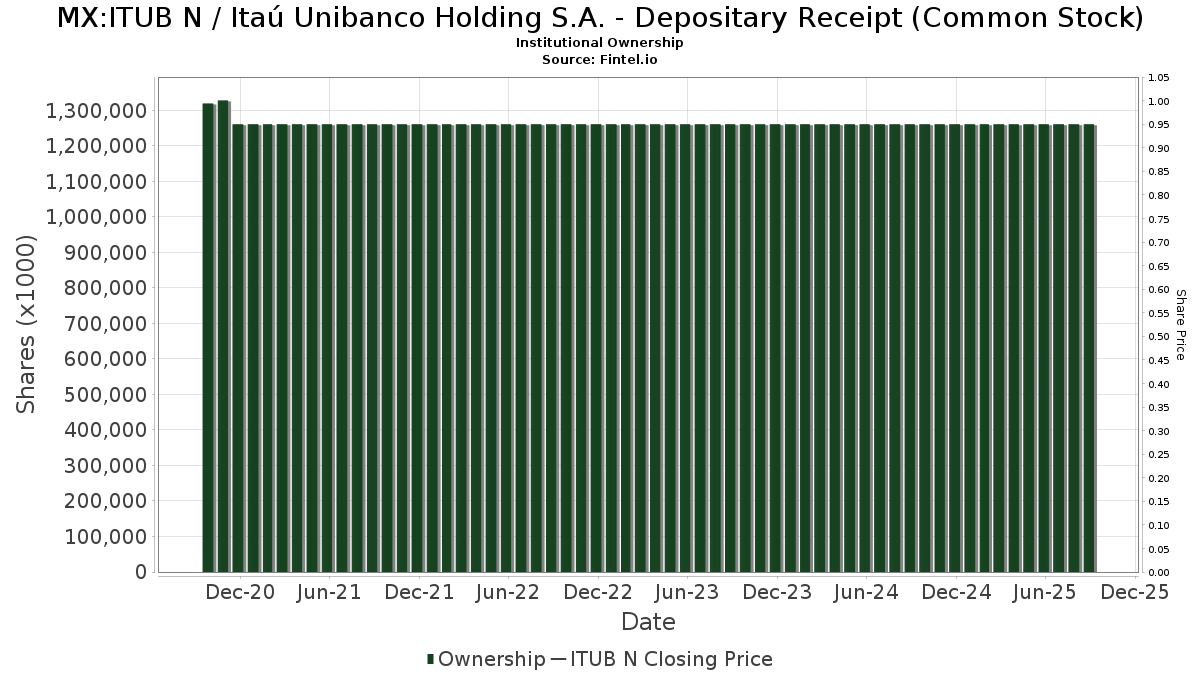
Institutionelt ejerskab og aktionærer
Itaú Unibanco Holding S.A. - Depositary Receipt (Common Stock) (MX:ITUB N) har 381 institutionelle ejere og aktionærer, der har indsendt 13D/G- eller 13F-formularer til Securities Exchange Commission (SEC). Disse institutioner har i alt 1,226,107,402 aktier. Største aktionærer omfatter GQG Partners LLC, Orbis Allan Gray Ltd, Schroder Investment Management Group, Arrowstreet Capital, Limited Partnership, Westwood Global Investments, LLC, Fmr Llc, Robeco Institutional Asset Management B.V., Jpmorgan Chase & Co, Wellington Management Group Llp, and BlackRock, Inc. .
Itaú Unibanco Holding S.A. - Depositary Receipt (Common Stock) (BMV:ITUB N) institutionel ejerskabsstruktur viser aktuelle positioner i virksomheden efter institutioner og fonde, samt seneste ændringer i positionsstørrelse. Større aktionærer kan omfatte individuelle investorer, investeringsforeninger, hedgefonde eller institutioner. Skema 13D angiver, at investoren besidder (eller besidder) mere end 5 % af virksomheden og har til hensigt (eller har til hensigt at) aktivt at forfølge en ændring i forretningsstrategi. Skema 13G indikerer en passiv investering på over 5%.
Fondens stemningsscore
Fund Sentiment Score (fka Ownership Accumulation Score) finder de aktier, der bliver mest købt af fonde. Det er resultatet af en sofistikeret, multi-faktor kvantitativ model, der identificerer virksomheder med de højeste niveauer af institutionel akkumulering. Scoringsmodellen bruger en kombination af den samlede stigning i oplyste ejere, ændringerne i porteføljeallokeringer i disse ejere og andre målinger. Tallet går fra 0 til 100, hvor højere tal indikerer et højere niveau af akkumulering for sine jævnaldrende, og 50 er gennemsnittet.
Opdateringsfrekvens: Dagligt
Se Ownership Explorer, som giver en liste over højest rangerende virksomheder.
AI+ Ask Fintel’s AI assistant about Itaú Unibanco Holding S.A. - Depositary Receipt (Common Stock).
Select a question to share a public post with an AI-crafted answer.
Thinking of good questions…
13F og NPORT arkivering
Detaljer om 13F-arkivering er gratis. Detaljer om NP-ansøgninger kræver et premium-medlemskab. Grønne rækker angiver nye positioner. Røde rækker angiver lukkede positioner. Klik på linket ikon for at se den fulde transaktionshistorik.
Opgrader
for at låse premium-data op og eksportere til Excel ![]() .
.
| Fil dato | Kilde | Investor | Type | Gennemsnitlig pris (Øst) |
Aktier | Δ Aktier (%) |
Rapporteret Værdi ($1000) |
Δ Værdi (%) |
Port Alloc (%) |
|
|---|---|---|---|---|---|---|---|---|---|---|
| 2026-02-09 | 13F | Mondrian Investment Partners LTD | 16.471 | 33,95 | 118 | 30,00 | ||||
| 2026-02-13 | 13F | Rhumbline Advisers | 297.379 | -16,49 | 2.129 | -18,52 | ||||
| 2026-04-20 | 13F | Banque Cantonale Vaudoise | 478.138 | 55,25 | 4.007 | 81,72 | ||||
| 2025-11-07 | 13F | Beacon Capital Management, LLC | 0 | -100,00 | 0 | |||||
| 2026-02-03 | 13F | Sequoia Financial Advisors, LLC | 67.901 | 3,16 | 486 | 0,62 | ||||
| 2026-02-04 | 13F | INCA Investments LLC | 911.377 | -5,26 | 6.525 | -7,58 | ||||
| 2026-02-04 | 13F | First Eagle Investment Management, LLC | 2.793.981 | 12,15 | 20.005 | 9,40 | ||||
| 2026-02-06 | 13F | Leonteq Securities AG | 34.888 | 84,81 | 250 | 80,43 | ||||
| 2026-02-13 | 13F | Candriam Luxembourg S.C.A. | 47.829 | -17,91 | 342 | -19,91 | ||||
| 2026-02-12 | 13F | Dimensional Fund Advisors Lp | 976.062 | 20,11 | 6.989 | 17,17 | ||||
| 2026-01-30 | 13F | Mizuho Securities Co. Ltd. | 0 | -100,00 | 0 | |||||
| 2026-02-12 | 13F | Hrt Financial Lp | 247.016 | 2 | ||||||
| 2026-02-06 | 13F | Pnc Financial Services Group, Inc. | 122.078 | -26,07 | 874 | -27,89 | ||||
| 2026-04-24 | 13F | Strs Ohio | 686.170 | -13,21 | 5.750 | 1,59 | ||||
| 2026-02-12 | 13F | Federation des caisses Desjardins du Quebec | 339 | 2,73 | 2 | 0,00 | ||||
| 2026-02-10 | 13F | Envestnet Asset Management Inc | 1.266.074 | 3,21 | 9.065 | 0,69 | ||||
| 2026-02-12 | 13F | Aviva Plc | 18.547 | 3,00 | 133 | 0,00 | ||||
| 2026-04-09 | 13F | Tompkins Financial Corp | 0 | -100,00 | 0 | |||||
| 2026-02-13 | 13F | NLB Skladi, upravljanje premozenja, d.o.o. | 113.300 | 811 | ||||||
| 2026-02-11 | 13F | Deutsche Bank Ag\ | 159.547 | 1.142 | ||||||
| 2026-02-13 | 13F | Johnson Investment Counsel Inc | 0 | -100,00 | 0 | |||||
| 2026-04-14 | 13F | Perpetual Ltd | 13.273.095 | -1,52 | 111.229 | 15,26 | ||||
| 2026-02-10 | 13F | Guardcap Asset Management Ltd | 229.484 | -9,51 | 1.643 | -11,71 | ||||
| 2026-02-13 | 13F | Stifel Financial Corp | 47.907 | 52,89 | 343 | 49,13 | ||||
| 2026-02-11 | 13F | Parallel Advisors, LLC | 11.547 | 9,06 | 83 | 6,49 | ||||
| 2026-02-13 | 13F | SRS Capital Advisors, Inc. | 10.314 | 1.768,48 | 74 | 1.725,00 | ||||
| 2026-02-10 | 13F | Quantbot Technologies LP | 1.266 | 9 | ||||||
| 2026-02-13 | 13F | Gould Asset Management Llc /ca/ | 40.777 | 3,00 | 292 | 0,34 | ||||
| 2026-02-12 | 13F | Skopos Labs, Inc. | 145.534 | 296,23 | 1.022 | 320,16 | ||||
| 2026-02-17 | 13F | Parallax Volatility Advisers, L.P. | Put | 182.300 | 0,00 | 1.305 | -2,47 | |||
| 2026-04-10 | 13F | Naviter Wealth, LLC | 78.193 | 9,03 | 661 | 28,65 | ||||
| 2026-02-17 | 13F | Parallax Volatility Advisers, L.P. | Call | 254.300 | 0,00 | 1.821 | -2,47 | |||
| 2026-02-05 | 13F | Td Private Client Wealth Llc | 2.659 | -1,81 | 19 | 0,00 | ||||
| 2026-02-13 | 13F | Ubs Asset Management Americas Inc | 3.818 | -97,27 | 27 | -97,37 | ||||
| 2026-02-12 | 13F | Fortress Private Ledger, Llc | 36.232 | 69,85 | 259 | 66,03 | ||||
| 2026-02-17 | 13F | MIRAE ASSET GLOBAL ETFS HOLDINGS Ltd. | 282.461 | 7,49 | 2.022 | 4,88 | ||||
| 2026-02-13 | 13F | Morgan Stanley | 2.980.623 | -31,91 | 21.341 | -33,58 | ||||
| 2026-02-17 | 13F | Oaktree Fund Advisors, LLC | 775.939 | 3,10 | 5.556 | 0,56 | ||||
| 2026-02-13 | 13F | Pathstone Holdings, LLC | 160.347 | 7,97 | 1.148 | 5,32 | ||||
| 2026-02-17 | 13F | XTX Topco Ltd | 404.830 | 2.899 | ||||||
| 2026-02-04 | 13F | Legacy Financial Advisors, Inc. | 0 | -100,00 | 0 | |||||
| 2026-02-17 | 13F | Captrust Financial Advisors | 20.684 | 7,45 | 148 | 4,96 | ||||
| 2026-02-11 | 13F | Group One Trading, L.p. | Call | 77.100 | -54,67 | 552 | -55,77 | |||
| 2026-02-11 | 13F | Group One Trading, L.p. | Put | 25.800 | 316,13 | 185 | 308,89 | |||
| 2025-11-14 | 13F | Binnacle Investments Inc | 379 | 0,00 | 3 | 0,00 | ||||
| 2026-02-05 | 13F | Bank Julius Baer & Co. Ltd, Zurich | 21.527 | 3,00 | 154 | 0,65 | ||||
| 2026-02-03 | 13F | Ballentine Partners, LLC | 35.716 | 20,78 | 256 | 17,51 | ||||
| 2026-02-17 | 13F | Warren Averett Asset Management, LLC | 14.117 | 5,08 | 101 | 3,06 | ||||
| 2026-02-12 | 13F | Nuveen, LLC | 131.838 | 0,66 | 944 | -1,87 | ||||
| 2026-02-13 | 13F | Itau Unibanco Holding S.A. | 21.106.153 | -6,91 | 151.310 | -9,08 | ||||
| 2026-02-09 | 13F | Fisher Asset Management, LLC | 28.540.037 | -53,53 | 204.347 | -54,67 | ||||
| 2026-02-05 | 13F | Thrivent Financial For Lutherans | 852.236 | 4,39 | 6 | 20,00 | ||||
| 2026-02-06 | 13F | EverSource Wealth Advisors, LLC | 8.135 | 19,74 | 58 | 18,37 | ||||
| 2026-02-17 | 13F | Russell Investments Group, Ltd. | 9.049.718 | 8,60 | 64.796 | 5,94 | ||||
| 2026-02-13 | 13F | Acumen Wealth Advisors, LLC | 820 | 6 | ||||||
| 2026-01-29 | 13F | Calamos Advisors LLC | 290.570 | -3,15 | 2.080 | -5,54 | ||||
| 2026-02-13 | 13F | Wealth Alliance | 71.025 | 4,49 | 509 | 2,01 | ||||
| 2026-04-24 | 13F | TT International Asset Management LTD | 9.533.122 | 8.163,80 | 79.888 | |||||
| 2026-02-17 | 13F | GeoWealth Management, LLC | 0 | -100,00 | 0 | |||||
| 2026-02-17 | 13F | Grantham, Mayo, Van Otterloo & Co. LLC | 0 | -100,00 | 0 | |||||
| 2026-02-10 | 13F | Connor, Clark & Lunn Investment Management Ltd. | 805.435 | 3,48 | 5.767 | 0,93 | ||||
| 2026-02-09 | 13F | Putnam Fl Investment Management Co | 41.919 | 5,69 | 300 | 3,09 | ||||
| 2026-02-10 | 13F | Natixis Advisors, L.p. | 2.923.705 | 2,83 | 21 | 0,00 | ||||
| 2026-02-06 | 13F | Tredje AP-fonden | 4.269.151 | -40,90 | 30.567 | -42,35 | ||||
| 2026-02-17 | 13F | Orbis Allan Gray Ltd | 81.682.615 | -1,97 | 584.848 | -4,38 | ||||
| 2026-02-17 | 13F | Two Sigma Advisers, Lp | 1.545.091 | 227,61 | 11.063 | 219,62 | ||||
| 2026-01-20 | 13F | Ascent Group, LLC | 10.363 | 74 | ||||||
| 2026-02-09 | 13F | Legal & General Group Plc | 2.575.565 | 3,00 | 18.454 | 0,47 | ||||
| 2026-02-12 | 13F | Federated Hermes, Inc. | 31.849 | 228 | ||||||
| 2026-02-10 | 13F | Eurizon Capital SGR S.p.A. | 736.872 | 5.283 | ||||||
| 2026-01-30 | 13F | Us Bancorp \de\ | 87.276 | 5,59 | 625 | 2,97 | ||||
| 2026-02-10 | 13F | Nomura Asset Management Co Ltd | 754.962 | 3,00 | 5.406 | 0,46 | ||||
| 2026-02-03 | 13F | NewEdge Wealth, LLC | 21.670 | 2,80 | 155 | -1,27 | ||||
| 2026-01-27 | 13F | WealthCollab, LLC | 1.391 | 2,96 | 10 | 0,00 | ||||
| 2025-11-14 | 13F | Virtu Financial LLC | 0 | -100,00 | 0 | |||||
| 2026-01-26 | 13F | Moran Wealth Management, LLC | 916.740 | 8,18 | 6.564 | 5,51 | ||||
| 2026-02-06 | 13F | Kimelman & Baird, LLC | 150 | 2,74 | 1 | 0,00 | ||||
| 2026-02-10 | 13F | Westwood Global Investments, LLC | 61.328.933 | -1,29 | 439.115 | -3,71 | ||||
| 2026-02-17 | 13F | Harding Loevner Lp | 1.307.297 | -19,08 | 9.360 | -21,06 | ||||
| 2026-02-11 | 13F | Capital Research Global Investors | 30.359.075 | 3,92 | 217.383 | 1,37 | ||||
| 2026-02-17 | 13F | Hilltop Holdings Inc. | 18.957 | 5,81 | 136 | 3,05 | ||||
| 2026-02-13 | 13F | Dodge & Cox | 19.120.110 | 2,67 | 136.900 | 0,16 | ||||
| 2026-04-17 | 13F | Brown, Lisle/cummings, Inc. | 273 | 2 | ||||||
| 2026-02-17 | 13F | Delaware Management Holdings, Inc. | 9.794.493 | 70.128 | ||||||
| 2026-02-17 | 13F | Balyasny Asset Management Llc | 403.756 | 362,24 | 2.891 | 350,86 | ||||
| 2026-02-12 | 13F | BlackRock, Inc. | 38.079.112 | 20,32 | 272.646 | 17,37 | ||||
| 2026-02-02 | 13F | Qrg Capital Management, Inc. | 102.205 | 36,02 | 732 | 32,67 | ||||
| 2026-02-17 | 13F/A | Northwest & Ethical Investments L.P. | 306.532 | 38,42 | 2.195 | 35,02 | ||||
| 2026-02-17 | 13F | Raymond James Financial Inc | 671.683 | -4,14 | 4.809 | -6,49 | ||||
| 2025-11-14 | 13F | Wetherby Asset Management Inc | 39.736 | 51,70 | 292 | 64,41 | ||||
| 2026-02-12 | 13F | Triumph Capital Management | 59 | 0 | ||||||
| 2026-01-23 | 13F | Assetmark, Inc | 2.407 | 31,96 | 17 | 30,77 | ||||
| 2026-01-28 | 13F | Eagle Global Advisors Llc | 460.410 | 3,00 | 3.297 | 0,49 | ||||
| 2026-04-24 | 13F | Key FInancial Inc | 1.801 | 0,00 | 15 | 25,00 | ||||
| 2026-02-06 | 13F/A | Rathbone Brothers plc | 15.862 | 3,00 | 114 | 0,00 | ||||
| 2026-02-17 | 13F | Wiley Bros.-aintree Capital, Llc | 64.054 | 7,16 | 459 | 4,57 | ||||
| 2026-02-13 | 13F | Aigen Investment Management, Lp | 0 | -100,00 | 0 | |||||
| 2026-02-06 | 13F | Alta Capital Management Llc/ | 12.971 | -7,52 | 93 | -9,80 | ||||
| 2026-04-24 | 13F | Sumitomo Mitsui DS Asset Management Company, Ltd | 13.390 | 0,00 | 112 | 17,89 | ||||
| 2026-02-09 | 13F | Knights of Columbus Asset Advisors LLC | 46.666 | 2,99 | 334 | 0,60 | ||||
| 2026-02-17 | 13F | Price T Rowe Associates Inc /md/ | 22.069.750 | -20,56 | 158 | -22,17 | ||||
| 2026-04-07 | 13F | Farther Finance Advisors, LLC | 12.326 | 85,58 | 105 | 121,28 | ||||
| 2026-02-17 | 13F | Wellington Management Group Llp | 42.818.183 | 3,68 | 306.578 | 1,14 | ||||
| 2026-02-11 | 13F | Franklin Resources Inc | 32.465.077 | 6,31 | 232.450 | 3,70 | ||||
| 2026-02-11 | 13F | LPL Financial LLC | 417.881 | 21,62 | 2.992 | 18,64 | ||||
| 2026-01-07 | 13F | Sagespring Wealth Partners, Llc | 31.162 | 9,32 | 223 | 6,70 | ||||
| 2026-02-14 | 13F | Rockefeller Capital Management L.P. | 40.578 | 498,67 | 291 | 491,84 | ||||
| 2026-02-17 | 13F | Jones Financial Companies Lllp | 146.636 | 8,33 | 1.050 | 7,04 | ||||
| 2026-01-27 | 13F | First Horizon Corp | 16.873 | 104,72 | 121 | 100,00 | ||||
| 2026-02-11 | 13F | Capital World Investors | 13.336.855 | 3,52 | 95.492 | 0,98 | ||||
| 2026-01-26 | 13F | Haven Global Partners, LLC | 765.684 | 3,47 | 5.482 | 0,94 | ||||
| 2026-02-05 | 13F | Bessemer Group Inc | 392 | -32,53 | 0 | |||||
| 2026-04-14 | 13F | Drive Wealth Management, Llc | 11.013 | 7,81 | 93 | 27,40 | ||||
| 2026-02-13 | 13F | Sei Investments Co | 581.965 | -35,78 | 4.167 | -37,36 | ||||
| 2026-02-05 | 13F | Atria Investments Llc | 117.026 | 16,42 | 838 | 13,57 | ||||
| 2026-02-17 | 13F | Samlyn Capital, Llc | 7.922.354 | -41,49 | 56.724 | -42,93 | ||||
| 2026-02-17 | 13F | Qube Research & Technologies Ltd | 561.418 | 52,63 | 4.020 | 48,91 | ||||
| 2026-02-17 | 13F | Scientech Research LLC | 34.667 | 248 | ||||||
| 2026-02-13 | 13F | Wells Fargo & Company/mn | 829.576 | 13,44 | 5.940 | 10,66 | ||||
| 2026-02-09 | 13F | Hantz Financial Services, Inc. | 109.144 | 33,01 | 1 | |||||
| 2026-02-23 | 13F | Vinland Capital Management Gestora de Recursos LTDA. | 0 | -100,00 | 0 | -100,00 | ||||
| 2026-02-23 | 13F | Vinland Capital Management Gestora de Recursos LTDA. | Call | 0 | -100,00 | 0 | -100,00 | |||
| 2026-02-23 | 13F | Vinland Capital Management Gestora de Recursos LTDA. | Put | 0 | -100,00 | 0 | -100,00 | |||
| 2026-02-13 | 13F | Van Eck Associates Corp | 17.602 | 28,60 | 0 | |||||
| 2026-02-04 | 13F | Bailard, Inc. | 180.000 | 0,00 | 1.289 | -2,50 | ||||
| 2026-04-20 | 13F | Ronald Blue Trust, Inc. | 52.882 | -0,09 | 443 | 17,20 | ||||
| 2026-02-17 | 13F | Royal Bank Of Canada | 639.786 | 23,70 | 4.580 | 20,65 | ||||
| 2026-02-17 | 13F | Ameriprise Financial Inc | 8.648.188 | -39,05 | 61.925 | -40,55 | ||||
| 2026-02-11 | 13F | Jpmorgan Chase & Co | 43.540.350 | 5,20 | 311.749 | 2,62 | ||||
| 2026-02-17 | 13F | Millennium Management Llc | 750.557 | -62,00 | 5.374 | -62,93 | ||||
| 2026-02-13 | 13F | Cloverfields Capital Group, Lp | 254.644 | 1.823 | ||||||
| 2026-01-26 | 13F | Asset Dedication, LLC | 416 | 2,97 | 3 | 0,00 | ||||
| 2026-02-10 | 13F | Bruce G. Allen Investments, LLC | 4.965 | -5,55 | 36 | -7,89 | ||||
| 2026-02-12 | 13F | Earnest Partners Llc | 857.651 | -1,90 | 6.141 | -4,32 | ||||
| 2025-10-27 | 13F | Sumitomo Mitsui Trust Holdings, Inc. | 0 | -100,00 | 0 | |||||
| 2026-04-23 | 13F | North Star Investment Management Corp. | 508 | 4 | ||||||
| 2026-02-09 | 13F | Hartland & Co., LLC | 552 | 2,99 | 4 | 0,00 | ||||
| 2026-02-12 | 13F | Provida Pension Fund Administrator | 0 | -100,00 | 0 | |||||
| 2026-02-10 | 13F/A | Northwestern Mutual Wealth Management Co | 265 | 32,50 | 2 | 0,00 | ||||
| 2025-11-04 | 13F | Tsfg, Llc | 0 | -100,00 | 0 | |||||
| 2026-04-08 | 13F | Legacy Wealth Asset Management, LLC | 101.939 | -1,43 | 854 | 15,41 | ||||
| 2026-02-17 | 13F | Guggenheim Capital Llc | 61.028 | -2,23 | 437 | -4,80 | ||||
| 2026-02-17 | 13F | Clear Street Markets Llc | 29.097 | 208 | ||||||
| 2026-02-09 | 13F | Geode Capital Management, Llc | 519.206 | 3,00 | 3.718 | 0,49 | ||||
| 2026-02-06 | 13F | HighTower Advisors, LLC | 29.924 | 6,34 | 214 | 3,88 | ||||
| 2026-03-04 | 13F | Rehmann Capital Advisory Group | 0 | -100,00 | 0 | |||||
| 2026-02-09 | 13F | Huntington National Bank | 10.895 | 11,14 | 78 | 9,86 | ||||
| 2025-11-13 | 13F | Eisler Capital Management Ltd. | Put | 550.000 | 0,00 | 3.966 | 5,96 | |||
| 2025-11-13 | 13F | Eisler Capital Management Ltd. | Call | 550.000 | 0,00 | 3.966 | 5,96 | |||
| 2026-02-17 | 13F | Cetera Investment Advisers | 32.943 | -7,23 | 236 | -9,62 | ||||
| 2026-04-21 | 13F | Robeco Institutional Asset Management B.V. | 54.692.228 | -6,64 | 458.321 | 9,27 | ||||
| 2026-02-12 | 13F | Jane Street Group, Llc | Call | 0 | -100,00 | 0 | -100,00 | |||
| 2026-02-19 | 13F | CI Private Wealth, LLC | 55.541 | 35,03 | 398 | 32,23 | ||||
| 2026-02-17 | 13F | Amundi | 3.374.178 | 5,44 | 24.159 | 5,89 | ||||
| 2026-01-30 | 13F/A | M&t Bank Corp | 74.468 | 533 | ||||||
| 2026-02-13 | 13F | Mariner, LLC | 147.128 | 8,31 | 1.054 | 5,72 | ||||
| 2026-04-14 | 13F | Nbc Securities, Inc. | 834 | 0,00 | 7 | 20,00 | ||||
| 2026-02-11 | 13F | IMA Wealth, Inc. | 238 | 2 | ||||||
| 2026-02-13 | 13F | Squarepoint Ops LLC | Call | 0 | -100,00 | 0 | -100,00 | |||
| 2026-02-09 | 13F | Annis Gardner Whiting Capital Advisors, LLC | 1.254 | 9 | ||||||
| 2026-01-28 | 13F | B. Metzler seel. Sohn & Co. AG | 807.951 | -3,74 | 5.785 | -6,10 | ||||
| 2026-02-13 | 13F | Atlas Capital Advisors Llc | 29.921 | 178,10 | 214 | 193,15 | ||||
| 2025-11-20 | 13F | First Affirmative Financial Network | 44.203 | -1,98 | 324 | 5,88 | ||||
| 2026-02-09 | 13F | Todd Asset Management Llc | 6.246.550 | 1,36 | 44.725 | -1,13 | ||||
| 2026-02-17 | 13F | Shelton Capital Management | 70.328 | 504 | ||||||
| 2026-01-29 | 13F | Matthews International Capital Management Llc | 1.149.948 | 3,53 | 8.234 | 0,99 | ||||
| 2026-02-11 | 13F | Longfellow Investment Management Co Llc | 233.497 | -36,88 | 1.672 | -38,45 | ||||
| 2026-02-12 | 13F | Hollencrest Capital Management | 166 | 2,47 | 1 | 0,00 | ||||
| 2026-02-11 | 13F | Syon Capital Llc | 10.021 | 72 | ||||||
| 2026-04-24 | 13F | Deprince Race & Zollo Inc | 1.092.846 | -5,59 | 9.158 | 10,50 | ||||
| 2026-02-11 | 13F | West Family Investments, Inc. | 17.760 | 2,99 | 127 | 0,79 | ||||
| 2026-04-15 | 13F | City Holding Co | 551 | 2,99 | 5 | 33,33 | ||||
| 2026-02-06 | 13F | Tortoise Investment Management, LLC | 0 | -100,00 | 0 | |||||
| 2026-02-12 | 13F | CIBC Private Wealth Group, LLC | 540 | -40,72 | 4 | -50,00 | ||||
| 2026-04-24 | 13F | Yousif Capital Management, Llc | 65.655 | 0,00 | 550 | 12,47 | ||||
| 2026-01-08 | 13F | Tuttle Tactical Management LLC | 36.969 | 265 | ||||||
| 2025-11-14 | 13F | D. E. Shaw & Co., Inc. | 0 | -100,00 | 0 | |||||
| 2026-02-13 | 13F | VPR Management LLC | 438.013 | 3,00 | 3.136 | 0,48 | ||||
| 2026-02-13 | 13F | Smartleaf Asset Management LLC | 4.255 | 13,35 | 31 | 11,11 | ||||
| 2026-02-09 | 13F | Employees Retirement System of Texas | 370.217 | -49,37 | 3 | -60,00 | ||||
| 2026-02-11 | 13F | Metis Global Partners, LLC | 32.774 | 1,76 | 235 | -0,85 | ||||
| 2026-02-13 | 13F | Carmignac Gestion | 7.152.585 | -36,61 | 51.213 | -38,16 | ||||
| 2026-02-13 | 13F | Bridgefront Capital, LLC | 11.681 | -40,13 | 84 | -41,96 | ||||
| 2026-02-13 | 13F | American Century Companies Inc | 7.273.623 | 16,67 | 52.079 | 13,81 | ||||
| 2026-02-17 | 13F | Ancora Advisors, LLC | 812 | 6 | ||||||
| 2026-01-30 | 13F | Keybank National Association/oh | 0 | -100,00 | 0 | |||||
| 2026-02-12 | 13F | Marex Group plc | 113.109 | 810 | ||||||
| 2026-02-02 | 13F | Horizon Investments, LLC | 0 | -100,00 | 0 | -100,00 | ||||
| 2026-04-21 | 13F | Maseco Llp | 0 | -100,00 | 0 | |||||
| 2026-02-13 | 13F | Marshall Wace, Llp | 3.307.338 | 23.681 | ||||||
| 2026-02-17 | 13F | Lazard Asset Management Llc | 5.144.005 | -9,96 | 36.831 | -12,16 | ||||
| 2026-02-06 | 13F | Handelsbanken Fonder AB | 110.248 | 3,00 | 1 | |||||
| 2026-02-10 | 13F | CIBC World Markets Inc. | 72.729 | 328,35 | 521 | 319,35 | ||||
| 2026-02-13 | 13F | First Trust Advisors Lp | 100.969 | 21,19 | 723 | 18,17 | ||||
| 2026-02-11 | 13F | O'shaughnessy Asset Management, Llc | 236.985 | 9,87 | 1.697 | 7,14 | ||||
| 2026-01-29 | 13F | Sanctuary Advisors, LLC | 167.208 | 4,98 | 1.197 | 2,40 | ||||
| 2026-02-12 | 13F | Barings Llc | 891.821 | -21,38 | 6.385 | -23,30 | ||||
| 2026-02-17 | 13F | Farringdon Capital, Ltd. | 0 | -100,00 | 0 | |||||
| 2026-04-07 | 13F | Signaturefd, Llc | 14.280 | 8,26 | 120 | 26,60 | ||||
| 2026-04-16 | 13F | BI Asset Management Fondsmaeglerselskab A/S | 701.153 | 6,41 | 6 | 25,00 | ||||
| 2026-02-13 | 13F | Mml Investors Services, Llc | 52.393 | 33,12 | 375 | 30,21 | ||||
| 2026-02-14 | 13F | Frec Markets, Inc. | 20.135 | 144 | ||||||
| 2026-02-17 | 13F | Engineers Gate Manager LP | 51.706 | 7,56 | 370 | 5,11 | ||||
| 2026-02-13 | 13F | JustInvest LLC | 84.297 | 20,40 | 604 | 17,32 | ||||
| 2026-04-20 | 13F | Jfs Wealth Advisors, Llc | 1.003 | 0,00 | 8 | 14,29 | ||||
| 2026-02-13 | 13F | Umb Bank N A/mo | 1.741 | 427,58 | 12 | 500,00 | ||||
| 2025-10-30 | 13F | Twin Peaks Wealth Advisors, LLC | 0 | -100,00 | 0 | |||||
| 2026-02-17 | 13F | Quantinno Capital Management LP | 221.432 | 53,16 | 1.585 | 49,39 | ||||
| 2026-02-11 | 13F | Winton Capital Group Ltd | 31.236 | 224 | ||||||
| 2026-01-30 | 13F | Pekin Hardy Strauss, Inc. | 51.326 | 3,05 | 367 | 0,55 | ||||
| 2026-02-03 | 13F | Ethic Inc. | 188.661 | 22,10 | 1.351 | 19,05 | ||||
| 2026-02-02 | 13F | Benjamin Edwards Inc | 27.209 | 33,74 | 195 | 30,20 | ||||
| 2026-02-04 | 13F | HighPoint Advisor Group LLC | 10.375 | 74 | ||||||
| 2026-02-18 | 13F | Mackenzie Financial Corp | 0 | -100,00 | 0 | |||||
| 2026-04-07 | 13F | Park Avenue Securities Llc | 27.955 | 19,53 | 0 | |||||
| 2025-11-14 | 13F | Jane Street Group, Llc | Put | 0 | -100,00 | 0 | -100,00 | |||
| 2026-01-30 | 13F | R Squared Ltd | 19.605 | -6,24 | 140 | -8,50 | ||||
| 2025-11-14 | 13F | Credit Agricole S A | 0 | -100,00 | 0 | -100,00 | ||||
| 2026-02-17 | 13F | Alliancebernstein L.p. | 116.892 | 837 | ||||||
| 2026-01-27 | 13F | Evergreen Capital Management Llc | 16.185 | -74,59 | 117 | -75,00 | ||||
| 2026-02-09 | 13F | Coldstream Capital Management Inc | 25.003 | -3,38 | 179 | -5,29 | ||||
| 2026-01-29 | 13F | Sava Infond d.o.o. | 148.217 | 18,20 | 1.061 | 15,33 | ||||
| 2025-11-12 | 13F | NewSquare Capital LLC | 0 | -100,00 | 0 | |||||
| 2026-02-17 | 13F | Advisory Services Network, LLC | 0 | -100,00 | 0 | |||||
| 2026-02-11 | 13F | Empowered Funds, LLC | 2.533.428 | 18.139 | ||||||
| 2025-11-12 | 13F | Fox Run Management, L.l.c. | 0 | -100,00 | 0 | |||||
| 2026-01-23 | 13F | Natural Investments, Llc | 110.305 | 5,97 | 1 | |||||
| 2026-02-03 | 13F | Crossmark Global Holdings, Inc. | 498.542 | -7,55 | 3.570 | -9,83 | ||||
| 2025-11-14 | 13F | Mount Yale Investment Advisors, LLC | 0 | -100,00 | 0 | -100,00 | ||||
| 2026-02-13 | 13F | Flow Traders U.s. Llc | 110.582 | 448,90 | 1 | |||||
| 2026-02-11 | 13F | J.Safra Asset Management Corp | 34.329 | 246 | ||||||
| 2026-02-17 | 13F | Altrinsic Global Advisors Llc | 0 | -100,00 | 0 | |||||
| 2026-02-13 | 13F | Aviso Financial Inc. | 0 | -100,00 | 0 | |||||
| 2026-02-12 | 13F | Bank Of Montreal /can/ | 33.276 | 146,87 | 238 | 142,86 | ||||
| 2026-04-21 | 13F | Financial Consulate, Inc | 645 | 1.553,85 | 5 | |||||
| 2026-04-21 | 13F | Vise Technologies, Inc. | 124.113 | 0,00 | 889 | 0,00 | ||||
| 2026-02-02 | 13F | Danske Bank A/s | 1 | 0,00 | 0 | |||||
| 2026-02-09 | 13F | William Blair Investment Management, Llc | 36.551.763 | 24,03 | 261.679 | 20,98 | ||||
| 2026-04-08 | 13F | Wealth Enhancement Advisory Services, Llc | 93.013 | -58,31 | 776 | -53,37 | ||||
| 2026-02-13 | 13F | Wexford Capital Lp | 0 | -100,00 | 0 | |||||
| 2025-11-10 | 13F | Zeno Equity Partners LLP | 0 | -100,00 | 0 | |||||
| 2026-01-29 | 13F | Teachers Retirement System Of The State Of Kentucky | 3.837.098 | 3,00 | 27 | 0,00 | ||||
| 2026-04-08 | 13F | Grove Bank & Trust | 10.238 | -0,25 | 86 | 16,44 | ||||
| 2026-02-13 | 13F | Kestra Advisory Services, LLC | 4.299 | 31 | ||||||
| 2026-02-10 | 13F | Belvedere Trading LLC | Call | 139.834 | 4.984,87 | 1.001 | 4.905,00 | |||
| 2026-01-20 | 13F | Stratos Wealth Partners, LTD. | 14.471 | -14,27 | 104 | -16,26 | ||||
| 2026-01-26 | 13F | Mirae Asset Global Investments Co., Ltd. | 309.896 | 6,52 | 2.219 | 3,89 | ||||
| 2026-02-17 | 13F | Two Sigma Investments, Lp | 8.250.080 | 61,45 | 59.071 | 57,49 | ||||
| 2026-02-10 | 13F | Savant Capital, LLC | 33.172 | 8,92 | 238 | 6,28 | ||||
| 2026-02-13 | 13F | Dnca Finance | 1.457.582 | 10.436 | ||||||
| 2026-02-17 | 13F | Aquatic Capital Management LLC | 12.533 | 90 | ||||||
| 2025-11-18 | 13F | Pictet Asset Management Holding SA | 0 | -100,00 | 0 | |||||
| 2026-02-17 | 13F | Bank Of America Corp /de/ | 4.117.786 | 1,56 | 29.483 | -0,93 | ||||
| 2026-02-27 | 13F | Groupama Asset Managment | 138.201 | 4,73 | 990 | 2,17 | ||||
| 2026-04-20 | 13F | Longview Financial Advisors, Inc. | 1.333 | 11 | ||||||
| 2026-04-06 | 13F | Highline Wealth Partners Llc | 503 | -6,68 | 4 | 33,33 | ||||
| 2026-04-22 | 13F | Bravera Wealth | 0 | -100,00 | 0 | |||||
| 2026-04-06 | 13F | GAMMA Investing LLC | 14.875 | 10,69 | 125 | 29,17 | ||||
| 2026-04-22 | 13F | Quattro Financial Advisors Llc | 339.900 | 0,00 | 2.848 | 17,06 | ||||
| 2026-04-15 | 13F | Perkins Coie Trust Co | 50 | 0,00 | 0 | |||||
| 2026-02-12 | 13F | DRW Securities, LLC | 272.706 | 199,81 | 1.953 | 190,04 | ||||
| 2026-02-17 | 13F | Aragon Global Management, LP | 350.818 | 111,72 | 2.512 | 106,50 | ||||
| 2026-02-10 | 13F | Belvedere Trading LLC | 0 | -100,00 | 0 | -100,00 | ||||
| 2026-04-17 | 13F | Bell Investment Advisors, Inc | 1.760 | 20,14 | 15 | 40,00 | ||||
| 2026-02-13 | 13F | Walleye Trading LLC | Call | 0 | -100,00 | 0 | -100,00 | |||
| 2026-02-13 | 13F | Walleye Trading LLC | 0 | -100,00 | 0 | -100,00 | ||||
| 2026-04-23 | 13F | Ewa, Llc | 14.503 | 0,69 | 122 | 17,48 | ||||
| 2026-02-12 | 13F | Insigneo Advisory Services, Llc | 35.136 | -17,51 | 252 | -19,55 | ||||
| 2026-02-13 | 13F | Cullen Capital Management, LLC | 685.872 | 2,46 | 4.911 | -0,06 | ||||
| 2026-04-17 | 13F | AdvisorNet Financial, Inc | 0 | -100,00 | 0 | |||||
| 2026-02-18 | 13F | GWM Advisors LLC | 12.088 | -1,71 | 87 | -4,44 | ||||
| 2026-02-17 | 13F | Jump Financial, LLC | 152.195 | 1.090 | ||||||
| 2026-02-13 | 13F | Glen Eagle Advisors, LLC | 397 | 7,30 | 3 | 0,00 | ||||
| 2026-04-21 | 13F | Aaron Wealth Advisors LLC | 51.877 | 71,85 | 435 | 100,93 | ||||
| 2026-02-13 | 13F | Schroder Investment Management Group | 72.822.624 | -2,29 | 524.323 | -4,02 | ||||
| 2025-11-14 | 13F | PineBridge Investments, L.P. | 784.940 | -3,36 | 5.761 | 4,48 | ||||
| 2026-02-18 | 13F | Vident Advisory, LLC | 205.355 | 12,57 | 1.470 | 9,78 | ||||
| 2025-11-14 | 13F | Prelude Capital Management, Llc | 0 | -100,00 | 0 | -100,00 | ||||
| 2026-02-10 | 13F | Daiwa Securities Group Inc. | 1.065.538 | 386,36 | 8 | 0,00 | ||||
| 2026-03-23 | 13F/A | Barclays Plc | Call | 0 | -100,00 | 0 | -100,00 | |||
| 2026-03-30 | 13F/A | Barclays Plc | Put | 0 | -100,00 | 0 | -100,00 | |||
| 2026-01-28 | 13F | CAPROCK Group, Inc. | 91.035 | 8,12 | 652 | 6,36 | ||||
| 2026-04-15 | 13F | Bayforest Capital Ltd | 0 | -100,00 | 0 | |||||
| 2026-01-30 | 13F | State of New Jersey Common Pension Fund D | 3.167.658 | 1,38 | 22.680 | -1,11 | ||||
| 2026-02-17 | 13F | Mirabella Financial Services Llp | 95.522 | 684 | ||||||
| 2025-11-14 | 13F | Walleye Trading LLC | Put | 0 | -100,00 | 0 | -100,00 | |||
| 2026-02-11 | 13F | Ameraudi Asset Management, Inc. | 0 | -100,00 | 0 | -100,00 | ||||
| 2026-01-26 | 13F | Private Trust Co Na | 228 | 40,74 | 2 | -50,00 | ||||
| 2026-02-13 | 13F | Neuberger Berman Group LLC | 27.949 | 0,87 | 200 | -1,48 | ||||
| 2026-04-24 | 13F | Pzena Investment Management Llc | 225.157 | 0,00 | 1.887 | 17,00 | ||||
| 2026-02-10 | 13F | Bank of New York Mellon Corp | 182.534 | 15,46 | 1.307 | 12,59 | ||||
| 2026-02-17 | 13F | Limestone Investment Advisors LP | 190.644 | 3,00 | 1.365 | 0,52 | ||||
| 2026-02-13 | 13F | BNP Paribas Asset Management Holding S.A. | 438.760 | 3,00 | 3 | 0,00 | ||||
| 2026-04-22 | 13F | Spire Wealth Management | 60.259 | 0,16 | 505 | 17,21 | ||||
| 2026-04-24 | 13F | USS Investment Management Ltd | 2.861.917 | 0,00 | 24.026 | 17,17 | ||||
| 2026-01-16 | 13F | Empirical Financial Services, LLC d.b.a. Empirical Wealth Management | 15.882 | 114 | ||||||
| 2026-02-13 | 13F | Colony Group, LLC | 21.029 | 11,24 | 152 | 9,42 | ||||
| 2026-02-13 | 13F | Walleye Capital LLC | Call | 0 | -100,00 | 0 | ||||
| 2026-02-17 | 13F | Tower Research Capital LLC (TRC) | 10.320 | -44,31 | 74 | -46,32 | ||||
| 2026-02-13 | 13F | Walleye Capital LLC | 0 | -100,00 | 0 | |||||
| 2026-02-13 | 13F | Toroso Investments, LLC | 31.404 | 225 | ||||||
| 2026-02-12 | 13F | New York State Common Retirement Fund | 5.209.715 | -24,15 | 37.302 | -26,01 | ||||
| 2026-02-19 | 13F | Invesco Ltd. | 631.043 | 29,75 | 4.518 | 26,59 | ||||
| 2026-02-17 | 13F/A | Intesa Sanpaolo S.p.a. | 301.000 | 2.167 | ||||||
| 2026-02-05 | 13F | Allworth Financial LP | 1.464 | -2,40 | 10 | -9,09 | ||||
| 2026-02-13 | 13F | National Bank Of Canada /fi/ | 30 | 0,00 | 0 | |||||
| 2026-02-17 | 13F | Liontrust Investment Partners LLP | 190.550 | -36,48 | 1.364 | -38,06 | ||||
| 2026-02-12 | 13F | Brown Brothers Harriman & Co | 2.938 | 21 | ||||||
| 2026-02-06 | 13F | Abn Amro Investment Solutions | 1.377.968 | 233,85 | 9.866 | 225,72 | ||||
| 2026-02-13 | 13F | Baldwin Investment Management, LLC | 74.449 | 2,99 | 533 | 0,57 | ||||
| 2026-02-17 | 13F | SageView Advisory Group, LLC | 456 | 3 | ||||||
| 2026-02-12 | 13F | Quadrant Capital Group Llc | 330.029 | 3,52 | 2.363 | 0,98 | ||||
| 2026-02-12 | 13F | Brinker Capital Investments, LLC | 103.955 | -1,12 | 744 | -3,50 | ||||
| 2026-04-15 | 13F | Merit Financial Group, LLC | 14.176 | 12,88 | 119 | 32,58 | ||||
| 2026-03-11 | 13F | Leonteq Securities AG | Put | 0 | -100,00 | 0 | ||||
| 2026-02-13 | 13F | Arrowstreet Capital, Limited Partnership | 63.525.566 | 3,92 | 454.843 | 1,37 | ||||
| 2026-02-24 | 13F | DGS Capital Management, LLC | 10.202 | -8,57 | 73 | -9,88 | ||||
| 2026-02-06 | 13F | Fairtree Asset Management (Pty) Ltd | 49.127 | 352 | ||||||
| 2026-02-12 | 13F | Advisors Asset Management, Inc. | 190.880 | 30,82 | 1.367 | 27,54 | ||||
| 2026-02-17 | 13F | Trexquant Investment LP | 1.032.196 | 7.391 | ||||||
| 2026-02-04 | 13F | Madison Asset Management, LLC | 361.149 | -1,05 | 2.586 | -3,47 | ||||
| 2026-02-13 | 13F | MAI Capital Management | 4.108 | 2,98 | 29 | 0,00 | ||||
| 2026-02-11 | 13F | Cerity Partners LLC | 69.098 | -2,15 | 495 | -4,63 | ||||
| 2026-02-12 | 13F | Principal Securities, Inc. | 0 | -100,00 | 0 | -100,00 | ||||
| 2026-01-29 | 13F | UBS Group AG | Put | 6.667 | 2,73 | 48 | 0,00 | |||
| 2026-01-29 | 13F | UBS Group AG | 6.278.582 | 52,73 | 44.955 | 48,98 | ||||
| 2026-04-13 | 13F | Gateway Investment Advisers Llc | 10.414 | 87 | ||||||
| 2026-02-09 | 13F | HBK Sorce Advisory LLC | 32.055 | 2,93 | 288 | 35,21 | ||||
| 2026-04-15 | 13F | Activest Wealth Management | 396 | 3 | ||||||
| 2026-02-17 | 13F | Graham Capital Management, L.P. | 225.955 | 300,18 | 1.618 | 290,58 | ||||
| 2026-01-09 | 13F | Seafarer Capital Partners, LLC | 10.909.142 | 3,00 | 78.109 | 0,47 | ||||
| 2026-02-17 | 13F | Man Group plc | 6.189.502 | 507,92 | 44.317 | 493,01 | ||||
| 2026-03-06 | 13F | Hsbc Holdings Plc | 4.682.389 | -48,99 | 35.557 | 0,13 | ||||
| 2026-01-30 | 13F | Mitsubishi UFJ Trust & Banking Corp | 115.549 | 5,69 | 827 | 3,12 | ||||
| 2026-02-12 | 13F | Qtron Investments LLC | 67.614 | -15,48 | 484 | -17,55 | ||||
| 2026-02-17 | 13F | Advisor Group Holdings, Inc. | 86.737 | -0,32 | 621 | -1,74 | ||||
| 2026-02-13 | 13F | Banco Santander, S.A. | 34.774 | -48,70 | 249 | -50,10 | ||||
| 2026-01-15 | 13F | Frank, Rimerman Advisors LLC | 121.738 | 3,31 | 872 | 0,81 | ||||
| 2026-02-17 | 13F | Susquehanna International Group, Llp | 146.917 | -94,33 | 1.052 | -94,47 | ||||
| 2026-01-27 | 13F | Checchi Capital Advisers, LLC | 26.012 | 4,12 | 186 | 1,64 | ||||
| 2026-02-17 | 13F | Susquehanna International Group, Llp | Put | 424.941 | 22,83 | 3.043 | 19,81 | |||
| 2026-02-13 | 13F | Thornburg Investment Management Inc | 42.993 | 1,59 | 308 | -0,97 | ||||
| 2026-02-17 | 13F | Susquehanna International Group, Llp | Call | 187.415 | -44,74 | 1.342 | -46,12 | |||
| 2026-02-11 | 13F | Brandywine Global Investment Management, LLC | 494.995 | 1,62 | 3.544 | -0,87 | ||||
| 2026-02-17 | 13F | Schonfeld Strategic Advisors LLC | 489.673 | 3.506 | ||||||
| 2026-04-15 | 13F | Financial Management Professionals, Inc. | 0 | -100,00 | 0 | |||||
| 2026-01-28 | 13F | DekaBank Deutsche Girozentrale | 505.000 | 0,00 | 3 | 0,00 | ||||
| 2026-02-17 | 13F | Bayesian Capital Management, LP | 19.128 | 137 | ||||||
| 2026-02-17 | 13F | Citadel Advisors Llc | Call | 37.935 | -33,71 | 272 | -35,48 | |||
| 2026-02-13 | 13F | Segall Bryant & Hamill, Llc | 0 | -100,00 | 0 | -100,00 | ||||
| 2026-02-17 | 13F | Citadel Advisors Llc | Put | 32.320 | 30,59 | 231 | 27,62 | |||
| 2026-04-13 | 13F | True Wealth Design, LLC | 226 | 86,78 | 2 | |||||
| 2026-02-17 | 13F | Citadel Advisors Llc | 1.937.647 | 13.874 | ||||||
| 2026-04-24 | 13F | Root Financial Partners, LLC | 169 | 49,56 | 1 | |||||
| 2026-02-17 | 13F | Oaktree Capital Management Lp | 13.822.747 | 9,13 | 98.971 | 6,46 | ||||
| 2026-02-06 | 13F | Gsa Capital Partners Llp | 102.987 | 1 | ||||||
| 2026-02-13 | 13F | Citigroup Inc | 394.037 | 18,82 | 2.821 | 15,90 | ||||
| 2026-02-10 | 13F | Sivia Capital Partners, LLC | 10.190 | 73 | ||||||
| 2025-11-06 | 13F | Whipplewood Advisors, LLC | 0 | -100,00 | 0 | |||||
| 2026-02-04 | 13F | Community Bank, N.A. | 7.950 | 2,99 | 57 | 0,00 | ||||
| 2026-02-13 | 13F | Solstein Capital, LLC | 122.591 | 3,00 | 878 | 0,46 | ||||
| 2026-04-21 | 13F | PDS Planning, Inc | 25.299 | -0,48 | 212 | 16,48 | ||||
| 2026-02-05 | 13F | WIM INVESTMENT MANAGEMENT Ltd | 1.737.000 | 81,22 | 12.437 | 76,77 | ||||
| 2026-01-22 | 13F | Massachusetts Financial Services Co /ma/ | 101.084 | 245,95 | 724 | 237,85 | ||||
| 2026-01-23 | 13F | Transcend Wealth Collective, Llc | 23.193 | 47,41 | 166 | 44,35 | ||||
| 2026-02-06 | 13F | Profund Advisors Llc | 272.590 | 13,84 | 1.952 | 11,04 | ||||
| 2026-02-17 | 13F | Cresset Asset Management, LLC | 22.815 | 3,00 | 163 | 0,62 | ||||
| 2026-01-26 | 13F | Cwm, Llc | 8.760 | 7,27 | 0 | |||||
| 2026-04-24 | 13F | UMA Financial Services, Inc. | 70 | 0,00 | 1 | |||||
| 2026-02-02 | 13F | Fifth Third Bancorp | 88.243 | 6,97 | 632 | 4,30 | ||||
| 2026-02-17 | 13F | Breakout Capital Partners, LP | 3.297.361 | 3,74 | 23.609 | 1,19 | ||||
| 2026-01-21 | 13F | Northcape Capital Pty Ltd | 12.904.308 | 31,71 | 96.137 | 33,68 | ||||
| 2025-11-10 | 13F | Westerkirk Capital Inc. | 0 | -100,00 | 0 | |||||
| 2026-04-03 | 13F | Investors Research Corp | 0 | -100,00 | 0 | |||||
| 2026-02-13 | 13F | Pinnacle Wealth Planning Services, Inc. | 7.680 | 55 | ||||||
| 2026-02-10 | 13F | Bnp Paribas Arbitrage, Sa | 298.510 | -33,37 | 2.137 | -35,01 | ||||
| 2026-04-20 | 13F | LVW Advisors, LLC | 11.605 | 97 | ||||||
| 2026-01-23 | 13F | Baillie Gifford & Co | 9.654.305 | -2,32 | 69.125 | -4,72 | ||||
| 2026-01-29 | 13F | Vanguard Group Inc | 24.158.135 | 2,74 | 172.972 | 0,22 | ||||
| 2026-04-21 | 13F | Sunpointe, LLC | 11.054 | 93 | ||||||
| 2026-02-06 | 13F | Global Retirement Partners, LLC | 72.748 | 1.717,34 | 521 | 1.693,10 | ||||
| 2026-02-17 | 13F | Voloridge Investment Management, Llc | 11.630.902 | -7,68 | 83.277 | -9,94 | ||||
| 2026-02-13 | 13F | State Street Corp | 13.574.747 | -8,53 | 97.242 | -10,79 | ||||
| 2026-02-11 | 13F | Ramirez Asset Management, Inc. | 2.223.601 | 15.921 | ||||||
| 2026-04-16 | 13F | SG Americas Securities, LLC | 101.879 | 187,83 | 1 | |||||
| 2026-02-13 | 13F | SPX Equities Gestao de Recursos Ltda | 22.194 | -98,67 | 159 | -98,71 | ||||
| 2025-11-06 | 13F | Midwest Trust Co | 0 | -100,00 | 0 | |||||
| 2026-02-04 | 13F | Mirabaud Asset Management Ltd | 172.365 | 1.041 | ||||||
| 2026-02-13 | 13F | Squarepoint Ops LLC | Put | 500.000 | 0,00 | 3.580 | -2,45 | |||
| 2026-02-17 | 13F | London & Capital Asset Management Ltd | 84.975 | 3,00 | 609 | 0,50 | ||||
| 2026-02-13 | 13F | Squarepoint Ops LLC | 109.117 | 740,53 | 781 | 722,11 | ||||
| 2026-04-24 | 13F | Deltec Asset Management Llc | 159.333 | 15,75 | 1.335 | 35,53 | ||||
| 2026-02-03 | 13F | We Are One Seven, LLC | 64.213 | 8,98 | 460 | 6,25 | ||||
| 2025-11-14 | 13F | Sompo Japan Nipponkoa Asset Management Co.,ltd. | 0 | -100,00 | 0 | -100,00 | ||||
| 2026-02-17 | 13F | Public Employees Retirement System Of Ohio | 6.282.954 | -13,95 | 44.986 | -16,06 | ||||
| 2026-02-11 | 13F | Simplex Trading, Llc | 114.048 | 817 | ||||||
| 2026-02-13 | 13F | Ieq Capital, Llc | 101.861 | 74,47 | 729 | 70,33 | ||||
| 2026-02-05 | 13F | May Hill Capital, LLC | 34.662 | 248 | ||||||
| 2026-02-11 | 13F | Simplex Trading, Llc | Call | 8.600 | -95,17 | 62 | 6.000,00 | |||
| 2026-02-05 | 13F | Stephens Inc /ar/ | 39.012 | 5,76 | 279 | 3,33 | ||||
| 2026-02-11 | 13F | Simplex Trading, Llc | Put | 89.200 | 32,34 | 639 | ||||
| 2026-02-13 | 13F | GQG Partners LLC | 96.959.405 | 6,29 | 694.229 | 3,68 | ||||
| 2026-01-13 | 13F | Kathmere Capital Management, LLC | 26.776 | 2,58 | 192 | 0,00 | ||||
| 2026-01-30 | 13F | Turning Point Benefit Group, Inc. | 80 | 2,56 | 1 | |||||
| 2026-02-17 | 13F | Northern Trust Corp | 5.605.769 | 4,18 | 40.137 | 1,63 | ||||
| 2026-02-12 | 13F | Campbell & CO Investment Adviser LLC | 240.406 | 99,59 | 1.721 | 94,68 | ||||
| 2025-11-07 | 13F | Sierra Ocean, Llc | 0 | -100,00 | 0 | |||||
| 2026-01-27 | 13F | Meritage Portfolio Management | 330.447 | 2,13 | 2.366 | -0,38 | ||||
| 2026-02-17 | 13F | Laird Norton Trust Company, Llc | 77.579 | 556 | ||||||
| 2026-01-21 | 13F/A | Euro Pacific Asset Management, LLC | 189.827 | 5,88 | 1 | 0,00 | ||||
| 2026-04-15 | 13F | FNY Investment Advisers, LLC | 0 | -100,00 | 0 | |||||
| 2026-02-17 | 13F | Viking Global Investors Lp | 28.396.545 | 203.319 | ||||||
| 2025-10-30 | 13F | Migdal Insurance & Financial Holdings Ltd. | 0 | -100,00 | 0 | |||||
| 2026-02-13 | 13F | Macquarie Group Ltd | 0 | -100,00 | 0 | |||||
| 2026-01-15 | 13F | Allspring Global Investments Holdings, LLC | 36.008 | 37,11 | 260 | 38,30 | ||||
| 2025-11-14 | 13F | Two Sigma Securities, Llc | 0 | -100,00 | 0 | |||||
| 2026-02-13 | 13F | Victory Capital Management Inc | 308.738 | -7,93 | 2.211 | -10,20 | ||||
| 2026-01-27 | 13F | Zurcher Kantonalbank (Zurich Cantonalbank) | 118.492 | 3,00 | 848 | 0,47 | ||||
| 2026-04-22 | 13F | Union Bancaire Privee, UBP SA | 22.660 | 0,00 | 178 | 9,20 | ||||
| 2026-02-10 | 13F | Goldman Sachs Group Inc | 9.190.079 | 8,73 | 65.801 | 6,07 | ||||
| 2026-02-17 | 13F | Driehaus Capital Management Llc | 11.857.114 | 11,96 | 84.897 | 9,21 | ||||
| 2026-02-17 | 13F | Mercer Global Advisors Inc /adv | 17.607 | 19,87 | 126 | 17,76 | ||||
| 2026-03-03 | 13F/A | Caitong International Asset Management Co., Ltd | 42.738 | 376,67 | 306 | 370,77 | ||||
| 2026-02-17 | 13F | Fmr Llc | 55.450.680 | -12,26 | 397.027 | -14,41 | ||||
| 2026-04-17 | 13F | CENTRAL TRUST Co | 150 | 0,00 | 1 | 0,00 | ||||
| 2026-02-17 | 13F | Aqr Capital Management Llc | 101.449 | 30,38 | 726 | 27,15 | ||||
| 2026-02-05 | 13F | LGT Group Foundation | 20.391 | 147 | ||||||
| 2026-04-13 | 13F | CGC Financial Services, LLC | 0 | -100,00 | 0 | |||||
| 2026-02-12 | 13F | Renaissance Technologies Llc | 8.606.381 | -39,45 | 61.622 | -40,94 | ||||
| 2026-04-17 | 13F | Athena Wealth Management, LLC | 13.529 | -15,83 | 113 | -1,74 | ||||
| 2026-01-16 | 13F | Standard Life Aberdeen plc | 138.383 | 12,29 | 991 | 9,63 | ||||
| 2026-02-20 | 13F/A | Capital Markets Trading UK LLP | Put | 37.900 | 0 | |||||
| 2026-02-20 | 13F/A | Capital Markets Trading UK LLP | Call | 100 | 0 | |||||
| 2026-02-10 | 13F | Fielder Capital Group LLC | 19.380 | 3,00 | 139 | 0,00 | ||||
| 2026-02-13 | 13F | Centiva Capital, LP | 0 | -100,00 | 0 | |||||
| 2026-02-13 | 13F | Boston Partners | 13.576.614 | 9,37 | 97.209 | 6,69 | ||||
| 2025-11-14 | 13F | Eqis Capital Management, Inc. | 0 | -100,00 | 0 | |||||
| 2026-02-12 | 13F/A | Pinebridge Investments Llc | 793.913 | 5.684 | ||||||
| 2026-04-21 | 13F | PharVision Advisers, LLC | 0 | -100,00 | 0 | |||||
| 2026-02-12 | 13F | Jane Street Group, Llc | 2.450.454 | 3.165,97 | 17.545 | 3.090,00 | ||||
| 2026-04-06 | 13F | Versant Capital Management, Inc | 111 | 1 | ||||||
| 2026-02-17 | 13F | United Capital Financial Advisers, Llc | 22.643 | 7,45 | 162 | 5,19 | ||||
| 2026-02-12 | 13F | Xponance, Inc. | 16.193 | -11,78 | 116 | -14,18 | ||||
| 2026-02-17 | 13F | Point72 Asset Management, L.P. | 978.424 | 7.006 | ||||||
| 2026-02-17 | 13F | Silvercrest Asset Management Group Llc | 2.215.307 | 5,73 | 15.862 | 3,13 | ||||
| 2026-02-12 | 13F | JPL Wealth Management, LLC | 0 | -100,00 | 0 | |||||
| 2026-02-17 | 13F | Tudor Investment Corp Et Al | 19.597 | 140 | ||||||
| 2026-02-10 | 13F | Acadian Asset Management Llc | 106.492 | 309,79 | 1 | |||||
| 2026-02-13 | 13F | Barclays Plc | 524.552 | 659,78 | 3.756 | 642,09 | ||||
| 2026-02-13 | 13F | Y-Intercept (Hong Kong) Ltd | 1.942.258 | 13.907 | ||||||
| 2026-01-15 | 13F | Boston Common Asset Management, LLC | 2.461.883 | 62,36 | 17.627 | 58,39 | ||||
| 2026-02-17 | 13F | Optiver Holding B.V. | Call | 910.842 | -57,19 | 6.522 | -58,24 | |||
| 2026-04-13 | 13F | Mather Group, Llc. | 3.358 | 28 | ||||||
| 2026-02-17 | 13F | Optiver Holding B.V. | 359.944 | 2.577 | ||||||
| 2026-04-15 | 13F | Generali Investments CEE, investicni spolecnost, a.s. | 186.841 | 0,00 | 1.566 | 17,05 | ||||
| 2026-02-13 | 13F | Vontobel Holding Ltd. | 33.474 | 50,79 | 240 | 47,53 | ||||
| 2026-02-13 | 13F | Gemsstock Ltd. | 2.276.813 | -2,22 | 16.302 | -4,62 | ||||
| 2026-02-13 | 13F | Verition Fund Management LLC | 199.716 | 1.430 | ||||||
| 2026-02-13 | 13F | Integrated Wealth Concepts LLC | 53.299 | 14,27 | 382 | 11,40 | ||||
| 2026-02-13 | 13F | Gmt Capital Corp | 1.174.334 | -49,48 | 8.408 | -50,72 | ||||
| 2026-02-13 | 13F | Ubs Oconnor Llc | 0 | -100,00 | 0 | |||||
| 2026-02-17 | 13F | Optiver Holding B.V. | Put | 977.971 | -19,36 | 7.002 | -21,33 | |||
| 2026-01-08 | 13F | Nordea Investment Management Ab | 51.580 | -9,10 | 370 | -10,87 | ||||
| 2026-02-10 | 13F | Bnp Paribas Arbitrage, Sa | Call | 0 | -100,00 | 0 | -100,00 | |||
| 2026-02-12 | 13F | Rossby Financial, LCC | 4 | 0,00 | 0 | |||||
| 2026-02-17 | 13F | Creative Planning | 245.388 | 13,30 | 1.757 | 10,51 |