Grundlæggende statistik
| Institutionelle aktier (lange) | 115.504.394 - 67,45% (ex 13D/G) - change of -6,83MM shares -5,58% MRQ |
| Institutionel værdi (lang) | $ 18.637.461 USD ($1000) |
Institutionelt ejerskab og aktionærer
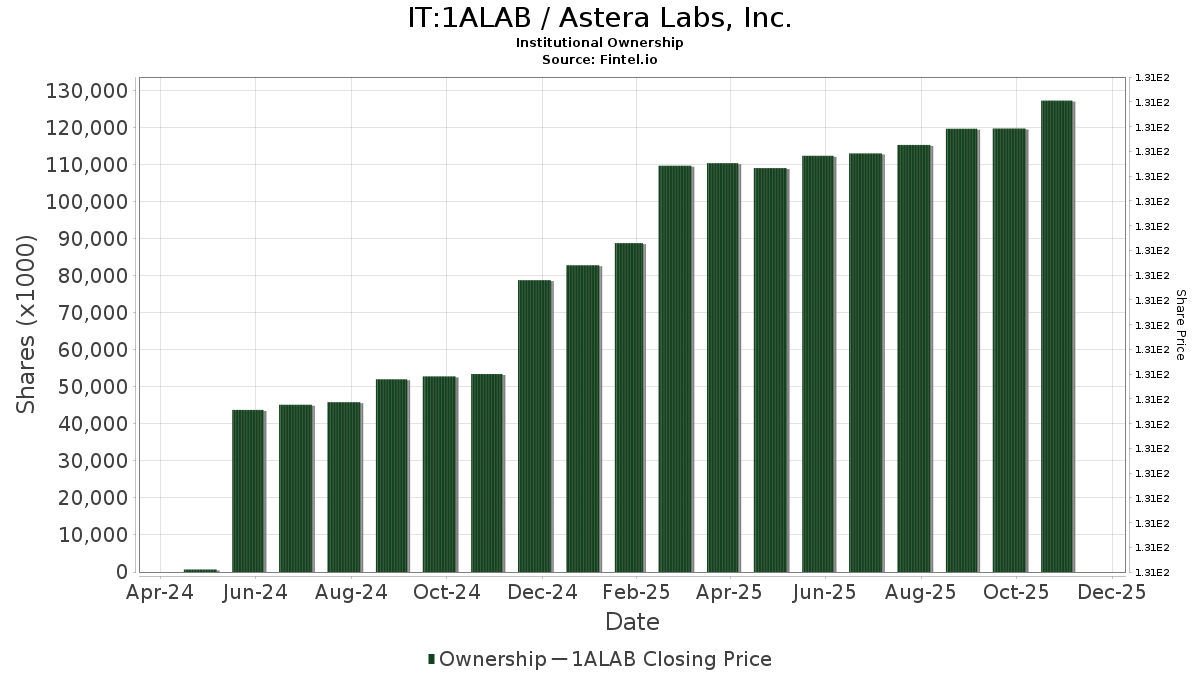
Astera Labs, Inc. (IT:1ALAB) har 712 institutionelle ejere og aktionærer, der har indsendt 13D/G- eller 13F-formularer til Securities Exchange Commission (SEC). Disse institutioner har i alt 115,504,394 aktier. Største aktionærer omfatter Fmr Llc, Vanguard Group Inc, BlackRock, Inc., Susquehanna International Group, Llp, State Street Corp, Susquehanna International Group, Llp, D. E. Shaw & Co., Inc., Geode Capital Management, Llc, Jane Street Group, Llc, and Alliancebernstein L.p. .
Astera Labs, Inc. (BIT:1ALAB) institutionel ejerskabsstruktur viser aktuelle positioner i virksomheden efter institutioner og fonde, samt seneste ændringer i positionsstørrelse. Større aktionærer kan omfatte individuelle investorer, investeringsforeninger, hedgefonde eller institutioner. Skema 13D angiver, at investoren besidder (eller besidder) mere end 5 % af virksomheden og har til hensigt (eller har til hensigt at) aktivt at forfølge en ændring i forretningsstrategi. Skema 13G indikerer en passiv investering på over 5%.
The share price as of April 24, 2026 is 172,00 / share. Previously, on November 24, 2025, the share price was 128,00 / share. This represents an increase of 34,38% over that period.
Fondens stemningsscore
Fund Sentiment Score (fka Ownership Accumulation Score) finder de aktier, der bliver mest købt af fonde. Det er resultatet af en sofistikeret, multi-faktor kvantitativ model, der identificerer virksomheder med de højeste niveauer af institutionel akkumulering. Scoringsmodellen bruger en kombination af den samlede stigning i oplyste ejere, ændringerne i porteføljeallokeringer i disse ejere og andre målinger. Tallet går fra 0 til 100, hvor højere tal indikerer et højere niveau af akkumulering for sine jævnaldrende, og 50 er gennemsnittet.
Opdateringsfrekvens: Dagligt
Se Ownership Explorer, som giver en liste over højest rangerende virksomheder.
AI+ Ask Fintel’s AI assistant about Astera Labs, Inc..
Select a question to share a public post with an AI-crafted answer.
Thinking of good questions…
13F og NPORT arkivering
Detaljer om 13F-arkivering er gratis. Detaljer om NP-ansøgninger kræver et premium-medlemskab. Grønne rækker angiver nye positioner. Røde rækker angiver lukkede positioner. Klik på linket ikon for at se den fulde transaktionshistorik.
Opgrader
for at låse premium-data op og eksportere til Excel ![]() .
.
| Fil dato | Kilde | Investor | Type | Gennemsnitlig pris (Øst) |
Aktier | Δ Aktier (%) |
Rapporteret Værdi ($1000) |
Δ Værdi (%) |
Port Alloc (%) |
|
|---|---|---|---|---|---|---|---|---|---|---|
| 2026-04-17 | 13F | Forefront Wealth Partners, LLC | 6.086 | 23,32 | 667 | -18,66 | ||||
| 2025-11-14 | 13F | Discovery Capital Management, Llc / Ct | 0 | -100,00 | 0 | |||||
| 2026-01-21 | 13F | Flagship Harbor Advisors, Llc | 14.820 | 2.465 | ||||||
| 2026-02-12 | 13F | JPL Wealth Management, LLC | 0 | -100,00 | 0 | |||||
| 2026-02-23 | 13F | Mv Capital Management, Inc. | 11 | 0,00 | 2 | |||||
| 2026-01-16 | 13F | Genesis Financial Group, LLC | 10.900 | 1.813 | ||||||
| 2026-02-17 | 13F | Capital Fund Management S.a. | Put | 129.700 | -16,86 | 21.577 | -29,36 | |||
| 2026-04-24 | 13F | Patten Group, Inc. | 3.384 | 371 | ||||||
| 2026-02-17 | 13F | Capital Fund Management S.a. | Call | 135.400 | -9,25 | 22.525 | -22,89 | |||
| 2026-04-21 | 13F | Trilogy Capital Inc. | 6.600 | 23,34 | 723 | -18,76 | ||||
| 2026-02-12 | 13F | UniSuper Management Pty Ltd | 2.700 | 449 | ||||||
| 2026-02-17 | 13F | Yiheng Capital Management, L.P. | Put | 1.427.500 | 0,00 | 237.479 | -15,04 | |||
| 2026-02-06 | 13F | Resona Asset Management Co.,Ltd. | 38.728 | 6.463 | ||||||
| 2026-02-09 | 13F | Coldstream Capital Management Inc | 0 | -100,00 | 0 | |||||
| 2026-02-13 | 13F | Analog Century Management LP | 309.013 | 51.407 | ||||||
| 2026-02-19 | 13F | CI Private Wealth, LLC | 88.660 | 1.335,79 | 995 | -17,78 | ||||
| 2026-04-24 | 13F | Profund Advisors Llc | 5.826 | -16,51 | 639 | -45,00 | ||||
| 2026-02-13 | 13F | Ausdal Financial Partners, Inc. | 1.969 | -37,65 | 328 | -47,09 | ||||
| 2026-02-17 | 13F | Credit Agricole S A | 72.869 | 12.122 | ||||||
| 2026-01-29 | 13F | Sanctuary Advisors, LLC | 13.156 | -1,50 | 2.189 | -16,33 | ||||
| 2026-02-12 | 13F | Quadrant Capital Group Llc | 150 | 3,45 | 25 | -14,29 | ||||
| 2026-02-13 | 13F | Pathstone Holdings, LLC | 10.166 | -3,90 | 1.691 | -18,35 | ||||
| 2026-02-17 | 13F | Fred Alger Management, Llc | 1.934.688 | 25,51 | 321.855 | 6,64 | ||||
| 2026-02-05 | 13F | Thrivent Financial For Lutherans | 0 | -100,00 | 0 | |||||
| 2026-02-17 | 13F | State Of Wisconsin Investment Board | 75.778 | -14,86 | 12.606 | -27,66 | ||||
| 2025-11-10 | 13F | Greenland Capital Management LP | 0 | -100,00 | 0 | -100,00 | ||||
| 2026-02-13 | 13F | American Century Companies Inc | 231.076 | -17,56 | 38.442 | -29,96 | ||||
| 2026-02-17 | 13F | Jones Financial Companies Lllp | 8.976 | 143,12 | 1.493 | 104,52 | ||||
| 2026-02-17 | 13F | Trexquant Investment LP | 0 | -100,00 | 0 | |||||
| 2026-02-12 | 13F | Scotia Capital Inc. | 0 | -100,00 | 0 | |||||
| 2026-02-17 | 13F | Cresset Asset Management, LLC | 2.253 | -74,69 | 375 | -78,54 | ||||
| 2026-01-29 | 13F | Renaissance Capital LLC | 69.170 | -14,74 | 11.507 | -27,56 | ||||
| 2026-02-17 | 13F | Sender Co & Partners, Inc. | 0 | -100,00 | 0 | |||||
| 2026-02-17 | 13F | Two Sigma Advisers, Lp | 376.598 | -65,63 | 62.651 | -70,79 | ||||
| 2026-02-17 | 13F | Vinva Investment Management Ltd | 11.120 | 1.900 | ||||||
| 2026-02-12 | 13F | Xponance, Inc. | 26.694 | 45,46 | 4.441 | 23,57 | ||||
| 2026-04-24 | 13F | IFM Investors Pty Ltd | 26.195 | 5,94 | 2.871 | 71.650,00 | ||||
| 2026-02-05 | 13F | Atria Investments Llc | 2.921 | 27,11 | 486 | 8,02 | ||||
| 2026-02-13 | 13F | Schroder Investment Management Group | 3.181 | 543 | ||||||
| 2026-02-09 | 13F | Summitry Llc | 0 | -100,00 | 0 | |||||
| 2026-04-14 | 13F | Nova Wealth Management, Inc. | 59 | 6 | ||||||
| 2026-02-10 | 13F | Mitsubishi UFJ Morgan Stanley Securities Co., Ltd. | 3.000 | 499 | ||||||
| 2026-02-17 | 13F | Point72 Asset Management, L.P. | Put | 148.400 | 3.519,51 | 24.688 | 2.978,18 | |||
| 2026-02-17 | 13F | Point72 Asset Management, L.P. | Call | 119.000 | 510,26 | 19.797 | 418,49 | |||
| 2026-03-09 | 13F | EMC Capital Management | 250 | -75,00 | 0 | |||||
| 2026-04-16 | 13F | BI Asset Management Fondsmaeglerselskab A/S | 9.720 | 1 | ||||||
| 2026-04-07 | 13F | CoreCap Advisors, LLC | 23 | -98,28 | 3 | -99,10 | ||||
| 2026-02-11 | 13F | Zions Bancorporation, National Association /ut/ | 77 | 13 | ||||||
| 2026-02-13 | 13F | Greenline Wealth Management LLC | 1.062 | 177 | ||||||
| 2026-02-10 | 13F | Fideuram Asset Management (Ireland) dac | 6.703 | 990 | ||||||
| 2025-11-14 | 13F | Interval Partners, LP | 0 | -100,00 | 0 | -100,00 | ||||
| 2026-04-23 | 13F | Oppenheimer & Co Inc | 2.866 | 314 | ||||||
| 2026-04-23 | 13F | Oppenheimer Asset Management Inc. | 12.072 | 33,29 | 1.323 | -12,15 | ||||
| 2026-02-13 | 13F | Soros Fund Management Llc | 3.359 | 559 | ||||||
| 2026-02-13 | 13F | Southeast Asset Advisors Inc. | 0 | -100,00 | 0 | |||||
| 2026-01-23 | 13F | Legacy Bridge, LLC | 1.030 | 0,00 | 171 | -14,93 | ||||
| 2025-11-13 | 13F | Winton Capital Group Ltd | 0 | -100,00 | 0 | -100,00 | ||||
| 2026-02-11 | 13F | Meeder Advisory Services, Inc. | 1.984 | 330 | ||||||
| 2025-11-07 | 13F | TimesSquare Capital Management, LLC | 0 | -100,00 | 0 | |||||
| 2026-02-17 | 13F | Janus Henderson Group Plc | 11.410 | -91,16 | 1.899 | -92,49 | ||||
| 2026-01-27 | 13F | First Horizon Corp | 1.435 | 0,63 | 239 | -14,70 | ||||
| 2026-02-17 | 13F | Sora Investors Llc | 83.562 | 13.901 | ||||||
| 2026-04-21 | 13F | Venturi Wealth Management, LLC | 6.738 | 105,18 | 738 | 35,16 | ||||
| 2026-03-04 | 13F | SHP Wealth Management | 15 | 2 | ||||||
| 2026-01-20 | 13F | Nvwm, Llc | 23 | 0,00 | 4 | -25,00 | ||||
| 2026-02-13 | 13F | Ostrum Asset Management | 1.365 | 227 | ||||||
| 2026-02-13 | 13F | Goldstream Capital Management Ltd | 0 | -100,00 | 0 | |||||
| 2026-01-30 | 13F | State of New Jersey Common Pension Fund D | 46.014 | -1,08 | 7.655 | -15,95 | ||||
| 2026-02-11 | 13F | Krane Funds Advisors LLC | 6.050 | -2,17 | 1.006 | 4,36 | ||||
| 2026-02-13 | 13F | Nicholas Investment Partners, LP | 45.251 | -16,47 | 7.528 | -29,03 | ||||
| 2026-02-26 | 13F/A | Sculptor Capital LP | Put | 0 | -100,00 | 0 | ||||
| 2026-04-14 | 13F | Focus Financial Network, Inc. | 0 | -100,00 | 0 | |||||
| 2025-11-14 | 13F | Mount Yale Investment Advisors, LLC | 0 | -100,00 | 0 | -100,00 | ||||
| 2026-02-04 | 13F | HighPoint Advisor Group LLC | 0 | -100,00 | 0 | |||||
| 2026-04-16 | 13F | Toth Financial Advisory Corp | 9 | -50,00 | 1 | -100,00 | ||||
| 2026-02-12 | 13F | ROSS\JOHNSON & Associates LLC | 1 | 0 | ||||||
| 2026-01-27 | 13F | Belpointe Asset Management LLC | 18.156 | 70,98 | 3.020 | 45,26 | ||||
| 2025-11-14 | 13F | Wolverine Trading, Llc | 30.094 | -60,98 | 5.983 | -14,79 | ||||
| 2025-11-14 | 13F | Wolverine Trading, Llc | Call | 527.800 | 39,26 | 104.927 | 204,17 | |||
| 2025-11-14 | 13F | Wolverine Trading, Llc | Put | 312.900 | 38,02 | 62.205 | 201,46 | |||
| 2026-02-10 | 13F | Envestnet Asset Management Inc | 67.707 | 2,36 | 11.264 | -13,03 | ||||
| 2026-02-13 | 13F | Dai-Ichi Life Insurance Company, Ltd | 4.895 | 814 | ||||||
| 2026-01-29 | 13F | Virtus Wealth Solutions LLC | 0 | -100,00 | 0 | |||||
| 2026-02-11 | 13F | Group One Trading, L.p. | 30.393 | 5.056 | ||||||
| 2026-02-05 | 13F | Bank Julius Baer & Co. Ltd, Zurich | 2.152 | 22,62 | 358 | 4,08 | ||||
| 2025-11-14 | 13F | ExodusPoint Capital Management, LP | 0 | -100,00 | 0 | -100,00 | ||||
| 2026-01-27 | 13F | Cannon Global Investment Management, LLC | 0 | -100,00 | 0 | |||||
| 2026-01-29 | 13F | Kestra Private Wealth Services, Llc | 0 | -100,00 | 0 | |||||
| 2026-01-26 | 13F | Mirae Asset Global Investments Co., Ltd. | 225.199 | 14,57 | 37.464 | -2,66 | ||||
| 2026-02-06 | 13F | Tensor Edge Capital, LLC | 66.000 | 10.980 | ||||||
| 2026-02-02 | 13F | Danske Bank A/s | 52.500 | 1.439,59 | 8.734 | 1.209,30 | ||||
| 2026-02-11 | 13F | Metis Global Partners, LLC | 1.363 | 227 | ||||||
| 2026-02-13 | 13F | AlTi Global, Inc. | 7.780 | 0,00 | 1.294 | -15,04 | ||||
| 2026-02-04 | 13F | Independent Advisor Alliance | 0 | -100,00 | 0 | |||||
| 2026-02-09 | 13F | Revere Asset Management, Inc | 3.542 | 589 | ||||||
| 2026-02-13 | 13F | Morgan Stanley | 1.934.467 | 33,00 | 321.818 | 13,00 | ||||
| 2026-02-17 | 13F | Alliancebernstein L.p. | 2.177.795 | -25,38 | 362.298 | -36,60 | ||||
| 2026-02-13 | 13F | Bridgewater Associates, LP | 240.530 | 1.276,19 | 40.015 | 1.069,32 | ||||
| 2026-02-17 | 13F | Bridgeway Capital Management Inc | 15.300 | -0,65 | 2.545 | -15,59 | ||||
| 2026-04-07 | 13F | Comprehensive Financial Planning, Inc./PA | 1.186 | -29,78 | 130 | -53,93 | ||||
| 2026-01-27 | 13F | Friedenthal Financial | 0 | -100,00 | 0 | |||||
| 2026-02-17 | 13F | Holocene Advisors, LP | 0 | -100,00 | 0 | |||||
| 2026-02-17 | 13F | Magnetar Financial LLC | 9.053 | -68,24 | 1.506 | -73,02 | ||||
| 2026-04-21 | 13F | Pinnacle Associates Ltd | 0 | -100,00 | 0 | |||||
| 2026-02-10 | 13F | Ellevest, Inc. | 3.302 | -29,94 | 549 | -40,46 | ||||
| 2026-01-21 | 13F | Oak Thistle LLC | 0 | -100,00 | 0 | -100,00 | ||||
| 2026-04-23 | 13F | Marquette Asset Management, LLC | 14 | 0,00 | 2 | -50,00 | ||||
| 2026-02-11 | 13F | Fjarde Ap-fonden /fourth Swedish National Pension Fund | 30.600 | 5.091 | ||||||
| 2026-04-16 | 13F | Beese Fulmer Investment Management, Inc. | 3.767 | 413 | ||||||
| 2026-02-10 | 13F | Lido Advisors, LLC | 12.297 | 0,47 | 2.404 | 0,29 | ||||
| 2026-02-04 | 13F | Nwam Llc | 3.013 | 68,32 | 492 | 75,99 | ||||
| 2025-11-14 | 13F | Fortress Investment Group LLC | 0 | -100,00 | 0 | -100,00 | ||||
| 2026-02-03 | 13F | Geneva Partners, LLC | 0 | -100,00 | 0 | |||||
| 2025-11-10 | 13F | Colonial Trust Co / SC | 0 | -100,00 | 0 | -100,00 | ||||
| 2026-02-13 | 13F | Williams Jones Wealth Management, LLC. | 1.300 | 216 | ||||||
| 2026-02-10 | 13F | Quantbot Technologies LP | 0 | -100,00 | 0 | -100,00 | ||||
| 2026-02-18 | 13F | Caitlin John, LLC | 10 | 0,00 | 2 | 0,00 | ||||
| 2026-04-24 | 13F | Root Financial Partners, LLC | 34 | -10,53 | 4 | -50,00 | ||||
| 2026-02-13 | 13F | Walleye Capital LLC | 51.432 | -49,18 | 8.556 | -56,82 | ||||
| 2026-02-13 | 13F | Walleye Capital LLC | Call | 23.200 | -53,69 | 3.860 | -60,66 | |||
| 2026-01-08 | 13F | GSG Advisors LLC | 8.332 | -0,62 | 1.386 | -14,97 | ||||
| 2026-02-13 | 13F | SRS Capital Advisors, Inc. | 249 | -38,82 | 41 | -48,10 | ||||
| 2026-02-17 | 13F | Alphadyne Asset Management, LLC | 0 | -100,00 | 0 | |||||
| 2026-02-12 | 13F | Penserra Capital Management LLC | 289.804 | 551,63 | 48 | 500,00 | ||||
| 2026-02-11 | 13F | Havemeyer Place LP | 8.332 | 1.386 | ||||||
| 2026-02-13 | 13F | Walleye Capital LLC | Put | 67.800 | -5,04 | 11.279 | -19,32 | |||
| 2026-02-13 | 13F | Kayne Anderson Rudnick Investment Management Llc | 3 | 0,00 | 0 | |||||
| 2026-01-22 | 13F | Massachusetts Financial Services Co /ma/ | 0 | -100,00 | 0 | |||||
| 2026-03-02 | 13F | Bank Of Hawaii | 28.580 | 12,70 | 4.755 | -4,25 | ||||
| 2026-01-30 | 13F | Strategic Blueprint, LLC | 8.115 | 3,20 | 1.350 | -12,28 | ||||
| 2026-02-13 | 13F | Rafferty Asset Management, LLC | 1.166.716 | 8,99 | 194.095 | -7,40 | ||||
| 2026-02-06 | 13F | Pnc Financial Services Group, Inc. | 10.074 | 10,32 | 1.676 | -6,32 | ||||
| 2026-02-12 | 13F | Renaissance Technologies Llc | 406.401 | -51,81 | 67.609 | -59,05 | ||||
| 2026-02-13 | 13F | Polymer Capital Management (HK) LTD | Call | 0 | -100,00 | 0 | -100,00 | |||
| 2026-02-17 | 13F | Laird Norton Trust Company, Llc | 4.611 | 767 | ||||||
| 2025-11-12 | 13F | Warm Springs Advisors Inc. | 0 | -100,00 | 0 | |||||
| 2026-02-17 | 13F | LMR Partners LLP | 0 | -100,00 | 0 | |||||
| 2026-02-12 | 13F | SWAN Capital LLC | 100 | -15,97 | 17 | -30,43 | ||||
| 2026-02-17 | 13F | Hunting Hill Global Capital, LLC | 3.362 | 559 | ||||||
| 2026-04-07 | 13F | U.S. Capital Wealth Advisors, LLC | 2.282 | 250 | ||||||
| 2026-02-09 | 13F | Optimist Retirement Group LLC | 1.354 | -11,04 | 225 | -24,50 | ||||
| 2026-02-17 | 13F | Fmr Llc | 25.334.941 | 5,21 | 4.214.721 | -10,61 | ||||
| 2026-01-20 | 13F | Steel Peak Wealth Management LLC | 4.922 | 819 | ||||||
| 2026-01-20 | 13F | Steel Peak Wealth Management LLC | Call | 183 | ||||||
| 2026-02-11 | 13F | Ing Groep Nv | 0 | -100,00 | 0 | |||||
| 2026-02-13 | 13F | BNP Paribas Asset Management Holding S.A. | 186.329 | 14.080,29 | 31 | |||||
| 2026-01-29 | 13F | Quent Capital, LLC | 91 | 12,35 | 15 | 0,00 | ||||
| 2026-02-02 | 13F | Principal Financial Group Inc | 23.922 | -4,56 | 3.980 | -18,91 | ||||
| 2026-02-12 | 13F | Skandinaviska Enskilda Banken AB (publ) | 27.604 | 4.594 | ||||||
| 2025-11-14 | 13F | Symmetry Peak Management Llc | 0 | -100,00 | 0 | -100,00 | ||||
| 2026-02-12 | 13F | New York State Common Retirement Fund | 73.320 | -12,56 | 12.198 | -25,71 | ||||
| 2026-02-12 | 13F | Great Valley Advisor Group, Inc. | 3.975 | 2,58 | 661 | -12,80 | ||||
| 2026-02-17 | 13F | Utah Retirement Systems | 20.800 | 0,00 | 3.460 | -15,03 | ||||
| 2026-01-28 | 13F | Arizona State Retirement System | 36.454 | -6,47 | 6.064 | -20,53 | ||||
| 2026-02-13 | 13F | Barclays Plc | Put | 0 | -100,00 | 0 | -100,00 | |||
| 2026-02-12 | 13F | Qtron Investments LLC | 3.053 | 508 | ||||||
| 2026-04-27 | 13F | Y-Intercept (Hong Kong) Ltd | 31.743 | 497,23 | 3.479 | 293,55 | ||||
| 2026-02-13 | 13F | Alberta Investment Management Corp | 27.900 | 4.641 | ||||||
| 2026-02-17 | 13F | SageView Advisory Group, LLC | 1.324 | -8,25 | 220 | -21,99 | ||||
| 2026-02-09 | 13F | Hantz Financial Services, Inc. | 36 | -5,26 | 0 | |||||
| 2026-04-24 | 13F | ProShare Advisors LLC | 11.899 | -28,97 | 1.304 | -53,19 | ||||
| 2026-02-11 | 13F | Tiaa Trust, National Association | 119.497 | 19.880 | ||||||
| 2025-11-10 | 13F | Jupiter Asset Management Ltd | 0 | -100,00 | 0 | -100,00 | ||||
| 2026-04-07 | 13F | Farther Finance Advisors, LLC | 3.472 | 60,67 | 369 | 2,79 | ||||
| 2026-02-02 | 13F | Cornerstone Planning Group LLC | 2 | -71,43 | 0 | -100,00 | ||||
| 2026-04-15 | 13F | Valley National Advisers Inc | 27 | 0,00 | 0 | |||||
| 2026-04-13 | 13F | Salem Investment Counselors Inc | 184.908 | 1,42 | 20.266 | -33,19 | ||||
| 2026-01-28 | 13F | Chicago Partners Investment Group LLC | 2.175 | 27,27 | 369 | 28,57 | ||||
| 2026-04-10 | 13F | Perigon Wealth Management, LLC | 0 | -100,00 | 0 | |||||
| 2025-11-14 | 13F | Balyasny Asset Management Llc | 0 | -100,00 | 0 | -100,00 | ||||
| 2026-02-06 | 13F | Tortoise Investment Management, LLC | 0 | -100,00 | 0 | |||||
| 2026-02-17 | 13F | Russell Investments Group, Ltd. | 70.879 | 20,39 | 11.846 | 2,41 | ||||
| 2026-02-17 | 13F | Defiance ETFs, LLC | 243.067 | 41.526 | ||||||
| 2025-11-14 | 13F | Granahan Investment Management Inc/ma | 0 | -100,00 | 0 | -100,00 | ||||
| 2026-01-23 | 13F | Rsm Us Wealth Management Llc | 1.986 | 46,24 | 339 | 27,92 | ||||
| 2026-01-26 | 13F | Private Trust Co Na | 93 | 89,80 | 15 | 66,67 | ||||
| 2026-02-17 | 13F | Mirabella Financial Services Llp | 1.658 | 276 | ||||||
| 2026-02-17 | 13F | Blair William & Co/il | 15.047 | 47,71 | 2.503 | 25,53 | ||||
| 2026-02-13 | 13F | Pinpoint Asset Management (Singapore) Pte. Ltd. | 349 | 46,03 | 58 | 26,09 | ||||
| 2026-02-17 | 13F | Ninepoint Partners LP | 0 | -100,00 | 0 | |||||
| 2025-11-14 | 13F | AXA Investment Managers S.A. | 171.587 | 33.597 | ||||||
| 2026-02-17 | 13F | Algert Global Llc | 63.925 | -49,75 | 11 | -58,33 | ||||
| 2026-02-17 | 13F | FIL Ltd | 13.095 | 2.178 | ||||||
| 2026-04-17 | 13F | HHM Wealth Advisors, LLC | 21 | 0,00 | 2 | -33,33 | ||||
| 2026-02-03 | 13F | Ethic Inc. | 5.156 | -55,89 | 858 | -62,54 | ||||
| 2026-02-26 | 13F/A | Sculptor Capital LP | 0 | -100,00 | 0 | |||||
| 2026-02-11 | 13F | LPL Financial LLC | 198.321 | 28,01 | 32.993 | 8,76 | ||||
| 2026-01-28 | 13F | Salomon & Ludwin, LLC | 95 | 0,00 | 16 | -21,05 | ||||
| 2026-02-11 | 13F | LPL Financial LLC | Put | 5.100 | 2,00 | 848 | -13,38 | |||
| 2025-11-12 | 13F | Proficio Capital Partners LLC | 0 | -100,00 | 0 | |||||
| 2026-02-11 | 13F | Loup Funds, LLC | 51.428 | 8.556 | ||||||
| 2026-03-05 | 13F | Gunpowder Capital Management, LLC dba Oliver Wealth Management | 450 | 75 | ||||||
| 2025-11-14 | 13F | WealthTrak Capital Management LLC | 0 | -100,00 | 0 | |||||
| 2026-02-02 | 13F | Chapman Financial Group, Llc | 15 | 0,00 | 2 | 0,00 | ||||
| 2026-02-17 | 13F | Jain Global LLC | 99.583 | 16.567 | ||||||
| 2026-04-21 | 13F | Oak Wealth Advisors LLC | 0 | -100,00 | 0 | |||||
| 2026-02-06 | 13F | Americana Partners, LLC | 1.335 | 222 | ||||||
| 2026-02-06 | 13F | Berbice Capital Management LLC | 1.800 | 9,09 | 299 | -7,43 | ||||
| 2026-02-13 | 13F | Umb Bank N A/mo | 19 | 18,75 | 3 | 0,00 | ||||
| 2026-02-03 | 13F | F/M Investments LLC | 18.817 | -0,76 | 3.130 | -15,68 | ||||
| 2026-02-03 | 13F | Maxi Investments CY Ltd | 9.500 | 2 | ||||||
| 2026-02-09 | 13F | Atlantic Trust, LLC | 462 | -0,22 | 77 | -15,56 | ||||
| 2026-02-13 | 13F | Verition Fund Management LLC | 59.040 | -15,60 | 9.822 | -28,29 | ||||
| 2026-02-17 | 13F | Nissay Asset Management Corp /japan/ /adv | 58.111 | 69,00 | 9.667 | 43,60 | ||||
| 2026-02-17 | 13F | one8zero8, LLC | 0 | -100,00 | 0 | |||||
| 2026-01-29 | 13F | China Universal Asset Management Co., Ltd. | 4.200 | -58,82 | 699 | -65,05 | ||||
| 2026-02-13 | 13F | OMERS ADMINISTRATION Corp | 0 | -100,00 | 0 | |||||
| 2026-03-20 | 13F | Purpose Unlimited Inc. | 17 | 3 | ||||||
| 2026-02-13 | 13F | First Trust Advisors Lp | 315.626 | 16,45 | 52.508 | -1,06 | ||||
| 2026-02-17 | 13F | Susquehanna International Group, Llp | Put | 2.778.000 | 17,22 | 462.148 | -0,41 | |||
| 2026-02-17 | 13F | Susquehanna International Group, Llp | Call | 3.205.300 | 6,38 | 533.234 | -9,62 | |||
| 2026-02-17 | 13F | Susquehanna International Group, Llp | 378.004 | -40,82 | 62.885 | -49,72 | ||||
| 2026-02-12 | 13F | Cibc World Markets Corp | 128.741 | 21.417 | ||||||
| 2026-02-17 | 13F | Quadrature Capital Ltd | 50.819 | 1,22 | 8.454 | -14,10 | ||||
| 2026-02-12 | 13F | Groupe la Francaise | 0 | -100,00 | 0 | |||||
| 2026-02-13 | 13F | Polymer Capital Management (HK) LTD | 8.803 | -85,80 | 1.464 | -87,93 | ||||
| 2026-02-11 | 13F | Jpmorgan Chase & Co | 703.469 | -12,45 | 117.030 | -25,61 | ||||
| 2026-04-23 | 13F | First Pacific Financial | 54 | 68,75 | 6 | 0,00 | ||||
| 2026-01-23 | 13F | Valley Brook Capital Group, Inc. | 2.250 | 53,06 | 374 | 30,31 | ||||
| 2026-02-11 | 13F | Vestcor Inc | 3.784 | 244,00 | 1 | |||||
| 2026-02-04 | 13F | Tsfg, Llc | 65 | 0 | ||||||
| 2026-02-09 | 13F | Hartland & Co., LLC | 670 | 5,35 | 111 | -10,48 | ||||
| 2026-02-17 | 13F | Ancora Advisors, LLC | 95 | 0,00 | 16 | -16,67 | ||||
| 2026-03-12 | 13F/A | Peak6 Llc | Call | 146.000 | -56,73 | 24.289 | -63,23 | |||
| 2026-02-12 | 13F | Hollencrest Capital Management | Call | 0 | -100,00 | 0 | -100,00 | |||
| 2026-03-12 | 13F/A | Peak6 Llc | Put | 236.600 | -51,80 | 39.361 | -59,05 | |||
| 2026-04-08 | 13F | StoneCrest Wealth Management, Inc. | 7.153 | -5,88 | 784 | -38,05 | ||||
| 2026-02-05 | 13F | Cambridge Investment Research Advisors, Inc. | 25.727 | -13,15 | 4 | -20,00 | ||||
| 2026-04-21 | 13F | Trueblood Wealth Management, LLC | 2.500 | 100,00 | 274 | 32,37 | ||||
| 2026-04-08 | 13F | NorthCrest Asset Manangement, LLC | 0 | -100,00 | 0 | |||||
| 2026-01-30 | 13F | Jennison Associates Llc | 2.630 | -63,66 | 438 | -69,16 | ||||
| 2026-02-17 | 13F | Polymer Capital Management (US) LLC | 1.655 | -49,59 | 275 | -57,17 | ||||
| 2026-02-12 | 13F | JT Stratford LLC | 12.378 | 9,52 | 2.059 | -6,92 | ||||
| 2026-02-17 | 13F | Caption Management, LLC | Put | 15.000 | 0,00 | 2.495 | -15,05 | |||
| 2026-01-15 | 13F | Private Advisory Group LLC | 0 | -100,00 | 0 | |||||
| 2026-02-13 | 13F | Change Path, LLC | 2.313 | 24,56 | 385 | 5,79 | ||||
| 2026-02-05 | 13F | North Dakota State Investment Board | 4.436 | 738 | ||||||
| 2026-01-26 | 13F | KBC Group NV | 15.616 | 324,12 | 3 | |||||
| 2026-04-21 | 13F | Chapin Davis, Inc. | 11.451 | 0,00 | 1.255 | -34,09 | ||||
| 2026-02-11 | 13F | Gordian Capital Singapore Pte Ltd | 1.100 | 183 | ||||||
| 2026-02-13 | 13F | Walleye Trading LLC | Call | 341.200 | -10,47 | 56.762 | -23,93 | |||
| 2026-02-13 | 13F | Bank Of Nova Scotia | 6.289 | -87,22 | 1.046 | -89,14 | ||||
| 2026-02-17 | 13F | Ameriflex Group, Inc. | 100 | -83,33 | 17 | -86,32 | ||||
| 2026-04-24 | 13F | Sumitomo Mitsui DS Asset Management Company, Ltd | 14.902 | 0,00 | 1.633 | -34,13 | ||||
| 2026-02-13 | 13F | Walleye Trading LLC | Put | 201.500 | -30,92 | 33.522 | -41,31 | |||
| 2026-01-30 | 13F/A | M&t Bank Corp | 14.058 | 8,58 | 2.338 | -7,73 | ||||
| 2026-04-15 | 13F | Gf Fund Management Co. Ltd. | 0 | -100,00 | 0 | |||||
| 2026-04-23 | 13F | North Star Investment Management Corp. | 8 | 33,33 | 1 | |||||
| 2026-02-11 | 13F | Franklin Resources Inc | 60.203 | -47,52 | 10.015 | -55,41 | ||||
| 2026-02-17 | 13F | Fullerton Fund Management Co Ltd | 1.755 | 292 | ||||||
| 2026-01-27 | 13F | Asset Management One Co., Ltd. | 51.266 | 3.470,06 | 8.717 | 3.002,14 | ||||
| 2026-02-11 | 13F | Crestwood Capital Management, L.P. | 20.920 | 0,00 | 3.480 | -15,04 | ||||
| 2026-02-10 | 13F | CIBC World Markets Inc. | 34.941 | 1,48 | 5.813 | -13,78 | ||||
| 2026-02-17 | 13F | Harvest Investment Services, LLC | 5.865 | 128,74 | 976 | 94,22 | ||||
| 2026-02-11 | 13F | Deutsche Bank Ag\ | 981.712 | 157,85 | 163.318 | 119,08 | ||||
| 2026-02-13 | 13F | 1832 Asset Management L.P. | 1.347.000 | 40,24 | 224.087 | 19,15 | ||||
| 2026-02-17 | 13F | Dark Forest Capital Management Lp | 2.743 | -52,99 | 456 | -13,47 | ||||
| 2026-02-04 | 13F | Plato Investment Management Ltd | 1.665 | 91,38 | 278 | 64,50 | ||||
| 2026-02-11 | 13F | Next Capital Management LLC | 5.182 | 0,00 | 862 | -14,99 | ||||
| 2025-11-14 | 13F | Mangrove Partners | 0 | -100,00 | 0 | |||||
| 2025-11-14 | 13F | Paloma Partners Management Co | 0 | -100,00 | 0 | |||||
| 2026-02-12 | 13F | Alps Advisors Inc | 2.002 | 0,60 | 333 | -14,40 | ||||
| 2026-02-13 | 13F | Gts Securities Llc | 11.584 | 80,04 | 1.927 | 53,06 | ||||
| 2026-02-06 | 13F | Csenge Advisory Group | 7.784 | 1.295 | ||||||
| 2026-02-13 | 13F | Capula Management Ltd | 5.042 | 192,29 | 839 | 148,66 | ||||
| 2026-02-10 | 13F | Connor, Clark & Lunn Investment Management Ltd. | 0 | -100,00 | 0 | |||||
| 2026-02-09 | 13F | Huntington National Bank | 74 | 8,82 | 12 | -7,69 | ||||
| 2026-02-09 | 13F | Kingsview Wealth Management, LLC | 6.806 | 12,00 | 1.132 | -4,79 | ||||
| 2026-02-17 | 13F | Driehaus Capital Management Llc | 2.709 | -99,67 | 451 | -99,72 | ||||
| 2025-11-14 | 13F | Eventide Asset Management, Llc | 0 | -100,00 | 0 | |||||
| 2026-02-17 | 13F | Aquatic Capital Management LLC | 0 | -100,00 | 0 | |||||
| 2026-02-17 | 13F | Shay Capital LLC | 0 | -100,00 | 0 | |||||
| 2026-02-17 | 13F | Shay Capital LLC | Put | 0 | -100,00 | 0 | ||||
| 2026-02-17 | 13F | Shay Capital LLC | Call | 0 | -100,00 | 0 | ||||
| 2026-02-12 | 13F | Peterson Wealth Services | 9.170 | 6,88 | 1.526 | -21,19 | ||||
| 2026-04-23 | 13F | SJS Investment Consulting Inc. | 5 | 400,00 | 1 | |||||
| 2026-02-23 | 13F | Beaird Harris Wealth Management, LLC | 3 | 0,00 | 0 | |||||
| 2026-04-14 | 13F | Nbc Securities, Inc. | 21 | 0,00 | 2 | -33,33 | ||||
| 2026-04-22 | 13F | Mindset Wealth Management, Llc | 2.272 | -5,84 | 249 | -37,91 | ||||
| 2025-11-04 | 13F | Guerra Advisors Inc | 10 | 2 | ||||||
| 2026-04-14 | 13F | Prospera Financial Services Inc | 0 | -100,00 | 0 | |||||
| 2026-02-17 | 13F | Amundi | 1.057.353 | -25,60 | 175.901 | -43,95 | ||||
| 2026-02-05 | 13F | HighMark Wealth Management LLC | 50 | 8 | ||||||
| 2026-02-13 | 13F | Royal London Asset Management Ltd | 5.013 | 834 | ||||||
| 2026-02-12 | 13F | Wealthspire Advisors, LLC | 0 | -100,00 | 0 | |||||
| 2025-11-14 | 13F | EFG Asset Management (Americas) Corp. | 18.519 | -11,32 | 3.626 | 92,06 | ||||
| 2025-11-10 | 13F | Optiver Holding B.V. | 0 | -100,00 | 0 | -100,00 | ||||
| 2026-04-13 | 13F | Jackson Square Capital, Llc | 0 | -100,00 | 0 | |||||
| 2026-02-10 | 13F | CIBC Asset Management Inc | 6.838 | 40,99 | 1.138 | 19,81 | ||||
| 2026-04-21 | 13F | Vanguard Capital Wealth Advisors This fund is a listed as child fund of Vanguard Group Inc and if that institution has disclosed ownership in this security, then these positions will not be double counted when calculating total shares and total value | 0 | -100,00 | 0 | |||||
| 2026-02-09 | 13F | Emerald Advisers, Llc | 3.162 | -4,30 | 526 | -18,58 | ||||
| 2026-02-10 | 13F | Axq Capital, Lp | 0 | -100,00 | 0 | |||||
| 2026-02-13 | 13F | Arete Wealth Advisors, LLC | 8.640 | -11,97 | 1 | 0,00 | ||||
| 2026-02-17 | 13F | Sherman Porfolios, Llc | 3.668 | 610 | ||||||
| 2026-02-17 | 13F | Schonfeld Strategic Advisors LLC | 0 | -100,00 | 0 | |||||
| 2026-01-20 | 13F | Cigna Investments Inc /new | 1.212 | -3,73 | 0 | |||||
| 2026-02-13 | 13F | Wbi Investments, Inc. | 0 | -100,00 | 0 | |||||
| 2026-02-12 | 13F | BlackRock, Inc. | 12.968.858 | 15,49 | 2.157.499 | -1,87 | ||||
| 2026-02-17 | 13F | Canada Pension Plan Investment Board | 79.100 | -28,99 | 13.159 | -39,67 | ||||
| 2025-11-14 | 13F | Concentric Capital Strategies, LP | 0 | -100,00 | 0 | |||||
| 2026-02-13 | 13F | Citigroup Inc | 928.330 | 5,11 | 154.437 | -10,69 | ||||
| 2026-02-24 | 13F/A | Pacer Advisors, Inc. | 388.078 | -24,37 | 64.561 | -35,75 | ||||
| 2026-02-13 | 13F | Hudson Bay Capital Management LP | 0 | -100,00 | 0 | |||||
| 2026-01-30 | 13F | Simplicity Wealth,LLC | 12.175 | 12,10 | 2.025 | -4,75 | ||||
| 2025-11-14 | 13F | Alta Park Capital, LP | 0 | -100,00 | 0 | -100,00 | ||||
| 2026-04-24 | 13F | Essex Financial Services, Inc. | 27.169 | 4,16 | 2.978 | -31,39 | ||||
| 2026-02-09 | 13F/A | Swedbank AB | 78.140 | 76,79 | 12.999 | 50,21 | ||||
| 2025-11-12 | 13F | Picton Mahoney Asset Management | 0 | -100,00 | 0 | |||||
| 2026-02-13 | 13F | MAI Capital Management | 2.163 | 1,45 | 360 | -13,91 | ||||
| 2026-02-12 | 13F | Brinker Capital Investments, LLC | 4.372 | 22,57 | 727 | 4,15 | ||||
| 2025-11-14 | 13F | Bayesian Capital Management, LP | 0 | -100,00 | 0 | |||||
| 2026-04-08 | 13F | Wealth Enhancement Trust Services, Inc. | 12.075 | -2,12 | 1.323 | -35,53 | ||||
| 2026-02-06 | 13F | Bare Financial Services, Inc | 0 | -100,00 | 0 | |||||
| 2026-02-17 | 13F | Raymond James Financial Inc | 96.963 | -66,09 | 16.131 | -71,19 | ||||
| 2026-02-13 | 13F | Knollwood Investment Advisory, LLC | 2.268 | 0,00 | 377 | -15,09 | ||||
| 2026-02-17 | 13F | Two Sigma Securities, Llc | 0 | -100,00 | 0 | |||||
| 2026-02-13 | 13F | Sei Investments Co | 323.537 | 37,41 | 53.823 | 16,75 | ||||
| 2026-02-10 | 13F | Amazon Com Inc | 277.777 | 0,00 | 46.211 | -15,04 | ||||
| 2026-02-10 | 13F | Bearing Point Capital, Llc | 21.145 | 3.518 | ||||||
| 2026-01-29 | 13F | Comerica Bank | 59.966 | -20,83 | 9.976 | -32,73 | ||||
| 2026-02-09 | 13F | Harbour Investments, Inc. | 3.812 | -1,42 | 634 | -16,25 | ||||
| 2026-02-13 | 13F | Arrowstreet Capital, Limited Partnership | 0 | -100,00 | 0 | |||||
| 2026-02-13 | 13F | Ossiam | 136.841 | -17,28 | 22.765 | -29,72 | ||||
| 2026-02-18 | 13F/A | Empowered Funds, LLC | 9.144 | 27,51 | 1.521 | 8,33 | ||||
| 2026-02-13 | 13F | Quarry LP | 145 | -77,93 | 24 | -81,25 | ||||
| 2026-02-17 | 13F | Twinbeech Capital Lp | 0 | -100,00 | 0 | |||||
| 2026-04-16 | 13F | Security National Bank | 13 | 0,00 | 1 | -50,00 | ||||
| 2026-02-02 | 13F | Sachetta, LLC | 43 | -12,24 | 7 | -22,22 | ||||
| 2026-02-11 | 13F | Vestor Capital, Llc | 37.789 | 132,56 | 0 | -100,00 | ||||
| 2026-01-29 | 13F | Rakuten Securities, Inc. | 9.312 | 37,85 | 1.549 | 17,17 | ||||
| 2026-02-11 | 13F | GW&K Investment Management, LLC | 26.981 | 0,74 | 4 | -20,00 | ||||
| 2026-02-17 | 13F | California State Teachers Retirement System | 208.364 | 71,23 | 34.663 | 45,48 | ||||
| 2026-03-06 | 13F | Hsbc Holdings Plc | 83.721 | 128,50 | 14.126 | 101,48 | ||||
| 2026-02-14 | 13F | Whipplewood Advisors, LLC | 2 | 0 | ||||||
| 2026-02-12 | 13F | DRW Securities, LLC | 0 | -100,00 | 0 | |||||
| 2026-04-20 | 13F | Hilton Head Capital Partners, LLC | 0 | -100,00 | 0 | |||||
| 2026-02-17 | 13F | SIH Partners, LLLP | 2.677 | -60,38 | 445 | -66,36 | ||||
| 2026-02-17 | 13F | Eddie Patel Inc | 6.483 | 1.078 | ||||||
| 2026-02-10 | 13F/A | Northwestern Mutual Wealth Management Co | 600 | 81,82 | 100 | 54,69 | ||||
| 2026-02-11 | 13F | Cookson Peirce & Co Inc | 0 | -100,00 | 0 | |||||
| 2026-02-13 | 13F | Natixis | 0 | -100,00 | 0 | |||||
| 2026-02-13 | 13F | Brown Advisory Inc | 3.879 | 0,47 | 645 | -14,57 | ||||
| 2026-02-17 | 13F | Cantor Fitzgerald, L. P. | Call | 0 | -100,00 | 0 | -100,00 | |||
| 2026-02-17 | 13F | Public Employees Retirement System Of Ohio | 64.490 | 63,86 | 10.729 | 39,23 | ||||
| 2026-02-13 | 13F | Resources Investment Advisors, LLC. | 6.160 | 11,94 | 1.025 | -4,92 | ||||
| 2026-02-12 | 13F/A | Pinebridge Investments Llc | 4.101 | 682 | ||||||
| 2026-02-10 | 13F | Td Asset Management Inc | 24.534 | 116,81 | 4.081 | 84,24 | ||||
| 2026-04-17 | 13F | Webster Bank, N. A. | 30 | 0,00 | 3 | -25,00 | ||||
| 2026-02-17 | 13F | Liontrust Investment Partners LLP | 52.986 | 81,28 | 8.815 | 54,01 | ||||
| 2026-04-09 | 13F | Teamwork Financial Advisors, LLC | 6.341 | 7,82 | 695 | -29,04 | ||||
| 2026-02-03 | 13F | SBI Securities Co., Ltd. | 15.569 | 7,08 | 2.590 | -9,00 | ||||
| 2026-01-26 | 13F | Taylor Frigon Capital Management LLC | 26.067 | -0,88 | 4.337 | -15,79 | ||||
| 2026-02-12 | 13F | Rossby Financial, LCC | 109 | 18 | ||||||
| 2026-02-04 | 13F | Ameritas Advisory Services, LLC | 0 | -100,00 | 0 | |||||
| 2026-02-12 | 13F | Ci Investments Inc. | 0 | -100,00 | 0 | |||||
| 2026-04-15 | 13F | Avanza Fonder AB | 1.560 | -69,71 | 171 | -80,14 | ||||
| 2026-04-07 | 13F | Retirement Wealth Solutions LLC | 19 | 35,71 | 2 | 0,00 | ||||
| 2026-02-13 | 13F | Rhumbline Advisers | 153.475 | 10,23 | 25.532 | -6,34 | ||||
| 2026-02-17 | 13F | Engineers Gate Manager LP | 23.854 | -86,30 | 3.968 | -88,36 | ||||
| 2026-04-06 | 13F | Versant Capital Management, Inc | 462 | 7,94 | 51 | -29,58 | ||||
| 2026-02-12 | 13F | Marex Group plc | 2.887 | 480 | ||||||
| 2026-04-22 | 13F | Spire Wealth Management | 28 | -98,69 | 3 | -99,15 | ||||
| 2026-04-24 | 13F | MOR Wealth Management, LLC | 0 | -100,00 | 0 | |||||
| 2026-02-13 | 13F | Silvant Capital Management LLC | 20.798 | 85,08 | 3.460 | 57,23 | ||||
| 2026-01-15 | 13F | Cherry Creek Investment Advisors, Inc. | 3.854 | 5,47 | 641 | -10,35 | ||||
| 2026-02-13 | 13F | Parkside Financial Bank & Trust | 85 | 28,79 | 14 | 16,67 | ||||
| 2026-02-13 | 13F | Ieq Capital, Llc | 0 | -100,00 | 0 | |||||
| 2026-01-27 | 13F | Fortis Capital Advisors, LLC | 18.156 | 70,98 | 3.020 | 45,26 | ||||
| 2026-02-04 | 13F | Atlantic Union Bankshares Corp | 293 | -2,98 | 49 | -18,64 | ||||
| 2026-02-10 | 13F | Main Management ETF Advisors, LLC | 18.792 | 1,03 | 3 | 0,00 | ||||
| 2026-02-13 | 13F | Dynamic Technology Lab Private Ltd | 0 | -100,00 | 0 | |||||
| 2026-02-11 | 13F | Rise Advisors, LLC | 0 | -100,00 | 0 | |||||
| 2026-04-14 | 13F | Bay Harbor Wealth Management, LLC | 1 | 0 | ||||||
| 2026-02-06 | 13F | Larson Financial Group LLC | 355 | 2.630,77 | 59 | 2.850,00 | ||||
| 2025-11-14 | 13F | Spyglass Capital Management Llc | 0 | -100,00 | 0 | -100,00 | ||||
| 2026-03-12 | 13F/A | Peak6 Llc | 0 | -100,00 | 0 | |||||
| 2026-02-13 | 13F | Barclays Plc | Call | 0 | -100,00 | 0 | -100,00 | |||
| 2025-11-14 | 13F | Summit Partners Public Asset Management, Llc | Put | 0 | -100,00 | 0 | -100,00 | |||
| 2026-01-15 | 13F | Nisa Investment Advisors, Llc | 7.794 | 30,44 | 1.297 | 10,86 | ||||
| 2026-02-18 | 13F | Vident Advisory, LLC | 9.841 | 25,84 | 1.637 | 6,92 | ||||
| 2026-02-13 | 13F | Clear Street Group Inc. | 577.211 | 86,06 | 96.025 | 58,08 | ||||
| 2026-04-13 | 13F | True Wealth Design, LLC | 5 | -28,57 | 1 | -100,00 | ||||
| 2026-02-11 | 13F | IMA Wealth, Inc. | 8.069 | 0,75 | 1.342 | -14,41 | ||||
| 2026-02-12 | 13F | Azimuth Capital Investment Management LLC | 1.400 | 233 | ||||||
| 2026-03-27 | 13F | Prosperity Wealth Management, Inc. | 4.530 | 5,35 | 754 | -10,46 | ||||
| 2026-01-21 | 13F | Prime Capital Investment Advisors, LLC | 2.820 | 0,39 | 469 | -14,73 | ||||
| 2026-02-13 | 13F | Kennedy Capital Management, Inc. | 29.874 | 0,40 | 4.970 | -14,70 | ||||
| 2026-02-17 | 13F | Agf Management Ltd | 2.954 | 491 | ||||||
| 2026-01-15 | 13F | Bernard Wealth Management Corp. | 300 | 0,00 | 50 | -15,52 | ||||
| 2026-04-16 | 13F | E. Ohman J:or Asset Management AB | 3.305 | 0,00 | 362 | -34,06 | ||||
| 2026-02-09 | 13F | Lisanti Capital Growth, LLC | 0 | -100,00 | 0 | |||||
| 2026-04-21 | 13F | Ground Swell Capital, LLC | 4.023 | 441 | ||||||
| 2026-04-17 | 13F | Bell Investment Advisors, Inc | 95 | 4,40 | 10 | -33,33 | ||||
| 2026-04-17 | 13F | AdvisorNet Financial, Inc | 62 | 55,00 | 7 | 0,00 | ||||
| 2026-04-15 | 13F | Elevatus Welath Management | 0 | -100,00 | 0 | |||||
| 2026-04-10 | 13F | Integrated Financial Solutions, Inc. | 21.600 | 52,27 | 2.367 | 0,34 | ||||
| 2026-01-23 | 13F | Avion Wealth | 11 | -35,29 | 0 | |||||
| 2026-02-03 | 13F | We Are One Seven, LLC | 0 | -100,00 | 0 | -100,00 | ||||
| 2026-04-22 | 13F | Pictet Asset Management Holding SA | 55.968 | -25,35 | 6.134 | -50,81 | ||||
| 2026-04-15 | 13F | Redhawk Wealth Advisors, Inc. | 0 | -100,00 | 0 | |||||
| 2026-01-29 | 13F | Concurrent Investment Advisors, LLC | 3.482 | -17,84 | 579 | -30,16 | ||||
| 2026-02-06 | 13F | Tredje AP-fonden | 31.277 | 5.203 | ||||||
| 2026-01-21 | 13F | Pacific Point Advisors, LLC | 10.000 | 17,65 | 1.664 | -0,06 | ||||
| 2026-04-24 | 13F | Redwood Wealth Management Group, LLC | 2.610 | 17,04 | 286 | -22,70 | ||||
| 2026-02-11 | 13F | SlateStone Wealth, LLC | 13.796 | 8,25 | 2 | 0,00 | ||||
| 2026-02-06 | 13F | Legato Capital Management LLC | 7.047 | 16,19 | 1.172 | -1,26 | ||||
| 2026-02-09 | 13F | Berkshire Capital Holdings Inc | 87.930 | 879.200,00 | 14.628 | 1.462.700,00 | ||||
| 2026-02-17 | 13F | Captrust Financial Advisors | 5.160 | 56,93 | 858 | 33,44 | ||||
| 2026-02-17 | 13F | Atreides Management, LP | 1.611.194 | 2.496,61 | 268.038 | 2.106,26 | ||||
| 2026-02-13 | 13F | Smartleaf Asset Management LLC | 188 | 422,22 | 32 | 357,14 | ||||
| 2026-02-17 | 13F | Temasek Holdings (Private) Ltd | 47.306 | 7.870 | ||||||
| 2025-11-13 | 13F | Dymon Asia Capital (singapore) Pte. Ltd. | Put | 0 | -100,00 | 0 | -100,00 | |||
| 2025-11-13 | 13F | Benchmark Investment Advisors LLC | 1.762 | 345 | ||||||
| 2026-02-10 | 13F | National Pension Service | 235.238 | 39.153 | ||||||
| 2025-11-13 | 13F | Dymon Asia Capital (singapore) Pte. Ltd. | Call | 0 | -100,00 | 0 | -100,00 | |||
| 2026-03-02 | 13F | Tobam | 12.363 | 115,01 | 2 | 100,00 | ||||
| 2026-01-28 | 13F | Geneos Wealth Management Inc. | 7.851 | 5,10 | 1.306 | -10,67 | ||||
| 2026-01-29 | 13F | IMC-Chicago, LLC | 194.090 | 48,48 | 32.289 | 26,15 | ||||
| 2026-01-29 | 13F | Warren Street Wealth Advisors, LLC | 0 | -100,00 | 0 | |||||
| 2026-02-03 | 13F | Morse Asset Management, Inc | 19.396 | -30,22 | 3.227 | -40,72 | ||||
| 2025-11-12 | 13F | Close Asset Management Ltd | 0 | -100,00 | 0 | |||||
| 2026-02-05 | 13F | Left Brain Wealth Management, LLC | 3.375 | -22,86 | 561 | -34,46 | ||||
| 2026-02-17 | 13F | DZ BANK AG Deutsche Zentral Genossenschafts Bank, Frankfurt am Main | 1.700 | -68,50 | 283 | -73,30 | ||||
| 2026-01-27 | 13F | Zurcher Kantonalbank (Zurich Cantonalbank) | 32.975 | 27,65 | 5.486 | 8,44 | ||||
| 2026-01-30 | 13F | Bogart Wealth, LLC | 17 | 13,33 | 3 | 0,00 | ||||
| 2025-11-06 | 13F | REAP Financial Group, LLC | 0 | -100,00 | 0 | -100,00 | ||||
| 2026-04-13 | 13F | Creative Financial Designs Inc /adv | 575 | 0,00 | 63 | -33,68 | ||||
| 2026-02-09 | 13F | Keating Financial Advisory Services, Inc. | 6 | 1 | ||||||
| 2026-02-12 | 13F | Commonwealth Equity Services, Llc | 24.401 | 48,82 | 4.059 | 135.200,00 | ||||
| 2026-01-21 | 13F | Newbridge Financial Services Group, Inc. | 7.715 | 14,64 | 1.283 | -2,58 | ||||
| 2026-02-11 | 13F | SOUTH STATE Corp | 30 | 15,38 | 5 | -20,00 | ||||
| 2026-02-12 | 13F | Aviva Plc | 85.390 | 3.515,16 | 14.205 | 2.974,68 | ||||
| 2026-02-09 | 13F | Quest Partners LLC | 208 | -74,76 | 35 | -78,88 | ||||
| 2026-02-13 | 13F | Stifel Financial Corp | 104.460 | 14,35 | 17.378 | -2,84 | ||||
| 2026-02-13 | 13F | Ubs Asset Management Americas Inc | 576.281 | 76,17 | 95.870 | 49,68 | ||||
| 2026-02-17 | 13F | Bank Of America Corp /de/ | Call | 0 | -100,00 | 0 | ||||
| 2026-02-13 | 13F | Cohen & Steers, Inc. | 4.500 | 12,50 | 1 | |||||
| 2025-11-03 | 13F | EFG Asset Management (North America) Corp. | 21.561 | -17,72 | 4.220 | 78,21 | ||||
| 2026-02-13 | 13F | Visionary Wealth Advisors | 2.527 | 12,96 | 420 | -4,11 | ||||
| 2026-02-17 | 13F | Value Aligned Research Advisors, LLC | 568.316 | -58,77 | 94.545 | -64,97 | ||||
| 2026-02-13 | 13F | Flow Traders U.s. Llc | 1.892 | 0 | ||||||
| 2026-01-07 | 13F | Harbour Capital Advisors, LLC | 6.760 | -2,87 | 1.214 | -17,82 | ||||
| 2026-02-09 | 13F | Jefferies Financial Group Inc. | 4.370 | -14,98 | 727 | -27,83 | ||||
| 2026-02-12 | 13F | Callan Family Office, LLC | 3.187 | 16,23 | 530 | -1,12 | ||||
| 2026-04-17 | 13F | Vermillion Wealth Management, Inc. | 12 | 1 | ||||||
| 2026-02-10 | 13F | Bnp Paribas Arbitrage, Sa | Put | 120 | 1.996 | |||||
| 2025-11-13 | 13F | Bank Of Montreal /can/ | Call | 0 | -100,00 | 0 | -100,00 | |||
| 2026-02-10 | 13F | Bnp Paribas Arbitrage, Sa | Call | 110 | 1.830 | |||||
| 2026-02-17 | 13F | Bank Of America Corp /de/ | Put | 0 | -100,00 | 0 | ||||
| 2026-02-10 | 13F | Bnp Paribas Arbitrage, Sa | 797.386 | -29,27 | 132.653 | -39,90 | ||||
| 2026-01-27 | 13F | Journey Advisory Group, LLC | 1.285 | 0,78 | 214 | -14,46 | ||||
| 2026-04-17 | 13F | Buffalo Business & Estate Services Ltd | 2.667 | 292 | ||||||
| 2026-02-04 | 13F | Versor Investments LP | 0 | -100,00 | 0 | |||||
| 2026-02-17 | 13F | Munro Partners | 39.430 | -11,56 | 6.560 | -24,86 | ||||
| 2026-04-16 | 13F | Diversified Trust Co | 4.369 | 62,78 | 479 | 7,17 | ||||
| 2026-02-13 | 13F | Jacobs Levy Equity Management, Inc | 2.167 | 361 | ||||||
| 2026-02-10 | 13F | Natixis Advisors, L.p. | 0 | -100,00 | 0 | |||||
| 2025-11-14 | 13F | Oxford Asset Management Llp | 2.206 | -53,19 | 432 | 1,17 | ||||
| 2025-11-07 | 13F | Shell Asset Management Co | 1.359 | -43,19 | 0 | |||||
| 2026-02-17 | 13F | Prelude Capital Management, Llc | 1.327 | -47,17 | 221 | -55,19 | ||||
| 2026-02-12 | 13F | Jane Street Group, Llc | Put | 2.282.900 | 6,14 | 379.783 | -9,82 | |||
| 2026-02-12 | 13F | Jane Street Group, Llc | Call | 1.047.400 | -12,22 | 174.245 | -25,42 | |||
| 2026-02-12 | 13F | Jane Street Group, Llc | 6.294 | -98,45 | 1.047 | -98,68 | ||||
| 2026-01-07 | 13F | Yeomans Consulting Group, Inc. | 0 | -100,00 | 0 | |||||
| 2026-02-13 | 13F | Wexford Capital Lp | 0 | -100,00 | 0 | |||||
| 2026-02-13 | 13F | State Street Corp | 3.099.809 | 32,50 | 515.684 | 12,58 | ||||
| 2026-01-20 | 13F | Cromwell Holdings LLC | 20 | 0,00 | 3 | 0,00 | ||||
| 2026-02-17 | 13F | Symmetry Peak Management Llc | Call | 4.900 | 815 | |||||
| 2026-01-26 | 13F | Whittier Trust Co | 273 | 0,00 | 44 | -20,37 | ||||
| 2026-02-06 | 13F | Sierra Summit Advisors Llc | 95.593 | 0,57 | 15.903 | -14,56 | ||||
| 2026-02-13 | 13F | Commerce Bank | 9.671 | 1.609 | ||||||
| 2026-02-17 | 13F | Summit Trail Advisors, Llc | 1.590 | -7,45 | 265 | -21,43 | ||||
| 2026-04-08 | 13F | Mirador Capital Partners LP | 0 | -100,00 | 0 | |||||
| 2026-02-10 | 13F | Forsta Ap-fonden | 43.700 | 7.270 | ||||||
| 2026-02-13 | 13F | Oasis Management Co Ltd. | 0 | -100,00 | 0 | |||||
| 2025-11-14 | 13F | Ameriprise Financial Inc | Put | 0 | -100,00 | 0 | -100,00 | |||
| 2026-02-10 | 13F | Gulf International Bank (UK) Ltd | 7.248 | 1 | ||||||
| 2026-02-11 | 13F | Livforsakringsbolaget Skandia, Omsesidigt | 900 | 150 | ||||||
| 2026-02-17 | 13F | Frontier Capital Management Co Llc | 735.341 | 45.687,11 | 122.331 | 38.858,92 | ||||
| 2026-02-09 | 13F | HBK Sorce Advisory LLC | 1.301 | -2,18 | 221 | 2,80 | ||||
| 2026-02-13 | 13F | Squarepoint Ops LLC | Call | 317.300 | 137,14 | 52.786 | 101,49 | |||
| 2026-04-08 | 13F | Emergent Wealth Advisors, LLC | 2.916 | -14,46 | 320 | -43,74 | ||||
| 2026-02-13 | 13F | Squarepoint Ops LLC | Put | 336.200 | 68,86 | 55.930 | 43,47 | |||
| 2026-01-28 | 13F | Klp Kapitalforvaltning As | 45.500 | 46,30 | 7.569 | 24,31 | ||||
| 2026-02-13 | 13F | Squarepoint Ops LLC | 206.631 | 50,01 | 34.375 | 27,46 | ||||
| 2026-04-13 | 13F | Highland Capital Management, Llc | 4.200 | -62,54 | 460 | -75,34 | ||||
| 2026-04-22 | 13F | Stone House Investment Management, LLC | 20 | -4,76 | 2 | -33,33 | ||||
| 2026-02-11 | 13F | Westfield Capital Management Co Lp | 195.294 | 1,39 | 32.489 | -13,85 | ||||
| 2026-02-27 | 13F | Strategic Investment Solutions, Inc. /IL | 0 | -100,00 | 0 | |||||
| 2026-02-12 | 13F | Principal Securities, Inc. | 0 | -100,00 | 0 | -100,00 | ||||
| 2026-02-17 | 13F | Northern Trust Corp | 761.360 | 6,65 | 126.660 | -9,39 | ||||
| 2026-02-05 | 13F | Stephens Investment Management Group LLC | 238.777 | 254,15 | 39.723 | 200,90 | ||||
| 2026-02-17 | 13F | Buckland Partners Management Co LLC | 11.000 | 1.830 | ||||||
| 2026-02-13 | 13F | Marshall Wace, Llp | 348.296 | 57.943 | ||||||
| 2026-04-23 | 13F | SMART Wealth LLC | 0 | -100,00 | 0 | |||||
| 2026-01-14 | 13F | WESPAC Advisors, LLC | 1.317 | -22,89 | 219 | -34,43 | ||||
| 2026-02-10 | 13F | Goldman Sachs Group Inc | 1.312.927 | 189,04 | 218.419 | 145,58 | ||||
| 2026-02-10 | 13F | Goldman Sachs Group Inc | Call | 0 | -100,00 | 0 | -100,00 | |||
| 2026-02-05 | 13F | DnB Asset Management AS | 25.813 | 164,86 | 4.294 | 125,05 | ||||
| 2026-02-17 | 13F | Cetera Investment Advisers | 25.286 | 37,74 | 4.206 | 17,03 | ||||
| 2026-01-23 | 13F | Diversify Advisory Services, LLC | 14.263 | 32,38 | 2.596 | 25,79 | ||||
| 2026-04-22 | 13F | Coastal Investment Advisors, Inc. | 6.315 | -3,03 | 692 | -36,10 | ||||
| 2026-04-17 | 13F | CENTRAL TRUST Co | 2 | -50,00 | 0 | |||||
| 2026-02-03 | 13F | Bokf, Na | 9.673 | 70,15 | 1.609 | 44,56 | ||||
| 2026-02-13 | 13F | Vontobel Holding Ltd. | 8.595 | -72,90 | 1.430 | -76,99 | ||||
| 2026-02-17 | 13F | Banco Bilbao Vizcaya Argentaria, S.a. | 0 | -100,00 | 0 | |||||
| 2026-02-11 | 13F | Fox Run Management, L.l.c. | 0 | -100,00 | 0 | |||||
| 2026-02-17 | 13F | United Capital Financial Advisers, Llc | 1.480 | -16,71 | 246 | -29,11 | ||||
| 2025-10-27 | 13F | Elemental Capital Partners LLC | 0 | -100,00 | 0 | -100,00 | ||||
| 2026-01-26 | 13F | SeaBridge Investment Advisors LLC | 6.022 | 177,00 | 1.002 | 135,53 | ||||
| 2026-02-04 | 13F | Dogwood Wealth Management LLC | 4 | 33,33 | 1 | |||||
| 2026-04-07 | 13F | Park Avenue Securities Llc | 53.129 | 6 | ||||||
| 2026-01-21 | 13F | DMG Group, LLC | 3.443 | 27,42 | 573 | 8,13 | ||||
| 2026-04-21 | 13F | Nemes Rush Group LLC | 12 | 0,00 | 1 | 0,00 | ||||
| 2026-01-30 | 13F | Catalytic Wealth RIA, LLC | 2.926 | -4,78 | 487 | -19,13 | ||||
| 2026-02-17 | 13F | Millennium Management Llc | Call | 18.100 | -67,96 | 3.011 | -72,78 | |||
| 2026-02-03 | 13F | Everence Capital Management Inc | 3.911 | 0,00 | 1 | |||||
| 2026-02-12 | 13F | Sprott Inc. | 5.800 | 0,00 | 965 | -15,07 | ||||
| 2026-02-17 | 13F | Millennium Management Llc | 251.383 | -33,33 | 41.820 | -43,36 | ||||
| 2025-11-14 | 13F/A | Skopos Labs, Inc. | 0 | -100,00 | 0 | -100,00 | ||||
| 2026-02-19 | 13F | Invesco Ltd. | 537.490 | -1,35 | 89.417 | -16,18 | ||||
| 2026-01-29 | 13F | Verdence Capital Advisors LLC | 1.310 | -47,16 | 218 | -48,58 | ||||
| 2026-02-06 | 13F | Cullen/frost Bankers, Inc. | 417 | 0,48 | 69 | -14,81 | ||||
| 2026-02-13 | 13F | Prudential Financial Inc | 17.157 | -94,12 | 2.854 | -95,00 | ||||
| 2026-02-11 | 13F | Manchester Capital Management LLC | 9 | 1 | ||||||
| 2026-02-06 | 13F | EverSource Wealth Advisors, LLC | 235 | 17,50 | 39 | 0,00 | ||||
| 2026-04-21 | 13F | SpringVest Wealth Management LLC | 0 | -100,00 | 0 | |||||
| 2026-02-17 | 13F | Two Sigma Investments, Lp | Put | 51.700 | 1.466,67 | 8.601 | 1.231,27 | |||
| 2026-02-17 | 13F | Royal Bank Of Canada | 168.798 | -51,28 | 28.081 | -58,61 | ||||
| 2026-02-17 | 13F | Two Sigma Investments, Lp | Call | 33.500 | 5.573 | |||||
| 2026-02-17 | 13F | Advisory Services Network, LLC | 13.280 | 30,40 | 2.209 | 10,78 | ||||
| 2026-02-17 | 13F | Two Sigma Investments, Lp | 633.374 | -49,87 | 105.368 | -57,41 | ||||
| 2026-01-28 | 13F | B. Metzler seel. Sohn & Co. AG | 2.900 | 482 | ||||||
| 2026-02-20 | 13F | Sunbelt Securities, Inc. | 85 | 26,87 | 14 | 7,69 | ||||
| 2026-01-14 | 13F | ORG Partners LLC | 9 | 0,00 | 1 | 0,00 | ||||
| 2026-04-21 | 13F | Robeco Institutional Asset Management B.V. | 52.035 | 183,37 | 5.703 | 86,74 | ||||
| 2026-02-11 | 13F | O'shaughnessy Asset Management, Llc | 3.834 | -8,54 | 638 | -22,32 | ||||
| 2026-02-17 | 13F | Interval Partners, LP | Call | 50.000 | 8.318 | |||||
| 2026-01-28 | 13F | Momentum Wealth Planning, LLC | 2.098 | 349 | ||||||
| 2026-02-10 | 13F | FDx Advisors, Inc. | 0 | -100,00 | 0 | |||||
| 2026-02-17 | 13F | Millennium Management Llc | Put | 233.500 | 28,23 | 38.845 | 8,95 | |||
| 2026-04-21 | 13F | Wealth Effects Llc | 14.765 | 1.618 | ||||||
| 2026-02-12 | 13F | Counterpoint Mutual Funds LLC | 0 | -100,00 | 0 | |||||
| 2026-02-17 | 13F | Adage Capital Partners Gp, L.l.c. | 168.741 | 400,11 | 28.072 | 324,93 | ||||
| 2025-11-14 | 13F | Freestone Grove Partners LP | 0 | -100,00 | 0 | -100,00 | ||||
| 2026-02-17 | 13F | Rakuten Investment Management, Inc. | 21.212 | 96,75 | 3.608 | 12,75 | ||||
| 2026-02-06 | 13F | CloudAlpha Capital Management Limited/Hong Kong | Call | 0 | -100,00 | 0 | -100,00 | |||
| 2026-02-17 | 13F | Investment Management Corp of Ontario | 8.957 | 1.490 | ||||||
| 2026-04-02 | 13F | Hilltop National Bank | 200 | 0,00 | 22 | -36,36 | ||||
| 2026-02-17 | 13F | Advisor Group Holdings, Inc. | 37.903 | -31,16 | 6.306 | -38,57 | ||||
| 2026-02-04 | 13F | Pier 88 Investment Partners Llc | 3.260 | 8,67 | 542 | -7,67 | ||||
| 2025-11-05 | 13F | Optimize Financial Inc | 0 | -100,00 | 0 | -100,00 | ||||
| 2026-02-05 | 13F | Amalgamated Bank | 10.635 | 4,69 | 2 | 0,00 | ||||
| 2026-02-10 | 13F | Hazlett, Burt & Watson, Inc. | 4.244 | 29,67 | 1 | |||||
| 2026-02-13 | 13F | National Bank Of Canada /fi/ | 9.976 | 4.838,61 | 1.659 | 4.151,28 | ||||
| 2026-02-11 | 13F | United Financial Planning Group LLC | 4 | 1 | ||||||
| 2026-02-17 | 13F | Graham Capital Management, L.P. | 2.796 | -18,10 | 465 | -30,39 | ||||
| 2026-04-09 | 13F | Wedmont Private Capital | 2.483 | 61,76 | 312 | 22,44 | ||||
| 2026-01-28 | 13F | Oversea-Chinese Banking CORP Ltd | 21.673 | 3.605 | ||||||
| 2026-01-15 | 13F | Lodestone Wealth Management LLC | 926 | -29,26 | 154 | -39,84 | ||||
| 2026-02-10 | 13F | Acadian Asset Management Llc | 35.107 | -84,98 | 6 | -88,89 | ||||
| 2026-04-24 | 13F | UMA Financial Services, Inc. | 18 | -18,18 | 2 | -66,67 | ||||
| 2026-02-13 | 13F | Golden State Wealth Management, LLC | 56 | 166,67 | 9 | 125,00 | ||||
| 2026-02-04 | 13F | Proem Advisors LLC | 0 | -100,00 | 0 | |||||
| 2026-01-30 | 13F | Wealthfront Advisers Llc | 1.326 | 221 | ||||||
| 2026-02-04 | 13F | Proem Advisors LLC | Put | 0 | -100,00 | 0 | ||||
| 2026-02-17 | 13F | Wiley Bros.-aintree Capital, Llc | 3.975 | -0,50 | 661 | -15,58 | ||||
| 2026-01-22 | 13F | BOCHK Asset Management Ltd | 0 | -100,00 | 0 | |||||
| 2026-02-09 | 13F | CBIZ Investment Advisory Services, LLC | 3 | 0 | ||||||
| 2026-04-23 | 13F | Asset Planning,Inc | 20 | 2 | ||||||
| 2026-04-10 | 13F/A | OP Asset Management Ltd | 13.785 | -33,95 | 1.511 | -56,51 | ||||
| 2026-02-17 | 13F | Ardsley Advisory Partners Lp | Put | 0 | -100,00 | 0 | -100,00 | |||
| 2026-04-08 | 13F | DiNuzzo Private Wealth, Inc. | 83 | 9 | ||||||
| 2026-02-13 | 13F | Van Eck Associates Corp | 44.819 | 74,64 | 7 | 40,00 | ||||
| 2026-01-15 | 13F | J. Safra Sarasin Holding AG | 0 | -100,00 | 0 | |||||
| 2026-02-17 | 13F | Voloridge Investment Management, Llc | 99.155 | -85,24 | 16.495 | -87,46 | ||||
| 2025-11-07 | 13F | Sierra Ocean, Llc | 0 | -100,00 | 0 | |||||
| 2026-02-12 | 13F | Elo Mutual Pension Insurance Co | 25.066 | 4.170 | ||||||
| 2026-01-30 | 13F | American Capital Advisory, LLC | 1 | 0 | ||||||
| 2026-04-06 | 13F | CX Institutional | 13 | 0 | ||||||
| 2026-02-10 | 13F | Allen Investment Management LLC | 5.197 | -19,59 | 865 | -31,70 | ||||
| 2025-11-12 | 13F | HAP Trading, LLC | Put | 12.500 | 99 | |||||
| 2025-10-27 | 13F | Dagco, Inc. | 0 | -100,00 | 0 | -100,00 | ||||
| 2025-11-12 | 13F | HAP Trading, LLC | Call | 16.100 | 779 | |||||
| 2026-01-26 | 13F | Shelton Wealth Management, Llc | Call | 500 | 83 | |||||
| 2026-01-29 | 13F | Calamos Advisors LLC | 0 | -100,00 | 0 | |||||
| 2026-01-26 | 13F | Shelton Wealth Management, Llc | 5.154 | 857 | ||||||
| 2026-01-08 | 13F | Nordea Investment Management Ab | 11.857 | 2.028 | ||||||
| 2026-04-17 | 13F | Murphy & Mullick Capital Management Corp | 394 | 8,84 | 43 | -28,33 | ||||
| 2026-02-12 | 13F | State Board Of Administration Of Florida Retirement System | 117.424 | 5,46 | 19.535 | -10,40 | ||||
| 2026-02-13 | 13F | JustInvest LLC | 12.391 | 2,47 | 2.061 | -12,93 | ||||
| 2026-02-23 | 13F | Virtu Financial LLC | 0 | -100,00 | 0 | |||||
| 2026-02-05 | 13F | Td Private Client Wealth Llc | 202 | -20,47 | 34 | -32,65 | ||||
| 2026-02-11 | 13F | Janney Capital Management LLC | 2.246 | 1,63 | 0 | |||||
| 2026-02-02 | 13F | Estate Counselors, LLC | 0 | -100,00 | 0 | |||||
| 2026-02-10 | 13F | Intech Investment Management Llc | 4.373 | -50,83 | 727 | -58,24 | ||||
| 2026-02-12 | 13F | Voya Investment Management Llc | 219.628 | -33,32 | 36.537 | -43,34 | ||||
| 2026-04-09 | 13F | Sanders Morris Harris Llc | 11.208 | 1.228 | ||||||
| 2026-02-17 | 13F | Gotham Asset Management, LLC | 4.872 | -43,77 | 811 | -52,24 | ||||
| 2026-02-17 | 13F | Wealth Architects, LLC | 5.096 | -0,08 | 848 | -15,13 | ||||
| 2026-04-15 | 13F | Merit Financial Group, LLC | 5.677 | -21,47 | 622 | -48,25 | ||||
| 2026-02-17 | 13F | Mercer Global Advisors Inc /adv | 6.943 | 17,84 | 1.075 | -3,07 | ||||
| 2026-01-21 | 13F | Sound Income Strategies, LLC | 902 | 9,20 | 164 | -11,83 | ||||
| 2026-02-12 | 13F | Federation des caisses Desjardins du Quebec | 5.226 | -42,02 | 869 | -50,74 | ||||
| 2026-02-13 | 13F | Panagora Asset Management Inc | 3.500 | 582 | ||||||
| 2026-02-17 | 13F | Warren Averett Asset Management, LLC | 2.245 | 4,18 | 373 | -11,40 | ||||
| 2026-02-17 | 13F | Silvercrest Asset Management Group Llc | 31.078 | 62,10 | 5.170 | 37,76 | ||||
| 2026-02-12 | 13F | Steward Partners Investment Advisory, Llc | 344 | -99,16 | 57 | -99,29 | ||||
| 2026-02-09 | 13F | Sterling Investment Advisors, Ltd. | 2.025 | 337 | ||||||
| 2026-02-17 | 13F | Ardmore Road Asset Management LP | 0 | -100,00 | 0 | |||||
| 2026-02-13 | 13F | Carmignac Gestion | 0 | -100,00 | 0 | |||||
| 2026-04-14 | 13F | Tradewinds Capital Management, LLC | 25 | 0,00 | 3 | -50,00 | ||||
| 2026-02-11 | 13F | Twin Tree Management, LP | Call | 14.800 | -92,22 | 2.462 | -93,39 | |||
| 2026-02-11 | 13F | Twin Tree Management, LP | Put | 138.500 | -64,41 | 23.041 | -69,76 | |||
| 2026-02-11 | 13F | Twin Tree Management, LP | 32.398 | 5.390 | ||||||
| 2026-02-14 | 13F | BluePath Capital Management, LLC | 0 | -100,00 | 0 | |||||
| 2026-04-15 | 13F | Exchange Traded Concepts, Llc | 44.714 | 6,38 | 4.901 | -29,92 | ||||
| 2026-02-12 | 13F | Bank of Jackson Hole Trust | 14 | 2 | ||||||
| 2026-02-06 | 13F | Global Retirement Partners, LLC | 3.794 | 506,07 | 631 | 417,21 | ||||
| 2026-02-13 | 13F | Avalon Global Asset Management LLC | Call | 0 | -100,00 | 0 | ||||
| 2026-02-13 | 13F | Treasurer of the State of North Carolina | 71.823 | -5,15 | 12 | -21,43 | ||||
| 2026-02-09 | 13F | Darden Wealth Group Inc | 1.775 | 295 | ||||||
| 2026-02-03 | 13F | Diversify Wealth Management, Llc | 1.985 | 2,48 | 358 | -3,50 | ||||
| 2026-04-24 | 13F | Key FInancial Inc | 10 | 0,00 | 1 | 0,00 | ||||
| 2026-02-05 | 13F | Allworth Financial LP | 3.154 | 3,82 | 525 | -11,78 | ||||
| 2026-02-11 | 13F | Los Angeles Capital Management Llc | 4.614 | 108,68 | 782 | 81,02 | ||||
| 2026-01-30 | 13F | Us Bancorp \de\ | 20.436 | 12,80 | 3.400 | -4,17 | ||||
| 2026-02-19 | 13F | Atomi Financial Group, Inc. | 2.766 | 98,28 | 460 | 68,50 | ||||
| 2026-02-18 | 13F | CTC Alternative Strategies, Ltd. | 0 | -100,00 | 0 | |||||
| 2026-04-13 | 13F | IFP Advisors, Inc | 3.885 | -29,35 | 426 | -53,50 | ||||
| 2026-04-16 | 13F | Capital Advisors, Ltd. LLC | 4 | 0,00 | 0 | |||||
| 2026-02-13 | 13F | Caxton Associates Llp | 1.480 | 246 | ||||||
| 2026-02-06 | 13F | Gsa Capital Partners Llp | 0 | -100,00 | 0 | |||||
| 2026-02-13 | 13F | Macquarie Group Ltd | 20.628 | -78,19 | 3.432 | -81,47 | ||||
| 2026-04-15 | 13F | Peregrine Investment Management Inc | 0 | -100,00 | 0 | |||||
| 2026-01-05 | 13F | Union Bancaire Privee, UBP SA | 0 | -100,00 | 0 | |||||
| 2026-01-29 | 13F | WT Asset Management Ltd | 92.400 | 15.372 | ||||||
| 2026-04-14 | 13F | Juncture Wealth Strategies, Llc | 0 | -100,00 | 0 | |||||
| 2026-02-17 | 13F | Capstone Investment Advisors, Llc | 15.439 | 54,22 | 2.568 | 31,02 | ||||
| 2026-02-10 | 13F | Goldman Sachs Group Inc | Put | 0 | -100,00 | 0 | -100,00 | |||
| 2026-01-12 | 13F | CVA Family Office, LLC | 30 | 76,47 | 5 | 33,33 | ||||
| 2026-02-13 | 13F | Colony Group, LLC | 322.325 | -0,90 | 55.301 | -13,12 | ||||
| 2026-04-08 | 13F | Grove Bank & Trust | 126 | -0,79 | 14 | -38,10 | ||||
| 2026-02-03 | 13F | Mitsubishi UFJ Kokusai Asset Management Co., Ltd. | 194.593 | 163,16 | 34.941 | 141,34 | ||||
| 2026-02-12 | 13F | Castleark Management Llc | 0 | -100,00 | 0 | |||||
| 2026-02-02 | 13F | Horizon Investments, LLC | 0 | -100,00 | 0 | |||||
| 2026-02-17 | 13F | Greenhouse Funds LLLP | 314.417 | -2,20 | 52.306 | -16,90 | ||||
| 2026-02-05 | 13F | Stephens Inc /ar/ | 2.271 | 378 | ||||||
| 2026-02-03 | 13F | ASR Vermogensbeheer N.V. | 4.978 | 828 | ||||||
| 2026-02-09 | 13F | Allstate Corp | 9.972 | 1.659 | ||||||
| 2026-02-13 | 13F | Palisade Asset Management, LLC | 0 | -100,00 | 0 | |||||
| 2026-04-17 | 13F | Wealth Management Partners, LLC | 42.181 | 28,78 | 4.621 | -15,20 | ||||
| 2026-01-27 | 13F | TD Waterhouse Canada Inc. | 12.337 | -24,93 | 2.052 | -30,38 | ||||
| 2026-02-17 | 13F | Bank Of America Corp /de/ | 1.488.817 | -24,87 | 247.680 | -36,16 | ||||
| 2026-01-27 | 13F | Oriental Harbor Investment Fund | 0 | -100,00 | 0 | |||||
| 2026-02-13 | 13F | Wells Fargo & Company/mn | 129.600 | 31,49 | 21.560 | 11,72 | ||||
| 2026-02-17 | 13F | Tudor Investment Corp Et Al | 92.987 | 218,75 | 15.469 | 170,86 | ||||
| 2026-02-10 | 13F | Transatlantique Private Wealth Llc | 4.702 | 170,54 | 782 | 130,00 | ||||
| 2026-02-17 | 13F | Brevan Howard Capital Management LP | 0 | -100,00 | 0 | |||||
| 2026-02-10 | 13F | Nomura Asset Management Co Ltd | 473.179 | 63,69 | 78.718 | 39,08 | ||||
| 2026-04-20 | 13F | Ronald Blue Trust, Inc. | 116 | 0,00 | 13 | -36,84 | ||||
| 2026-02-12 | 13F | Sycomore Asset Management | 17.231 | 0,00 | 1 | |||||
| 2026-01-28 | 13F | WPG Advisers, LLC | 936 | 62,50 | 156 | 38,39 | ||||
| 2026-02-17 | 13F | Aqr Capital Management Llc | 44.020 | -29,60 | 7.323 | -40,19 | ||||
| 2026-02-13 | 13F | Towarzystwo Funduszy Inwestycyjnych Pzu Sa | 200 | 33 | ||||||
| 2026-02-03 | 13F | Sequoia Financial Advisors, LLC | 3.145 | 21,57 | 523 | 3,36 | ||||
| 2026-04-09 | 13F | Park Place Capital Corp | 14 | -30,00 | 2 | -66,67 | ||||
| 2026-02-17 | 13F | Tudor Investment Corp Et Al | Put | 29.700 | -80,65 | 4.941 | -83,56 | |||
| 2026-02-17 | 13F | Tudor Investment Corp Et Al | Call | 85.000 | -64,26 | 14.141 | -69,63 | |||
| 2026-02-12 | 13F | United Capital Management of KS, Inc. | 41.078 | 2,01 | 6.834 | -13,33 | ||||
| 2026-02-17 | 13F | GeoWealth Management, LLC | 1.162 | 193 | ||||||
| 2026-02-13 | 13F | BRITISH COLUMBIA INVESTMENT MANAGEMENT Corp | 23.506 | 3.910 | ||||||
| 2026-04-13 | 13F | Gradient Investments LLC | 4.527 | 496 | ||||||
| 2026-01-30 | 13F | Mitsubishi UFJ Trust & Banking Corp | 61.908 | 10.299 | ||||||
| 2026-02-13 | 13F | FirstWave Capital Management LLC | 29.969 | 4.986 | ||||||
| 2025-11-14 | 13F | Polar Asset Management Partners Inc. | 1.783 | 349 | ||||||
| 2026-02-12 | 13F | Federated Hermes, Inc. | 298.183 | 7,14 | 49.606 | -8,97 | ||||
| 2026-04-15 | 13F | Fortitude Family Office, LLC | 8 | 166,67 | 1 | |||||
| 2026-01-29 | 13F | Vanguard Group Inc | 13.827.506 | 0,61 | 2.300.344 | -14,51 | ||||
| 2026-02-17 | 13F | Summit Partners Public Asset Management, Llc | 510.000 | 0,00 | 84.844 | -15,04 | ||||
| 2026-02-11 | 13F | Cerity Partners LLC | 2.274 | -5,92 | 378 | -20,08 | ||||
| 2026-02-13 | 13F | Maverick Capital Ltd | 975.959 | -5,47 | 162.361 | -19,68 | ||||
| 2026-02-10 | 13F | Allen Operations Llc | 6.122 | 0,00 | 1.018 | -15,03 | ||||
| 2026-02-11 | 13F | Harvest Fund Management Co., Ltd | 3.125 | -15,43 | 1 | |||||
| 2026-04-07 | 13F | Central Pacific Bank - Trust Division | 0 | -100,00 | 0 | |||||
| 2026-02-17 | 13F | Nomura Holdings Inc | 9.938 | 25,48 | 1.653 | 6,65 | ||||
| 2026-04-23 | 13F | Lansforsakringar Fondforvaltning AB (publ) | 44.037 | 0,58 | 4.826 | -33,74 | ||||
| 2026-04-16 | 13F | Tandem Capital Management Corp /adv | 3.335 | 5,54 | 366 | -30,48 | ||||
| 2026-02-12 | 13F | Cloud Capital Management, LLC | 0 | -100,00 | 0 | |||||
| 2026-01-27 | 13F | Rye Brook Capital LLC | 9.200 | 0,00 | 2 | 0,00 | ||||
| 2026-02-17 | 13F | Wellington Management Group Llp | 55.691 | -33,72 | 9.265 | -43,69 | ||||
| 2026-01-28 | 13F | Hoey Investments, Inc | 7.452 | -3,87 | 1.240 | -18,33 | ||||
| 2026-02-11 | 13F | Meiji Yasuda Life Insurance Co | 3.040 | 506 | ||||||
| 2026-02-26 | 13F | Oak Grove Capital LLC | 81.200 | -6,56 | 13.508 | -20,61 | ||||
| 2026-02-17 | 13F | Meridiem Capital Partners LP | Call | 15.000 | 2.495 | |||||
| 2026-01-15 | 13F | Frank, Rimerman Advisors LLC | 2.373 | -9,32 | 395 | -23,05 | ||||
| 2025-11-14 | 13F | Sig Brokerage, Lp | Call | 0 | -100,00 | 0 | -100,00 | |||
| 2026-02-10 | 13F | Rothschild Investment Llc | 40 | 8,11 | 7 | -14,29 | ||||
| 2025-11-14 | 13F | Caption Management, LLC | Call | 0 | -100,00 | 0 | -100,00 | |||
| 2026-02-11 | 13F | Motley Fool Asset Management LLC | 2.826 | 4,40 | 470 | -11,32 | ||||
| 2026-02-13 | 13F | Landscape Capital Management, L.l.c. | 20.552 | 3.419 | ||||||
| 2026-02-10 | 13F | Winthrop Capital Management, LLC | 0 | -100,00 | 0 | |||||
| 2026-02-13 | 13F | Gen-Wealth Partners Inc | 2 | 0,00 | 0 | |||||
| 2026-01-23 | 13F | Sumitomo Mitsui Trust Holdings, Inc. | 272.451 | 1.932,46 | 45.325 | 1.627,29 | ||||
| 2026-02-17 | 13F | Qube Research & Technologies Ltd | 0 | -100,00 | 0 | |||||
| 2026-02-10 | 13F | Daiwa Securities Group Inc. | 15.813 | 358,08 | 3 | |||||
| 2026-04-03 | 13F | Global Wealth Strategies & Associates | 2 | 0 | ||||||
| 2026-02-13 | 13F | Siren, L.L.C. | 0 | -100,00 | 0 | |||||
| 2026-01-28 | 13F | Diversified Enterprises, LLC | 1.275 | 212 | ||||||
| 2026-02-13 | 13F | Cornerstone Financial Management LLC | 4 | 1 | ||||||
| 2026-02-17 | 13F | Lighthouse Investment Partners, LLC | 3.094 | 515 | ||||||
| 2026-02-17 | 13F | Oddo Bhf Asset Management Sas | 31.033 | 5.163 | ||||||
| 2026-04-07 | 13F | Eastern Bank | 0 | -100,00 | 0 | |||||
| 2026-01-28 | 13F | Kingswood Wealth Advisors, Llc | 3.324 | -16,55 | 553 | -29,14 | ||||
| 2026-02-04 | 13F | LRI Investments, LLC | 126 | 4,13 | 21 | -13,04 | ||||
| 2026-02-12 | 13F | Fuller & Thaler Asset Management, Inc. | 823.573 | 6,69 | 137.010 | -9,35 | ||||
| 2026-02-13 | 13F | Toroso Investments, LLC | 127.233 | 0,86 | 21.166 | -14,31 | ||||
| 2026-03-13 | 13F | Spear Advisors LLC | 94.895 | 15.787 | ||||||
| 2026-02-10 | 13F | Principia Wealth Advisory, LLC | 3 | 0,00 | 0 | |||||
| 2026-02-17 | 13F | Guggenheim Capital Llc | 13.846 | 45,12 | 2.303 | 23,29 | ||||
| 2026-02-12 | 13F | Bank Of Montreal /can/ | 11.413 | -15,42 | 1.899 | -28,13 | ||||
| 2026-02-17 | 13F | Torno Capital, Llc | 0 | -100,00 | 0 | |||||
| 2026-02-17 | 13F | T. Rowe Price Investment Management, Inc. | 44 | -10,20 | 0 | |||||
| 2026-02-06 | 13F | Covestor Ltd | 173 | 30,08 | 0 | |||||
| 2026-02-12 | 13F | Ensign Peak Advisors, Inc | 79.493 | -40,92 | 13.224 | -49,80 | ||||
| 2026-02-17 | 13F | Creative Planning | 19.810 | 7,52 | 3.296 | -8,65 | ||||
| 2026-02-11 | 13F | Capital World Investors | 600.000 | 0,00 | 99.816 | -15,04 | ||||
| 2026-02-13 | 13F | Manufacturers Life Insurance Company, The | 0 | -100,00 | 0 | |||||
| 2026-02-10 | 13F | Goldstein Advisors, LLC | 1.611 | 5,78 | 268 | -10,07 | ||||
| 2026-01-21 | 13F | Greenleaf Trust | 1.458 | 10,29 | 243 | -6,20 | ||||
| 2026-02-17 | 13F | D. E. Shaw & Co., Inc. | 2.452.380 | -3,72 | 407.978 | -18,20 | ||||
| 2026-02-13 | 13F | Lord, Abbett & Co. Llc | 943.148 | -36,97 | 157 | -46,58 | ||||
| 2026-02-17 | 13F | D. E. Shaw & Co., Inc. | Put | 167.700 | 19,70 | 27.899 | 1,70 | |||
| 2026-02-10 | 13F | Norges Bank | 349.692 | 58.175 | ||||||
| 2026-02-17 | 13F | D. E. Shaw & Co., Inc. | Call | 116.700 | -6,11 | 19.414 | -20,23 | |||
| 2025-11-13 | 13F | Diametric Capital, LP | 0 | -100,00 | 0 | -100,00 | ||||
| 2026-02-09 | 13F | Geode Capital Management, Llc | 2.429.078 | 4,51 | 403.598 | -11,33 | ||||
| 2026-02-13 | 13F | Public Employees Retirement Association Of Colorado | 12.671 | 0,00 | 2 | 0,00 | ||||
| 2026-02-09 | 13F | Catalyst Funds Management Pty Ltd | 16.300 | -21,63 | 2.712 | -33,42 | ||||
| 2026-02-17 | 13F | Citadel Advisors Llc | Call | 1.117.700 | -28,20 | 185.941 | -38,99 | |||
| 2026-02-17 | 13F | Cinctive Capital Management LP | 0 | -100,00 | 0 | |||||
| 2026-02-17 | 13F | Citadel Advisors Llc | Put | 1.055.500 | -24,28 | 175.593 | -35,67 | |||
| 2026-02-17 | 13F | Citadel Advisors Llc | 123.045 | -62,31 | 20.470 | -67,98 | ||||
| 2026-02-06 | 13F | HighTower Advisors, LLC | 12.225 | 5,09 | 2.034 | -10,72 | ||||
| 2026-02-17 | 13F | Toronto Dominion Bank | 20.632 | -60,30 | 3.432 | -66,27 | ||||
| 2026-04-09 | 13F | Pinkerton Retirement Specialists, LLC | 6.521 | 1,86 | 1.085 | 1,78 | ||||
| 2026-01-23 | 13F | Inlight Wealth Management, LLC | 0 | -100,00 | 0 | |||||
| 2026-04-24 | 13F | Capricorn Fund Managers Ltd | 5.689 | -88,62 | 624 | -92,51 | ||||
| 2026-04-15 | 13F | Activest Wealth Management | 0 | -100,00 | 0 | |||||
| 2026-02-09 | 13F | Legal & General Group Plc | 533.072 | 87,08 | 88.682 | 58,95 | ||||
| 2025-11-14 | 13F | StoneX Group Inc. | 0 | -100,00 | 0 | |||||
| 2026-04-21 | 13F | Financial Consulate, Inc | 2 | 0 | ||||||
| 2026-02-13 | 13F | Toroso Investments, LLC | Call | 0 | -100,00 | 0 | -100,00 | |||
| 2026-04-24 | 13F | Yousif Capital Management, Llc | 0 | -100,00 | 0 | |||||
| 2026-02-17 | 13F | Man Group plc | 39.571 | -65,03 | 6.583 | -70,29 | ||||
| 2026-02-10 | 13F | Belvedere Trading LLC | 0 | -100,00 | 0 | |||||
| 2026-02-10 | 13F | Belvedere Trading LLC | Put | 0 | -100,00 | 0 | ||||
| 2026-02-04 | 13F | Colonial River Wealth Management, LLC | 6.332 | -2,73 | 1.053 | -17,35 | ||||
| 2026-02-13 | 13F | Korea Investment CORP | 92.654 | 15.414 | ||||||
| 2026-02-03 | 13F | Wesbanco Bank Inc | 0 | -100,00 | 0 | |||||
| 2026-02-11 | 13F | Meeder Asset Management Inc | 519 | 458,06 | 86 | 377,78 | ||||
| 2026-02-11 | 13F | Parallel Advisors, LLC | 2.451 | 53,09 | 408 | 30,03 | ||||
| 2026-01-28 | 13F | Teacher Retirement System Of Texas | 4.379 | -85,40 | 728 | -87,60 | ||||
| 2026-04-23 | 13F | Forum Financial Management, LP | 0 | -100,00 | 0 | |||||
| 2026-01-20 | 13F | CV Advisors LLC | 2.000 | 0,00 | 333 | -15,09 | ||||
| 2026-02-13 | 13F | Barclays Plc | 1.150.080 | -42,92 | 191.327 | -51,50 | ||||
| 2026-02-17 | 13F | G2 Investment Partners Management LLC | 69.073 | 178,15 | 11.491 | 136,32 | ||||
| 2026-02-17 | 13F | Torno Capital, Llc | Call | 9.000 | 0,00 | 1.497 | -15,04 | |||
| 2026-02-17 | 13F | Siemens Fonds Invest GmbH | 1.856 | 317 | ||||||
| 2026-02-17 | 13F | Strive Financial Group ,LLC | 60 | 10 | ||||||
| 2026-04-21 | 13F | Vise Technologies, Inc. | 2.705 | 0,00 | 450 | 0,00 | ||||
| 2026-04-22 | 13F | Sterling Capital Management LLC | 5.644 | 525,72 | 619 | 312,00 | ||||
| 2025-11-12 | 13F | CIBC Bancorp USA Inc. | 9.291 | 1.819 | ||||||
| 2026-04-23 | 13F | Global Trust Asset Management, LLC | 15 | -99,25 | 2 | -99,70 | ||||
| 2026-02-17 | 13F | Numerai GP LLC | 0 | -100,00 | 0 | |||||
| 2026-02-10 | 13F | Belvedere Trading LLC | Call | 0 | -100,00 | 0 | ||||
| 2026-02-13 | 13F | Kilter Group LLC | 20 | -4,76 | 3 | -25,00 | ||||
| 2026-01-23 | 13F | Carnegie Capital Asset Management, LLC | 60.409 | 10.050 | ||||||
| 2026-02-06 | 13F | Leonteq Securities AG | 6.618 | 969,14 | 1.101 | 809,09 | ||||
| 2026-01-21 | 13F | Capital Investment Advisory Services, LLC | 0 | -100,00 | 0 | |||||
| 2026-02-12 | 13F | California Public Employees Retirement System | 212.325 | -0,03 | 35.322 | -15,06 | ||||
| 2026-02-02 | 13F | New England Capital Financial Advisors LLC | 0 | -100,00 | 0 | |||||
| 2026-04-08 | 13F | Wealth Enhancement Advisory Services, Llc | 14.300 | -97,23 | 1.675 | -97,99 | ||||
| 2026-02-02 | 13F | Qrg Capital Management, Inc. | 3.725 | 6,49 | 620 | -9,50 | ||||
| 2026-02-09 | 13F | MRP Capital Investments, LLC | 8.620 | 173,65 | 1.434 | 404,93 | ||||
| 2026-02-10 | 13F | Eurizon Capital SGR S.p.A. | 112.430 | 18.708 | ||||||
| 2026-01-28 | 13F | Universal- Beteiligungs- und Servicegesellschaft mbH | 41.716 | -55,34 | 6.941 | -62,05 | ||||
| 2026-02-11 | 13F | Simplex Trading, Llc | 0 | -100,00 | 0 | |||||
| 2026-04-15 | 13F | Atwood & Palmer Inc | 5 | 1 | ||||||
| 2026-02-11 | 13F | Prudential Plc | 62.790 | 51,67 | 10.446 | 28,86 | ||||
| 2026-02-13 | 13F | Charles Schwab Investment Management Inc | 633.940 | 5,92 | 105.462 | -10,00 | ||||
| 2026-04-10 | 13F | Quaker Wealth Management, LLC | 74 | 0,00 | 8 | -33,33 | ||||
| 2026-01-28 | 13F | West Michigan Advisors, Llc | 0 | -100,00 | 0 | -100,00 | ||||
| 2026-04-24 | 13F | Private Advisor Group, LLC | 3.341 | -27,21 | 366 | -52,03 | ||||
| 2026-04-06 | 13F | GAMMA Investing LLC | 1.011 | -17,80 | 111 | -46,08 | ||||
| 2026-02-13 | 13F | Police & Firemen's Retirement System of New Jersey | 53.651 | -3,89 | 8.925 | -18,34 | ||||
| 2025-10-27 | 13F | Concurrent Investment Advisors, LLC | Call | 0 | -100,00 | 0 | -100,00 | |||
| 2026-01-30 | 13F | Sigma Planning Corp | 3.918 | -82,88 | 652 | -85,47 | ||||
| 2026-02-04 | 13F | Virginia Retirement Systems Et Al | 0 | -100,00 | 0 | |||||
| 2026-02-10 | 13F | State of Wyoming | 826 | 29,06 | 137 | 9,60 | ||||
| 2026-01-16 | 13F | FNY Investment Advisers, LLC | 0 | -100,00 | 0 | |||||
| 2026-02-13 | 13F | Evelyn Partners Investment Management Services Ltd | 0 | -100,00 | 0 | |||||
| 2026-04-22 | 13F | Advocate Investing Services LLC | 900 | 0,00 | 99 | -34,23 | ||||
| 2026-02-04 | 13F | Swiss Life Asset Management Ltd | 8.978 | 48,35 | 1.494 | 26,10 | ||||
| 2026-02-17 | 13F | Lazard Asset Management Llc | 7.295 | -39,76 | 1.214 | -48,84 | ||||
| 2026-01-26 | 13F | PFG Investments, LLC | 1.785 | -32,89 | 297 | -43,08 | ||||
| 2026-02-13 | 13F | Centiva Capital, LP | 0 | -100,00 | 0 | |||||
| 2026-02-17 | 13F | Sig Brokerage, Lp | Put | 0 | -100,00 | 0 | -100,00 | |||
| 2026-02-12 | 13F | Brown Brothers Harriman & Co | 136 | 0,00 | 23 | -15,38 | ||||
| 2026-02-17 | 13F | Alphadyne Asset Management, LLC | Call | 10.700 | 463,16 | 1.780 | 378,49 | |||
| 2026-02-17 | 13F | Alphadyne Asset Management, LLC | Put | 4.500 | 18,42 | 749 | 0,54 | |||
| 2026-02-17 | 13F | Castle Hook Partners LP | 0 | -100,00 | 0 | |||||
| 2026-02-02 | 13F | Kornitzer Capital Management Inc /ks | 0 | -100,00 | 0 | |||||
| 2026-02-17 | 13F | PDT Partners, LLC | 9.559 | -6,82 | 1.590 | -20,82 | ||||
| 2026-01-26 | 13F | Cwm, Llc | 6.962 | 5,06 | 1 | 0,00 | ||||
| 2026-02-13 | 13F | Alkeon Capital Management Llc | 325.000 | 30,00 | 54.067 | 10,45 | ||||
| 2026-01-23 | 13F | Assetmark, Inc | 229 | 78,91 | 38 | 52,00 | ||||
| 2026-02-04 | 13F | Ag2r La Mondiale Gestion D'actifs | 7.557 | 1.257 | ||||||
| 2025-10-29 | 13F | Royal Fund Management, LLC | 0 | -100,00 | 0 | |||||
| 2025-10-29 | 13F | Royal Fund Management, LLC | Call | 0 | -100,00 | 0 | ||||
| 2026-04-21 | 13F | PharVision Advisers, LLC | 0 | -100,00 | 0 | |||||
| 2026-04-14 | 13F | Wealthcare Advisory Partners LLC | 22.644 | -20,70 | 2.482 | -47,77 | ||||
| 2026-02-17 | 13F | Delaware Management Holdings, Inc. | 97.020 | 16.140 | ||||||
| 2026-02-17 | 13F | Ameriprise Financial Inc | 218.707 | 17,75 | 38.045 | -5,71 | ||||
| 2026-04-20 | 13F | State of Alaska, Department of Revenue | 2.757 | 0,00 | 0 | |||||
| 2026-02-13 | 13F | Victory Capital Management Inc | 130.655 | -12,78 | 21.736 | -25,89 | ||||
| 2026-04-22 | 13F | Smallwood Wealth Investment Management, LLC | 125 | 14 | ||||||
| 2026-03-12 | 13F | Nalls Sherbakoff Group, Llc | 0 | -100,00 | 0 | |||||
| 2026-02-13 | 13F | Rokos Capital Management LLP | 273.694 | 45.548 | ||||||
| 2026-02-10 | 13F | Andar Capital Management HK Ltd | 0 | -100,00 | 0 | |||||
| 2026-02-17 | 13F | Caisse De Depot Et Placement Du Quebec | 145.683 | 24.236 | ||||||
| 2026-02-06 | 13F | Abn Amro Investment Solutions | 5.307 | 883 | ||||||
| 2026-01-29 | 13F | Dunhill Financial, LLC | 3 | 1 | ||||||
| 2026-04-13 | 13F | Global X Japan Co., Ltd. | 9.547 | 2,35 | 1.046 | -32,56 | ||||
| 2026-02-13 | 13F | Entropy Technologies, LP | 0 | -100,00 | 0 | |||||
| 2026-02-17 | 13F | Parallax Volatility Advisers, L.P. | Call | 34.100 | 29,17 | 5.673 | 9,73 | |||
| 2026-02-13 | 13F | Clay Northam Wealth Management, LLC | 3.848 | 20,82 | 640 | 2,73 | ||||
| 2026-02-06 | 13F | Envestnet Portfolio Solutions, Inc. | 3.863 | 11,87 | 643 | -5,03 | ||||
| 2026-02-13 | 13F | Volterra Technologies LP | 1.886 | 314 | ||||||
| 2026-02-17 | 13F | Odyssean, LLC | 2.102 | 350 | ||||||
| 2025-11-13 | 13F | Riggs Asset Managment Co. Inc. | 0 | -100,00 | 0 | |||||
| 2026-02-13 | 13F | Volterra Technologies LP | Put | 1.900 | 316 | |||||
| 2026-04-22 | 13F | Janney Montgomery Scott LLC | 19.799 | 483,70 | 2 | |||||
| 2026-02-17 | 13F | Parallax Volatility Advisers, L.P. | 17.643 | 2.935 | ||||||
| 2026-02-17 | 13F | Parallax Volatility Advisers, L.P. | Put | 44.700 | 1.141,67 | 7.436 | 956,25 | |||
| 2026-02-05 | 13F | Freemont Management S.A. | 111.900 | 693,62 | 18.616 | 574,46 | ||||
| 2026-04-09 | 13F | Nelson, Van Denburg & Campbell Wealth Management Group, LLC | 3.441 | 130,48 | 377 | 52,02 | ||||
| 2026-02-17 | 13F | Woodline Partners LP | 2.194 | 365 | ||||||
| 2026-02-06 | 13F | CloudAlpha Capital Management Limited/Hong Kong | Put | 100.000 | 16.636 | |||||
| 2026-01-26 | 13F | Prosperity Financial Group, Inc. | 5.215 | 868 | ||||||
| 2026-03-16 | 13F | Osbon Capital Management Llc | 43 | 7 | ||||||
| 2026-01-15 | 13F | Allspring Global Investments Holdings, LLC | 554.444 | 25,17 | 99.556 | 15,56 | ||||
| 2026-01-12 | 13F | Heartwood Wealth Advisors LLC | 0 | -100,00 | 0 | -100,00 | ||||
| 2026-02-09 | 13F | Blue Bell Private Wealth Management, Llc | 103 | 14,44 | 17 | 0,00 | ||||
| 2026-02-17 | 13F | Signature Equity Partners, LLC | 3 | 0 | ||||||
| 2026-02-17 | 13F | Boothbay Fund Management, Llc | Put | 22.800 | 3.793 | |||||
| 2026-02-11 | 13F | Hughes Financial Services, LLC | 8 | 0,00 | 1 | 0,00 | ||||
| 2026-02-17 | 13F | Boothbay Fund Management, Llc | 43.998 | 44,55 | 7.320 | 22,82 | ||||
| 2026-02-17 | 13F | Tcw Group Inc | 5.255 | 874 | ||||||
| 2026-01-12 | 13F | Rialto Wealth Management, LLC | 59 | 10 | ||||||
| 2026-01-16 | 13F | Beaumont Financial Advisors, LLC | 0 | -100,00 | 0 | |||||
| 2026-02-17 | 13F | XTX Topco Ltd | 1.551 | -87,40 | 258 | -89,29 | ||||
| 2026-02-11 | 13F | Allianz Asset Management GmbH | 12.727 | -72,28 | 2.117 | -76,45 | ||||
| 2026-02-12 | 13F | Swiss National Bank | 364.364 | 41,45 | 60.616 | 20,18 | ||||
| 2026-03-31 | 13F | Sankala Group LLC | 30 | 0,00 | 3 | 0,00 | ||||
| 2026-02-17 | 13F | Polar Capital Holdings Plc | 684.453 | 120,35 | 113.866 | 87,22 | ||||
| 2026-02-10 | 13F | Evolution Wealth Management Inc. | 25 | 0,00 | 4 | 0,00 | ||||
| 2026-04-15 | 13F | Seacrest Wealth Management, Llc | 0 | -100,00 | 0 | |||||
| 2026-02-12 | 13F | Dimensional Fund Advisors Lp | 236.670 | -2,79 | 39.404 | -17,37 | ||||
| 2026-02-13 | 13F | FORA Capital, LLC | 1.283 | -96,15 | 346 | -94,71 | ||||
| 2026-02-13 | 13F | Transamerica Financial Advisors, Inc. | 24 | 4 | ||||||
| 2026-02-12 | 13F | Advisors Asset Management, Inc. | 1.053 | 45,64 | 175 | 24,11 | ||||
| 2026-01-29 | 13F | UBS Group AG | Put | 189.900 | -47,38 | 31.592 | -55,30 | |||
| 2026-04-13 | 13F | Mather Group, Llc. | 109 | 12 | ||||||
| 2026-01-29 | 13F | UBS Group AG | Call | 59.500 | -6,27 | 9.898 | -20,36 | |||
| 2026-02-17 | 13F | Quantinno Capital Management LP | 28.140 | 39,37 | 4.681 | 18,42 | ||||
| 2026-01-29 | 13F | UBS Group AG | 1.553.956 | 87,95 | 258.516 | 59,69 | ||||
| 2026-02-10 | 13F | Savant Capital, LLC | 3.267 | 117,37 | 543 | 84,69 | ||||
| 2026-01-30 | 13F | FengHe Fund Management Pte. Ltd. | 120.980 | -62,66 | 20.126 | -68,28 | ||||
| 2026-02-10 | 13F | Fort Sheridan Advisors Llc | 0 | -100,00 | 0 | |||||
| 2026-02-13 | 13F | Candriam Luxembourg S.C.A. | 59.580 | 36,34 | 9.912 | 15,85 | ||||
| 2026-02-10 | 13F | Bruce G. Allen Investments, LLC | 13 | 0,00 | 2 | 0,00 | ||||
| 2026-02-13 | 13F | Aigen Investment Management, Lp | 0 | -100,00 | 0 | |||||
| 2026-02-17 | 13F | Balyasny Asset Management Llc | Put | 2.600 | -88,98 | 433 | -90,65 | |||
| 2026-02-17 | 13F | Balyasny Asset Management Llc | Call | 4.400 | 732 | |||||
| 2025-11-12 | 13F | Aster Capital Management (DIFC) Ltd | 0 | -100,00 | 0 | -100,00 | ||||
| 2026-04-16 | 13F | Davis Capital Management | 2 | 0,00 | 0 | |||||
| 2026-02-13 | 13F | Blueshift Asset Management, LLC | 2.203 | 366 | ||||||
| 2026-02-17 | 13F | Snowden Capital Advisors LLC | 5.742 | -36,08 | 955 | -45,68 | ||||
| 2026-01-29 | 13F | D.a. Davidson & Co. | 3.744 | 164,78 | 623 | 125,36 | ||||
| 2026-02-13 | 13F | Kestra Advisory Services, LLC | 0 | -100,00 | 0 | |||||
| 2026-02-17 | 13F | Jump Financial, LLC | 13.546 | -91,76 | 2.254 | -93,00 | ||||
| 2026-01-23 | 13F | Optima Capital Llc | 11 | 2 | ||||||
| 2026-04-13 | 13F | Massmutual Trust Co Fsb/adv | 183 | 5,78 | 20 | -28,57 | ||||
| 2026-02-17 | 13F | Worldquant Millennium Advisors Llc | 0 | -100,00 | 0 | |||||
| 2026-02-12 | 13F | Hollencrest Capital Management | 220 | -62,33 | 37 | -68,42 | ||||
| 2026-02-13 | 13F | Marathon Trading Investment Management LLC | 137 | 12,30 | 23 | -4,35 | ||||
| 2026-02-05 | 13F | Plante Moran Financial Advisors, LLC | 2 | 0,00 | 0 | |||||
| 2026-02-14 | 13F | Shannon River Fund Management LLC | 167.641 | 27.889 | ||||||
| 2026-04-20 | 13F | Legal Advantage Investments, Inc. | 4.500 | 493 | ||||||
| 2026-04-13 | 13F | St Germain D J Co Inc | 195 | 21 | ||||||
| 2026-02-12 | 13F | CIBC Private Wealth Group, LLC | 29.714 | 272,40 | 4.943 | 216,45 | ||||
| 2026-04-10 | 13F | Linden Thomas Advisory Services, LLC | 37.931 | -27,77 | 4.157 | -52,41 | ||||
| 2026-02-17 | 13F | Tower Research Capital LLC (TRC) | 25.501 | 4.544,99 | 4.242 | 3.864,49 | ||||
| 2026-02-13 | 13F | Fieldview Capital Management, LLC | 0 | -100,00 | 0 | |||||
| 2026-02-18 | 13F | Mackenzie Financial Corp | 9.269 | 9,12 | 1.580 | -4,99 | ||||
| 2026-02-17 | 13F | Voleon Capital Management Lp | 135.705 | 45,33 | 22.576 | 23,48 | ||||
| 2026-02-17 | 13F | MIRAE ASSET GLOBAL ETFS HOLDINGS Ltd. | 33.646 | 4.169,80 | 5.600 | 3.536,36 | ||||
| 2026-04-21 | 13F | LCM Capital Management Inc | 0 | -100,00 | 0 | |||||
| 2026-01-20 | 13F | Stratos Wealth Partners, LTD. | 24.565 | 20,06 | 4.087 | 2,00 | ||||
| 2026-02-12 | 13F | Andra AP-fonden | 35.205 | 5.857 | ||||||
| 2026-02-06 | 13F | Handelsbanken Fonder AB | 40.000 | -68,30 | 7 | -75,00 | ||||
| 2026-02-11 | 13F | Illinois Municipal Retirement Fund | 4.850 | 807 | ||||||
| 2026-04-07 | 13F | Signaturefd, Llc | 2.332 | 154,86 | 256 | 67,76 | ||||
| 2026-02-17 | 13F | Scarborough Advisors, LLC | 0 | -100,00 | 0 | |||||
| 2026-01-30 | 13F | Archer Investment Corp | 63 | -7,35 | 10 | -23,08 | ||||
| 2025-10-30 | 13F | Twin Peaks Wealth Advisors, LLC | 0 | -100,00 | 0 | |||||
| 2026-04-20 | 13F | Banque Cantonale Vaudoise | 6.990 | 85,85 | 766 | 22,36 | ||||
| 2026-02-17 | 13F | Maryland State Retirement & Pension System | 6.283 | 0,00 | 1.045 | -15,04 | ||||
| 2026-04-08 | 13F | Violich Capital Management, Inc. | 3.000 | 0,00 | 329 | -34,27 | ||||
| 2026-02-10 | 13F | Bank of New York Mellon Corp | 501.442 | -2,19 | 83.420 | -16,90 | ||||
| 2025-11-14 | 13F | Wellington Management Group Llp | Put | 0 | -100,00 | 0 | -100,00 | |||
| 2026-04-24 | 13F | Keybank National Association/oh | 0 | -100,00 | 0 | |||||
| 2026-02-17 | 13F | National Asset Management, Inc. | 0 | -100,00 | 0 | -100,00 | ||||
| 2026-02-17 | 13F | Price T Rowe Associates Inc /md/ | 1.164.414 | 162,51 | 194 | 124,42 | ||||
| 2025-11-19 | 13F | Caitong International Asset Management Co., Ltd | 0 | -100,00 | 0 | |||||
| 2025-11-14 | 13F | Cubist Systematic Strategies, LLC | Call | 56.300 | -66,69 | 11.024 | -27,86 | |||
| 2026-02-13 | 13F | Baird Financial Group, Inc. | 0 | -100,00 | 0 | |||||
| 2025-11-14 | 13F | Cubist Systematic Strategies, LLC | Put | 59.000 | 31,40 | 11.552 | 184,60 | |||
| 2026-02-13 | 13F | GM Advisory Group, Inc. | 4.555 | -22,59 | 758 | -34,29 | ||||
| 2026-04-22 | 13F | Straight Path Wealth Management | 6.250 | -7,41 | 685 | -38,95 | ||||
| 2026-02-17 | 13F | Glenmede Trust Co Na | 1.858 | 309 | ||||||
| 2026-02-13 | 13F | Silicon Valley Capital Partners | 300 | 50 | ||||||
| 2026-02-17 | 13F | Artisan Partners Limited Partnership | 895.530 | 148.980 | ||||||
| 2026-02-17 | 13F | TCG Advisory Services, LLC | Call | 5.000 | 832 | |||||
| 2026-02-12 | 13F | Nuveen, LLC | 262.696 | -2,30 | 43.702 | -16,99 | ||||
| 2026-02-17 | 13F | TCG Advisory Services, LLC | 3.311 | 75,65 | 551 | 49,05 | ||||
| 2026-02-17 | 13F | Grand Alliance Asset Management Ltd | 38.802 | -82,21 | 6.455 | -84,89 | ||||
| 2026-02-17 | 13F | Boothbay Fund Management, Llc | Call | 0 | -100,00 | 0 | ||||
| 2026-01-30 | 13F | Trifecta Capital Advisors, LLC | 328 | 0,00 | 55 | -15,62 | ||||
| 2026-02-02 | 13F | Truist Financial Corp | 38.603 | 10,10 | 6.422 | -6,45 | ||||
| 2026-04-22 | 13F | JNBA Financial Advisors | 9 | 0,00 | 1 | -100,00 | ||||
| 2026-02-11 | 13F | Mandatum Life Insurance Co Ltd | 0 | -100,00 | 0 | |||||
| 2026-02-09 | 13F | Putnam Fl Investment Management Co | 20.063 | 116,57 | 3.338 | 84,06 | ||||
| 2026-03-02 | 13F | Reflection Asset Management | 151 | 25 | ||||||
| 2026-04-16 | 13F | SG Americas Securities, LLC | 15.590 | -66,63 | 2 | -85,71 | ||||
| 2026-01-27 | 13F | Lecap Asset Management Ltd | 0 | -100,00 | 0 | |||||
| 2026-02-13 | 13F | Integrated Wealth Concepts LLC | 0 | -100,00 | 0 | |||||
| 2025-11-17 | 13F | Kestra Investment Management, LLC | 0 | -100,00 | 0 | -100,00 | ||||
| 2026-02-17 | 13F | EFG International AG | 61.672 | 10.261 | ||||||
| 2026-02-09 | 13F | Mediolanum International Funds Ltd | 19.637 | 3.355 | ||||||
| 2025-11-14 | 13F | Bridgefront Capital, LLC | 0 | -100,00 | 0 | -100,00 | ||||
| 2025-11-06 | 13F | Public Sector Pension Investment Board | 0 | -100,00 | 0 | |||||
| 2026-01-09 | 13F | Dynamic Advisor Solutions LLC | 0 | -100,00 | 0 | |||||
| 2026-01-12 | 13F | Paragon Advisors, LLC | 16.732 | 79,11 | 2.784 | 52,16 | ||||
| 2026-04-24 | 13F | Strs Ohio | 33.086 | 996,29 | 3.626 | 622,31 | ||||
| 2026-02-03 | 13F | Crossmark Global Holdings, Inc. | 1.471 | 9,69 | 245 | -6,87 | ||||
| 2025-11-06 | 13F | Bryce Point Capital, LLC | 3.117 | 610 | ||||||
| 2026-02-13 | 13F | Neuberger Berman Group LLC | 522.710 | 83,89 | 86.958 | 56,24 | ||||
| 2026-02-12 | 13F | BRYN MAWR TRUST Co | 11.250 | 50,00 | 1.872 | 27,45 | ||||
| 2026-02-12 | 13F | MetLife Investment Management, LLC | 8.136 | 0,87 | 1.354 | -14,31 | ||||
| 2026-02-13 | 13F | Mml Investors Services, Llc | 25.644 | 38,87 | 4.266 | 18,01 | ||||
| 2026-02-10 | 13F | Verus Capital Partners, Llc | 3.308 | 61,92 | 550 | 37,50 | ||||
| 2026-02-09 | 13F | Integrity Alliance, Llc. | 2.320 | -3,41 | 386 | -18,09 | ||||
| 2026-02-09 | 13F | Integrity Alliance, Llc. | Call | 1.200 | 200 | |||||
| 2026-02-02 | 13F | Fifth Third Bancorp | 44 | 1.366,67 | 7 | |||||
| 2026-02-11 | 13F | Straight Path Wealth Management | Call | 0 | -100,00 | 0 | -100,00 | |||
| 2026-02-13 | 13F | Mariner, LLC | 9.697 | -51,94 | 1.614 | -59,16 | ||||
| 2026-02-14 | 13F | Rockefeller Capital Management L.P. | 20.526 | -0,04 | 3.415 | -15,05 | ||||
| 2026-01-23 | 13F | Baillie Gifford & Co | 252.913 | 9,59 | 42.075 | -6,89 | ||||
| 2026-02-17 | 13F | KADENSA CAPITAL Ltd | 0 | -100,00 | 0 | |||||
| 2026-01-07 | 13F | Aventura Private Wealth, LLC | 200 | 0,00 | 33 | -15,38 | ||||
| 2026-02-11 | 13F | Ramirez Asset Management, Inc. | 300 | 50 | ||||||
| 2026-02-06 | 13F | Axxcess Wealth Management, Llc | 6.387 | -53,00 | 1.063 | -60,08 | ||||
| 2026-02-13 | 13F | Pinnacle Wealth Planning Services, Inc. | 41 | 7 | ||||||
| 2026-04-15 | 13F | Norden Group Llc | 2.433 | 87,30 | 267 | 23,15 | ||||
| 2026-02-18 | 13F | GWM Advisors LLC | 15.627 | 178,71 | 1.874 | 70,83 | ||||
| 2026-02-13 | 13F | Tairen Capital Ltd | 55.213 | 163,55 | 9.185 | 123,92 | ||||
| 2026-02-11 | 13F | Arrowpoint Investment Partners (Singapore) Pte. Ltd. | 0 | -100,00 | 0 |
Other Listings
| US:ALAB | 212,84 $ |