Grundlæggende statistik
| Institutionelle aktier (lange) | 124.129.277 - 22,47% (ex 13D/G) - change of 20,17MM shares 19,40% MRQ |
| Institutionel værdi (lang) | $ 220.986 USD ($1000) |
Institutionelt ejerskab og aktionærer
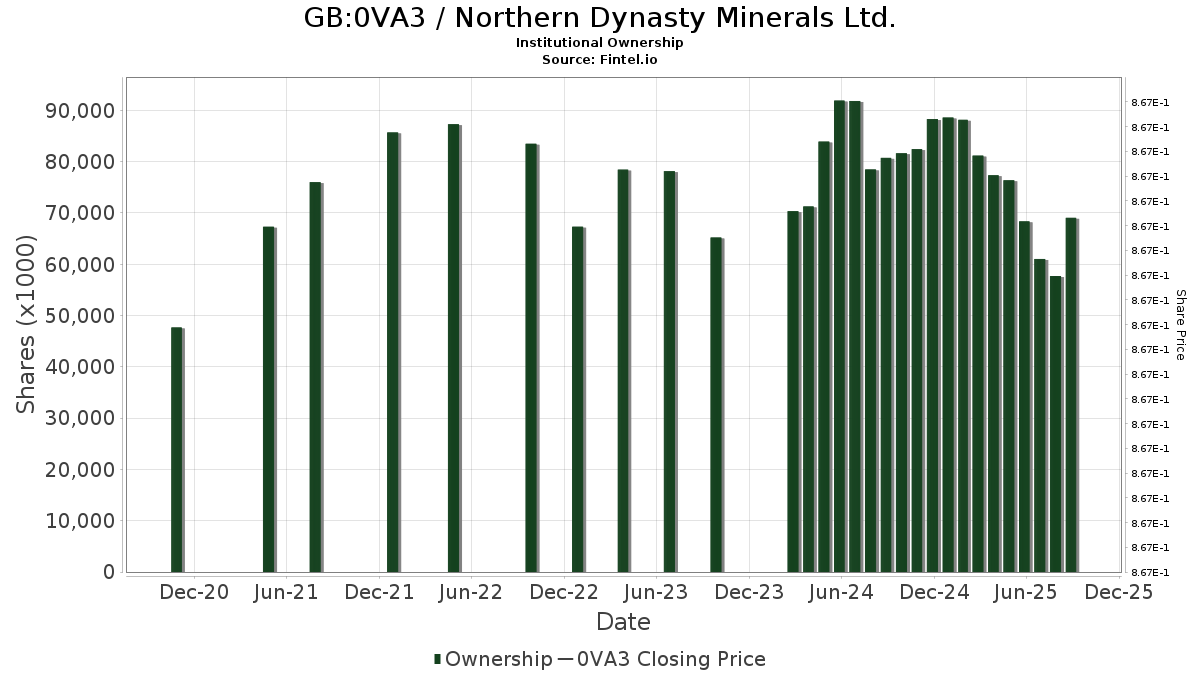
Northern Dynasty Minerals Ltd. (GB:0VA3) har 180 institutionelle ejere og aktionærer, der har indsendt 13D/G- eller 13F-formularer til Securities Exchange Commission (SEC). Disse institutioner har i alt 124,129,277 aktier. Største aktionærer omfatter Kopernik Global Investors, LLC, MIRAE ASSET GLOBAL ETFS HOLDINGS Ltd., Millennium Management Llc, COPX - Global X Copper Miners ETF, Jane Street Group, Llc, Two Sigma Investments, Lp, KGGAX - KOPERNIK GLOBAL ALL-CAP FUND CLASS A SHARES, Bornite Capital Management LP, GAM Holding AG, and Susquehanna International Group, Llp .
Northern Dynasty Minerals Ltd. (LSE:0VA3) institutionel ejerskabsstruktur viser aktuelle positioner i virksomheden efter institutioner og fonde, samt seneste ændringer i positionsstørrelse. Større aktionærer kan omfatte individuelle investorer, investeringsforeninger, hedgefonde eller institutioner. Skema 13D angiver, at investoren besidder (eller besidder) mere end 5 % af virksomheden og har til hensigt (eller har til hensigt at) aktivt at forfølge en ændring i forretningsstrategi. Skema 13G indikerer en passiv investering på over 5%.
The share price as of March 13, 2026 is 1,83 / share. Previously, on March 17, 2025, the share price was 1,04 / share. This represents an increase of 76,81% over that period.
Fondens stemningsscore
Fund Sentiment Score (fka Ownership Accumulation Score) finder de aktier, der bliver mest købt af fonde. Det er resultatet af en sofistikeret, multi-faktor kvantitativ model, der identificerer virksomheder med de højeste niveauer af institutionel akkumulering. Scoringsmodellen bruger en kombination af den samlede stigning i oplyste ejere, ændringerne i porteføljeallokeringer i disse ejere og andre målinger. Tallet går fra 0 til 100, hvor højere tal indikerer et højere niveau af akkumulering for sine jævnaldrende, og 50 er gennemsnittet.
Opdateringsfrekvens: Dagligt
Se Ownership Explorer, som giver en liste over højest rangerende virksomheder.
AI+ Ask Fintel’s AI assistant about Northern Dynasty Minerals Ltd..
Select a question to share a public post with an AI-crafted answer.
Thinking of good questions…
13F og NPORT arkivering
Detaljer om 13F-arkivering er gratis. Detaljer om NP-ansøgninger kræver et premium-medlemskab. Grønne rækker angiver nye positioner. Røde rækker angiver lukkede positioner. Klik på linket ikon for at se den fulde transaktionshistorik.
Opgrader
for at låse premium-data op og eksportere til Excel ![]() .
.
| Fil dato | Kilde | Investor | Type | Gennemsnitlig pris (Øst) |
Aktier | Δ Aktier (%) |
Rapporteret Værdi ($1000) |
Δ Værdi (%) |
Port Alloc (%) |
|
|---|---|---|---|---|---|---|---|---|---|---|
| 2026-02-12 | 13F | United Capital Management of KS, Inc. | 0 | -100,00 | 0 | -100,00 | ||||
| 2026-01-26 | 13F | PFG Investments, LLC | 13.081 | -37,95 | 26 | 0,00 | ||||
| 2026-02-17 | 13F | GAM Holding AG | 3.626.000 | 4,52 | 7.143 | 71,62 | ||||
| 2025-11-12 | 13F | Creekmur Asset Management LLC | 73 | 0 | ||||||
| 2026-02-12 | 13F | Marex Group plc | 0 | -100,00 | 0 | -100,00 | ||||
| 2026-02-17 | 13F | LMR Partners LLP | Put | 203.700 | 401 | |||||
| 2026-02-17 | 13F | LMR Partners LLP | Call | 2.000.000 | 33,33 | 3.940 | 118,89 | |||
| 2026-01-07 | 13F | Brady Family Wealth, Llc | 110.000 | 0,00 | 217 | 63,64 | ||||
| 2026-02-10 | 13F | Td Asset Management Inc | 747.342 | 8,15 | 1.472 | 75,45 | ||||
| 2026-02-05 | 13F | Allworth Financial LP | 19.392 | 38 | ||||||
| 2026-02-09 | 13F | Integrity Alliance, Llc. | 13.900 | -0,71 | 27 | 68,75 | ||||
| 2026-02-13 | 13F | Kopernik Global Investors, LLC | 21.661.178 | 0,00 | 42.673 | 64,17 | ||||
| 2026-02-17 | 13F | Two Sigma Securities, Llc | 32.119 | -20,74 | 63 | 31,25 | ||||
| 2025-11-12 | 13F | Simplex Trading, Llc | 0 | -100,00 | 0 | |||||
| 2026-02-13 | 13F | Baird Financial Group, Inc. | 30.600 | 0,00 | 60 | 66,67 | ||||
| 2026-02-19 | 13F | CI Private Wealth, LLC | 13.250 | 0,00 | 26 | 73,33 | ||||
| 2026-02-12 | 13F | Bank Of Montreal /can/ | Call | 1.000 | 0,00 | 2 | 0,00 | |||
| 2026-02-17 | 13F/A | BluePath Capital Management, LLC | 0 | -100,00 | 0 | -100,00 | ||||
| 2026-02-12 | 13F | Bank Of Montreal /can/ | 138.089 | -46,37 | 272 | -13,14 | ||||
| 2026-02-03 | 13F | Grimes & Company, Inc. | 189.750 | 0,00 | 374 | 64,32 | ||||
| 2025-10-23 | 13F | SG Americas Securities, LLC | 0 | -100,00 | 0 | |||||
| 2025-11-12 | 13F | Kingsview Wealth Management, LLC | 0 | -100,00 | 0 | -100,00 | ||||
| 2026-01-22 | 13F | True North Advisors, LLC | 22.750 | -30,53 | 45 | 12,82 | ||||
| 2026-02-06 | 13F | Global Retirement Partners, LLC | 2.000 | 4 | ||||||
| 2026-02-13 | 13F | Caitong International Asset Management Co., Ltd | 43.095 | 6.449,39 | 85 | |||||
| 2026-02-02 | 13F | Allegheny Financial Group LTD | 52.100 | 0,00 | 103 | 64,52 | ||||
| 2026-02-13 | 13F | Citigroup Inc | 177 | -95,29 | 0 | -100,00 | ||||
| 2026-01-16 | 13F | Perigon Wealth Management, LLC | 216.100 | 13,74 | 426 | 86,40 | ||||
| 2026-02-10 | 13F | Resolute Capital, Llc | 16.600 | 33 | ||||||
| 2026-02-17 | 13F | Ionic Capital Management LLC | 309.000 | -40,29 | 609 | -2,09 | ||||
| 2026-01-22 | 13F | Brookwood Investment Group LLC | 0 | -100,00 | 0 | -100,00 | ||||
| 2026-02-13 | 13F | Wexford Capital Lp | 0 | -100,00 | 0 | -100,00 | ||||
| 2025-11-14 | 13F | Cubist Systematic Strategies, LLC | 0 | -100,00 | 0 | -100,00 | ||||
| 2026-02-13 | 13F | Arkadios Wealth Advisors | 10.000 | 0,00 | 20 | 58,33 | ||||
| 2026-02-17 | 13F | Russell Investments Group, Ltd. | 3.483.982 | -27,57 | 6.863 | 18,78 | ||||
| 2026-01-29 | 13F | Wealth Alliance Advisory Group, LLC | 15.000 | 0,00 | 30 | 61,11 | ||||
| 2026-02-12 | 13F | IFC & Insurance Marketing, Inc. | 5.000 | 0 | ||||||
| 2026-01-26 | 13F | Prairiewood Capital, LLC | 20.000 | 0,00 | 39 | 62,50 | ||||
| 2026-01-20 | 13F | Independence Bank of Kentucky | 525 | 1 | ||||||
| 2025-09-26 | NP | RMYAX - Multi-Strategy Income Fund Class A | 54.271 | 0,00 | 43 | -32,26 | ||||
| 2026-02-13 | 13F | Acumen Wealth Advisors, LLC | 3.000 | 6 | ||||||
| 2026-01-14 | 13F | Game Plan Financial Advisors, LLC | 45.000 | -43,04 | 89 | -6,38 | ||||
| 2026-02-06 | 13F | GPS Wealth Strategies Group, LLC | 0 | -100,00 | 0 | -100,00 | ||||
| 2025-11-14 | 13F | J. Goldman & Co LP | 0 | -100,00 | 0 | -100,00 | ||||
| 2026-02-09 | 13F | Allium Financial Advisors, Llc | 35.000 | 7,69 | 69 | 74,36 | ||||
| 2026-01-13 | 13F | Scratch Capital Llc | 32.434 | -39,01 | 64 | 0,00 | ||||
| 2026-02-13 | 13F | Tcfg Wealth Management, Llc | 24.600 | 0,00 | 48 | 65,52 | ||||
| 2026-02-13 | 13F | National Bank Of Canada /fi/ | 9.835 | -36,52 | 18 | -5,26 | ||||
| 2025-11-14 | 13F | Tower Research Capital LLC (TRC) | 0 | -100,00 | 0 | -100,00 | ||||
| 2025-11-25 | 13F | Briaud Financial Planning, Inc | 0 | -100,00 | 0 | |||||
| 2026-02-03 | 13F | SBI Securities Co., Ltd. | 29.417 | -3,45 | 58 | 58,33 | ||||
| 2026-01-08 | 13F | Wealth Enhancement Advisory Services, Llc | 32.121 | 75,33 | 71 | 105,88 | ||||
| 2026-01-26 | 13F | Cwm, Llc | 129 | -93,55 | 0 | |||||
| 2026-02-09 | 13F | Cary Street Partners Financial Llc | 41.000 | 13,89 | 81 | 86,05 | ||||
| 2026-02-17 | 13F/A | Kovack Advisors, Inc. | 13.500 | 27 | ||||||
| 2026-02-17 | 13F | SIH Partners, LLLP | 51.666 | 102 | ||||||
| 2026-02-10 | 13F | Goldman Sachs Group Inc | 231.823 | 97,12 | 457 | 223,40 | ||||
| 2026-02-02 | 13F | Miracle Mile Advisors, LLC | 85.955 | 0,00 | 169 | 64,08 | ||||
| 2026-02-13 | 13F | Kestra Advisory Services, LLC | 25.290 | 13,46 | 50 | 88,46 | ||||
| 2026-01-21 | 13F | OLIO Financial Planning | 22.420 | 44 | ||||||
| 2026-02-11 | 13F | Group One Trading, L.p. | Call | 1.617.100 | -19,86 | 3.186 | 31,56 | |||
| 2026-02-11 | 13F | Group One Trading, L.p. | Put | 619.300 | -26,74 | 1.220 | 20,32 | |||
| 2026-02-11 | 13F | LPL Financial LLC | 140.553 | 1,15 | 277 | 66,27 | ||||
| 2026-02-12 | 13F | Jane Street Group, Llc | Call | 542.700 | -31,36 | 1.069 | 12,76 | |||
| 2026-02-11 | 13F | Group One Trading, L.p. | 690.190 | 283,40 | 1.360 | 529,17 | ||||
| 2026-02-12 | 13F | Jane Street Group, Llc | 7.955.282 | 349,74 | 15.672 | 638,50 | ||||
| 2026-02-12 | 13F | Jane Street Group, Llc | Put | 84.500 | -23,94 | 166 | 24,81 | |||
| 2026-02-10 | 13F | Connor, Clark & Lunn Investment Management Ltd. | 0 | -100,00 | 0 | -100,00 | ||||
| 2026-02-18 | 13F | GWM Advisors LLC | 23.834 | 47 | ||||||
| 2026-02-13 | 13F | Centiva Capital, LP | Call | 1.990.500 | 3.921 | |||||
| 2026-02-13 | 13F | Centiva Capital, LP | Put | 369.400 | 728 | |||||
| 2026-02-12 | 13F | Bank Of Montreal /can/ | Put | 0 | -100,00 | 0 | -100,00 | |||
| 2026-02-17 | 13F | Lazard Asset Management Llc | 16.304 | 32 | ||||||
| 2025-09-26 | NP | KGGAX - KOPERNIK GLOBAL ALL-CAP FUND CLASS A SHARES | 5.684.516 | -0,97 | 4.486 | -32,06 | ||||
| 2026-02-18 | 13F | Mackenzie Financial Corp | 1.216.148 | -26,58 | 2.410 | 19,84 | ||||
| 2026-02-12 | 13F | Quadrant Capital Group Llc | 3.496 | 165,86 | 7 | 500,00 | ||||
| 2025-11-14 | 13F | Point72 Asia (Singapore) Pte. Ltd. | 0 | -100,00 | 0 | -100,00 | ||||
| 2026-01-20 | 13F | Stratos Wealth Advisors, LLC | 98.788 | -27,72 | 195 | 18,29 | ||||
| 2026-01-16 | 13F | FNY Investment Advisers, LLC | Call | 0 | -100,00 | 0 | ||||
| 2026-02-12 | 13F | Hrt Financial Lp | 0 | -100,00 | 0 | -100,00 | ||||
| 2025-11-12 | 13F | Aletheian Wealth Advisors LLC | 168.200 | 54,03 | 202 | 37,67 | ||||
| 2025-11-06 | 13F | Prospect Financial Group LLC | 0 | -100,00 | 0 | -100,00 | ||||
| 2026-01-15 | 13F | Brookstone Capital Management | 12.982 | 26 | ||||||
| 2026-02-13 | 13F | MAI Capital Management | 666 | 0,00 | 1 | |||||
| 2026-01-29 | 13F | Nbc Securities, Inc. | 500 | 0,00 | 1 | |||||
| 2026-02-13 | 13F | Sei Investments Co | 1.835.833 | 0,00 | 3.617 | 64,14 | ||||
| 2026-02-17 | 13F | Graham Capital Management, L.P. | 0 | -100,00 | 0 | |||||
| 2025-11-07 | 13F | CenterBook Partners LP | 2.036.478 | 2.444 | ||||||
| 2026-02-23 | 13F | Virtu Financial LLC | 100.051 | 0 | ||||||
| 2026-01-22 | 13F | Financial Consulate, Inc | 1.000 | 2 | ||||||
| 2026-01-23 | 13F | Webster Bank, N. A. | 15.000 | 30 | ||||||
| 2026-02-17 | 13F | Pentwater Capital Management LP | 0 | -100,00 | 0 | -100,00 | ||||
| 2026-02-17 | 13F | Private Advisor Group, LLC | 12.000 | -52,00 | 24 | -23,33 | ||||
| 2026-02-17 | 13F | Citadel Advisors Llc | 2.926.220 | -27,46 | 5.765 | 19,09 | ||||
| 2026-02-17 | 13F | Raymond James Financial Inc | 102.602 | 98,71 | 202 | 231,15 | ||||
| 2026-02-17 | 13F | Citadel Advisors Llc | Call | 1.444.500 | 240,44 | 2.846 | 458,94 | |||
| 2026-02-17 | 13F | MIRAE ASSET GLOBAL ETFS HOLDINGS Ltd. | 17.166.767 | 21,85 | 33.814 | 97,63 | ||||
| 2026-02-17 | 13F | Citadel Advisors Llc | Put | 928.800 | 46,11 | 1.830 | 140,03 | |||
| 2026-02-17 | 13F | Bank Of America Corp /de/ | 243.247 | -18,28 | 479 | 34,17 | ||||
| 2025-11-07 | 13F | Wealth Alliance | 0 | -100,00 | 0 | -100,00 | ||||
| 2026-02-06 | 13F | Advisory Alpha, LLC | 10.958 | -59,85 | 22 | -36,36 | ||||
| 2026-02-05 | 13F | 626 Financial, LLC | 30.200 | 0,00 | 59 | 63,89 | ||||
| 2026-02-13 | 13F | Evelyn Partners Investment Management LLP | 1.200 | 0,00 | 2 | 100,00 | ||||
| 2025-11-12 | 13F | Tumwater Wealth Management, LLC | 0 | -100,00 | 0 | -100,00 | ||||
| 2026-02-17 | 13F | XTX Topco Ltd | 31.651 | -85,17 | 62 | -75,78 | ||||
| 2026-01-15 | 13F | One + One Wealth Management, Llc | 26.008 | 61,54 | 51 | 168,42 | ||||
| 2026-01-28 | 13F | Loring Wolcott & Coolidge Fiduciary Advisors Llp/ma | 3.000 | 0,00 | 8 | 40,00 | ||||
| 2026-02-17 | 13F | Two Sigma Investments, Lp | 6.316.087 | 184,64 | 12.443 | 367,39 | ||||
| 2025-11-03 | 13F | Ballentine Partners, LLC | 0 | -100,00 | 0 | -100,00 | ||||
| 2026-01-06 | 13F | Advance Capital Management, Inc. | 22.500 | 0,00 | 44 | 62,96 | ||||
| 2026-01-13 | 13F | CoreCap Advisors, LLC | 4.865 | 42,71 | 10 | 125,00 | ||||
| 2026-01-12 | 13F | Cullen Investment Group, Ltd. | 0 | -100,00 | 0 | -100,00 | ||||
| 2026-02-17 | 13F | Royal Bank Of Canada | 67.226 | -96,27 | 133 | -93,85 | ||||
| 2026-02-11 | 13F | Strategy Asset Managers Llc | 24.825 | -31,99 | 49 | 11,63 | ||||
| 2026-02-13 | 13F | Vivaldi Capital Management, LLC | 29.000 | -9,38 | 57 | 50,00 | ||||
| 2026-02-17 | 13F | Toronto Dominion Bank | 25.000 | 0,00 | 49 | 58,06 | ||||
| 2026-01-28 | 13F | Hoey Investments, Inc | 10.000 | 0,00 | 20 | 58,33 | ||||
| 2026-02-13 | 13F | Peak6 Llc | Call | 0 | -100,00 | 0 | -100,00 | |||
| 2026-01-29 | 13F | LCM Capital Management Inc | 244.388 | -11,58 | 481 | 45,32 | ||||
| 2026-01-30 | 13F | Us Bancorp \de\ | 1.000 | 0,00 | 2 | 0,00 | ||||
| 2026-02-17 | 13F | Caption Management, LLC | 390.000 | 680,00 | 768 | 1.180,00 | ||||
| 2026-02-17 | 13F | Caption Management, LLC | Call | 40.000 | -92,00 | 79 | -87,00 | |||
| 2026-02-06 | 13F | Keystone Financial Group | 18.000 | 80,00 | 35 | 169,23 | ||||
| 2026-02-13 | 13F | State Street Corp | 153.300 | 302 | ||||||
| 2026-02-02 | 13F | Holistic Planning, LLC | 11.000 | 0,00 | 22 | 61,54 | ||||
| 2026-02-17 | 13F | Dauntless Investment Group, LLC | 880 | -89,93 | 2 | -90,00 | ||||
| 2026-02-17 | 13F | Jones Financial Companies Lllp | 14.129 | 89,80 | 28 | 237,50 | ||||
| 2026-02-13 | 13F | Coco Enterprises, LLC | 0 | -100,00 | 0 | -100,00 | ||||
| 2026-02-17 | 13F | Cape Investment Advisory, Inc. | 500 | 1 | ||||||
| 2026-02-10 | 13F | CIBC World Markets Inc. | 17.534 | 71,90 | 35 | 183,33 | ||||
| 2026-02-03 | 13F | RFG Advisory, LLC | 202.490 | -0,25 | 399 | 63,79 | ||||
| 2025-10-08 | 13F | Fiduciary Alliance LLC | 0 | -100,00 | 0 | -100,00 | ||||
| 2026-02-02 | 13F | Pittenger & Anderson Inc | 40.750 | 80 | ||||||
| 2026-02-17 | 13F | Susquehanna International Group, Llp | Call | 3.601.600 | 149,61 | 7.095 | 309,88 | |||
| 2026-02-17 | 13F | Susquehanna International Group, Llp | 3.253.362 | 198,37 | 6.409 | 389,98 | ||||
| 2026-02-17 | 13F | Two Sigma Advisers, Lp | 2.550.496 | 207,85 | 5.024 | 405,43 | ||||
| 2026-02-17 | 13F | Susquehanna International Group, Llp | Put | 1.769.000 | 234,22 | 3.485 | 448,66 | |||
| 2026-01-29 | 13F | IMC-Chicago, LLC | Call | 705.900 | 74,55 | 1.391 | 186,60 | |||
| 2026-02-13 | 13F | Hudson Bay Capital Management LP | 225.000 | 443 | ||||||
| 2026-02-18 | 13F | Galaxy Group Investments LLC | Call | 150.000 | 405 | |||||
| 2026-01-06 | 13F | Doliver Advisors, Lp | 10.500 | 21 | ||||||
| 2026-02-03 | 13F | Sequoia Financial Advisors, LLC | 12.296 | 13,89 | 24 | 100,00 | ||||
| 2026-02-17 | 13F | Brevan Howard Capital Management LP | 271.200 | 194,80 | 541 | 391,82 | ||||
| 2026-02-05 | 13F | Cambridge Investment Research Advisors, Inc. | 537.657 | -16,46 | 1 | |||||
| 2026-01-27 | 13F | TD Waterhouse Canada Inc. | 11.000 | 4,76 | 21 | 75,00 | ||||
| 2026-02-11 | 13F | Janney Montgomery Scott LLC | 25.000 | 0,00 | 0 | |||||
| 2025-11-12 | 13F | Stifel Financial Corp | 0 | -100,00 | 0 | -100,00 | ||||
| 2026-01-13 | 13F | Dakota Wealth Management | 38.984 | -0,10 | 77 | 65,22 | ||||
| 2026-02-17 | 13F | Shay Capital LLC | Call | 25.500 | 50 | |||||
| 2026-02-17 | 13F | Captrust Financial Advisors | 52.399 | -29,41 | 103 | 15,73 | ||||
| 2026-02-12 | 13F | Hibernia Wealth Partners, LLC | 15.000 | 30 | ||||||
| 2026-01-29 | 13F | IMC-Chicago, LLC | 485.236 | 160,22 | 956 | 328,25 | ||||
| 2026-01-29 | 13F | IMC-Chicago, LLC | Put | 704.500 | 105,87 | 1.388 | 238,29 | |||
| 2026-02-04 | 13F | Ridgepath Capital Management LLC | 10.000 | 0,00 | 12 | 0,00 | ||||
| 2026-02-10 | 13F | Founders Financial Securities Llc | 19.000 | -43,19 | 37 | -7,50 | ||||
| 2026-01-16 | 13F | FNY Investment Advisers, LLC | 32.500 | -46,41 | 0 | |||||
| 2026-02-10 | 13F | Principia Wealth Advisory, LLC | 13.000 | -18,75 | 26 | 31,58 | ||||
| 2026-02-11 | 13F | Simplex Trading, Llc | Call | 0 | -100,00 | 0 | ||||
| 2026-02-11 | 13F | Simplex Trading, Llc | Put | 0 | -100,00 | 0 | ||||
| 2026-02-17 | 13F | Quadrature Capital Ltd | 601.180 | 1.184 | ||||||
| 2026-02-11 | 13F | Cookson Peirce & Co Inc | 12.479 | 0,00 | 25 | 71,43 | ||||
| 2026-02-17 | 13F | Advisory Services Network, LLC | 0 | -100,00 | 0 | |||||
| 2026-01-20 | 13F | Nvwm, Llc | 10.000 | 0,00 | 20 | 58,33 | ||||
| 2026-02-11 | 13F | Parallel Advisors, LLC | 6.422 | 52,90 | 13 | 140,00 | ||||
| 2026-02-11 | 13F | Empowered Funds, LLC | 73.781 | -33,72 | 145 | 9,02 | ||||
| 2026-02-17 | 13F | Hartree Partners, LP | 20.000 | 39 | ||||||
| 2026-02-06 | 13F | VSM Wealth Advisory, LLC | 1.176 | 0,00 | 2 | 100,00 | ||||
| 2026-02-10 | 13F | Quantbot Technologies LP | 0 | -100,00 | 0 | -100,00 | ||||
| 2025-11-12 | 13F | Aptus Capital Advisors, LLC | 0 | -100,00 | 0 | -100,00 | ||||
| 2026-02-05 | 13F | Baader Bank INC | 0 | -100,00 | 0 | -100,00 | ||||
| 2025-09-29 | NP | COPX - Global X Copper Miners ETF This fund is a listed as child fund of Mirae Asset Global Investments Co., Ltd. and if that institution has disclosed ownership in this security, then these positions will not be double counted when calculating total shares and total value | 11.325.800 | 674,52 | 8.847 | 429,13 | ||||
| 2026-02-17 | 13F | Gotham Asset Management, LLC | 22.978 | 45 | ||||||
| 2026-01-15 | 13F | Range Financial Group LLC | 50.000 | 0,00 | 98 | 63,33 | ||||
| 2026-01-20 | 13F | Investment Planning Advisors, Inc. | 13.400 | 26 | ||||||
| 2026-02-13 | 13F | Mariner, LLC | 0 | -100,00 | 0 | -100,00 | ||||
| 2025-10-15 | 13F | Plancorp, LLC | 0 | -100,00 | 0 | -100,00 | ||||
| 2026-02-17 | 13F | Aquatic Capital Management LLC | 2.216 | 4 | ||||||
| 2026-02-12 | 13F | BRYN MAWR TRUST Co | 0 | -100,00 | 0 | -100,00 | ||||
| 2026-02-10 | 13F | Sage Investment Advisers LLC | 26.000 | 100,00 | 51 | 1.175,00 | ||||
| 2026-02-13 | 13F | Morgan Stanley | 35.483 | -10,36 | 70 | 46,81 | ||||
| 2025-09-26 | NP | RAZAX - Multi-Asset Growth Strategy Fund Class A | 89.904 | 0,00 | 71 | -32,04 | ||||
| 2026-01-28 | 13F | Cadinha & Co Llc | 0 | -100,00 | 0 | -100,00 | ||||
| 2026-02-06 | 13F | Intrust Bank Na | 0 | -100,00 | 0 | -100,00 | ||||
| 2026-02-02 | 13F | SevenBridge Financial Group, LLC | 11.000 | 26 | ||||||
| 2026-02-13 | 13F | Rhumbline Advisers | 440 | 1 | ||||||
| 2026-01-29 | 13F | Quadcap Wealth Management, LLC | 8.600 | 0,00 | 17 | 60,00 | ||||
| 2026-02-12 | 13F | Federation des caisses Desjardins du Quebec | 78.850 | -39,51 | 153 | -3,18 | ||||
| 2026-02-06 | 13F | Creative Financial Designs Inc /adv | 1.100 | 0,00 | 2 | 100,00 | ||||
| 2026-01-16 | 13F | Ellsworth Advisors, LLC | 17.822 | 27,92 | 36 | 0,00 | ||||
| 2026-01-29 | 13F | Almanack Investment Partners, LLC. | 20.330 | 40 | ||||||
| 2026-02-13 | 13F | Squarepoint Ops LLC | 0 | -100,00 | 0 | -100,00 | ||||
| 2026-02-10 | 13F | Moors & Cabot, Inc. | 10.000 | 20 | ||||||
| 2026-01-27 | 13F | Financial Management Professionals, Inc. | 0 | -100,00 | 0 | -100,00 | ||||
| 2026-02-17 | 13F | Lakeshore Financial Planning, Inc. | 0 | -100,00 | 0 | |||||
| 2026-01-26 | 13F | Nations Financial Group Inc, /ia/ /adv | 418.300 | 0,00 | 824 | 64,47 | ||||
| 2026-02-18 | 13F | Vident Advisory, LLC | 19.514 | -2,18 | 38 | 65,22 | ||||
| 2026-01-21 | 13F | Sound Income Strategies, LLC | 5.000 | 0,00 | 10 | 0,00 | ||||
| 2026-02-13 | 13F | Aviso Financial Inc. | 190 | 0,00 | 0 | |||||
| 2026-02-17 | 13F | Cetera Investment Advisers | 99.557 | 14,15 | 196 | 88,46 | ||||
| 2026-01-26 | 13F | Independent Wealth Network Inc. | 15.670 | -0,38 | 31 | 66,67 | ||||
| 2026-01-09 | 13F | Silverlake Wealth Management Llc | 25.000 | 138,50 | 49 | 308,33 | ||||
| 2026-01-29 | 13F | Quadcap Wealth Management, LLC | Call | 3.000 | 0,00 | 6 | 66,67 | |||
| 2026-02-13 | 13F | Wells Fargo & Company/mn | 97.454 | -73,42 | 192 | -56,59 | ||||
| 2026-02-17 | 13F | LMR Partners LLP | 0 | -100,00 | 0 | -100,00 | ||||
| 2026-02-17 | 13F | Cantor Fitzgerald, L. P. | 0 | -100,00 | 0 | -100,00 | ||||
| 2026-01-30 | 13F | Pekin Hardy Strauss, Inc. | 75.000 | 0,00 | 148 | 63,33 | ||||
| 2026-02-06 | 13F | HighTower Advisors, LLC | 131.651 | -11,69 | 259 | 45,51 | ||||
| 2026-02-17 | 13F | Point72 Asset Management, L.P. | 769.596 | 1.517 | ||||||
| 2026-01-26 | 13F | Keystone Wealth Services, LLC | 0 | -100,00 | 0 | -100,00 | ||||
| 2025-11-14 | 13F | Wolverine Trading, Llc | 59.572 | 109,58 | 74 | 72,09 | ||||
| 2026-02-12 | 13F | Great Valley Advisor Group, Inc. | 17.880 | 0,00 | 35 | 66,67 | ||||
| 2025-11-14 | 13F | Wolverine Trading, Llc | Call | 269.900 | 19,16 | 337 | -3,16 | |||
| 2026-02-11 | 13F | Cerity Partners LLC | 79.526 | 6,03 | 157 | 73,33 | ||||
| 2025-11-14 | 13F | Wolverine Trading, Llc | Put | 86.400 | -31,37 | 108 | -44,04 | |||
| 2026-01-22 | 13F | HHM Wealth Advisors, LLC | 58.586 | 5,98 | 115 | 74,24 | ||||
| 2026-02-12 | 13F | Symphony Financial Services, Inc. | 0 | -100,00 | 0 | -100,00 | ||||
| 2025-11-13 | 13F | Visionary Wealth Advisors | 0 | -100,00 | 0 | -100,00 | ||||
| 2026-02-13 | 13F | Strategies Wealth Advisors, LLC | 10.000 | 0,00 | 20 | 58,33 | ||||
| 2026-02-13 | 13F | Islay Capital Management, Llc | 5.000 | 10 | ||||||
| 2026-02-13 | 13F | Walleye Capital LLC | 16.000 | 32 | ||||||
| 2026-01-30 | 13F | Kiker Wealth Management, LLC | 0 | -100,00 | 0 | -100,00 | ||||
| 2026-02-17 | 13F | Creative Planning | 33.045 | 23,87 | 65 | 103,13 | ||||
| 2026-01-08 | 13F | Versant Capital Management, Inc | 40.606 | 0,00 | 80 | 64,58 | ||||
| 2026-02-10 | 13F | Western Reserve Capital Management, LLC | 100.000 | 197 | ||||||
| 2026-02-17 | 13F | Advisor Group Holdings, Inc. | 108.774 | -0,64 | 214 | 100,00 | ||||
| 2026-01-26 | 13F | Merit Financial Group, LLC | 13.331 | 26 | ||||||
| 2026-02-17 | 13F | Wiley Bros.-aintree Capital, Llc | 30.000 | 0,00 | 59 | 63,89 | ||||
| 2026-01-29 | 13F | UBS Group AG | 900.199 | -21,08 | 1.773 | 29,61 | ||||
| 2026-02-10 | 13F | Belvedere Trading LLC | Put | 100 | 0 | |||||
| 2026-02-10 | 13F | Belvedere Trading LLC | Call | 10.500 | 21 | |||||
| 2026-02-13 | 13F | Bornite Capital Management LP | 5.385.000 | 10.608 | ||||||
| 2026-01-20 | 13F | Sheets Smith Wealth Management | 10.000 | 0,00 | 20 | 58,33 | ||||
| 2026-02-12 | 13F | Commonwealth Equity Services, Llc | 2.100.825 | -29,66 | 4.139 | 137.833,33 | ||||
| 2026-01-20 | 13F | Monticello Wealth Management, Llc | 10.500 | 0,00 | 21 | 66,67 | ||||
| 2026-02-17 | 13F | Sig Brokerage, Lp | 39.997 | 79 | ||||||
| 2026-02-20 | 13F | Sunbelt Securities, Inc. | 0 | -100,00 | 0 | |||||
| 2026-02-12 | 13F | BlackRock, Inc. | 100.942 | 881,35 | 199 | 1.550,00 | ||||
| 2026-02-10 | 13F | Belvedere Trading LLC | 772 | 2 | ||||||
| 2026-02-17 | 13F | Tudor Investment Corp Et Al | 80.000 | 158 | ||||||
| 2026-01-20 | 13F | Signaturefd, Llc | 3.955 | 58,20 | 8 | 133,33 | ||||
| 2026-02-09 | 13F | Harbour Investments, Inc. | 2.904 | 15,28 | 6 | 66,67 | ||||
| 2026-01-14 | 13F | ORG Partners LLC | 3.190 | -23,87 | 6 | 20,00 | ||||
| 2026-02-13 | 13F | American Century Companies Inc | 54.653 | 1,73 | 108 | 64,62 | ||||
| 2025-11-13 | 13F | Spark Investment Management LLC | 0 | -100,00 | 0 | |||||
| 2025-11-14 | 13F | Strategic Wealth Partners, Ltd. | 3.500 | -53,33 | 4 | -60,00 | ||||
| 2026-02-17 | 13F | Millennium Management Llc | 13.364.357 | 203,26 | 26.318 | 397,67 | ||||
| 2026-02-02 | 13F | Equitable Trust Co | 25.000 | 0,00 | 49 | 63,33 | ||||
| 2026-02-13 | 13F | Soros Fund Management Llc | 64.305 | 127 | ||||||
| 2026-02-12 | 13F | Steward Partners Investment Advisory, Llc | 6.818 | 0,00 | 13 | 62,50 | ||||
| 2026-02-13 | 13F | Marshall Wace, Llp | 65.805 | 130 |