Grundlæggende statistik
| Institutionelle ejere | 317 total, 306 long only, 3 short only, 8 long/short - change of -9,17% MRQ |
| Del pris | 3,53 |
| Gennemsnitlig porteføljeallokering | 0.3251 % - change of 3,40% MRQ |
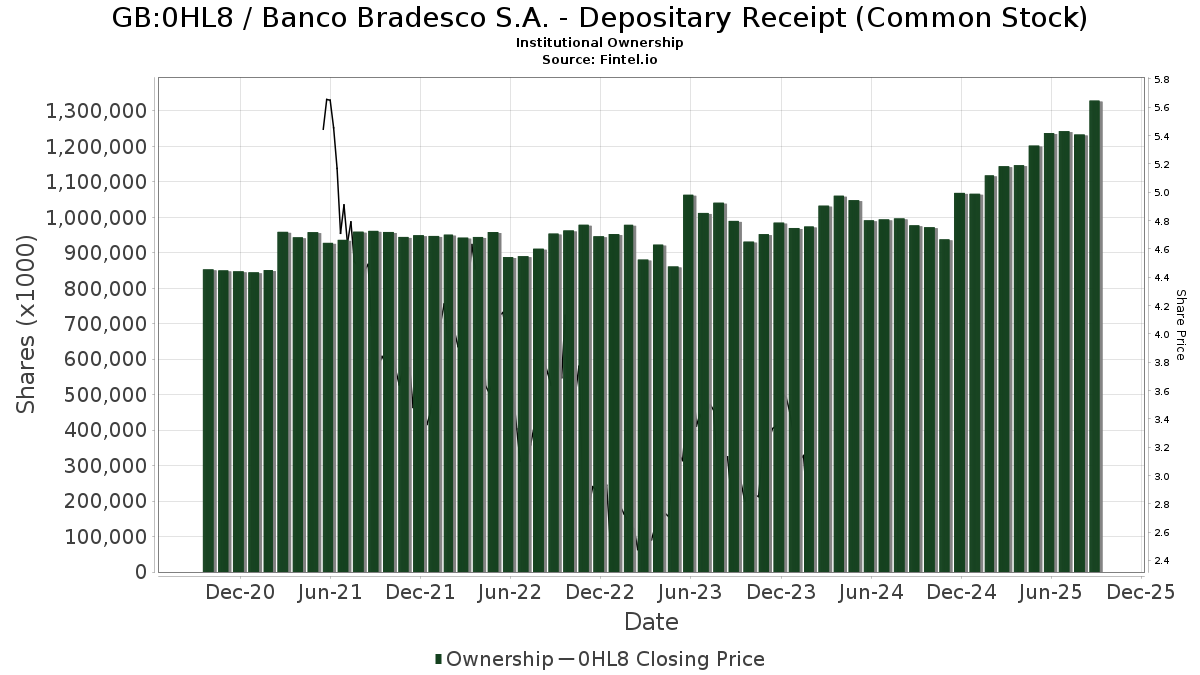
| Institutionelle aktier (lange) | 1.324.303.297 (ex 13D/G) - change of 53,06MM shares 4,17% MRQ |
| Institutionel værdi (lang) | $ 4.134.965 USD ($1000) |
Institutionelt ejerskab og aktionærer
Banco Bradesco S.A. - Depositary Receipt (Common Stock) (GB:0HL8) har 317 institutionelle ejere og aktionærer, der har indsendt 13D/G- eller 13F-formularer til Securities Exchange Commission (SEC). Disse institutioner har i alt 1,324,303,297 aktier. Største aktionærer omfatter Aquamarine Financial (Cayman) Ltd, ARGA Investment Management, LP, Arrowstreet Capital, Limited Partnership, Wellington Management Group Llp, Massachusetts Financial Services Co /ma/, Goldman Sachs Group Inc, Acadian Asset Management Llc, Fisher Asset Management, LLC, Franklin Resources Inc, and Itau Unibanco Holding S.A. .
Banco Bradesco S.A. - Depositary Receipt (Common Stock) (LSE:0HL8) institutionel ejerskabsstruktur viser aktuelle positioner i virksomheden efter institutioner og fonde, samt seneste ændringer i positionsstørrelse. Større aktionærer kan omfatte individuelle investorer, investeringsforeninger, hedgefonde eller institutioner. Skema 13D angiver, at investoren besidder (eller besidder) mere end 5 % af virksomheden og har til hensigt (eller har til hensigt at) aktivt at forfølge en ændring i forretningsstrategi. Skema 13G indikerer en passiv investering på over 5%.
The share price as of March 18, 2026 is 3,53 / share. Previously, on March 19, 2025, the share price was 2,25 / share. This represents an increase of 56,89% over that period.
Fondens stemningsscore
Fund Sentiment Score (fka Ownership Accumulation Score) finder de aktier, der bliver mest købt af fonde. Det er resultatet af en sofistikeret, multi-faktor kvantitativ model, der identificerer virksomheder med de højeste niveauer af institutionel akkumulering. Scoringsmodellen bruger en kombination af den samlede stigning i oplyste ejere, ændringerne i porteføljeallokeringer i disse ejere og andre målinger. Tallet går fra 0 til 100, hvor højere tal indikerer et højere niveau af akkumulering for sine jævnaldrende, og 50 er gennemsnittet.
Opdateringsfrekvens: Dagligt
Se Ownership Explorer, som giver en liste over højest rangerende virksomheder.
AI+ Ask Fintel’s AI assistant about Banco Bradesco S.A. - Depositary Receipt (Common Stock).
Select a question to share a public post with an AI-crafted answer.
Thinking of good questions…
13F og NPORT arkivering
Detaljer om 13F-arkivering er gratis. Detaljer om NP-ansøgninger kræver et premium-medlemskab. Grønne rækker angiver nye positioner. Røde rækker angiver lukkede positioner. Klik på linket ikon for at se den fulde transaktionshistorik.
Opgrader
for at låse premium-data op og eksportere til Excel ![]() .
.
| Fil dato | Kilde | Investor | Type | Gennemsnitlig pris (Øst) |
Aktier | Δ Aktier (%) |
Rapporteret Værdi ($1000) |
Δ Værdi (%) |
Port Alloc (%) |
|
|---|---|---|---|---|---|---|---|---|---|---|
| 2025-11-14 | 13F | Point72 (DIFC) Ltd | 4.313.538 | -29,53 | 14.580 | -22,92 | ||||
| 2025-09-25 | NP | EMGAX - Wells Fargo Emerging Markets Equity Fund Class A | 3.876.276 | 0,00 | 10.737 | 12,61 | ||||
| 2026-02-13 | 13F | Pathstone Holdings, LLC | 38.375 | -25,61 | 128 | -27,01 | ||||
| 2026-02-17 | 13F | Schonfeld Strategic Advisors LLC | 422.839 | 1.408 | ||||||
| 2026-02-06 | 13F | EverSource Wealth Advisors, LLC | 9.784 | 59,45 | 33 | 60,00 | ||||
| 2025-09-25 | NP | DFSE - Dimensional Emerging Markets Sustainability Core 1 ETF | 110.793 | 0,00 | 307 | 12,50 | ||||
| 2025-09-26 | NP | RGEAX - Global Equity Fund Class A | 1.457.548 | -10,78 | 4.037 | 0,47 | ||||
| 2026-02-17 | 13F | Point72 Asset Management, L.P. | 5.434.513 | 8,78 | 18.097 | 7,17 | ||||
| 2026-02-12 | 13F | Triumph Capital Management | 1.000 | 0,00 | 3 | 0,00 | ||||
| 2026-02-06 | 13F | Vestmark Advisory Solutions, Inc. | 28.931 | -27,03 | 96 | -28,36 | ||||
| 2025-09-25 | NP | DVRAX - MFS Global Alternative Strategy Fund A | 22.479 | 17,56 | 62 | 31,91 | ||||
| 2026-02-12 | 13F | Laurel Oak Wealth Management, Llc | 12.979 | 43 | ||||||
| 2026-02-13 | 13F | Ausdal Financial Partners, Inc. | 12.402 | -11,50 | 41 | -12,77 | ||||
| 2026-02-13 | 13F | Flow Traders U.s. Llc | 46.740 | 0 | ||||||
| 2025-09-25 | NP | DFEM - Dimensional Emerging Markets Core Equity 2 ETF | 921.201 | 14,82 | 2.552 | 29,30 | ||||
| 2026-02-03 | 13F | Ethic Inc. | 85.157 | -21,02 | 284 | -22,25 | ||||
| 2026-02-12 | 13F | BRYN MAWR TRUST Co | 0 | -100,00 | 0 | -100,00 | ||||
| 2026-02-13 | 13F | Ieq Capital, Llc | 21.188 | 5,28 | 71 | 2,94 | ||||
| 2026-02-10 | 13F | Goldman Sachs Group Inc | Put | 2.000.000 | 0,00 | 6.660 | -1,48 | |||
| 2026-02-13 | 13F | Nfj Investment Group, Llc | 378 | 0,00 | 1 | 0,00 | ||||
| 2026-02-10 | 13F | Goldman Sachs Group Inc | 56.652.203 | 23,08 | 188.652 | 21,26 | ||||
| 2026-02-19 | 13F | Invesco Ltd. | 1.045.543 | 44,17 | 3.482 | 42,02 | ||||
| 2026-02-17 | 13F | Aquatic Capital Management LLC | 2.615.049 | 18,18 | 8.708 | 16,43 | ||||
| 2026-02-13 | 13F | Stifel Financial Corp | 68.948 | -7,37 | 230 | -8,76 | ||||
| 2025-11-12 | 13F | Capital Markets Trading UK LLP | 0 | -100,00 | 0 | |||||
| 2026-01-27 | 13F | Acuitas Investments, LLC | 0 | -100,00 | 0 | |||||
| 2026-02-17 | 13F | Millennium Management Llc | 7.596.588 | 28,67 | 25.297 | 26,77 | ||||
| 2026-02-12 | 13F | Raiffeisen Bank International AG | 0 | -100,00 | 0 | -100,00 | ||||
| 2026-02-11 | 13F | O'shaughnessy Asset Management, Llc | 481.588 | 13,34 | 1.604 | 11,63 | ||||
| 2026-01-29 | 13F | UBS Group AG | 313.485 | 84,77 | 1.044 | 82,02 | ||||
| 2026-02-13 | 13F | Headlands Technologies LLC | 27.970 | 93 | ||||||
| 2026-02-17 | 13F | United Capital Financial Advisers, Llc | 15.815 | -10,46 | 53 | -11,86 | ||||
| 2025-11-14 | 13F | Bayesian Capital Management, LP | 0 | -100,00 | 0 | -100,00 | ||||
| 2026-01-28 | 13F | B. Metzler seel. Sohn & Co. AG | 372.588 | 24,94 | 1.241 | 23,14 | ||||
| 2026-02-17 | 13F | Cetera Investment Advisers | 21.024 | 70 | ||||||
| 2026-02-13 | 13F | Schroder Investment Management Group | 3.745.717 | 4,95 | 12.435 | 4,01 | ||||
| 2025-09-23 | NP | SEKAX - DWS Emerging Markets Equity Fund Class A | 0 | -100,00 | 0 | -100,00 | ||||
| 2025-10-24 | 13F | Sumitomo Mitsui DS Asset Management Company, Ltd | 0 | -100,00 | 0 | -100,00 | ||||
| 2025-09-25 | NP | DEXC - Dimensional Emerging Markets ex China Core Equity ETF | 49.100 | 26,55 | 136 | 43,16 | ||||
| 2026-01-27 | 13F | Checchi Capital Advisers, LLC | 11.728 | 39 | ||||||
| 2026-01-23 | 13F | Altfest L J & Co Inc | 58.071 | 193 | ||||||
| 2026-02-10 | 13F | Envestnet Asset Management Inc | 579.453 | -11,91 | 1.930 | -13,23 | ||||
| 2026-01-23 | 13F | Natural Investments, Llc | 15.830 | 5,36 | 0 | |||||
| 2026-02-05 | 13F | High Note Wealth, LLC | 21 | 0,00 | 0 | |||||
| 2026-02-17 | 13F | Two Sigma Investments, Lp | 22.164.076 | -29,26 | 73.806 | -30,31 | ||||
| 2026-02-09 | 13F | Employees Retirement System of Texas | 1.307.728 | 102,81 | 4 | 100,00 | ||||
| 2026-01-28 | 13F | CAPROCK Group, Inc. | 16.994 | 59 | ||||||
| 2026-02-20 | 13F | Larch Capital Partners Llc | 2.253.600 | 8.037 | ||||||
| 2026-01-29 | 13F | Vanguard Group Inc | 13.315.062 | 0,00 | 44.339 | -1,48 | ||||
| 2026-02-05 | 13F | Thrivent Financial For Lutherans | 661.623 | -0,15 | 2 | 0,00 | ||||
| 2025-09-25 | NP | VEU - Vanguard FTSE All-World ex-US Index Fund ETF Shares | 5.940.252 | 0,00 | 16.454 | 12,60 | ||||
| 2026-02-02 | 13F | Oppenheimer & Co Inc | 0 | -100,00 | 0 | |||||
| 2025-09-26 | NP | UUPIX - Ultraemerging Markets Profund Investor Class | 25.822 | 21,64 | 72 | 36,54 | ||||
| 2026-02-13 | 13F | Integrated Wealth Concepts LLC | 129.728 | 9,91 | 432 | 8,29 | ||||
| 2025-11-14 | 13F | Alliancebernstein L.p. | 0 | -100,00 | 0 | -100,00 | ||||
| 2026-02-17 | 13F | Creative Planning | 13.626 | -8,59 | 45 | -10,00 | ||||
| 2026-02-26 | 13F/A | Alpine Global Management, LLC | 2.700.000 | 8.991 | ||||||
| 2026-02-17 | 13F | Private Advisor Group, LLC | 28.302 | 1,07 | 94 | 0,00 | ||||
| 2025-09-23 | NP | GERIX - Goldman Sachs Emerging Markets Equity Insights Fund Institutional | 2.977.700 | 832,86 | 8.248 | 950,70 | ||||
| 2026-01-14 | 13F | Jfs Wealth Advisors, Llc | 553 | 0,00 | 2 | 0,00 | ||||
| 2026-01-23 | 13F | Eagle Bay Advisors LLC | 14.000 | 50 | ||||||
| 2026-02-12 | 13F | Hollencrest Capital Management | 590 | 0,00 | 2 | 0,00 | ||||
| 2026-02-12 | 13F | Skopos Labs, Inc. | 0 | -100,00 | 0 | |||||
| 2026-02-10 | 13F | Daiwa Securities Group Inc. | 355.435 | 0,00 | 1 | 0,00 | ||||
| 2026-02-13 | 13F | Gould Asset Management Llc /ca/ | 76.976 | 0,00 | 256 | -1,54 | ||||
| 2025-10-14 | 13F | True North Advisors, LLC | 0 | -100,00 | 0 | -100,00 | ||||
| 2026-01-20 | 13F | Perpetual Ltd | 3.617.532 | -7,24 | 12.046 | -8,62 | ||||
| 2026-02-12 | 13F | Wealthspire Advisors, LLC | 0 | -100,00 | 0 | |||||
| 2026-02-13 | 13F | Peak6 Llc | Call | 0 | -100,00 | 0 | -100,00 | |||
| 2026-02-17 | 13F | Advisory Services Network, LLC | 14.022 | 164,37 | 47 | 170,59 | ||||
| 2026-02-05 | 13F | iA Global Asset Management Inc. | 139.224 | 0,00 | 0 | |||||
| 2026-02-06 | 13F | Creative Financial Designs Inc /adv | 112 | -59,27 | 0 | |||||
| 2026-02-17 | 13F | Graham Capital Management, L.P. | 143.308 | 64,73 | 477 | 62,24 | ||||
| 2026-02-13 | 13F | Parkside Financial Bank & Trust | 2.623 | 0,00 | 9 | 0,00 | ||||
| 2026-02-11 | 13F | Metis Global Partners, LLC | 31.369 | -1,97 | 104 | -3,70 | ||||
| 2026-01-12 | 13F | DAVENPORT & Co LLC | 49.722 | 1,36 | 166 | 0,00 | ||||
| 2026-01-09 | 13F | Park Place Capital Corp | 326 | 1 | ||||||
| 2026-01-15 | 13F | Highline Wealth Partners Llc | 4.267 | 0,00 | 14 | 0,00 | ||||
| 2025-09-26 | NP | EPIN - Harbor International Equity ETF | 13.440 | 37 | ||||||
| 2026-02-17 | 13F | Advisor Group Holdings, Inc. | 7.574 | 6.211,67 | 25 | |||||
| 2026-02-05 | 13F | Bessemer Group Inc | 6.233.240 | 0,86 | 21 | 0,00 | ||||
| 2026-02-12 | 13F | Quadrant Capital Group Llc | 13.661 | 0,00 | 46 | -2,17 | ||||
| 2025-09-26 | NP | RTNAX - Tax-Managed International Equity Fund Class A | 2.143.205 | 0,00 | 5.937 | 12,59 | ||||
| 2026-02-17 | 13F | XTX Topco Ltd | 720.209 | 960,99 | 2.398 | 947,16 | ||||
| 2026-02-06 | 13F | Cullen/frost Bankers, Inc. | 207 | 0,00 | 1 | |||||
| 2025-11-13 | 13F | Sagil Capital Llp | 0 | -100,00 | 0 | -100,00 | ||||
| 2026-02-05 | 13F | LGT Fund Management Co Ltd. | 1.150.000 | -25,07 | 3.898 | -21,60 | ||||
| 2026-02-17 | 13F | Qube Research & Technologies Ltd | 308.033 | 1.026 | ||||||
| 2026-01-26 | 13F | Mirae Asset Global Investments Co., Ltd. | 295.160 | 5,53 | 983 | 3,92 | ||||
| 2026-02-10 | 13F | Acadian Asset Management Llc | 55.551.078 | 29,61 | 185 | 27,78 | ||||
| 2025-09-25 | NP | VGPMX - Vanguard Global Capital Cycles Fund Investor Shares | 16.825.119 | 0,00 | 46.606 | 12,60 | ||||
| 2026-02-11 | 13F | J.Safra Asset Management Corp | 92.265 | 307 | ||||||
| 2026-02-12 | 13F | Dimensional Fund Advisors Lp | 2.433.672 | -19,88 | 8.111 | -20,98 | ||||
| 2025-09-24 | NP | BLACKROCK ASIAN DRAGON FUND, INC. - BLACKROCK ASIAN DRAGON FUND, INC. Investor A This fund is a listed as child fund of BlackRock, Inc. and if that institution has disclosed ownership in this security, then these positions will not be double counted when calculating total shares and total value | 31.850 | -17,39 | 88 | -6,38 | ||||
| 2025-09-25 | NP | TWAAX - Thrivent International Allocation Fund Class A | 6.610 | 23,00 | 18 | 63,64 | ||||
| 2026-02-17 | 13F | Royal Bank Of Canada | 315.555 | -1,58 | 1.050 | -3,05 | ||||
| 2026-02-17 | 13F | Warren Averett Asset Management, LLC | 15.539 | 0,00 | 52 | -1,92 | ||||
| 2026-02-12 | 13F | New York State Common Retirement Fund | 8.236.757 | 9,44 | 27.428 | 7,82 | ||||
| 2026-02-11 | 13F | SmartHarvest Portfolios, LLC | 19.620 | 65 | ||||||
| 2026-02-17 | 13F | Silvercrest Asset Management Group Llc | 60.050 | 28,81 | 200 | 26,75 | ||||
| 2026-02-12 | 13F | Steward Partners Investment Advisory, Llc | 609 | 0,00 | 2 | 0,00 | ||||
| 2026-01-07 | 13F | Riversedge Advisors, Llc | 31.529 | 7,34 | 105 | 5,05 | ||||
| 2026-02-17 | 13F | Russell Investments Group, Ltd. | 20.692.360 | 11,81 | 69.486 | 11,51 | ||||
| 2026-02-17 | 13F | Public Employees Retirement System Of Ohio | 7.866.533 | -19,49 | 26.196 | -20,68 | ||||
| 2026-02-17 | 13F | Bank Of America Corp /de/ | 6.158.525 | 20,35 | 20.508 | 18,57 | ||||
| 2026-02-10 | 13F | Natixis Advisors, L.p. | 15.422.826 | 6,97 | 51 | 6,25 | ||||
| 2026-02-17 | 13F | Susquehanna International Group, Llp | Call | 555.900 | 57,17 | 1.851 | 54,90 | |||
| 2026-01-30 | 13F | Us Bancorp \de\ | 16.783 | 6,15 | 56 | 3,77 | ||||
| 2025-11-14 | 13F | Credit Agricole S A | 0 | -100,00 | 0 | -100,00 | ||||
| 2026-02-17 | 13F | Susquehanna International Group, Llp | 689.114 | -51,40 | 2.295 | -52,13 | ||||
| 2026-02-17 | 13F | Susquehanna International Group, Llp | Put | 1.441.200 | -29,52 | 4.799 | -30,56 | |||
| 2026-01-20 | 13F | Signaturefd, Llc | 18 | 0,00 | 0 | |||||
| 2025-09-23 | NP | VVIFX - Voya VACS Series EME Fund | 268.938 | -23,89 | 745 | -14,38 | ||||
| 2025-09-25 | NP | HDVAX - Hartford International Equity Fund Class A | 598.498 | 1,16 | 1.658 | 13,88 | ||||
| 2026-02-13 | 13F | Victory Capital Management Inc | 755.683 | 4,26 | 2.516 | 2,74 | ||||
| 2026-02-19 | 13F | Atomi Financial Group, Inc. | 155.433 | 1.217,90 | 518 | 1.420,59 | ||||
| 2026-02-06 | 13F | Abn Amro Investment Solutions | 55.500 | 185 | ||||||
| 2026-02-05 | 13F | Allworth Financial LP | 0 | -100,00 | 0 | |||||
| 2026-02-09 | 13F | Hantz Financial Services, Inc. | 1.036 | 117,65 | 0 | |||||
| 2026-02-17 | 13F | Laird Norton Trust Company, Llc | 98.781 | 348 | ||||||
| 2026-02-17 | 13F | SageView Advisory Group, LLC | 495 | 2 | ||||||
| 2025-09-23 | NP | SLANX - DWS Latin America Equity Fund Class A | 2.272.966 | -9,68 | 6.296 | 1,70 | ||||
| 2025-11-14 | 13F | Mercer Global Advisors Inc /adv | 0 | -100,00 | 0 | -100,00 | ||||
| 2026-02-12 | 13F | Benson Wealth Management INC | 571 | 2 | ||||||
| 2026-01-30 | 13F | ARGA Investment Management, LP | 112.650.293 | -1,62 | 375.125 | -3,07 | ||||
| 2026-02-10 | 13F | Nomura Asset Management Co Ltd | 0 | 0 | ||||||
| 2025-11-07 | 13F | Gsa Capital Partners Llp | 0 | -100,00 | 0 | |||||
| 2026-02-06 | 13F | Carrhae Capital LLP | 16.185.404 | 53.897 | ||||||
| 2026-02-13 | 13F | Wells Fargo & Company/mn | 562.305 | 2,03 | 1.872 | 0,54 | ||||
| 2026-02-17 | 13F | Mirabella Financial Services Llp | 181.244 | 604 | ||||||
| 2026-02-11 | 13F | Group One Trading, L.p. | Put | 166.200 | 30,15 | 553 | 28,31 | |||
| 2026-02-11 | 13F | Group One Trading, L.p. | Call | 2.472.400 | 72,33 | 8.233 | 69,79 | |||
| 2026-02-12 | 13F | Provida Pension Fund Administrator | 0 | -100,00 | 0 | |||||
| 2026-02-03 | 13F | Sequoia Financial Advisors, LLC | 54.698 | 0,00 | 182 | -1,09 | ||||
| 2026-01-12 | 13F | Abound Wealth Management | 87 | 0,00 | 0 | |||||
| 2026-02-11 | 13F | LPL Financial LLC | 445.365 | 20,33 | 1.483 | 18,55 | ||||
| 2026-01-28 | 13F | WPG Advisers, LLC | 1.218 | 0,00 | 4 | 0,00 | ||||
| 2026-02-11 | 13F | Nikko Asset Management Americas, Inc. | 69.898 | 233 | ||||||
| 2026-02-11 | 13F | BIT Capital GmbH | Put | 4.301.200 | 0,00 | 14.323 | -1,49 | |||
| 2025-11-14 | 13F | PineBridge Investments, L.P. | 1.305.451 | 0,00 | 4.412 | 9,40 | ||||
| 2026-02-11 | 13F | Longfellow Investment Management Co Llc | 543.378 | -13,28 | 1.809 | -14,55 | ||||
| 2026-02-13 | 13F | Sterling Capital Management LLC | 2.292 | 0,00 | 8 | 0,00 | ||||
| 2026-01-16 | 13F | First Pacific Financial | 0 | -100,00 | 0 | |||||
| 2026-02-12 | 13F | Jane Street Group, Llc | 2.364.949 | 1.294,72 | 7.875 | 1.274,35 | ||||
| 2026-02-13 | 13F | Segall Bryant & Hamill, Llc | 196.100 | 0,00 | 653 | -1,36 | ||||
| 2026-02-17 | 13F | Aqr Capital Management Llc | 1.104.370 | -50,94 | 3.678 | -51,67 | ||||
| 2026-02-12 | 13F | Jane Street Group, Llc | Put | 101.800 | -7,62 | 339 | -9,14 | |||
| 2026-02-12 | 13F | Jane Street Group, Llc | Call | 193.900 | 101,56 | 646 | 98,46 | |||
| 2026-02-13 | 13F | SRS Capital Advisors, Inc. | 2.174 | 7 | ||||||
| 2026-01-28 | 13F | DekaBank Deutsche Girozentrale | 743.420 | 0,00 | 2 | 0,00 | ||||
| 2026-01-07 | 13F | Hilltop National Bank | 19.095 | -9,38 | 64 | -11,27 | ||||
| 2026-01-23 | 13F | Sumitomo Mitsui Trust Holdings, Inc. | 69.898 | -10,37 | 233 | -11,79 | ||||
| 2026-02-10 | 13F | State of Wyoming | 21.193 | -4,55 | 71 | -6,67 | ||||
| 2026-02-13 | 13F | Marshall Wace, Llp | 30.635.629 | 102.017 | ||||||
| 2026-02-17 | 13F | Cantor Fitzgerald, L. P. | 65.521 | 218 | ||||||
| 2025-12-02 | 13F | IFP Advisors, Inc | 0 | -100,00 | 0 | |||||
| 2026-02-11 | 13F | Jpmorgan Chase & Co | 4.049.121 | -34,11 | 13.484 | -35,08 | ||||
| 2026-02-02 | 13F | Strs Ohio | 712.031 | -14,86 | 2.371 | -16,10 | ||||
| 2026-02-17 | 13F | Two Sigma Securities, Llc | 26.349 | 150,32 | 88 | 148,57 | ||||
| 2026-02-14 | 13F | Rockefeller Capital Management L.P. | 6.755 | -2,02 | 22 | -4,35 | ||||
| 2026-02-12 | 13F | Earnest Partners Llc | 23.433.000 | 8,81 | 78.032 | 7,20 | ||||
| 2026-02-13 | 13F | Banco Santander, S.A. | 110.746 | 7,79 | 369 | 6,05 | ||||
| 2026-02-13 | 13F | State Street Corp | 12.429.795 | 1,32 | 43.575 | 2,56 | ||||
| 2026-02-13 | 13F | VPR Management LLC | 187.900 | 0,00 | 626 | -1,57 | ||||
| 2026-02-14 | 13F | Frec Markets, Inc. | 20.504 | 68 | ||||||
| 2026-02-12 | 13F | Insigneo Advisory Services, Llc | 15.030 | -76,51 | 50 | -76,85 | ||||
| 2025-11-14 | 13F | D. E. Shaw & Co., Inc. | 0 | -100,00 | 0 | -100,00 | ||||
| 2026-02-13 | 13F | First Trust Advisors Lp | 82.975 | 12,60 | 276 | 10,84 | ||||
| 2026-01-16 | 13F | Ronald Blue Trust, Inc. | 84.439 | -6,88 | 281 | -8,17 | ||||
| 2026-02-17 | 13F | Wellington Management Group Llp | 77.491.815 | 0,99 | 258.048 | -0,51 | ||||
| 2025-10-02 | 13F | Investors Research Corp | 0 | -100,00 | 0 | -100,00 | ||||
| 2026-01-28 | 13F | Aquamarine Financial (Cayman) Ltd | 148.670.798 | 8,10 | 517.056 | 8,37 | ||||
| 2026-02-03 | 13F | We Are One Seven, LLC | 136.897 | 4,72 | 456 | 3,17 | ||||
| 2026-02-13 | 13F | Squarepoint Ops LLC | 54.328 | -34,06 | 181 | -35,25 | ||||
| 2026-02-19 | 13F | CI Private Wealth, LLC | 40.198 | 0,13 | 134 | -1,48 | ||||
| 2025-11-04 | 13F | IMC-Chicago, LLC | Call | 0 | -100,00 | 0 | -100,00 | |||
| 2026-02-17 | 13F | Ancora Advisors, LLC | 854 | -57,30 | 3 | -77,78 | ||||
| 2026-01-08 | 13F | Tuttle Tactical Management LLC | 55.534 | 185 | ||||||
| 2026-02-13 | 13F | Macquarie Group Ltd | 0 | -100,00 | 0 | |||||
| 2026-02-17 | 13F | Two Sigma Advisers, Lp | 22.115.920 | -41,84 | 73.646 | -42,70 | ||||
| 2025-11-14 | 13F | AXA Investment Managers S.A. | 91.344 | 309 | ||||||
| 2026-02-10 | 13F | SCS Capital Management LLC | 341.868 | 0,07 | 1.138 | -1,39 | ||||
| 2026-02-11 | 13F | Cerity Partners LLC | 48.167 | -2,49 | 160 | -3,61 | ||||
| 2026-02-12 | 13F | Hrt Financial Lp | 173.754 | 19,41 | 1 | |||||
| 2026-02-13 | 13F | Truffle Hound Capital, LLC | 1.700.000 | 0,00 | 5.661 | -1,48 | ||||
| 2026-02-17 | 13F | Northern Trust Corp | 4.672.737 | 2,17 | 15.560 | 0,66 | ||||
| 2026-02-13 | 13F | American Century Companies Inc | 10.249.428 | 8,71 | 34.131 | 7,10 | ||||
| 2025-11-13 | 13F | GeoWealth Management, LLC | 0 | -100,00 | 0 | -100,00 | ||||
| 2026-02-04 | 13F | Paradigm Asset Management Co Llc | 2.200 | 0,00 | 7 | 0,00 | ||||
| 2026-02-13 | 13F | Commerce Bank | 21.824 | 39,30 | 73 | 38,46 | ||||
| 2026-02-17 | 13F | Jones Financial Companies Lllp | 27.367 | 23,62 | 91 | 24,66 | ||||
| 2026-02-17 | 13F | HighVista Strategies LLC | 190.264 | -63,42 | 634 | -63,97 | ||||
| 2026-02-11 | 13F | West Family Investments, Inc. | 29.487 | 0,00 | 98 | -1,01 | ||||
| 2026-02-17 | 13F | Turim 21 Investimentos Ltda. | 66.001 | 0,00 | 473 | -2,48 | ||||
| 2025-11-20 | 13F | First Affirmative Financial Network | 55.337 | -14,53 | 187 | -6,50 | ||||
| 2026-02-09 | 13F | Huntington National Bank | 1 | 0,00 | 0 | |||||
| 2026-01-08 | 13F | Grove Bank & Trust | 9.510 | -4,95 | 32 | -6,06 | ||||
| 2026-01-09 | 13F | SG Americas Securities, LLC | 23.742 | -59,12 | 0 | |||||
| 2026-02-06 | 13F | Leonteq Securities AG | 96.388 | 78,52 | 321 | 75,82 | ||||
| 2025-11-14 | 13F | Boothbay Fund Management, Llc | 0 | -100,00 | 0 | |||||
| 2025-09-25 | NP | DFAX - Dimensional World ex U.S. Core Equity 2 ETF | 451.826 | 17,78 | 1.252 | 32,66 | ||||
| 2025-11-10 | 13F | Sava Infond d.o.o. | 0 | -100,00 | 0 | -100,00 | ||||
| 2026-02-17 | 13F | Man Group plc | 5.567.219 | 2.582,70 | 18.539 | 2.544,51 | ||||
| 2026-02-13 | 13F | Inspire Advisors, LLC | 43.116 | -2,46 | 144 | -4,03 | ||||
| 2025-11-14 | 13F | Prelude Capital Management, Llc | 0 | -100,00 | 0 | -100,00 | ||||
| 2026-02-11 | 13F | Parallel Advisors, LLC | 439 | 0,00 | 1 | 0,00 | ||||
| 2025-09-26 | NP | EPEM - Harbor Emerging Markets Equity ETF | 27.930 | 77 | ||||||
| 2025-11-14 | 13F | Orbis Allan Gray Ltd | 0 | -100,00 | 0 | -100,00 | ||||
| 2026-01-28 | 13F | Geneos Wealth Management Inc. | 312 | 0,00 | 1 | 0,00 | ||||
| 2026-01-30 | 13F/A | M&t Bank Corp | 70.125 | 234 | ||||||
| 2026-02-17 | 13F | Amundi | 20.483.984 | 23,01 | 68.212 | 28,81 | ||||
| 2025-09-25 | NP | VTRIX - Vanguard International Value Fund Investor Shares This fund is a listed as child fund of Vanguard Group Inc and if that institution has disclosed ownership in this security, then these positions will not be double counted when calculating total shares and total value | 17.528.439 | -2,63 | 48.554 | 9,64 | ||||
| 2026-02-13 | 13F | PCM Encore, LLC | 85.809 | 286 | ||||||
| 2025-11-13 | 13F/A | Peak6 Llc | 0 | -100,00 | 0 | -100,00 | ||||
| 2026-01-30 | 13F | Sigma Planning Corp | 19.477 | 0,07 | 66 | 1,54 | ||||
| 2026-02-11 | 13F | Dorsey & Whitney Trust CO LLC | 11.443 | -0,48 | 38 | 0,00 | ||||
| 2026-01-09 | 13F | Diversified Trust Co | 137.050 | 456 | ||||||
| 2026-02-17 | 13F | Raymond James Financial Inc | 3.603.687 | -0,63 | 12.000 | -2,10 | ||||
| 2026-01-21 | 13F | Aaron Wealth Advisors LLC | 19.562 | 65 | ||||||
| 2026-02-13 | 13F | Rhumbline Advisers | 422.315 | -11,71 | 1.406 | -13,00 | ||||
| 2026-02-06 | 13F | Plan A Wealth LLC | 17.293 | 13,24 | 58 | 11,76 | ||||
| 2026-02-17 | 13F | Lazard Asset Management Llc | 689.575 | -28,40 | 2.296 | -29,46 | ||||
| 2025-09-23 | NP | IEMGX - Voya Multi-Manager Emerging Markets Equity Fund Class I | 185.919 | -26,58 | 515 | -17,36 | ||||
| 2025-11-12 | 13F | NewSquare Capital LLC | 0 | -100,00 | 0 | |||||
| 2026-01-29 | 13F | Aprio Wealth Management, LLC | 26.979 | 26,49 | 90 | 23,61 | ||||
| 2026-02-12 | 13F | Brinker Capital Investments, LLC | 238.847 | 3,82 | 795 | 2,32 | ||||
| 2025-09-25 | NP | WRAAX - Wilmington Global Alpha Equities Fund Class A Shares | 83.827 | -10,29 | 232 | 1,31 | ||||
| 2026-01-22 | 13F | Massachusetts Financial Services Co /ma/ | 62.331.329 | -28,43 | 207.563 | -29,49 | ||||
| 2026-01-26 | 13F | Merit Financial Group, LLC | 21.663 | -2,58 | 72 | -4,00 | ||||
| 2026-02-17 | 13F | Boreal Capital Management LLC | 508 | 0,00 | 2 | 0,00 | ||||
| 2026-01-30 | 13F | Samalin Investment Counsel, LLC | 42.241 | -15,88 | 141 | -17,16 | ||||
| 2025-09-25 | NP | Thrivent Core Funds - Thrivent Core Emerging Markets Equity Fund | 48.900 | 135 | ||||||
| 2025-09-25 | NP | Dimensional Emerging Markets Value Fund - Dimensional Emerging Markets Value Fund This fund is a listed as child fund of Dimensional Fund Advisors Lp and if that institution has disclosed ownership in this security, then these positions will not be double counted when calculating total shares and total value | 387.640 | 0,00 | 1.074 | 12,59 | ||||
| 2026-02-12 | 13F | Moerus Capital Management LLC | 8.303.820 | -18,65 | 27.652 | -19,86 | ||||
| 2026-03-06 | 13F | Hsbc Holdings Plc | 2.869.657 | 7,60 | 9.556 | 6,00 | ||||
| 2026-02-10 | 13F | Quantbot Technologies LP | 134.093 | -84,71 | 447 | -84,95 | ||||
| 2026-02-10 | 13F/A | Northwestern Mutual Wealth Management Co | 10.170 | -45,78 | 34 | -47,62 | ||||
| 2026-02-12 | 13F/A | Pinebridge Investments Llc | 792.123 | 2.638 | ||||||
| 2026-01-21 | 13F | Yousif Capital Management, Llc | 88.866 | 0,00 | 317 | 5,67 | ||||
| 2026-02-13 | 13F | Walleye Capital LLC | Call | 0 | -100,00 | 0 | -100,00 | |||
| 2026-01-23 | 13F | Robeco Institutional Asset Management B.V. | 798.779 | 1,12 | 2.660 | -0,37 | ||||
| 2026-02-13 | 13F | Walleye Capital LLC | 24.763 | 55,72 | 82 | 54,72 | ||||
| 2026-01-05 | 13F | GAMMA Investing LLC | 12.641 | 40,11 | 42 | 40,00 | ||||
| 2026-02-12 | 13F | Federation des caisses Desjardins du Quebec | 3.458 | -12,63 | 12 | -15,38 | ||||
| 2026-01-30 | 13F | Turning Point Benefit Group, Inc. | 73 | 0,00 | 0 | |||||
| 2025-09-26 | NP | RINYX - International Developed Markets Fund Class Y | 819.582 | 0,00 | 2.270 | 12,60 | ||||
| 2026-02-02 | 13F | Qrg Capital Management, Inc. | 56.257 | 113,32 | 187 | 110,11 | ||||
| 2026-02-17 | 13F | Delaware Management Holdings, Inc. | 21.698.836 | 72.258 | ||||||
| 2026-02-06 | 13F | Global Retirement Partners, LLC | 6.859 | 1.314,23 | 23 | 2.100,00 | ||||
| 2026-01-29 | 13F | Calamos Advisors LLC | 380.510 | 1.267 | ||||||
| 2026-01-12 | 13F | Legacy Wealth Asset Management, LLC | 193.684 | -0,21 | 645 | -1,83 | ||||
| 2026-02-17 | 13F | Optiver Holding B.V. | 0 | -100,00 | 0 | |||||
| 2025-10-30 | 13F | Twin Peaks Wealth Advisors, LLC | 0 | -100,00 | 0 | -100,00 | ||||
| 2026-02-06 | 13F | Pnc Financial Services Group, Inc. | 175.548 | -23,44 | 585 | -24,65 | ||||
| 2026-02-17 | 13F | Fmr Llc | 49.281 | 8,78 | 164 | 7,19 | ||||
| 2026-02-27 | 13F | Groupama Asset Managment | 76.140 | -70,18 | 254 | -70,65 | ||||
| 2026-02-12 | 13F | Barometer Capital Management Inc. | 11.100 | -96,90 | 419 | -64,67 | ||||
| 2026-02-14 | 13F | Whipplewood Advisors, LLC | 164 | 1 | ||||||
| 2026-01-14 | 13F | Net Worth Advisory Group | 73.669 | 3,22 | 245 | 1,66 | ||||
| 2026-01-23 | 13F | Zwj Investment Counsel Inc | 13.200 | 0,00 | 44 | -2,27 | ||||
| 2026-01-07 | 13F | Sagespring Wealth Partners, Llc | 17.457 | 58 | ||||||
| 2026-02-05 | 13F | Td Private Client Wealth Llc | 4.512 | 0,00 | 15 | 0,00 | ||||
| 2026-02-12 | 13F | Renaissance Technologies Llc | 6.039.195 | -22,41 | 20.111 | -23,56 | ||||
| 2025-09-26 | NP | FSGEX - Fidelity Series Global ex U.S. Index Fund This fund is a listed as child fund of Fmr Llc and if that institution has disclosed ownership in this security, then these positions will not be double counted when calculating total shares and total value | 414.584 | -27,40 | 1.148 | -18,23 | ||||
| 2026-01-23 | 13F | Farther Finance Advisors, LLC | 5.730 | 259,02 | 19 | 280,00 | ||||
| 2026-02-13 | 13F | Caitong International Asset Management Co., Ltd | 1.979 | 540,45 | 7 | 500,00 | ||||
| 2026-02-09 | 13F | Coldstream Capital Management Inc | 12.137 | -62,40 | 40 | -63,30 | ||||
| 2026-02-17 | 13F | CWM Advisors, LLC | 25.331 | 11,42 | 84 | 10,53 | ||||
| 2026-02-17 | 13F | Tower Research Capital LLC (TRC) | 0 | -100,00 | 0 | |||||
| 2025-12-09 | 13F/A | Tudor Investment Corp Et Al | 0 | -100,00 | 0 | -100,00 | ||||
| 2025-09-26 | NP | EPDPX - EuroPac International Dividend Income Fund Class A | 550.000 | 0,00 | 1.524 | 12,56 | ||||
| 2026-02-13 | 13F | Absolute Gestao de Investimentos Ltda. | 0 | -100,00 | 0 | |||||
| 2026-02-17 | 13F | Grantham, Mayo, Van Otterloo & Co. LLC | 8.034.400 | 113,36 | 26.755 | 110,21 | ||||
| 2025-10-07 | 13F | Union Bancaire Privee, UBP SA | 0 | -100,00 | 0 | -100,00 | ||||
| 2026-02-13 | 13F | Sei Investments Co | 18.655.233 | 7,28 | 62.122 | 5,69 | ||||
| 2026-01-14 | 13F | Thompson Investment Management, Inc. | 3.194 | 0,00 | 11 | 0,00 | ||||
| 2026-01-23 | 13F | Assetmark, Inc | 1.730 | 47,49 | 6 | 66,67 | ||||
| 2026-02-23 | 13F | Vinland Capital Management Gestora de Recursos LTDA. | 0 | -100,00 | 0 | -100,00 | ||||
| 2026-02-03 | 13F | S-Bank Fund Management Ltd | 330.000 | 0,00 | 1.099 | -1,52 | ||||
| 2025-11-13 | 13F | Glenmede Investment Management, LP | 0 | -100,00 | 0 | |||||
| 2025-11-14 | 13F | Axa S.a. | 0 | -100,00 | 0 | -100,00 | ||||
| 2025-09-26 | NP | PCEMX - PACE International Emerging Markets Equity Investments Class P | 1.515.827 | -27,92 | 4.199 | -18,85 | ||||
| 2026-02-06 | 13F | Profund Advisors Llc | 254.409 | 12,30 | 847 | 10,72 | ||||
| 2026-02-12 | 13F | Marex Group plc | 33.414 | -59,40 | 111 | -60,07 | ||||
| 2026-02-13 | 13F | Itau Unibanco Holding S.A. | 46.867.695 | 29,87 | 155.132 | 27,18 | ||||
| 2026-02-18 | 13F | Vident Advisory, LLC | 409.223 | 17,49 | 1.363 | 15,72 | ||||
| 2025-09-25 | NP | VEIEX - Vanguard Emerging Markets Stock Index Fund Investor Shares | 6.336.162 | 0,00 | 17.551 | 12,61 | ||||
| 2026-02-11 | 13F | Winton Capital Group Ltd | 842.800 | 2.807 | ||||||
| 2026-02-12 | 13F | Qtron Investments LLC | 0 | -100,00 | 0 | |||||
| 2026-02-02 | 13F | Advisors Preferred, LLC | 67.867 | -10,40 | 228 | -6,94 | ||||
| 2026-02-17 | 13F | Snowden Capital Advisors LLC | 15.000 | 0,00 | 53 | 0,00 | ||||
| 2025-09-25 | NP | VT - Vanguard Total World Stock Index Fund ETF Shares | 979.393 | 0,00 | 2.713 | 12,58 | ||||
| 2025-11-10 | 13F | MAI Capital Management | 0 | -100,00 | 0 | |||||
| 2026-01-26 | 13F | Quattro Financial Advisors Llc | 40.000 | 0,00 | 133 | -1,48 | ||||
| 2026-02-13 | 13F | Smartleaf Asset Management LLC | 678 | 0,00 | 2 | 0,00 | ||||
| 2026-02-17 | 13F | MIRAE ASSET GLOBAL ETFS HOLDINGS Ltd. | 156.141 | 28,97 | 520 | 26,89 | ||||
| 2025-09-25 | NP | DFEV - Dimensional Emerging Markets Value ETF | 227.262 | 0,00 | 630 | 12,52 | ||||
| 2026-02-17 | 13F | Jump Financial, LLC | 111.620 | 372 | ||||||
| 2025-09-25 | NP | DFAE - Dimensional Emerging Core Equity Market ETF | 392.100 | 15,97 | 1.086 | 30,69 | ||||
| 2026-01-15 | 13F | Allspring Global Investments Holdings, LLC | 5.900.116 | -8,56 | 19.824 | -5,18 | ||||
| 2026-02-05 | 13F | Commerzbank Aktiengesellschaft /fi | 104.208 | 0,00 | 0 | |||||
| 2026-02-11 | 13F | Simplex Trading, Llc | Put | 439.500 | 11,41 | 1.464 | 146.200,00 | |||
| 2026-02-10 | 13F | Bnp Paribas Arbitrage, Sa | 464.365 | -7,95 | 1.546 | -9,33 | ||||
| 2026-01-29 | 13F | IMC-Chicago, LLC | Put | 105.400 | 0,57 | 351 | -1,13 | |||
| 2026-02-17 | 13F | Citadel Advisors Llc | Put | 129.500 | 2,78 | 431 | 1,41 | |||
| 2026-02-11 | 13F | Simplex Trading, Llc | Call | 291.000 | -11,42 | 969 | 96.800,00 | |||
| 2025-09-25 | NP | HILAX - The Hartford International Value Fund Class A | 31.919.704 | 17,07 | 88.418 | 31,82 | ||||
| 2026-02-17 | 13F | Farringdon Capital, Ltd. | 56.931 | 190 | ||||||
| 2026-02-17 | 13F | Citadel Advisors Llc | Call | 402.800 | -33,54 | 1.341 | -34,52 | |||
| 2026-02-13 | 13F | Morgan Stanley | 4.725.754 | -2,26 | 15.737 | -3,70 | ||||
| 2026-02-17 | 13F | Citadel Advisors Llc | 4.315.791 | 37,22 | 14.372 | 35,19 | ||||
| 2026-02-13 | 13F | Candriam Luxembourg S.C.A. | 69.650 | 0,00 | 232 | -1,70 | ||||
| 2026-01-26 | 13F | Cwm, Llc | 7.315 | -6,15 | 0 | |||||
| 2026-02-12 | 13F | Aviva Plc | 14.068 | 0,00 | 47 | -2,13 | ||||
| 2026-02-18 | 13F | Mackenzie Financial Corp | 5.513.237 | 120,37 | 18.653 | 120,59 | ||||
| 2026-01-14 | 13F | Generali Investments CEE, investicni spolecnost, a.s. | 110.463 | -58,41 | 368 | -59,09 | ||||
| 2026-01-30 | 13F | Activest Wealth Management | 4.890 | 0,00 | 16 | 0,00 | ||||
| 2026-02-11 | 13F | Empowered Funds, LLC | 2.707.988 | 9.018 | ||||||
| 2026-02-06 | 13F | Tredje AP-fonden | 20.869.200 | 65,24 | 69.494 | 62,79 | ||||
| 2025-09-25 | NP | EEMGX - MFS Emerging Markets Equity Research Fund R4 | 18.097 | -9,73 | 50 | 2,04 | ||||
| 2026-02-13 | 13F | Ubs Asset Management Americas Inc | 5.360.333 | 17.850 | ||||||
| 2026-02-12 | 13F | Principal Securities, Inc. | 0 | -100,00 | 0 | |||||
| 2026-02-13 | 13F | SPX Equities Gestao de Recursos Ltda | 3.437.249 | -41,17 | 11.446 | -42,04 | ||||
| 2026-01-08 | 13F | Traveka Wealth, LLC | 0 | -100,00 | 0 | -100,00 | ||||
| 2026-02-10 | 13F | Bank of New York Mellon Corp | 978.933 | -0,68 | 3.260 | -2,16 | ||||
| 2026-02-05 | 13F | Abacus Wealth Partners, LLC | 32.122 | 107 | ||||||
| 2026-02-17 | 13F | Optiver Holding B.V. | Put | 3.455.100 | 8,58 | 11.505 | 6,97 | |||
| 2026-02-13 | 13F | Aigen Investment Management, Lp | 0 | -100,00 | 0 | |||||
| 2025-09-26 | NP | UBPIX - Ultralatin America Profund Investor Class | 101.320 | -3,48 | 281 | 8,53 | ||||
| 2026-01-26 | 13F | PDS Planning, Inc | 37.354 | 0,00 | 124 | -1,59 | ||||
| 2026-02-09 | 13F | Geode Capital Management, Llc | 402.627 | -5,98 | 1.341 | -7,39 | ||||
| 2026-01-21 | 13F | Sound Income Strategies, LLC | 496 | 2 | ||||||
| 2026-02-17 | 13F | Optiver Holding B.V. | Call | 710.500 | 42,41 | 2.366 | 40,27 | |||
| 2026-01-21 | 13F/A | Euro Pacific Asset Management, LLC | 595.201 | 1,86 | 2 | 0,00 | ||||
| 2026-02-02 | 13F | Fifth Third Bancorp | 583 | 2 | ||||||
| 2026-02-13 | 13F | Tenzing Financial LLC | 14.434 | 48 | ||||||
| 2026-02-23 | 13F | Virtu Financial LLC | 147.489 | -47,04 | 0 | |||||
| 2026-02-17 | 13F | Oxford Asset Management Llp | 34.732 | 116 | ||||||
| 2026-02-04 | 13F | LRI Investments, LLC | 119 | 0,00 | 0 | |||||
| 2026-02-12 | 13F | Mount Yale Investment Advisors, LLC | 15.731 | -46,02 | 55 | -43,88 | ||||
| 2026-02-13 | 13F | Arrowstreet Capital, Limited Partnership | 82.163.260 | 25,91 | 273.604 | 24,05 | ||||
| 2026-02-09 | 13F | IPG Investment Advisors LLC | 13.576 | 0,00 | 48 | 0,00 | ||||
| 2026-02-12 | 13F | Brown Brothers Harriman & Co | 1.862 | 6 | ||||||
| 2026-02-09 | 13F | Genus Capital Management Inc. | 24.655 | 0,00 | 82 | -1,20 | ||||
| 2026-01-29 | 13F | UBS Group AG | Call | 0 | -100,00 | 0 | -100,00 | |||
| 2026-02-10 | 13F | Eurizon Asset Management Slovakia, sprav. spol., a.s. | 80.223 | 267 | ||||||
| 2026-03-04 | 13F | Rehmann Capital Advisory Group | 70.330 | 32,37 | 234 | 30,73 | ||||
| 2025-11-24 | 13F | CIBC Private Wealth Group, LLC | 0 | -100,00 | 0 | -100,00 | ||||
| 2026-02-13 | 13F | Walleye Trading LLC | Call | 3.700 | -73,76 | 12 | -74,47 | |||
| 2026-02-13 | 13F | Walleye Trading LLC | 48.400 | 161 | ||||||
| 2026-02-13 | 13F | Walleye Trading LLC | Put | 3.000 | 114,29 | 10 | 125,00 | |||
| 2025-11-14 | 13F | Eqis Capital Management, Inc. | 0 | -100,00 | 0 | -100,00 | ||||
| 2026-02-13 | 13F | Mml Investors Services, Llc | 25.120 | 10,00 | 84 | 7,79 | ||||
| 2025-11-14 | 13F | Wetherby Asset Management Inc | 64.604 | -1,91 | 218 | 7,39 | ||||
| 2026-02-06 | 13F | HighTower Advisors, LLC | 17.149 | 0,22 | 57 | 0,00 | ||||
| 2026-02-12 | 13F | BlackRock, Inc. | 34.634.429 | 3,46 | 115.333 | 1,93 | ||||
| 2026-02-13 | 13F | Mariner, LLC | 349.690 | 0,37 | 1.165 | -1,02 | ||||
| 2026-02-09 | 13F | Fisher Asset Management, LLC | 52.926.543 | -40,13 | 176.245 | -41,02 | ||||
| 2026-02-17 | 13F | Doma Perpetual Capital Management LLC | 2.005.430 | 0,00 | 6.678 | -1,48 | ||||
| 2025-11-07 | 13F | Sierra Ocean, Llc | 0 | -100,00 | 0 | -100,00 | ||||
| 2025-09-25 | NP | VMMSX - Vanguard Emerging Markets Select Stock Fund Investor Shares | 626.103 | -4,76 | 1.734 | 7,24 | ||||
| 2026-02-09 | 13F | Bleakley Financial Group, LLC | 193.135 | 7,04 | 643 | 5,58 | ||||
| 2026-02-13 | 13F | Centiva Capital, LP | 0 | -100,00 | 0 | |||||
| 2026-02-10 | 13F | CIBC World Markets Inc. | 166.030 | 133,91 | 553 | 130,96 | ||||
| 2025-11-14 | 13F | Cubist Systematic Strategies, LLC | 504.856 | 1.688,49 | 1.706 | 1.860,92 | ||||
| 2026-02-03 | 13F | Ballentine Partners, LLC | 12.431 | 41 | ||||||
| 2026-02-13 | 13F | Pinnacle Wealth Planning Services, Inc. | 157 | 1 | ||||||
| 2026-02-13 | 13F | Citigroup Inc | 529.179 | 42,13 | 1.762 | 40,06 | ||||
| 2026-02-11 | 13F | Deutsche Bank Ag\ | 1.570.438 | 0,00 | 5.230 | -1,49 | ||||
| 2026-02-03 | 13F | Crossmark Global Holdings, Inc. | 199.845 | -22,14 | 665 | -23,30 | ||||
| 2026-02-11 | 13F | Franklin Resources Inc | 47.947.074 | 2.469,21 | 159.664 | 174,59 | ||||
| 2026-02-09 | 13F | Legal & General Group Plc | 3.615.629 | 0,00 | 12.022 | -1,77 | ||||
| 2026-02-12 | 13F | Banco BTG Pactual S.A. | 0 | -100,00 | 0 | |||||
| 2025-09-26 | NP | AEMGX - Acadian Emerging Markets Portfolio Investor Class Shares | 1.488.900 | 4.124 | ||||||
| 2026-02-11 | 13F | Nemes Rush Group LLC | 58 | 0 | ||||||
| 2026-02-17 | 13F | Lighthouse Investment Partners, LLC | 3.690.706 | 6,78 | 12.290 | 5,20 | ||||
| 2026-01-30 | 13F | R Squared Ltd | 96.341 | -10,77 | 321 | -12,09 | ||||
| 2026-02-17 | 13F | Guggenheim Capital Llc | 108.555 | -3,09 | 361 | -4,50 | ||||
| 2026-01-08 | 13F | Wealth Enhancement Advisory Services, Llc | 0 | -100,00 | 0 | |||||
| 2026-02-13 | 13F | Toroso Investments, LLC | 136.801 | 6,38 | 456 | 6,56 | ||||
| 2026-02-13 | 13F | Barclays Plc | 1.540.595 | -1,76 | 5.130 | -3,21 | ||||
| 2026-02-20 | 13F/A | Capital Markets Trading UK LLP | Put | 227.200 | 0,00 | 1 | ||||
| 2026-01-23 | 13F | Baillie Gifford & Co | 38.275.506 | 36,82 | 127.457 | 34,80 | ||||
| 2026-02-10 | 13F | Sivia Capital Partners, LLC | 20.083 | 0,00 | 67 | -1,49 |