Grundlæggende statistik
| Institutionelle aktier (lange) | 420.902.360 - 45,73% (ex 13D/G) - change of -37,17MM shares -8,11% MRQ |
| Institutionel værdi (lang) | $ 37.747.220 USD ($1000) |
Institutionelt ejerskab og aktionærer
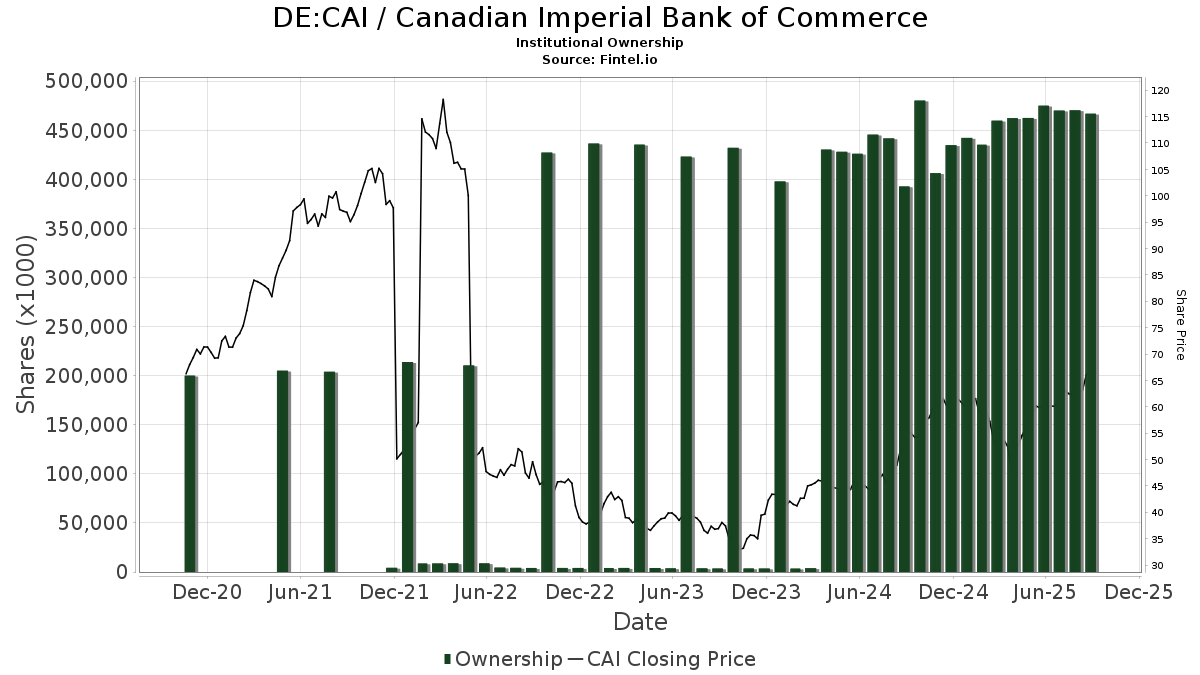
Canadian Imperial Bank of Commerce (DE:CAI) har 523 institutionelle ejere og aktionærer, der har indsendt 13D/G- eller 13F-formularer til Securities Exchange Commission (SEC). Disse institutioner har i alt 420,902,360 aktier. Største aktionærer omfatter Royal Bank Of Canada, Vanguard Group Inc, Bank Of Montreal /can/, Td Asset Management Inc, Toronto Dominion Bank, National Bank Of Canada /fi/, FIL Ltd, Bank Of Nova Scotia, CIBC World Markets Inc., and Mackenzie Financial Corp .
Canadian Imperial Bank of Commerce (DB:CAI) institutionel ejerskabsstruktur viser aktuelle positioner i virksomheden efter institutioner og fonde, samt seneste ændringer i positionsstørrelse. Større aktionærer kan omfatte individuelle investorer, investeringsforeninger, hedgefonde eller institutioner. Skema 13D angiver, at investoren besidder (eller besidder) mere end 5 % af virksomheden og har til hensigt (eller har til hensigt at) aktivt at forfølge en ændring i forretningsstrategi. Skema 13G indikerer en passiv investering på over 5%.
The share price as of April 24, 2026 is 92,55 / share. Previously, on April 28, 2025, the share price was 53,35 / share. This represents an increase of 73,48% over that period.
Fondens stemningsscore
Fund Sentiment Score (fka Ownership Accumulation Score) finder de aktier, der bliver mest købt af fonde. Det er resultatet af en sofistikeret, multi-faktor kvantitativ model, der identificerer virksomheder med de højeste niveauer af institutionel akkumulering. Scoringsmodellen bruger en kombination af den samlede stigning i oplyste ejere, ændringerne i porteføljeallokeringer i disse ejere og andre målinger. Tallet går fra 0 til 100, hvor højere tal indikerer et højere niveau af akkumulering for sine jævnaldrende, og 50 er gennemsnittet.
Opdateringsfrekvens: Dagligt
Se Ownership Explorer, som giver en liste over højest rangerende virksomheder.
AI+ Ask Fintel’s AI assistant about Canadian Imperial Bank of Commerce.
Select a question to share a public post with an AI-crafted answer.
Thinking of good questions…
13F og NPORT arkivering
Detaljer om 13F-arkivering er gratis. Detaljer om NP-ansøgninger kræver et premium-medlemskab. Grønne rækker angiver nye positioner. Røde rækker angiver lukkede positioner. Klik på linket ikon for at se den fulde transaktionshistorik.
Opgrader
for at låse premium-data op og eksportere til Excel ![]() .
.
| Fil dato | Kilde | Investor | Type | Gennemsnitlig pris (Øst) |
Aktier | Δ Aktier (%) |
Rapporteret Værdi ($1000) |
Δ Værdi (%) |
Port Alloc (%) |
|
|---|---|---|---|---|---|---|---|---|---|---|
| 2026-02-06 | 13F | Larson Financial Group LLC | 752 | 87,06 | 68 | 112,50 | ||||
| 2026-04-17 | 13F | CENTRAL TRUST Co | 614 | 0,00 | 58 | 5,45 | ||||
| 2026-04-21 | 13F | Aull & Monroe Investment Management Corp | 11.040 | 0,00 | 1.046 | 4,60 | ||||
| 2026-02-13 | 13F | Bridgewater Associates, LP | 7.412 | -33,45 | 673 | -24,49 | ||||
| 2026-01-29 | 13F | DecisionPoint Financial, LLC | 52 | 0,00 | 5 | 0,00 | ||||
| 2026-02-17 | 13F | Two Sigma Investments, Lp | 0 | -100,00 | 0 | |||||
| 2026-02-17 | 13F | United Capital Financial Advisers, Llc | 2.910 | 9,56 | 264 | 24,06 | ||||
| 2026-01-21 | 13F | Raleigh Capital Management Inc. | 8 | -79,49 | 1 | -100,00 | ||||
| 2026-02-12 | 13F | Dimensional Fund Advisors Lp | 3.165.969 | 0,70 | 286.888 | 14,22 | ||||
| 2026-02-12 | 13F | Colonial Trust Advisors | 200 | 0,00 | 18 | 20,00 | ||||
| 2025-11-13 | 13F | Glenmede Investment Management, LP | 5.101 | 0,47 | 408 | 13,37 | ||||
| 2026-01-27 | 13F | Checchi Capital Advisers, LLC | 4.767 | -0,67 | 432 | 12,53 | ||||
| 2026-02-04 | 13F | Versor Investments LP | 3.499 | 317 | ||||||
| 2026-02-13 | 13F | Ossiam | 0 | -100,00 | 0 | -100,00 | ||||
| 2026-02-13 | 13F | Osmosis Investment Management UK Ltd | 76.909 | 7.030 | ||||||
| 2026-03-04 | 13F | SHP Wealth Management | 1.189 | 108 | ||||||
| 2025-10-30 | 13F | Ridgewood Investments LLC | 0 | -100,00 | 0 | -100,00 | ||||
| 2025-11-14 | 13F/A | Skopos Labs, Inc. | 0 | -100,00 | 0 | -100,00 | ||||
| 2026-04-15 | 13F | Silverlake Wealth Management Llc | 3.582 | 0,14 | 339 | 4,63 | ||||
| 2026-04-15 | 13F | FNY Investment Advisers, LLC | 0 | -100,00 | 0 | |||||
| 2026-02-17 | 13F | XTX Topco Ltd | 36.558 | -1,70 | 3.313 | 11,48 | ||||
| 2026-02-17 | 13F | Private Advisor Group, LLC | 5.815 | -2,74 | 527 | 10,27 | ||||
| 2026-02-13 | 13F | Virtus ETF Advisers LLC | 3.839 | 17,04 | 422 | 28,27 | ||||
| 2026-01-23 | 13F | Natural Investments, Llc | 2.396 | 0 | ||||||
| 2026-01-28 | 13F | HB Wealth Management, LLC | 5.894 | 23,75 | 534 | 40,53 | ||||
| 2026-02-10 | 13F | Ilmarinen Mutual Pension Insurance Co | 41.508 | 0,00 | 4 | 0,00 | ||||
| 2026-02-17 | 13F | Creative Planning | 101.857 | 14,28 | 9.229 | 29,62 | ||||
| 2026-04-22 | 13F | Spire Wealth Management | 550 | 0,00 | 52 | 6,12 | ||||
| 2026-02-10 | 13F | Scheer, Rowlett & Associates Investment Management Ltd. | 0 | -100,00 | 0 | |||||
| 2026-02-13 | 13F | OMERS ADMINISTRATION Corp | 1.886.310 | 68,56 | 171.230 | 91,44 | ||||
| 2026-04-03 | 13F | Adirondack Trust Co | 150 | 0,00 | 14 | 7,69 | ||||
| 2026-02-13 | 13F | Bridgefront Capital, LLC | 2.782 | 252 | ||||||
| 2026-02-17 | 13F | VestGen Advisors, LLC | 3.145 | 285 | ||||||
| 2026-02-17 | 13F | Quantinno Capital Management LP | 85.100 | 25,60 | 7.711 | 42,43 | ||||
| 2026-02-17 | 13F | Dean Investment Associates, Llc | 41.161 | -4,41 | 3.730 | 8,40 | ||||
| 2026-04-21 | 13F | Nemes Rush Group LLC | 14 | 0,00 | 1 | 0,00 | ||||
| 2026-02-09 | 13F | Shufro Rose & Co Llc | 6.000 | 0,00 | 544 | 61,13 | ||||
| 2026-02-10 | 13F | Bnp Paribas Arbitrage, Sa | 8.626 | 66,33 | 782 | 88,65 | ||||
| 2026-02-11 | 13F | SOUTH STATE Corp | 2.000 | 0,00 | 181 | 13,84 | ||||
| 2026-04-24 | 13F | Triasima Portfolio Management inc. | 231.237 | 3,84 | 21.845 | 8,07 | ||||
| 2026-02-11 | 13F | Buckingham Strategic Partners | 3.118 | -7,34 | 283 | 3,30 | ||||
| 2026-02-13 | 13F | Archetype Wealth Partners | 7.044 | 0,00 | 1 | |||||
| 2025-11-12 | 13F | Ameriflex Group, Inc. | 0 | -100,00 | 0 | -100,00 | ||||
| 2026-02-17 | 13F | Ninepoint Partners LP | 37.017 | -10,55 | 3.354 | 1,45 | ||||
| 2026-02-11 | 13F | Fox Run Management, L.l.c. | 0 | -100,00 | 0 | |||||
| 2025-11-10 | 13F | Waratah Capital Advisors Ltd. | Put | 0 | -100,00 | 0 | -100,00 | |||
| 2026-04-15 | 13F | DAVENPORT & Co LLC | 4.533 | 30,33 | 430 | 36,19 | ||||
| 2026-04-24 | 13F | Root Financial Partners, LLC | 33 | 83,33 | 3 | 200,00 | ||||
| 2026-02-11 | 13F | Manchester Capital Management LLC | 1.256 | 114 | ||||||
| 2026-02-17 | 13F | State Of Wisconsin Investment Board | 355.840 | 32.301 | ||||||
| 2026-04-24 | 13F | UMA Financial Services, Inc. | 12 | 0,00 | 1 | 0,00 | ||||
| 2026-04-10 | 13F | Country Trust Bank | 169 | 0,00 | 16 | 6,67 | ||||
| 2026-04-21 | 13F | Pinnacle Associates Ltd | 19.810 | -0,30 | 1.877 | 4,22 | ||||
| 2026-02-10 | 13F | Acadian Asset Management Llc | 2.376.088 | 388,81 | 216 | 465,79 | ||||
| 2026-02-11 | 13F | Group One Trading, L.p. | Call | 10.800 | -45,45 | 979 | -38,14 | |||
| 2026-02-11 | 13F | Group One Trading, L.p. | Put | 3.000 | 50,00 | 272 | 70,44 | |||
| 2026-02-11 | 13F | Allianz Asset Management GmbH | 68.596 | -52,16 | 6.227 | -45,67 | ||||
| 2026-02-12 | 13F | Northwest & Ethical Investments L.P. | 205.685 | -6,77 | 18.667 | 5,96 | ||||
| 2026-02-17 | 13F | Clear Street Markets Llc | 4.300 | 390 | ||||||
| 2026-02-10 | 13F | Bank of New York Mellon Corp | 932.184 | 3,38 | 84.465 | 17,25 | ||||
| 2026-02-12 | 13F | CIBC Private Wealth Group, LLC | 1.519 | 0,00 | 138 | 13,22 | ||||
| 2025-11-04 | 13F | Guerra Advisors Inc | 437 | 35 | ||||||
| 2026-02-17 | 13F | Wiley Bros.-aintree Capital, Llc | 7.182 | -6,94 | 651 | 5,69 | ||||
| 2025-11-13 | 13F | Eisler Capital Management Ltd. | 75.300 | -73,95 | 6.005 | -70,71 | ||||
| 2026-02-12 | 13F | Nuveen, LLC | 2.094.796 | -4,20 | 190.155 | 8,80 | ||||
| 2026-04-20 | 13F | Ritholtz Wealth Management | 19.650 | 17,15 | 1.862 | 22,51 | ||||
| 2026-04-06 | 13F | Highline Wealth Partners Llc | 33 | 0,00 | 3 | 50,00 | ||||
| 2026-04-22 | 13F | Summerhill Capital Management lnc. | 4.352 | 412 | ||||||
| 2026-02-17 | 13F | Qube Research & Technologies Ltd | 484.772 | 44,20 | 43.929 | 63,56 | ||||
| 2026-02-13 | 13F | Parkside Financial Bank & Trust | 829 | 2.758,62 | 75 | 3.650,00 | ||||
| 2026-04-20 | 13F | Assenagon Asset Management S.A. | 33.868 | -2,45 | 3.200 | 1,52 | ||||
| 2026-04-13 | 13F | JCIC Asset Management Inc. | 39.295 | 2,27 | 3.717 | 6,69 | ||||
| 2026-02-04 | 13F | Beverly Hills Private Wealth, LLC | 4.631 | 0,00 | 370 | 0,00 | ||||
| 2026-02-04 | 13F | Dogwood Wealth Management LLC | 72 | 0,00 | 7 | 20,00 | ||||
| 2026-02-05 | 13F | Bank Julius Baer & Co. Ltd, Zurich | 1.204 | 1,09 | 109 | 14,74 | ||||
| 2026-02-17 | 13F | Strive Financial Group ,LLC | 1.968 | 178 | ||||||
| 2026-04-15 | 13F | Fortitude Family Office, LLC | 41 | 0,00 | 4 | 0,00 | ||||
| 2026-02-05 | 13F | Bessemer Group Inc | 109.583 | -10,65 | 10 | 0,00 | ||||
| 2026-02-10 | 13F | Lido Advisors, LLC | 4.031 | 0,00 | 329 | 1,54 | ||||
| 2026-03-20 | 13F | Purpose Unlimited Inc. | 260.539 | 23.619 | ||||||
| 2026-02-17 | 13F | Balyasny Asset Management Llc | 22.562 | 2.045 | ||||||
| 2026-04-15 | 13F | Addenda Capital Inc. | 315.186 | -26,08 | 41.893 | -21,71 | ||||
| 2026-04-07 | 13F | Cardinal Capital Management, Inc. | 1.557.036 | -10,35 | 147.101 | -31,93 | ||||
| 2026-02-03 | 13F | McIlrath & Eck, LLC | 1.936 | 7,08 | 175 | 21,53 | ||||
| 2026-01-29 | 13F | Vanguard Group Inc | 43.097.841 | 2,08 | 3.907.078 | 15,81 | ||||
| 2026-04-16 | 13F | Toth Financial Advisory Corp | 400 | 0,00 | 38 | 2,78 | ||||
| 2026-04-13 | 13F | True Wealth Design, LLC | 101 | 50,75 | 10 | 50,00 | ||||
| 2026-02-17 | 13F | Susquehanna International Group, Llp | Call | 116.400 | -11,75 | 10.547 | 0,09 | |||
| 2026-02-13 | 13F | Smartleaf Asset Management LLC | 1.431 | 97,93 | 131 | 128,07 | ||||
| 2026-02-17 | 13F | Susquehanna International Group, Llp | Put | 82.700 | 30,44 | 7.493 | 47,94 | |||
| 2026-04-13 | 13F | Gradient Investments LLC | 56.350 | 144,16 | 5.339 | 155,33 | ||||
| 2026-02-11 | 13F | Capital International Sarl | 56.614 | 11,06 | 5.139 | 26,14 | ||||
| 2026-02-12 | 13F | Commonwealth Equity Services, Llc | 22.185 | -2,23 | 2.010 | 200.900,00 | ||||
| 2026-04-16 | 13F | Baron Wealth Management LLC | 3.640 | 1,93 | 345 | 6,50 | ||||
| 2026-01-27 | 13F | Lorne Steinberg Wealth Management Inc. | 184.192 | 0,27 | 16.722 | 13,94 | ||||
| 2026-03-12 | 13F | Nalls Sherbakoff Group, Llc | 0 | -100,00 | 0 | |||||
| 2026-04-09 | 13F | Pacifica Partners Inc. | 2.026 | 0,00 | 192 | 3,24 | ||||
| 2026-02-13 | 13F | Cozad Asset Management Inc | 2.814 | 0,00 | 255 | 13,39 | ||||
| 2026-02-02 | 13F | Horizon Investments, LLC | 7 | 1 | ||||||
| 2026-02-13 | 13F | Canerector Inc | 200.000 | 0,00 | 24.886 | 11,89 | ||||
| 2026-02-04 | 13F | Atlantic Union Bankshares Corp | 500 | 0,00 | 45 | 15,38 | ||||
| 2026-03-02 | 13F | Tobam | 0 | -100,00 | 0 | |||||
| 2026-02-13 | 13F | Sienna Gestion | 116.221 | -13,15 | 10.591 | 8,61 | ||||
| 2026-04-07 | 13F | Signaturefd, Llc | 23.689 | 1,32 | 2.245 | 5,95 | ||||
| 2026-02-10 | 13F | Measured Wealth Private Client Group, LLC | 10.387 | -12,00 | 941 | -0,21 | ||||
| 2026-02-11 | 13F | Capital Group Private Client Services, Inc. | 2.592 | 0,00 | 235 | 13,04 | ||||
| 2026-02-18 | 13F | Vident Advisory, LLC | 9.153 | 97,09 | 829 | 123,45 | ||||
| 2026-02-17 | 13F | SIG North Trading, ULC | Call | 1.653.400 | -8,04 | 149.815 | 4,30 | |||
| 2026-02-13 | 13F | Truvestments Capital Llc | 262 | 0,00 | 24 | 15,00 | ||||
| 2026-02-17 | 13F | SIG North Trading, ULC | 503.924 | 45.661 | ||||||
| 2026-01-29 | 13F | IMC-Chicago, LLC | Put | 19.000 | 17,28 | 1.722 | 33,00 | |||
| 2026-02-13 | 13F | Barclays Plc | 69.787 | 95,06 | 6.323 | 121,24 | ||||
| 2026-02-17 | 13F | SIG North Trading, ULC | Put | 2.195.900 | 2,22 | 198.970 | 15,93 | |||
| 2026-01-29 | 13F | IMC-Chicago, LLC | Call | 19.000 | -42,42 | 1.722 | -34,71 | |||
| 2025-11-14 | 13F | Cubist Systematic Strategies, LLC | Put | 24.000 | 1.917 | |||||
| 2026-02-17 | 13F | Captrust Financial Advisors | 4.255 | 23,44 | 386 | 40,00 | ||||
| 2025-11-07 | 13F | Wealth Alliance | 0 | -100,00 | 0 | |||||
| 2025-11-14 | 13F | Cubist Systematic Strategies, LLC | Call | 30.500 | 626,19 | 2.437 | 720,20 | |||
| 2026-04-13 | 13F | Massmutual Trust Co Fsb/adv | 747 | -18,36 | 71 | -14,63 | ||||
| 2026-04-20 | 13F | Provenance Wealth Advisors, LLC | 0 | -100,00 | 0 | |||||
| 2026-02-17 | 13F | Investment Management Corp of Ontario | 290.749 | 38,56 | 26.345 | 57,16 | ||||
| 2026-02-17 | 13F | Murchinson Ltd. | Put | 2.700 | 245 | |||||
| 2026-02-12 | 13F | BlackRock, Inc. | 1.136.708 | 3,66 | 102.997 | 17,57 | ||||
| 2025-11-13 | 13F | Richard W. Paul & Associates, LLC | 0 | -100,00 | 0 | |||||
| 2026-02-17 | 13F | Strategic Investment Advisors / MI | 4.495 | -4,71 | 407 | 8,24 | ||||
| 2026-04-13 | 13F | Mather Group, Llc. | 93 | 9 | ||||||
| 2026-02-09 | 13F | Geode Capital Management, Llc | 8.953.881 | 6,61 | 824.799 | 21,31 | ||||
| 2026-02-17 | 13F | Murchinson Ltd. | Call | 2.700 | 245 | |||||
| 2026-04-22 | 13F | Pictet Asset Management Holding SA | 379.527 | -4,96 | 35.841 | -1,13 | ||||
| 2026-02-13 | 13F | Walleye Trading LLC | Put | 11.900 | 75,00 | 1.078 | 98,53 | |||
| 2026-02-04 | 13F | Asahi Life Asset Management Co., Ltd. | 3.747 | -34,49 | 340 | -25,60 | ||||
| 2026-02-12 | 13F | Principal Securities, Inc. | 0 | -100,00 | 0 | -100,00 | ||||
| 2026-04-24 | 13F | Yousif Capital Management, Llc | 7.841 | 0,00 | 743 | 4,80 | ||||
| 2026-02-13 | 13F | Walleye Trading LLC | Call | 10.400 | -63,89 | 942 | -59,04 | |||
| 2026-02-13 | 13F | Citigroup Inc | 733.192 | -18,80 | 66.556 | -7,78 | ||||
| 2026-02-13 | 13F | Walleye Trading LLC | 18.726 | 1.697 | ||||||
| 2026-01-26 | 13F | Code Waechter LLC | 0 | -100,00 | 0 | |||||
| 2026-02-12 | 13F | Grey Fox Wealth Advisors, LLC | 0 | -100,00 | 0 | |||||
| 2026-01-26 | 13F | Asset Dedication, LLC | 294 | 0,00 | 27 | 13,04 | ||||
| 2026-02-12 | 13F | Jane Street Group, Llc | 438.728 | 245,72 | 39.753 | 292,12 | ||||
| 2026-02-12 | 13F | Andra AP-fonden | 231.300 | -39,78 | 28.781 | -32,62 | ||||
| 2025-11-10 | 13F | Colonial Trust Co / SC | 0 | -100,00 | 0 | |||||
| 2026-01-06 | 13F | Sanctuary Advisors, LLC | 0 | -100,00 | 0 | -100,00 | ||||
| 2026-01-07 | 13F | Aventura Private Wealth, LLC | 757 | -13,78 | 69 | -2,86 | ||||
| 2026-02-06 | 13F | Harvest Portfolios Group Inc. | 52.995 | 0,54 | 4.804 | 14,06 | ||||
| 2026-02-12 | 13F | Jane Street Group, Llc | Call | 17.100 | 2,40 | 1.549 | 16,12 | |||
| 2026-04-17 | 13F | Bell Investment Advisors, Inc | 311 | 7,61 | 29 | 11,54 | ||||
| 2026-02-11 | 13F | CLARET ASSET MANAGEMENT Corp | 147.521 | -1,26 | 13 | 18,18 | ||||
| 2026-02-11 | 13F | TruNorth Capital Management, LLC | 0 | -100,00 | 0 | |||||
| 2026-02-13 | 13F | Aigen Investment Management, Lp | 0 | -100,00 | 0 | |||||
| 2026-02-12 | 13F | Skandinaviska Enskilda Banken AB (publ) | 237.430 | -19,01 | 21.514 | -8,14 | ||||
| 2026-02-10 | 13F | Evolution Wealth Management Inc. | 50 | 5 | ||||||
| 2026-02-04 | 13F | Ameritas Advisory Services, LLC | 0 | -100,00 | 0 | |||||
| 2026-02-11 | 13F | Deutsche Bank Ag\ | 3.960.082 | 1,30 | 358.823 | 14,90 | ||||
| 2026-02-17 | 13F | Jump Financial, LLC | 2.276 | 206 | ||||||
| 2026-02-13 | 13F | Atlas Capital Advisors Llc | 2.326 | 9,51 | 211 | 40,00 | ||||
| 2026-02-11 | 13F | Parallel Advisors, LLC | 3.733 | 9,67 | 338 | 24,72 | ||||
| 2026-02-12 | 13F | Moneta Group Investment Advisors Llc | 7.849 | -4,01 | 711 | 8,88 | ||||
| 2026-04-21 | 13F | Value Partners Investments Inc. | 612.390 | -22,71 | 57.922 | -19,47 | ||||
| 2026-02-18 | 13F | EP Wealth Advisors, Inc. | 2.910 | 264 | ||||||
| 2026-02-09 | 13F | Legal & General Group Plc | 6.475.253 | 1,97 | 587.790 | 15,81 | ||||
| 2026-02-05 | 13F | Baader Bank INC | 0 | -100,00 | 0 | |||||
| 2026-02-05 | 13F | Lockheed Martin Investment Management Co | 0 | -100,00 | 0 | |||||
| 2026-02-14 | 13F | Rockefeller Capital Management L.P. | 9.157 | 86,04 | 830 | 110,94 | ||||
| 2026-02-17 | 13F | Magnetar Financial LLC | 25.159 | 2.280 | ||||||
| 2026-01-20 | 13F | Stratos Wealth Partners, LTD. | 6.657 | 3,89 | 603 | 18,00 | ||||
| 2026-02-17 | 13F | Trexquant Investment LP | 83.072 | 7.527 | ||||||
| 2026-02-13 | 13F | Ubs Asset Management Americas Inc | 919 | -96,81 | 83 | -96,39 | ||||
| 2026-02-11 | 13F | Metis Global Partners, LLC | 43.762 | -16,67 | 3.967 | -5,46 | ||||
| 2026-02-10 | 13F | Savant Capital, LLC | 21.181 | 1,83 | 1.919 | 15,53 | ||||
| 2026-01-21 | 13F | Crews Bank & Trust | 400 | 0,00 | 36 | 16,13 | ||||
| 2025-10-30 | 13F | Twin Peaks Wealth Advisors, LLC | 0 | -100,00 | 0 | |||||
| 2026-02-17 | 13F | Caption Management, LLC | Call | 0 | -100,00 | 0 | ||||
| 2026-01-20 | 13F | Cromwell Holdings LLC | 2.376 | 0,00 | 217 | 13,61 | ||||
| 2026-02-17 | 13F | Agf Management Ltd | 868.400 | 0,63 | 79.126 | 14,10 | ||||
| 2026-01-27 | 13F | Zurcher Kantonalbank (Zurich Cantonalbank) | 1.781.516 | 10,02 | 161.718 | 24,96 | ||||
| 2026-02-11 | 13F | Picton Mahoney Asset Management | 994.736 | -32,66 | 90.306 | 76.430,51 | ||||
| 2026-04-10 | 13F/A | PBU - The Pension Fund of Early Childhood & Youth Educators | 282.370 | 88,97 | 26.676 | 96,67 | ||||
| 2025-11-12 | 13F | Operose Advisors LLC | 0 | -100,00 | 0 | |||||
| 2026-01-28 | 13F | VAUGHAN & Co SECURITIES, INC. | 4.327 | -7,42 | 392 | 5,09 | ||||
| 2026-02-06 | 13F | GPS Wealth Strategies Group, LLC | 158 | -43,77 | 14 | -36,36 | ||||
| 2025-11-04 | 13F | L.m. Kohn & Company | 0 | -100,00 | 0 | |||||
| 2026-01-12 | 13F | Daymark Wealth Partners, Llc | 6.917 | -0,85 | 627 | 12,39 | ||||
| 2026-02-02 | 13F | Truist Financial Corp | 23.910 | -15,15 | 2.166 | -3,78 | ||||
| 2026-04-16 | 13F | Mountain Pacific Investment Advisers Inc/id | 2.200 | 208 | ||||||
| 2026-04-10 | 13F | Pure Financial Advisors, Inc. | 2.943 | 279 | ||||||
| 2026-02-17 | 13F | Two Sigma Securities, Llc | 6.626 | 600 | ||||||
| 2026-02-03 | 13F | Manske Wealth Management | 14.512 | -1,16 | 1.315 | 12,12 | ||||
| 2026-02-10 | 13F | Hillsdale Investment Management Inc. | 1.226.951 | 3,55 | 111.429 | 17,72 | ||||
| 2026-02-13 | 13F | Natixis | 65.997 | -5,55 | 5.980 | 7,11 | ||||
| 2026-02-13 | 13F | Umb Bank N A/mo | 1.212 | 70,22 | 110 | 94,64 | ||||
| 2026-02-13 | 13F | Dynamic Technology Lab Private Ltd | 22.920 | 154,86 | 2.077 | 189,28 | ||||
| 2026-02-17 | 13F | Russell Investments Group, Ltd. | 621.957 | 50,53 | 56.611 | 71,57 | ||||
| 2026-04-10 | 13F | Perfromance Wealth Partners, LLC | 14.446 | 0,00 | 1.369 | 4,59 | ||||
| 2025-11-14 | 13F | AXA Investment Managers S.A. | 392.805 | 31.381 | ||||||
| 2026-02-17 | 13F | Utah Retirement Systems | 105.375 | 0,00 | 9.565 | 13,57 | ||||
| 2025-11-14 | 13F | Mount Yale Investment Advisors, LLC | 0 | -100,00 | 0 | -100,00 | ||||
| 2026-01-13 | 13F | CoreCap Advisors, LLC | 0 | -100,00 | 0 | |||||
| 2026-02-17 | 13F | Blair William & Co/il | 2.628 | -21,99 | 238 | -11,52 | ||||
| 2026-01-27 | 13F | TD Waterhouse Canada Inc. | 3.366.305 | 3,10 | 304.871 | 16,85 | ||||
| 2026-02-12 | 13F | APG Asset Management N.V. | 482.578 | -8,98 | 37.299 | 3,42 | ||||
| 2026-04-13 | 13F | Salem Investment Counselors Inc | 374 | 36 | ||||||
| 2026-02-17 | 13F | FIL Ltd | 12.756.323 | 26,14 | 1.156.438 | 43,10 | ||||
| 2026-02-17 | 13F | Cetera Investment Advisers | 31.918 | 1,37 | 2.892 | 14,99 | ||||
| 2026-02-06 | 13F | Burling Wealth Partners, Llc | 2.340 | 212 | ||||||
| 2026-02-09 | 13F | Hartland & Co., LLC | 1.332 | 0,00 | 121 | 13,21 | ||||
| 2026-02-12 | 13F | Federated Hermes, Inc. | 101.794 | -15,85 | 9.224 | -4,56 | ||||
| 2026-02-09 | 13F | Accent Capital Management, LLC | 240 | 0,00 | 22 | 10,53 | ||||
| 2026-04-08 | 13F | Grove Bank & Trust | 4.862 | 0,00 | 461 | 4,55 | ||||
| 2026-01-28 | 13F | WPG Advisers, LLC | 228 | 62,86 | 21 | 81,82 | ||||
| 2025-10-29 | 13F | Verdence Capital Advisors LLC | 0 | -100,00 | 0 | -100,00 | ||||
| 2026-02-12 | 13F | Campbell & CO Investment Adviser LLC | 18.792 | 5,99 | 1.703 | 20,20 | ||||
| 2026-01-22 | 13F | Cascade Investment Group, Inc. | 4.750 | -8,48 | 430 | 3,86 | ||||
| 2026-02-02 | 13F | Varma Mutual Pension Insurance Co | 193.811 | -1,17 | 17.593 | 12,24 | ||||
| 2026-02-03 | 13F | Sequoia Financial Advisors, LLC | 9.716 | 1,19 | 880 | 14,73 | ||||
| 2026-02-17 | 13F | Point72 Asset Management, L.P. | Call | 11.600 | 1.051 | |||||
| 2026-02-17 | 13F | Algert Global Llc | 28.946 | 9,06 | 3 | 0,00 | ||||
| 2026-02-17 | 13F | Wellington Management Group Llp | 345.315 | -4,19 | 31.346 | 8,81 | ||||
| 2026-02-17 | 13F | Point72 Asset Management, L.P. | 467.806 | 42.395 | ||||||
| 2026-02-17 | 13F | Point72 Asset Management, L.P. | Put | 20.400 | 1.848 | |||||
| 2026-02-11 | 13F | Cerity Partners LLC | 27.996 | -4,47 | 2.537 | 8,33 | ||||
| 2026-02-13 | 13F | National Bank Of Canada /fi/ | 13.589.826 | -2,47 | 1.231.155 | 10,60 | ||||
| 2026-02-19 | 13F | Invesco Ltd. | 2.220.896 | -12,54 | 201.235 | -0,80 | ||||
| 2026-02-24 | 13F | MidFirst Bank | 28.951 | 2.623 | ||||||
| 2026-02-13 | 13F | Evelyn Partners Investment Management (Europe) Ltd | 450 | 0,00 | 41 | 14,29 | ||||
| 2026-02-13 | 13F | Tower Bridge Advisors | 7.614 | 0,00 | 690 | 13,32 | ||||
| 2026-02-02 | 13F | Mutual Advisors, LLC | 2.809 | 0,00 | 255 | 10,92 | ||||
| 2026-02-18 | 13F/A | Alberta Investment Management Corp | 261.100 | 0,00 | 23.671 | 13,48 | ||||
| 2026-04-24 | 13F | USS Investment Management Ltd | 150.983 | 0,95 | 14.286 | 5,35 | ||||
| 2026-02-11 | 13F | Capital International Ltd /ca/ | 48.959 | -6,08 | 4.439 | 6,58 | ||||
| 2026-02-19 | 13F | CI Private Wealth, LLC | 15.726 | 8,33 | 1.425 | 22,95 | ||||
| 2025-11-06 | 13F | Atria Investments Llc | 0 | -100,00 | 0 | |||||
| 2026-02-03 | 13F | Ethic Inc. | 5.693 | 40,71 | 516 | 59,44 | ||||
| 2026-02-06 | 13F | Global Retirement Partners, LLC | 1.432 | 117,96 | 130 | 148,08 | ||||
| 2026-04-15 | 13F | Trust Co Of Toledo Na /oh/ | 4.230 | 0,00 | 401 | 4,44 | ||||
| 2026-02-13 | 13F | American Century Companies Inc | 462.128 | 12,80 | 41.895 | 27,97 | ||||
| 2026-02-17 | 13F | Ancora Advisors, LLC | 47 | 4 | ||||||
| 2026-02-10 | 13F | Envestnet Asset Management Inc | 104.109 | -16,29 | 9.433 | -5,05 | ||||
| 2026-02-11 | 13F | Havemeyer Place LP | 4.000 | 362 | ||||||
| 2026-02-13 | 13F | Clarkston Capital Partners, LLC | 5.000 | 0,00 | 453 | 13,53 | ||||
| 2026-02-13 | 13F | National Bank Of Canada /fi/ | Put | 664 | 2,79 | 6.019 | 16,58 | |||
| 2026-02-12 | 13F | Scotia Capital Inc. | 4.182.725 | -0,57 | 378.788 | 12,75 | ||||
| 2026-01-15 | 13F | Mn Services Vermogensbeheer B.V. | 215.276 | 16,68 | 20 | 35,71 | ||||
| 2026-02-17 | 13F | BTG Pactual Asset Management US LLC | 26.446 | 2.396 | ||||||
| 2026-02-17 | 13F | Cape Investment Advisory, Inc. | 37 | 3 | ||||||
| 2026-02-03 | 13F | K.J. Harrison & Partners Inc | 141.644 | -0,89 | 12.859 | 11,48 | ||||
| 2025-11-14 | 13F | ICONIQ Capital, LLC | 0 | -100,00 | 0 | |||||
| 2026-02-13 | 13F | Y-Intercept (Hong Kong) Ltd | 4.757 | 431 | ||||||
| 2026-02-12 | 13F | Qtron Investments LLC | 20.282 | -10,19 | 1.841 | 1,99 | ||||
| 2026-02-17 | 13F | D. E. Shaw & Co., Inc. | Put | 2.629.900 | 9,13 | 238.442 | 23,85 | |||
| 2026-02-12 | 13F | Hrt Financial Lp | 12.776 | 71,70 | 1 | |||||
| 2026-02-05 | 13F | Stephens Inc /ar/ | 16.775 | -0,04 | 1.520 | 13,43 | ||||
| 2026-02-17 | 13F | D. E. Shaw & Co., Inc. | Call | 968.400 | 9,81 | 87.801 | 24,63 | |||
| 2026-02-09 | 13F | Williamson Legacy Group, LLC | 6.715 | -63,40 | 608 | -58,50 | ||||
| 2026-02-17 | 13F | D. E. Shaw & Co., Inc. | 53.100 | -85,36 | 4.814 | -83,39 | ||||
| 2026-02-12 | 13F | Rossby Financial, LCC | 2.590 | 1,61 | 235 | 14,15 | ||||
| 2026-02-13 | 13F | BRITISH COLUMBIA INVESTMENT MANAGEMENT Corp | 819.777 | 53,25 | 74.319 | 73,90 | ||||
| 2025-11-07 | 13F | Ontario Teachers Pension Plan Board | 0 | -100,00 | 0 | -100,00 | ||||
| 2025-10-28 | 13F | Pinnacle Financial Partners Inc | 171.875 | 0,42 | 13.731 | 13,27 | ||||
| 2026-02-18 | 13F | Guardian Capital Lp | 940.253 | -15,58 | 85.280 | -4,20 | ||||
| 2026-04-13 | 13F | Chesley Taft & Associates LLC | 74.964 | -11,89 | 7.103 | -7,86 | ||||
| 2026-02-10 | 13F | Godfrey Financial Associates, Inc. | 19 | 2 | ||||||
| 2026-02-13 | 13F | Baird Financial Group, Inc. | 37.325 | -5,96 | 3.382 | 6,69 | ||||
| 2026-04-13 | 13F | Nvest Wealth Strategies, Inc. | 3 | 0 | ||||||
| 2026-02-13 | 13F | Morgan Stanley | 4.988.745 | 39,49 | 452.030 | 58,21 | ||||
| 2026-02-13 | 13F | Pathstone Holdings, LLC | 13.736 | 24,16 | 1.247 | 41,11 | ||||
| 2026-02-13 | 13F | National Bank Of Canada /fi/ | Call | 8.044 | -29,88 | 72.917 | -20,47 | |||
| 2026-02-17 | 13F | Optiver Holding B.V. | 0 | -100,00 | 0 | |||||
| 2026-02-17 | 13F | Susquehanna Fundamental Investments, Llc | 499.500 | -13,31 | 45.260 | -1,68 | ||||
| 2026-03-12 | 13F/A | Peak6 Llc | Call | 0 | -100,00 | 0 | -100,00 | |||
| 2026-02-13 | 13F | 1832 Asset Management L.P. | Put | 0 | -100,00 | 0 | -100,00 | |||
| 2026-02-12 | 13F | Brown Brothers Harriman & Co | 1.102 | 78,61 | 100 | 102,04 | ||||
| 2026-02-13 | 13F | Evelyn Partners Investment Management Services Ltd | 185 | 0,00 | 17 | 14,29 | ||||
| 2026-02-13 | 13F | Beutel, Goodman & Co Ltd. | 199.807 | -0,50 | 18 | 12,50 | ||||
| 2026-02-11 | 13F | Simplex Trading, Llc | Put | 0 | -100,00 | 0 | ||||
| 2025-11-14 | 13F | Graham Capital Management, L.P. | 0 | -100,00 | 0 | |||||
| 2026-01-15 | 13F | Frank, Rimerman Advisors LLC | 3.954 | 1,36 | 358 | 15,11 | ||||
| 2026-02-11 | 13F | Simplex Trading, Llc | Call | 0 | -100,00 | 0 | ||||
| 2025-11-06 | 13F | Lantz Financial LLC | 0 | -100,00 | 0 | -100,00 | ||||
| 2026-02-04 | 13F | Pensionmark Financial Group, Llc | 2.788 | 244 | ||||||
| 2026-02-12 | 13F | Jane Street Group, Llc | Put | 0 | -100,00 | 0 | -100,00 | |||
| 2026-02-12 | 13F | Triumph Capital Management | 4.087 | -1,21 | 370 | 12,12 | ||||
| 2026-04-22 | 13F | Gold Investment Management Ltd. | 58.398 | 0,69 | 5.529 | 5,17 | ||||
| 2026-02-17 | 13F | Janus Henderson Group Plc | 195.970 | 1,98 | 17.771 | 15,75 | ||||
| 2026-02-23 | 13F | Mv Capital Management, Inc. | 9 | 1 | ||||||
| 2026-02-17 | 13F | Credit Agricole S A | 45.142 | -19,78 | 4.090 | -9,01 | ||||
| 2026-01-26 | 13F | Cwm, Llc | 2.541 | 11,01 | 0 | |||||
| 2026-02-02 | 13F | Danske Bank A/s | 25.641 | 22,68 | 2.328 | 41,09 | ||||
| 2025-11-14 | 13F | Gluskin Sheff & Assoc Inc | 0 | -100,00 | 0 | |||||
| 2026-02-13 | 13F | Healthcare Of Ontario Pension Plan Trust Fund | 8.449.145 | -13,34 | 766.047 | -1,65 | ||||
| 2026-02-17 | 13F | Capital Fund Management S.a. | Call | 12.400 | -70,05 | 1.124 | -66,04 | |||
| 2026-04-23 | 13F | Lansforsakringar Fondforvaltning AB (publ) | 220.610 | 0,65 | 20.841 | 4,74 | ||||
| 2026-01-16 | 13F | Crewe Advisors LLC | 65 | 0,00 | 6 | 0,00 | ||||
| 2026-02-13 | 13F | Stifel Financial Corp | 37.331 | 50,43 | 3.383 | 70,64 | ||||
| 2026-02-17 | 13F | Capital Fund Management S.a. | Put | 36.300 | -25,00 | 3.289 | -14,92 | |||
| 2026-02-12 | 13F | Waters Parkerson & Co., Llc | 2.400 | 217 | ||||||
| 2026-02-17 | 13F | Ewing Morris & Co. Investment Partners Ltd. | 6.640 | 0,71 | 615 | 15,82 | ||||
| 2026-04-21 | 13F | Red Tortoise LLC | 200 | 0,00 | 19 | 0,00 | ||||
| 2026-02-11 | 13F | Letko, Brosseau & Associates Inc | 1.812.262 | -4,19 | 164.508 | 8,81 | ||||
| 2026-02-17 | 13F | Summit Trail Advisors, Llc | 2.388 | 218 | ||||||
| 2026-04-21 | 13F | Mesirow Financial Investment Management, Inc. | 26.989 | 3,00 | 2.557 | 7,71 | ||||
| 2026-02-11 | 13F | Zions Bancorporation, National Association /ut/ | 144 | 14,29 | 13 | 30,00 | ||||
| 2026-01-15 | 13F | J. Safra Sarasin Holding AG | 28.225 | 236,17 | 2.562 | 281,82 | ||||
| 2025-11-14 | 13F | Mml Investors Services, Llc | 0 | -100,00 | 0 | |||||
| 2026-02-11 | 13F | O'shaughnessy Asset Management, Llc | 238.539 | 5,44 | 21.622 | 19,63 | ||||
| 2026-02-13 | 13F | Prudential Financial Inc | 150.303 | 16,20 | 13.645 | 31,98 | ||||
| 2026-02-13 | 13F | Ieq Capital, Llc | 10.872 | 10,54 | 985 | 25,48 | ||||
| 2026-02-17 | 13F | PharVision Advisers, LLC | 0 | -100,00 | 0 | -100,00 | ||||
| 2026-02-12 | 13F | UniSuper Management Pty Ltd | 18.100 | 12,42 | 2.252 | 25,81 | ||||
| 2025-10-30 | 13F | Envestnet Portfolio Solutions, Inc. | 0 | -100,00 | 0 | -100,00 | ||||
| 2026-02-13 | 13F | Ausdal Financial Partners, Inc. | 2.266 | 205 | ||||||
| 2026-02-17 | 13F | Alliancebernstein L.p. | 116.221 | -23,17 | 10.531 | -12,86 | ||||
| 2026-02-17 | 13F | Two Sigma Advisers, Lp | 0 | -100,00 | 0 | |||||
| 2026-02-05 | 13F | Blume Capital Management, Inc. | 258 | 0,00 | 23 | 15,00 | ||||
| 2026-02-12 | 13F | Kovack Advisors, Inc. | 2.895 | 0,00 | 265 | 14,29 | ||||
| 2026-04-20 | 13F | Sowell Financial Services LLC | 3.478 | 0,84 | 330 | 5,45 | ||||
| 2026-02-11 | 13F | Fiera Capital Corp | 40.010 | -1,36 | 3.628 | 11,98 | ||||
| 2026-02-17 | 13F | Bayesian Capital Management, LP | 0 | -100,00 | 0 | |||||
| 2025-11-14 | 13F | Millennium Management Llc | Call | 0 | -100,00 | 0 | -100,00 | |||
| 2026-02-13 | 13F | DLD Asset Management, LP | Put | 0 | -100,00 | 0 | ||||
| 2026-02-17 | 13F | Guardian Partners Inc. | 0 | -100,00 | 0 | |||||
| 2026-02-13 | 13F | Vontobel Holding Ltd. | 4.860 | 0,00 | 441 | 13,40 | ||||
| 2026-04-22 | 13F | Stone House Investment Management, LLC | 15 | 25,00 | 1 | 0,00 | ||||
| 2026-02-11 | 13F | West Family Investments, Inc. | 6.320 | 0,00 | 573 | 13,49 | ||||
| 2026-02-10 | 13F | PCJ Investment Counsel Ltd. | 5.450 | -90,46 | 494 | -89,17 | ||||
| 2026-02-17 | 13F | Tower Research Capital LLC (TRC) | 12.415 | 588,57 | 1.125 | 680,56 | ||||
| 2026-02-04 | 13F | Income Insurance Ltd | 2.760 | 251 | ||||||
| 2026-02-06 | 13F | Gsa Capital Partners Llp | 2.443 | 0 | ||||||
| 2026-02-17 | 13F | Worldquant Millennium Advisors Llc | 63.693 | 22,85 | 5.776 | 39,45 | ||||
| 2026-02-13 | 13F | Aviso Financial Inc. | 0 | -100,00 | 0 | |||||
| 2026-02-17 | 13F | NewSquare Capital LLC | 69.911 | -30,94 | 6.335 | -21,68 | ||||
| 2025-11-07 | 13F | Sierra Ocean, Llc | 0 | -100,00 | 0 | |||||
| 2026-02-10 | 13F | Gulf International Bank (UK) Ltd | 47.365 | 0,00 | 4 | -20,00 | ||||
| 2026-02-17 | 13F | Susquehanna International Group, Llp | 0 | -100,00 | 0 | -100,00 | ||||
| 2026-04-10 | 13F | Brucke Financial, Inc. | 0 | -100,00 | 0 | |||||
| 2026-01-20 | 13F | JB Capital LLC | 2.926 | 0,00 | 265 | 13,73 | ||||
| 2026-04-09 | 13F | Park Place Capital Corp | 301 | 0,00 | 29 | 3,70 | ||||
| 2026-01-20 | 13F | Independence Bank of Kentucky | 5.646 | 0,00 | 512 | 13,30 | ||||
| 2026-02-03 | 13F | American Assets Investment Management, LLC | 30.000 | 0,00 | 2.718 | 13,44 | ||||
| 2026-02-04 | 13F | Kepler Cheuvreux (Suisse) SA | 287.239 | 105,29 | 35.760 | 129,98 | ||||
| 2026-02-10 | 13F | Forsta Ap-fonden | 204.600 | -9,51 | 18.573 | 2,77 | ||||
| 2026-02-12 | 13F | Xponance, Inc. | 5.846 | 531 | ||||||
| 2026-04-20 | 13F | Ronald Blue Trust, Inc. | 13 | 0,00 | 1 | 0,00 | ||||
| 2026-02-11 | 13F | Tacita Capital Inc | 11.298 | 8,97 | 1.025 | 23,52 | ||||
| 2026-02-04 | 13F | Swiss Life Asset Management Ltd | 79.070 | 1,99 | 7.168 | 15,54 | ||||
| 2026-02-05 | 13F | High Note Wealth, LLC | 144 | 0,00 | 13 | 18,18 | ||||
| 2026-01-15 | 13F | Nisa Investment Advisors, Llc | 209 | 109,00 | 19 | 137,50 | ||||
| 2026-02-06 | 13F | Lsv Asset Management | 1.871 | -28,04 | 0 | |||||
| 2026-04-21 | 13F | Vise Technologies, Inc. | 30.502 | 0,00 | 2.764 | 0,00 | ||||
| 2026-02-13 | 13F | Brown Advisory Inc | 6.438 | 2,55 | 583 | 16,37 | ||||
| 2026-02-13 | 13F | Kestra Advisory Services, LLC | 0 | -100,00 | 0 | |||||
| 2026-02-11 | 13F | LPL Financial LLC | 77.260 | -12,20 | 7.000 | -0,43 | ||||
| 2026-02-12 | 13F | Steward Partners Investment Advisory, Llc | 1.406 | 23,99 | 127 | 41,11 | ||||
| 2026-02-13 | 13F | Korea Investment CORP | 587.259 | -2,40 | 53.309 | 10,84 | ||||
| 2026-02-17 | 13F | Royal Bank Of Canada | Put | 7.283.000 | 17,48 | 659.912 | 33,25 | |||
| 2026-02-13 | 13F | Mariner, LLC | 43.650 | 4,53 | 3.959 | 18,65 | ||||
| 2026-04-13 | 13F | IFP Advisors, Inc | 295 | 0,00 | 28 | 3,85 | ||||
| 2026-02-18 | 13F | GWM Advisors LLC | 0 | -100,00 | 0 | |||||
| 2026-01-13 | 13F | Kathmere Capital Management, LLC | 2.485 | 225 | ||||||
| 2026-02-12 | 13F | Renaissance Technologies Llc | 179.728 | -37,16 | 16.285 | -28,73 | ||||
| 2026-01-14 | 13F | ORG Partners LLC | 229 | 0,00 | 21 | 11,11 | ||||
| 2026-02-17 | 13F | Alphadyne Asset Management, LLC | Call | 40.400 | -3,81 | 3.661 | 9,09 | |||
| 2026-02-12 | 13F | Brinker Capital Investments, LLC | 19.331 | 3,96 | 1.752 | 17,91 | ||||
| 2026-02-17 | 13F | Lazard Asset Management Llc | 234.432 | -21,25 | 21.253 | -10,63 | ||||
| 2026-02-17 | 13F | Alphadyne Asset Management, LLC | Put | 356.900 | 30,30 | 32.339 | 47,79 | |||
| 2026-04-13 | 13F | Affinity Capital Advisors, LLC | 8.505 | 0,02 | 806 | 4,55 | ||||
| 2026-03-18 | 13F | Employees Provident Fund Board | 0 | -100,00 | 0 | |||||
| 2026-01-23 | 13F | Assetmark, Inc | 267.915 | 2,89 | 24.276 | 16,69 | ||||
| 2026-02-06 | 13F | EverSource Wealth Advisors, LLC | 2.527 | 28,80 | 229 | 46,15 | ||||
| 2026-01-28 | 13F | Geneos Wealth Management Inc. | 636 | 0,00 | 58 | 14,00 | ||||
| 2026-02-11 | 13F | Clearbridge Investments, LLC | 7.831 | -13,15 | 710 | -1,53 | ||||
| 2026-02-06 | 13F | Addison Advisors LLC | 480 | 23,08 | 43 | 38,71 | ||||
| 2026-02-23 | 13F | Beaird Harris Wealth Management, LLC | 38 | 0,00 | 3 | 0,00 | ||||
| 2025-11-07 | 13F | Cherokee Insurance Co | 0 | -100,00 | 0 | |||||
| 2026-02-13 | 13F | PCM Encore, LLC | 2.789 | 253 | ||||||
| 2026-02-17 | 13F | BCV Asset Management Inc. | 847.413 | 111.516 | ||||||
| 2026-01-20 | 13F | Cigna Investments Inc /new | 16.523 | -1,30 | 2 | 0,00 | ||||
| 2025-11-13 | 13F | Twin Tree Management, LP | Call | 0 | -100,00 | 0 | -100,00 | |||
| 2026-04-20 | 13F | Keudell/Morrison Wealth Management | 6.253 | -1,57 | 592 | 2,96 | ||||
| 2026-04-20 | 13F | City State Bank | 995 | 0,00 | 94 | 4,44 | ||||
| 2026-02-13 | 13F | SRS Capital Advisors, Inc. | 2.787 | -32,49 | 253 | -23,40 | ||||
| 2026-01-22 | 13F | Massachusetts Financial Services Co /ma/ | 5.112 | -96,37 | 463 | -95,89 | ||||
| 2026-02-05 | 13F | Allworth Financial LP | 1.406 | 0,36 | 127 | 14,41 | ||||
| 2026-04-17 | 13F | AdvisorNet Financial, Inc | 532 | 19,55 | 50 | 25,00 | ||||
| 2026-04-06 | 13F | Rosenberg Matthew Hamilton | 142 | 0,00 | 13 | 8,33 | ||||
| 2025-11-12 | 13F | CIBC Bancorp USA Inc. | 130.968 | 11.217 | ||||||
| 2026-01-23 | 13F | Bridgewater Advisors Inc. | 3.402 | 4,23 | 311 | 13,50 | ||||
| 2026-02-13 | 13F | Great West Life Assurance Co /can/ | 443.063 | -42,42 | 40 | -34,43 | ||||
| 2026-04-22 | 13F | Janney Montgomery Scott LLC | 41.356 | -0,85 | 4 | 0,00 | ||||
| 2026-04-17 | 13F | Cidel Asset Management Inc | 489.753 | 61,06 | 46.268 | 67,62 | ||||
| 2026-01-28 | 13F | Kingswood Wealth Advisors, Llc | 7.499 | 1,04 | 679 | 14,70 | ||||
| 2026-01-29 | 13F | UBS Group AG | 525.299 | 33,54 | 47.597 | 51,46 | ||||
| 2026-04-14 | 13F | Nbc Securities, Inc. | 588 | -4,08 | 56 | 0,00 | ||||
| 2026-02-02 | 13F | Intact Investment Management Inc. | 490.870 | 33,37 | 44.499 | 51,29 | ||||
| 2026-04-15 | 13F | Valley National Advisers Inc | 146 | 0,00 | 0 | |||||
| 2026-02-09 | 13F | Coldstream Capital Management Inc | 2.648 | 240 | ||||||
| 2026-04-20 | 13F | Naples Global Advisors, Llc | 75.149 | -1,43 | 7.167 | 2,90 | ||||
| 2026-02-17 | 13F | Engineers Gate Manager LP | 26.704 | 2.420 | ||||||
| 2026-02-17 | 13F | Quadrature Capital Ltd | 0 | -100,00 | 0 | |||||
| 2026-01-22 | 13F | Greenberg Financial Group | 2.719 | -0,07 | 246 | -4,28 | ||||
| 2026-02-13 | 13F | Royal London Asset Management Ltd | 40.418 | -13,97 | 3.662 | -2,42 | ||||
| 2026-02-18 | 13F | Achmea Investment Management B.V. | 0 | -100,00 | 0 | |||||
| 2026-01-22 | 13F | Bear Mountain Capital, Inc. | 0 | -100,00 | 0 | |||||
| 2026-02-17 | 13F | ExodusPoint Capital Management, LP | 0 | -100,00 | 0 | -100,00 | ||||
| 2026-04-20 | 13F | Jfs Wealth Advisors, Llc | 325 | 0,00 | 31 | 3,45 | ||||
| 2026-01-09 | 13F | SG Americas Securities, LLC | 0 | -100,00 | 0 | |||||
| 2026-02-11 | 13F | Group One Trading, L.p. | 0 | -100,00 | 0 | -100,00 | ||||
| 2026-02-12 | 13F | Bank Of Nova Scotia Trust Co | 105.964 | 7,04 | 9.601 | 21,41 | ||||
| 2026-02-02 | 13F | Benjamin Edwards Inc | 4.170 | 4,04 | 378 | 17,81 | ||||
| 2025-11-14 | 13F | Virtu Financial LLC | 0 | -100,00 | 0 | |||||
| 2026-04-09 | 13F | Tompkins Financial Corp | 2.000 | 0,00 | 190 | 4,42 | ||||
| 2026-02-02 | 13F | Qrg Capital Management, Inc. | 2.373 | 215 | ||||||
| 2026-02-13 | 13F | Caitong International Asset Management Co., Ltd | 274 | -61,68 | 25 | -57,89 | ||||
| 2026-04-14 | 13F | Sanchez Gaunt Capital Management, LLC | 4.754 | 450 | ||||||
| 2026-02-12 | 13F | Federation des caisses Desjardins du Quebec | 3.765.617 | -26,12 | 341.217 | -16,26 | ||||
| 2026-04-13 | 13F | Creative Financial Designs Inc /adv | 88 | 633,33 | 8 | 700,00 | ||||
| 2026-02-13 | 13F | Bard Associates Inc | 111 | 10 | ||||||
| 2026-01-30 | 13F | Lincluden Management Ltd | 329.398 | -14,63 | 41 | 33,33 | ||||
| 2026-02-11 | 13F | Syon Capital Llc | 3.617 | 328 | ||||||
| 2026-01-22 | 13F | Bartlett & Co. Wealth Management Llc | 6.804 | 0,00 | 617 | 13,44 | ||||
| 2026-02-09 | 13F | CBIZ Investment Advisory Services, LLC | 3.072 | 0,00 | 278 | 13,47 | ||||
| 2026-02-13 | 13F | BNP Paribas Asset Management Holding S.A. | 618.528 | 3.890,76 | 76 | 7.500,00 | ||||
| 2026-01-30 | 13F | Us Bancorp \de\ | 14.646 | 6,91 | 1.327 | 21,30 | ||||
| 2026-02-13 | 13F | Kayne Anderson Rudnick Investment Management Llc | 70 | 0,00 | 6 | 20,00 | ||||
| 2026-02-11 | 13F | Westerkirk Capital Inc. | 2.597 | -93,42 | 236 | -92,55 | ||||
| 2026-02-13 | 13F | JustInvest LLC | 42.729 | 10,58 | 3.872 | 25,40 | ||||
| 2026-02-17 | 13F | Citadel Advisors Llc | Call | 78.300 | -86,70 | 7.095 | -84,92 | |||
| 2026-02-13 | 13F | PARK CIRCLE Co | 28.000 | 0,00 | 2.537 | 13,46 | ||||
| 2026-02-17 | 13F | Citadel Advisors Llc | 616.865 | -33,55 | 55.894 | -24,64 | ||||
| 2026-02-17 | 13F | Citadel Advisors Llc | Put | 245.300 | -4,18 | 22.227 | 8,68 | |||
| 2026-02-17 | 13F | Royal Bank Of Canada | Call | 4.057.100 | 24,03 | 367.614 | 40,67 | |||
| 2026-02-17 | 13F | SageView Advisory Group, LLC | 54 | 5 | ||||||
| 2026-02-17 | 13F | Royal Bank Of Canada | 66.169.117 | -17,27 | 5.995.586 | -6,17 | ||||
| 2025-11-13 | 13F | Periscope Capital Inc. | Call | 0 | -100,00 | 0 | ||||
| 2026-02-12 | 13F | Groupe la Francaise | 337 | 0,00 | 31 | 15,38 | ||||
| 2025-11-21 | 13F | Nebula Research & Development LLC | 0 | -100,00 | 0 | -100,00 | ||||
| 2026-04-22 | 13F | Advocate Investing Services LLC | 29 | 0,00 | 3 | 0,00 | ||||
| 2026-02-17 | 13F | Caisse De Depot Et Placement Du Quebec | 1.201.554 | 109,90 | 109.071 | 138,39 | ||||
| 2026-02-02 | 13F | Principal Financial Group Inc | 37.700 | -7,14 | 3.422 | 5,45 | ||||
| 2026-02-11 | 13F | Capital International Inc /ca/ | 45.211 | -20,58 | 4.102 | -9,85 | ||||
| 2026-01-26 | 13F | Private Trust Co Na | 153 | -18,62 | 14 | -13,33 | ||||
| 2026-02-03 | 13F | Generali Asset Management SPA SGR | 18.302 | 590,38 | 2.277 | 674,49 | ||||
| 2026-02-17 | 13F | Tudor Investment Corp Et Al | Call | 7.600 | -53,37 | 689 | -47,16 | |||
| 2026-02-17 | 13F | Tudor Investment Corp Et Al | Put | 21.100 | 58,65 | 1.912 | 79,94 | |||
| 2026-04-20 | 13F | Cardinal Point Capital Management, ULC | 28.249 | -4,07 | 2.672 | -0,07 | ||||
| 2026-04-15 | 13F | Merit Financial Group, LLC | 2.881 | 17,78 | 273 | 23,08 | ||||
| 2025-11-12 | 13F | HAP Trading, LLC | 27.882 | 3.089 | ||||||
| 2026-02-17 | 13F | Millennium Management Llc | 715.297 | 70,95 | 64.843 | 93,95 | ||||
| 2026-02-10 | 13F | Td Asset Management Inc | 22.700.518 | -0,23 | 2.060.638 | 13,31 | ||||
| 2026-02-17 | 13F | Millennium Management Llc | Put | 712.500 | 16,33 | 88.656 | 30,15 | |||
| 2026-02-18 | 13F | Mackenzie Financial Corp | 10.800.606 | 69,27 | 986.173 | 93,46 | ||||
| 2026-02-17 | 13F | Grantham, Mayo, Van Otterloo & Co. LLC | 56.855 | -53,17 | 5.160 | -46,83 | ||||
| 2026-02-13 | 13F | Integrated Wealth Concepts LLC | 0 | -100,00 | 0 | |||||
| 2026-02-03 | 13F | SBI Securities Co., Ltd. | 497 | -16,61 | 45 | -4,26 | ||||
| 2026-02-17 | 13F | Mercer Global Advisors Inc /adv | 11.045 | 17,40 | 1.001 | 33,16 | ||||
| 2026-02-18 | 13F | Caitlin John, LLC | 15 | 0,00 | 1 | 0,00 | ||||
| 2026-02-13 | 13F | Centiva Capital, LP | 9.430 | 854 | ||||||
| 2026-02-17 | 13F | PDT Partners, LLC | 115.175 | 0,00 | 10.436 | 13,42 | ||||
| 2026-02-13 | 13F | Colony Group, LLC | 11.295 | 16,07 | 1.024 | 32,68 | ||||
| 2026-02-11 | 13F | Erste Asset Management GmbH | 0 | 0 | ||||||
| 2026-02-05 | 13F | Td Private Client Wealth Llc | 19 | -90,16 | 2 | -93,33 | ||||
| 2026-02-10 | 13F | Connor, Clark & Lunn Investment Management Ltd. | 9.231.352 | -10,81 | 836.861 | 1,21 | ||||
| 2026-02-13 | 13F | Manufacturers Life Insurance Company, The | 0 | -100,00 | 0 | |||||
| 2026-02-17 | 13F | Aqr Capital Management Llc | 415.892 | 766,41 | 37.701 | 883,33 | ||||
| 2026-02-10 | 13F | Goldman Sachs Group Inc | 4.518.157 | -37,55 | 409.390 | -29,17 | ||||
| 2026-02-05 | 13F | Mission Wealth Management, Lp | 5.119 | 0,00 | 464 | 13,48 | ||||
| 2026-02-09 | 13F | Hantz Financial Services, Inc. | 14 | 0,00 | 0 | |||||
| 2025-11-14 | 13F | Peak6 Llc | Put | 0 | -100,00 | 0 | -100,00 | |||
| 2026-01-21 | 13F | Brown Shipley& Co Ltd | 4.860 | -7,60 | 441 | 5,00 | ||||
| 2026-02-13 | 13F | Macquarie Group Ltd | 0 | -100,00 | 0 | |||||
| 2026-02-10 | 13F | Goldman Sachs Group Inc | Call | 1.025.000 | 0,00 | 92.875 | 13,42 | |||
| 2026-02-13 | 13F | Public Sector Pension Investment Board | 0 | -100,00 | 0 | |||||
| 2026-02-04 | 13F | Independent Advisor Alliance | 3.926 | 17,79 | 356 | 33,46 | ||||
| 2026-02-09 | 13F | Westover Capital Advisors, LLC | 4.200 | 0,00 | 381 | 13,43 | ||||
| 2026-01-28 | 13F | DekaBank Deutsche Girozentrale | 207.845 | 0,00 | 11 | -37,50 | ||||
| 2026-02-09 | 13F | Beck Bode, LLC | Call | 0 | -100,00 | 0 | ||||
| 2026-02-03 | 13F | Crestwood Advisors Group LLC | 7.601 | 5,38 | 689 | 19,44 | ||||
| 2026-02-12 | 13F | Quadrant Capital Group Llc | 30.601 | 0,00 | 2.773 | 13,42 | ||||
| 2026-02-17 | 13F | Hilltop Holdings Inc. | 0 | -100,00 | 0 | -100,00 | ||||
| 2026-01-23 | 13F | Rsm Us Wealth Management Llc | 2.312 | -35,56 | 211 | -26,99 | ||||
| 2026-02-13 | 13F | Van Eck Associates Corp | 622.369 | 19,45 | 56 | 36,59 | ||||
| 2026-02-05 | 13F | Leuthold Group, Llc | 86.430 | 0,33 | 7.831 | 13,81 | ||||
| 2026-02-17 | 13F | Warren Averett Asset Management, LLC | 4.111 | 372 | ||||||
| 2026-04-16 | 13F | Center For Asset Management LLC | 3.763 | 0,61 | 357 | 5,33 | ||||
| 2025-11-14 | 13F | Wolverine Trading, Llc | Put | 16.200 | 39,66 | 1.289 | 59,53 | |||
| 2026-02-10 | 13F | Nomura Asset Management Co Ltd | 0 | 0 | ||||||
| 2026-02-17 | 13F | Public Employees Retirement System Of Ohio | 105.096 | 49,76 | 9.540 | 70,07 | ||||
| 2026-02-05 | 13F | Cambridge Investment Research Advisors, Inc. | 7.319 | -1,67 | 1 | |||||
| 2026-04-01 | 13F | Bangor Savings Bank | 0 | -100,00 | 0 | |||||
| 2026-02-17 | 13F | Laird Norton Trust Company, Llc | 24.202 | 2.212 | ||||||
| 2025-11-14 | 13F | Wolverine Trading, Llc | 22.910 | 38,22 | 1.823 | 57,97 | ||||
| 2026-04-07 | 13F | Five Oceans Advisors | 3.675 | 0,00 | 348 | 4,82 | ||||
| 2026-02-13 | 13F | First Trust Advisors Lp | 562.559 | -11,10 | 50.983 | 0,85 | ||||
| 2025-11-14 | 13F | Wolverine Trading, Llc | Call | 20.200 | -57,47 | 1.608 | -51,44 | |||
| 2026-02-13 | 13F | Cornerstone Financial Management LLC | 36 | 3 | ||||||
| 2026-02-17 | 13F | Jones Financial Companies Lllp | 18.922 | 6,24 | 1.714 | 19,19 | ||||
| 2026-02-17 | 13F | Northern Trust Corp | 810.799 | 8,23 | 73.466 | 22,76 | ||||
| 2026-02-17 | 13F | Zurich Insurance Group Ltd/FI | 373.557 | -35,88 | 33.897 | -27,13 | ||||
| 2026-02-19 | 13F | Atomi Financial Group, Inc. | 13.814 | 11,86 | 1.252 | 26,88 | ||||
| 2026-01-14 | 13F | Net Worth Advisory Group | 2.854 | 259 | ||||||
| 2026-04-15 | 13F | Compagnie Lombard Odier SCmA | 2.000 | 0,00 | 189 | 3,87 | ||||
| 2026-02-02 | 13F | Cornerstone Planning Group LLC | 130 | 14,04 | 12 | 33,33 | ||||
| 2026-01-07 | 13F | Sagespring Wealth Partners, Llc | 3.268 | 13,00 | 296 | 28,14 | ||||
| 2026-02-10 | 13F | Natixis Advisors, L.p. | 52.645 | 13,22 | 5 | 33,33 | ||||
| 2026-01-26 | 13F | Slagle Financial, LLC | 2.554 | -1,84 | 231 | 11,59 | ||||
| 2026-02-11 | 13F | Twin Tree Management, LP | Put | 74.500 | -40,45 | 6.750 | -32,46 | |||
| 2026-02-17 | 13F | Capstone Investment Advisors, Llc | 9.136 | 828 | ||||||
| 2026-04-07 | 13F | Park Avenue Securities Llc | 4.309 | 0 | ||||||
| 2025-11-07 | 13F | Shell Asset Management Co | 30.326 | -35,97 | 2 | -33,33 | ||||
| 2026-02-13 | 13F | Charles Schwab Investment Management Inc | 2.629.228 | 1,65 | 238.668 | 15,45 | ||||
| 2026-02-13 | 13F | Arrowstreet Capital, Limited Partnership | 347.918 | 31.538 | ||||||
| 2026-02-17 | 13F | Advisory Services Network, LLC | 0 | -100,00 | 0 | |||||
| 2026-02-04 | 13F | CAP Partners, LLC | 2.933 | -4,31 | 266 | 8,61 | ||||
| 2026-04-22 | 13F | Viewpoint Investment Partners Corp | 4.534 | 437 | ||||||
| 2026-02-13 | 13F | Sei Investments Co | 15.446 | 6,86 | 1.399 | 21,13 | ||||
| 2026-01-15 | 13F | Lodestone Wealth Management LLC | 408 | 37 | ||||||
| 2026-02-10 | 13F | Smith Group Asset Management, LLC | 83.940 | 16,00 | 7.606 | 31,57 | ||||
| 2026-02-11 | 13F | Capital Analysts, Inc. | 0 | -100,00 | 0 | |||||
| 2026-02-12 | 13F | Bank Of Montreal /can/ | Call | 323.400 | 7.086,67 | 29.319 | 8.066,57 | |||
| 2026-02-09 | 13F | Annis Gardner Whiting Capital Advisors, LLC | 169 | 15 | ||||||
| 2026-02-12 | 13F | Bank Of Montreal /can/ | Put | 202.300 | 1,15 | 18.340 | 14,78 | |||
| 2026-02-12 | 13F | Bank Of Montreal /can/ | 42.400.895 | 10,40 | 3.843.977 | 25,27 | ||||
| 2026-01-30 | 13F | Mitsubishi UFJ Trust & Banking Corp | 285.726 | -25,34 | 25.597 | -16,31 | ||||
| 2026-02-17 | 13F | Advisor Group Holdings, Inc. | 9.400 | -67,95 | 852 | -63,43 | ||||
| 2026-02-17 | 13F | Maryland State Retirement & Pension System | 156.046 | 1,17 | 14.153 | 14,87 | ||||
| 2025-11-14 | 13F | Horizon Kinetics Asset Management Llc | 0 | -100,00 | 0 | |||||
| 2026-02-02 | 13F | Fifth Third Bancorp | 1.337 | 12,73 | 121 | 28,72 | ||||
| 2025-11-14 | 13F | Scientech Research LLC | 0 | -100,00 | 0 | -100,00 | ||||
| 2026-04-06 | 13F | CX Institutional | 575 | -20,36 | 0 | |||||
| 2026-02-11 | 13F | Franklin Resources Inc | 1.235.693 | 6,98 | 112.024 | 21,40 | ||||
| 2026-02-13 | 13F | Blueshift Asset Management, LLC | 7.146 | 647 | ||||||
| 2026-02-09 | 13F | Expressive Wealth LLC | 3.360 | 304 | ||||||
| 2026-02-13 | 13F | Neuberger Berman Group LLC | 424.830 | 5,29 | 38.564 | 19,58 | ||||
| 2026-02-06 | 13F | HighTower Advisors, LLC | 35.736 | 0,24 | 3.238 | 13,73 | ||||
| 2026-01-23 | 13F | LOM Asset Management Ltd | 1.150 | 143 | ||||||
| 2026-02-17 | 13F | Raymond James Financial Inc | 96.324 | 18,63 | 8.728 | 34,55 | ||||
| 2026-04-23 | 13F | MQS Management LLC | 0 | -100,00 | 0 | |||||
| 2026-02-13 | 13F | Candriam Luxembourg S.C.A. | 309.065 | -3,25 | 28.056 | 9,89 | ||||
| 2026-02-11 | 13F | Capital International Investors | 4.155.990 | 0,42 | 376.766 | 13,93 | ||||
| 2026-02-13 | 13F | Pinnacle Wealth Planning Services, Inc. | 271 | 25 | ||||||
| 2026-02-13 | 13F | MAI Capital Management | 570 | 13,10 | 52 | 27,50 | ||||
| 2026-02-17 | 13F | Glenmede Trust Co Na | 5.201 | 40,45 | 471 | 126,44 | ||||
| 2025-11-12 | 13F | Cresset Asset Management, LLC | 2.561 | 205 | ||||||
| 2026-02-17 | 13F | Mairs & Power Inc | 10.176 | 0,00 | 922 | 13,55 | ||||
| 2026-04-15 | 13F | Avanza Fonder AB | 60.397 | 0,00 | 7.963 | 5,95 | ||||
| 2026-02-12 | 13F | Barometer Capital Management Inc. | 0 | -100,00 | 0 | |||||
| 2026-02-17 | 13F | Bank Of America Corp /de/ | 2.713.237 | -32,15 | 245.846 | -23,05 | ||||
| 2026-02-17 | 13F | Guggenheim Capital Llc | 2.979 | -18,00 | 270 | -7,24 | ||||
| 2026-01-14 | 13F | Hennion & Walsh Asset Management, Inc. | 23.969 | -1,09 | 2.172 | 12,20 | ||||
| 2026-01-27 | 13F | Berger Financial Group, Inc | 9.961 | 0,00 | 903 | 13,46 | ||||
| 2026-02-13 | 13F | Verition Fund Management LLC | 0 | -100,00 | 0 | |||||
| 2025-11-14 | 13F | Axa S.a. | 0 | -100,00 | 0 | -100,00 | ||||
| 2026-02-03 | 13F | Crossmark Global Holdings, Inc. | 173.781 | -6,86 | 15.746 | 5,64 | ||||
| 2026-02-04 | 13F | Plato Investment Management Ltd | 42.022 | 0,00 | 3.833 | 15,00 | ||||
| 2026-02-09 | 13F | Genus Capital Management Inc. | 99.055 | 104,55 | 8.992 | 132,33 | ||||
| 2026-02-10 | 13F | Norges Bank | 10.571.669 | 958.383 | ||||||
| 2026-02-13 | 13F | Rhumbline Advisers | 3.593 | -1,64 | 326 | 11,68 | ||||
| 2026-02-12 | 13F | Aviva Plc | 794.957 | 6,44 | 72.124 | 20,96 | ||||
| 2026-04-17 | 13F | Brown, Lisle/cummings, Inc. | 45 | 4 | ||||||
| 2026-02-13 | 13F | Police & Firemen's Retirement System of New Jersey | 125.443 | -7,81 | 11.387 | 4,71 | ||||
| 2026-02-06 | 13F | Intrust Bank Na | 0 | -100,00 | 0 | |||||
| 2026-02-18 | 13F/A | Pinnacle Financial Partners, Inc. | 170.733 | 15.470 | ||||||
| 2025-11-06 | 13F | Abich Financial Wealth Management LLC | 7 | 1 | ||||||
| 2025-11-12 | 13F | Headlands Technologies LLC | 0 | -100,00 | 0 | -100,00 | ||||
| 2026-02-11 | 13F | Capital Group Investment Management Pte. Ltd. | 14.211 | 0,00 | 1.290 | 13,66 | ||||
| 2026-02-13 | 13F | Towarzystwo Funduszy Inwestycyjnych Pzu Sa | 0 | -100,00 | 0 | |||||
| 2026-01-26 | 13F | Moran Wealth Management, LLC | 4.050 | -18,43 | 367 | -7,58 | ||||
| 2026-03-20 | 13F/A | Hsbc Holdings Plc | 0 | -100,00 | 0 | -100,00 | ||||
| 2026-02-11 | 13F | Twin Tree Management, LP | 0 | -100,00 | 0 | -100,00 | ||||
| 2026-02-17 | 13F | Ameriprise Financial Inc | 22.411 | -11,94 | 2.582 | -1,60 | ||||
| 2025-11-14 | 13F | Wetherby Asset Management Inc | 15.064 | -0,35 | 1.203 | 12,43 | ||||
| 2026-01-30 | 13F/A | M&t Bank Corp | 7.610 | -7,81 | 690 | 4,55 | ||||
| 2026-02-10 | 13F | Private Wealth Asset Management, LLC | 21 | 0,00 | 2 | 0,00 | ||||
| 2026-02-10 | 13F | CIBC World Markets Inc. | 12.010.183 | 1,34 | 1.088.243 | 14,94 | ||||
| 2026-02-13 | 13F | Evelyn Partners Investment Management LLP | 3.209 | 0,00 | 291 | 13,28 | ||||
| 2025-11-06 | 13F | Oppenheimer & Co Inc | 0 | -100,00 | 0 | -100,00 | ||||
| 2025-11-14 | 13F | Logan Capital Management Inc | 0 | -100,00 | 0 | -100,00 | ||||
| 2026-02-12 | 13F | Penserra Capital Management LLC | 57 | 0,00 | 0 | |||||
| 2026-02-12 | 13F | BRYN MAWR TRUST Co | 152 | 0,00 | 14 | 8,33 | ||||
| 2026-02-12 | 13F | Swiss Re Ltd | 237 | 22 | ||||||
| 2026-02-17 | 13F | EFG International AG | 390 | 35 | ||||||
| 2026-01-27 | 13F | Evergreen Capital Management Llc | 10.095 | -3,54 | 915 | 9,33 | ||||
| 2026-04-23 | 13F | North Star Investment Management Corp. | 416 | 1,22 | 39 | 5,41 | ||||
| 2026-02-09 | 13F | Waratah Capital Advisors Ltd. | Call | 150.000 | 13.592 | |||||
| 2025-11-14 | 13F | Strategic Wealth Partners, Ltd. | 250 | 0,00 | 20 | 11,76 | ||||
| 2026-02-10 | 13F | Texas Yale Capital Corp. | 6.920 | 0,00 | 627 | 13,59 | ||||
| 2026-02-13 | 13F | Walleye Capital LLC | Put | 47.400 | 96,68 | 4.295 | 123,06 | |||
| 2026-02-03 | 13F | Ballentine Partners, LLC | 2.488 | 225 | ||||||
| 2026-02-17 | 13F | Sciencast Management LP | 43.677 | 3.958 | ||||||
| 2026-02-13 | 13F | Walleye Capital LLC | 361 | 33 | ||||||
| 2026-02-13 | 13F | Walleye Capital LLC | Call | 24.200 | 80,60 | 2.193 | 104,86 | |||
| 2025-10-31 | 13F | Whittier Trust Co Of Nevada Inc | 0 | -100,00 | 0 | |||||
| 2026-02-09 | 13F | Fisher Asset Management, LLC | 2.102.615 | 24,65 | 190.518 | 41,38 | ||||
| 2026-02-12 | 13F | Ensign Peak Advisors, Inc | 39.400 | 0,00 | 3.577 | 13,56 | ||||
| 2026-04-14 | 13F | Hudson Value Partners, LLC | 12.582 | 0,00 | 1.192 | 4,56 | ||||
| 2026-02-11 | 13F | 111 Capital | 6.864 | 622 | ||||||
| 2026-02-09 | 13F | Waratah Capital Advisors Ltd. | 200.809 | 79,60 | 18.195 | 103,71 | ||||
| 2026-02-10 | 13F | Sivia Capital Partners, LLC | 3.832 | 3,12 | 347 | 17,23 | ||||
| 2026-04-23 | 13F | SJS Investment Consulting Inc. | 43 | 0,00 | 4 | 33,33 | ||||
| 2026-02-13 | 13F | Mufg Securities (canada), Ltd. | 1.414.164 | -8,06 | 128.231 | 4,35 | ||||
| 2026-02-17 | 13F | Fmr Llc | 151.506 | -93,38 | 13.734 | -92,49 | ||||
| 2026-04-08 | 13F | High Point Wealth Management, LLC | 100 | 9 | ||||||
| 2026-04-08 | 13F | Wealth Enhancement Advisory Services, Llc | 3.940 | -4,51 | 379 | 1,07 | ||||
| 2026-01-29 | 13F | Quest 10 Wealth Builders, Inc. | 147 | -1,34 | 13 | 18,18 | ||||
| 2026-02-09 | 13F | Harbour Investments, Inc. | 641 | 0,00 | 58 | 13,73 | ||||
| 2026-02-17 | 13F | Man Group plc | 40.190 | 71,28 | 3.642 | 94,29 | ||||
| 2026-02-05 | 13F | Tucker Asset Management Llc | 36 | 3 | ||||||
| 2026-02-17 | 13F | Amundi | 2.422.305 | 5,47 | 219.710 | 17,00 | ||||
| 2026-01-12 | 13F | CVA Family Office, LLC | 78 | 0,00 | 7 | 16,67 | ||||
| 2026-02-13 | 13F | Bank Of Nova Scotia | 12.626.278 | -17,46 | 1.144.607 | -6,37 | ||||
| 2026-02-05 | 13F | Elyxium Wealth, LLC | 18 | 2 | ||||||
| 2026-02-13 | 13F | Wells Fargo & Company/mn | 61.830 | -7,50 | 5.609 | 5,02 | ||||
| 2026-04-06 | 13F | GAMMA Investing LLC | 381 | 0,00 | 36 | 5,88 | ||||
| 2026-04-10 | 13F | Octavia Wealth Advisors, LLC | 11.728 | -3,11 | 1.120 | 1,27 | ||||
| 2026-02-12 | 13F | JPL Wealth Management, LLC | 0 | -100,00 | 0 | |||||
| 2026-02-13 | 13F | LRT Capital Management, LLC | 0 | -100,00 | 0 | |||||
| 2026-02-17 | 13F | Toronto Dominion Bank | Call | 1.025.800 | -20,56 | 92.997 | -9,86 | |||
| 2026-02-17 | 13F | Caption Management, LLC | 26.000 | 2.356 | ||||||
| 2026-02-17 | 13F | Caption Management, LLC | Put | 496.400 | -0,60 | 44.979 | 12,74 | |||
| 2026-02-09 | 13F | Nicola Wealth Management Ltd. | 0 | -100,00 | 0 | |||||
| 2025-11-07 | 13F | CenterBook Partners LP | 5.119 | -62,63 | 409 | -57,94 | ||||
| 2026-02-17 | 13F | Toronto Dominion Bank | 21.355.814 | -5,77 | 1.936.087 | 6,94 | ||||
| 2026-01-26 | 13F | Lipe & Dalton | 80.660 | -1,44 | 7 | 16,67 | ||||
| 2026-02-17 | 13F | Toronto Dominion Bank | Put | 624.500 | -23,70 | 56.616 | -13,42 | |||
| 2026-02-06 | 13F | Cumberland Partners Ltd | 15.140 | 14,26 | 1.374 | 29,77 | ||||
| 2026-02-10 | 13F | DiMeo Schneider & Associates, L.L.C. | 0 | -100,00 | 0 | |||||
| 2026-04-23 | 13F | Forum Financial Management, LP | 0 | -100,00 | 0 | |||||
| 2026-02-11 | 13F | Jpmorgan Chase & Co | 4.143.191 | -52,80 | 375.415 | -46,46 | ||||
| 2026-02-17 | 13F | Lombard Odier Asset Management (Switzerland) SA | 42.960 | 284,95 | 3.895 | 337,04 | ||||
| 2026-04-07 | 13F | Farther Finance Advisors, LLC | 1.235 | 12,79 | 119 | 19,19 | ||||
| 2026-04-24 | 13F | Bellevue Asset Management, Llc | 870 | 0,00 | 82 | 5,13 | ||||
| 2026-02-10 | 13F | State of Wyoming | 12.300 | -3,53 | 1.117 | 9,52 | ||||
| 2026-02-06 | 13F | Leonteq Securities AG | 1.009 | 1,82 | 125 | 13,76 | ||||
| 2026-02-05 | 13F | LGT Group Foundation | 3.558 | 0,00 | 325 | 13,29 | ||||
| 2026-02-04 | 13F | Meridian Wealth Management, LLC | 11.497 | 0,29 | 1.042 | 13,77 | ||||
| 2026-02-17 | 13F | Canada Pension Plan Investment Board | 7.181.018 | 13,79 | 651.016 | 29,12 | ||||
| 2026-02-18 | 13F | State of Tennessee, Treasury Department | 522.647 | -3,54 | 48.569 | 12,15 | ||||
| 2026-01-21 | 13F | Greenleaf Trust | 3.637 | 0,00 | 330 | 13,45 | ||||
| 2026-02-10 | 13F | Intech Investment Management Llc | 343.828 | 6,53 | 31.211 | 20,99 | ||||
| 2026-02-17 | 13F | Capital Fund Management S.a. | 116.258 | 57,19 | 10.534 | 78,30 | ||||
| 2026-02-13 | 13F | Quarry LP | Put | 0 | -100,00 | 0 | -100,00 | |||
| 2026-04-24 | 13F | Keybank National Association/oh | 3.930 | 372 | ||||||
| 2026-02-06 | 13F | Bristol Gate Capital Partners Inc. | 6.931 | 629 | ||||||
| 2026-02-10 | 13F/A | Northwestern Mutual Wealth Management Co | 14.959 | 120,44 | 1.355 | 150,00 | ||||
| 2026-02-13 | 13F | Quarry LP | 141 | -81,76 | 13 | -80,33 | ||||
| 2026-02-09 | 13F | Mediolanum International Funds Ltd | 58.671 | -26,24 | 5.373 | -15,16 | ||||
| 2026-02-10 | 13F | Bruce G. Allen Investments, LLC | 468 | 0,00 | 42 | 13,51 | ||||
| 2026-04-10 | 13F | First Bank & Trust | 14.678 | -9,19 | 1.391 | -5,05 | ||||
| 2026-04-21 | 13F | Financial Consulate, Inc | 184 | 1.944,44 | 17 | |||||
| 2026-04-24 | 13F | Abacus Wealth Partners, LLC | 5.146 | 16,87 | 488 | 22,36 | ||||
| 2026-04-21 | 13F | PDS Planning, Inc | 5.641 | -1,10 | 534 | 3,49 | ||||
| 2026-02-06 | 13F/A | Rathbone Brothers plc | 100.191 | -3,24 | 9.094 | 9,88 | ||||
| 2026-02-03 | 13F | ASR Vermogensbeheer N.V. | 28.758 | 0,00 | 2.610 | 13,58 | ||||
| 2026-02-13 | 13F | 1832 Asset Management L.P. | 441.293 | 4,21 | 39.986 | 18,20 | ||||
| 2026-04-06 | 13F | Versant Capital Management, Inc | 5.987 | 19,36 | 567 | 24,89 | ||||
| 2026-04-13 | 13F | Fiduciary Financial Group, Llc | 2.571 | 15,29 | 244 | 20,30 | ||||
| 2026-02-10 | 13F | CIBC Asset Management Inc | 9.659.703 | -2,54 | 876.227 | 10,77 | ||||
| 2026-02-06 | 13F | Pnc Financial Services Group, Inc. | 27.879 | 15,06 | 2.526 | 30,54 | ||||
| 2026-01-20 | 13F | Ascent Group, LLC | 2.948 | -4,72 | 267 | 8,10 | ||||
| 2026-02-13 | 13F | Kilter Group LLC | 25 | 127,27 | 2 |