Grundlæggende statistik
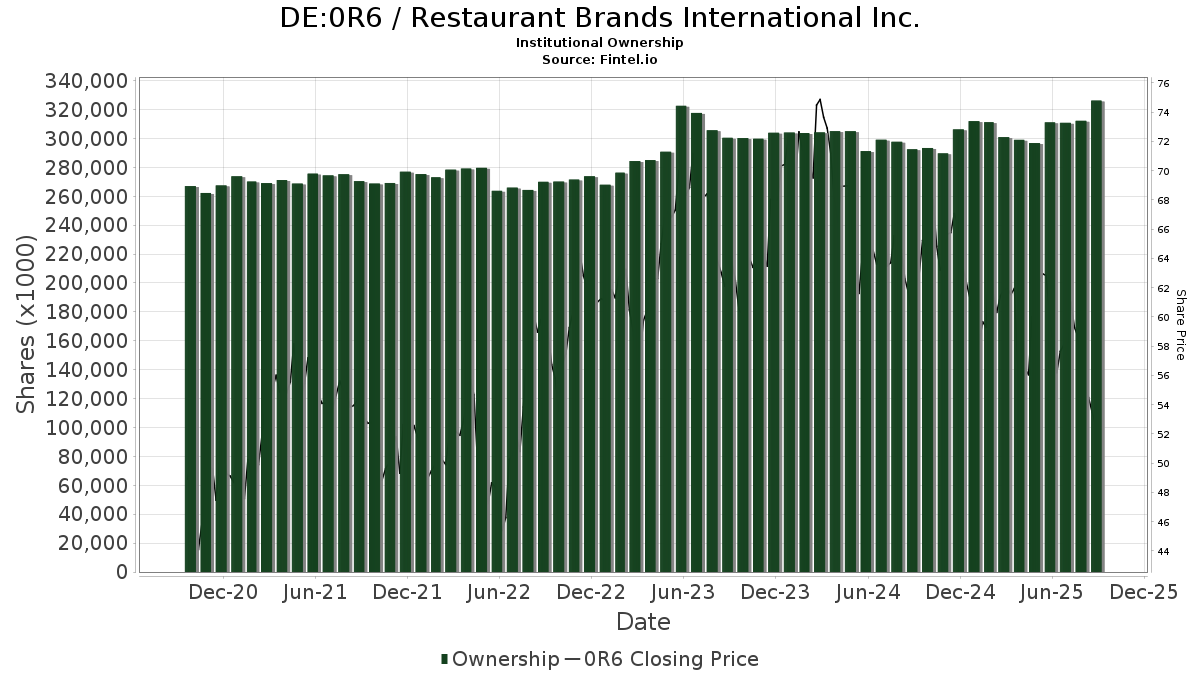
| Institutionelle aktier (lange) | 295.551.314 - 85,30% (ex 13D/G) - change of -34,97MM shares -10,58% MRQ |
| Institutionel værdi (lang) | $ 18.971.138 USD ($1000) |
Institutionelt ejerskab og aktionærer
Restaurant Brands International Inc. (DE:0R6) har 522 institutionelle ejere og aktionærer, der har indsendt 13D/G- eller 13F-formularer til Securities Exchange Commission (SEC). Disse institutioner har i alt 295,551,314 aktier. Største aktionærer omfatter Capital World Investors, Pershing Square Capital Management, L.P., Royal Bank Of Canada, EdgePoint Investment Group Inc., Vanguard Group Inc, Bank Of Montreal /can/, Morgan Stanley, Baupost Group Llc/ma, Fmr Llc, and BlackRock, Inc. .
Restaurant Brands International Inc. (DB:0R6) institutionel ejerskabsstruktur viser aktuelle positioner i virksomheden efter institutioner og fonde, samt seneste ændringer i positionsstørrelse. Større aktionærer kan omfatte individuelle investorer, investeringsforeninger, hedgefonde eller institutioner. Skema 13D angiver, at investoren besidder (eller besidder) mere end 5 % af virksomheden og har til hensigt (eller har til hensigt at) aktivt at forfølge en ændring i forretningsstrategi. Skema 13G indikerer en passiv investering på over 5%.
The share price as of April 24, 2026 is 70,08 / share. Previously, on April 28, 2025, the share price was 55,12 / share. This represents an increase of 27,14% over that period.
Fondens stemningsscore
Fund Sentiment Score (fka Ownership Accumulation Score) finder de aktier, der bliver mest købt af fonde. Det er resultatet af en sofistikeret, multi-faktor kvantitativ model, der identificerer virksomheder med de højeste niveauer af institutionel akkumulering. Scoringsmodellen bruger en kombination af den samlede stigning i oplyste ejere, ændringerne i porteføljeallokeringer i disse ejere og andre målinger. Tallet går fra 0 til 100, hvor højere tal indikerer et højere niveau af akkumulering for sine jævnaldrende, og 50 er gennemsnittet.
Opdateringsfrekvens: Dagligt
Se Ownership Explorer, som giver en liste over højest rangerende virksomheder.
AI+ Ask Fintel’s AI assistant about Restaurant Brands International Inc..
Select a question to share a public post with an AI-crafted answer.
Thinking of good questions…
13F og NPORT arkivering
Detaljer om 13F-arkivering er gratis. Detaljer om NP-ansøgninger kræver et premium-medlemskab. Grønne rækker angiver nye positioner. Røde rækker angiver lukkede positioner. Klik på linket ikon for at se den fulde transaktionshistorik.
Opgrader
for at låse premium-data op og eksportere til Excel ![]() .
.
| Fil dato | Kilde | Investor | Type | Gennemsnitlig pris (Øst) |
Aktier | Δ Aktier (%) |
Rapporteret Værdi ($1000) |
Δ Værdi (%) |
Port Alloc (%) |
|
|---|---|---|---|---|---|---|---|---|---|---|
| 2026-01-07 | 13F | New England Research & Management, Inc. | 5.549 | 0,00 | 379 | 6,48 | ||||
| 2026-02-03 | 13F | We Are One Seven, LLC | 3.647 | 0,44 | 249 | 6,90 | ||||
| 2026-02-11 | 13F | GW&K Investment Management, LLC | 588.012 | 40 | ||||||
| 2026-02-09 | 13F | Cary Street Partner Investment Advisory Llc | 526 | 5,20 | 36 | 9,38 | ||||
| 2026-02-18 | 13F/A | Empowered Funds, LLC | 28.115 | 156,31 | 1.918 | 172,83 | ||||
| 2026-03-20 | 13F | Purpose Unlimited Inc. | 107.443 | 7.329 | ||||||
| 2026-01-27 | 13F | Waterfront Wealth Inc. | 13.467 | -0,02 | 917 | 0,66 | ||||
| 2026-02-17 | 13F | Royal Bank Of Canada | Call | 0 | -100,00 | 0 | ||||
| 2026-04-07 | 13F | Farther Finance Advisors, LLC | 2.227 | 38,67 | 167 | 53,21 | ||||
| 2026-02-06 | 13F | Pnc Financial Services Group, Inc. | 16.724 | 6,43 | 1.141 | 13,31 | ||||
| 2026-02-10 | 13F | Foundations Investment Advisors, LLC | 5.169 | 353 | ||||||
| 2026-02-11 | 13F | Allianz Asset Management GmbH | 4.452 | -72,73 | 333 | -76,08 | ||||
| 2026-02-13 | 13F | Transamerica Financial Advisors, Inc. | 889 | 61 | ||||||
| 2026-02-17 | 13F | Boothbay Fund Management, Llc | 53.531 | 3.652 | ||||||
| 2026-02-12 | 13F | Steward Partners Investment Advisory, Llc | 10.298 | 383,93 | 703 | 416,18 | ||||
| 2025-11-17 | 13F | Armistice Capital, Llc | 0 | -100,00 | 0 | -100,00 | ||||
| 2026-02-06 | 13F | HighTower Advisors, LLC | 3.237 | 1,92 | 221 | 8,37 | ||||
| 2026-01-27 | 13F | Probity Advisors, Inc. | 6.537 | -8,33 | 446 | -2,41 | ||||
| 2026-02-13 | 13F | Entropy Technologies, LP | 31.872 | 2.175 | ||||||
| 2026-02-17 | 13F | Balyasny Asset Management Llc | 0 | -100,00 | 0 | |||||
| 2025-11-21 | 13F | Nebula Research & Development LLC | 0 | -100,00 | 0 | |||||
| 2026-04-22 | 13F | BKM Wealth Management, LLC | 8.238 | -10,45 | 609 | -3,03 | ||||
| 2026-02-05 | 13F | Elyxium Wealth, LLC | 1 | 0 | ||||||
| 2026-02-06 | 13F | Global Retirement Partners, LLC | 970 | 231,06 | 66 | 266,67 | ||||
| 2026-02-11 | 13F | United Financial Planning Group LLC | 14 | 1 | ||||||
| 2026-02-11 | 13F | Meeder Asset Management Inc | 94 | 6 | ||||||
| 2026-02-17 | 13F | Guardian Partners Inc. | 0 | -100,00 | 0 | |||||
| 2026-04-24 | 13F | Sumitomo Mitsui DS Asset Management Company, Ltd | 8.723 | 3,33 | 645 | 12,00 | ||||
| 2026-02-06 | 13F | Callahan Advisors, LLC | 25.030 | 0,00 | 1.708 | 6,36 | ||||
| 2026-02-17 | 13F | Public Employees Retirement System Of Ohio | 117.801 | -2,76 | 8.040 | 3,45 | ||||
| 2025-11-14 | 13F | Ossiam | 0 | -100,00 | 0 | |||||
| 2026-02-13 | 13F | Towarzystwo Funduszy Inwestycyjnych Pzu Sa | 380 | 0,00 | 26 | 4,17 | ||||
| 2026-02-17 | 13F | SIG North Trading, ULC | Put | 51.600 | 57,80 | 3.521 | 67,86 | |||
| 2026-02-11 | 13F | SOUTH STATE Corp | 5 | 0,00 | 0 | |||||
| 2026-04-09 | 13F | Everhart Financial Group, Inc. | 2.934 | 217 | ||||||
| 2026-04-15 | 13F | Bayforest Capital Ltd | 1.288 | -64,63 | 95 | -61,69 | ||||
| 2026-02-17 | 13F | SIG North Trading, ULC | Call | 61.700 | 4,58 | 4.210 | 11,23 | |||
| 2026-02-11 | 13F | Cerity Partners LLC | 15.093 | -24,11 | 1.030 | -19,29 | ||||
| 2026-04-22 | 13F | Caldwell Trust Co | 15.465 | 495,04 | 1.143 | 545,20 | ||||
| 2026-02-17 | 13F | Brevan Howard Capital Management LP | 0 | -100,00 | 0 | |||||
| 2026-02-11 | 13F | Erste Asset Management GmbH | 0 | 0 | ||||||
| 2025-11-10 | 13F | Avalon Trust Co | 0 | -100,00 | 0 | |||||
| 2026-02-17 | 13F | State Of Wisconsin Investment Board | 109.043 | 7.451 | ||||||
| 2026-02-13 | 13F | Capula Management Ltd | 18.794 | -80,71 | 1.282 | -79,48 | ||||
| 2026-04-23 | 13F | 3Chopt Investment Partners, LLC | 3.203 | 237 | ||||||
| 2026-02-13 | 13F | Y-Intercept (Hong Kong) Ltd | 19.701 | 1.344 | ||||||
| 2026-02-17 | 13F | Jump Financial, LLC | 120.215 | 513,31 | 8.202 | 552,51 | ||||
| 2026-02-06 | 13F | Harvest Portfolios Group Inc. | 56.915 | 1,23 | 3.884 | 7,68 | ||||
| 2026-04-22 | 13F | Aspire Private Capital, LLC | 23.569 | -5,62 | 1.742 | 2,23 | ||||
| 2026-02-17 | 13F | Murchinson Ltd. | Put | 0 | -100,00 | 0 | ||||
| 2026-02-11 | 13F | Jpmorgan Chase & Co | 1.470.773 | -3,40 | 100.351 | 2,76 | ||||
| 2026-02-13 | 13F | Colony Group, LLC | 3.376 | 231 | ||||||
| 2026-02-17 | 13F | Farringdon Capital, Ltd. | 5.373 | -35,75 | 367 | -31,72 | ||||
| 2025-11-13 | 13F | Capital Fund Management S.a. | Call | 0 | -100,00 | 0 | -100,00 | |||
| 2026-04-06 | 13F | CX Institutional | 228 | 356,00 | 0 | |||||
| 2026-02-11 | 13F | Cedar Mountain Advisors, LLC | 96 | 0,00 | 7 | 0,00 | ||||
| 2026-02-13 | 13F | Blueshift Asset Management, LLC | 20.985 | -33,49 | 1.432 | -29,26 | ||||
| 2026-02-17 | 13F | Murchinson Ltd. | Call | 0 | -100,00 | 0 | ||||
| 2026-04-13 | 13F | Mather Group, Llc. | 303 | 22 | ||||||
| 2026-01-26 | 13F | Main Street Group, LTD | 0 | -100,00 | 0 | |||||
| 2026-04-13 | 13F | Salem Investment Counselors Inc | 112 | 8 | ||||||
| 2026-02-17 | 13F | Pershing Square Capital Management, L.P. | 22.866.773 | -0,21 | 1.560.200 | 6,15 | ||||
| 2026-02-05 | 13F | Bank Julius Baer & Co. Ltd, Zurich | 1.670 | 9,01 | 114 | 15,31 | ||||
| 2026-02-17 | 13F/A | Northwest & Ethical Investments L.P. | 100.972 | -0,20 | 6.890 | 6,15 | ||||
| 2026-02-11 | 13F | Hughes Financial Services, LLC | 41 | 10,81 | 3 | 0,00 | ||||
| 2026-01-20 | 13F | Aspiriant, Llc | 13.091 | 0,15 | 893 | 6,56 | ||||
| 2026-02-09 | 13F | Harbour Investments, Inc. | 179 | -17,13 | 12 | -7,69 | ||||
| 2026-02-17 | 13F | Cape Investment Advisory, Inc. | 48 | 2,13 | 3 | 0,00 | ||||
| 2026-02-12 | 13F | Xponance, Inc. | 36.577 | 3,42 | 2.496 | 10,01 | ||||
| 2026-02-13 | 13F | Quartz Partners, LLC | 70.810 | 13,98 | 4.831 | 21,26 | ||||
| 2026-04-24 | 13F | Root Financial Partners, LLC | 146 | 11 | ||||||
| 2026-02-17 | 13F | Russell Investments Group, Ltd. | 130.205 | 33,55 | 8.899 | 41,67 | ||||
| 2026-02-17 | 13F | SummitTX Capital, L.P. | 0 | -100,00 | 0 | |||||
| 2025-11-06 | 13F | Ameritas Advisory Services, LLC | 0 | -100,00 | 0 | |||||
| 2026-01-30 | 13F | BancorpSouth Bank | 152.079 | 0,96 | 10.376 | 7,40 | ||||
| 2026-02-02 | 13F | Wolverine Asset Management Llc | Put | 26.500 | 0,00 | 1.808 | 6,42 | |||
| 2026-02-17 | 13F | SageView Advisory Group, LLC | 15 | 1 | ||||||
| 2025-11-14 | 13F | Strategic Wealth Partners, Ltd. | 3.032 | 0,00 | 194 | -3,48 | ||||
| 2026-02-11 | 13F | Deutsche Bank Ag\ | 499.889 | -29,77 | 34.107 | -25,30 | ||||
| 2026-02-12 | 13F | CIBC Private Wealth Group, LLC | 12.023 | -18,18 | 820 | -12,95 | ||||
| 2026-04-07 | 13F | Signaturefd, Llc | 8.922 | 7,88 | 659 | 16,84 | ||||
| 2026-02-09 | 13F | Hartland & Co., LLC | 123 | 10,81 | 8 | 14,29 | ||||
| 2026-02-02 | 13F | Millstone Evans Group, LLC | 18 | 0,00 | 1 | 0,00 | ||||
| 2026-02-13 | 13F | Korea Investment CORP | 197.115 | -8,54 | 13.465 | -2,63 | ||||
| 2026-02-13 | 13F | Natixis | 45.564 | 3.040,18 | 3.109 | 3.241,94 | ||||
| 2026-04-16 | 13F | Montecito Bank & Trust | 2.840 | 210 | ||||||
| 2026-04-17 | 13F | Bell Investment Advisors, Inc | 53 | 0,00 | 4 | 0,00 | ||||
| 2026-02-17 | 13F | Raymond James Financial Inc | 526.648 | -16,40 | 35.933 | -11,07 | ||||
| 2026-02-13 | 13F | Cornerstone Financial Management LLC | 24 | 2 | ||||||
| 2026-02-13 | 13F | 1832 Asset Management L.P. | 3.817.946 | 22,67 | 260.498 | 30,49 | ||||
| 2026-02-10 | 13F | IAG Wealth Partners, LLC | 6 | 0,00 | 0 | |||||
| 2026-02-13 | 13F | Arkadios Wealth Advisors | 53.732 | 11,81 | 3.666 | 18,95 | ||||
| 2026-04-07 | 13F | CoreCap Advisors, LLC | 115 | 1,77 | 8 | 14,29 | ||||
| 2026-02-12 | 13F | Dimensional Fund Advisors Lp | 1.264.430 | 0,68 | 86.277 | 7,09 | ||||
| 2026-02-13 | 13F | Toroso Investments, LLC | Call | 62.000 | 4.230 | |||||
| 2026-02-13 | 13F | Toroso Investments, LLC | 154.897 | 22,79 | 10.569 | 30,61 | ||||
| 2026-02-17 | 13F | Summit Trail Advisors, Llc | 3.648 | -69,87 | 250 | -67,95 | ||||
| 2026-02-13 | 13F | Parkside Financial Bank & Trust | 613 | 5,69 | 42 | 10,81 | ||||
| 2026-01-30 | 13F | Turning Point Benefit Group, Inc. | 6 | 0,00 | 0 | |||||
| 2026-02-13 | 13F | Alberta Investment Management Corp | 866.100 | 0,00 | 59.101 | 6,39 | ||||
| 2026-02-02 | 13F | Davis Selected Advisers | 4.020.791 | 13,51 | 274.340 | 20,74 | ||||
| 2026-01-28 | 13F | Geneos Wealth Management Inc. | 6.200 | -4,62 | 423 | 1,68 | ||||
| 2026-02-03 | 13F | SBI Securities Co., Ltd. | 525 | 4,37 | 36 | 9,38 | ||||
| 2026-04-08 | 13F | Wealth Enhancement Trust Services, Inc. | 177 | 0,00 | 13 | 8,33 | ||||
| 2026-02-17 | 13F | Man Group plc | 361.912 | -53,96 | 24.693 | -51,02 | ||||
| 2026-02-10 | 13F | Envestnet Asset Management Inc | 468.156 | -3,05 | 31.942 | 3,13 | ||||
| 2026-02-17 | 13F | Laird Norton Trust Company, Llc | 8.570 | 590 | ||||||
| 2026-02-13 | 13F | Smartleaf Asset Management LLC | 535 | -0,19 | 37 | 2,86 | ||||
| 2026-02-13 | 13F | Treasurer of the State of North Carolina | 135.566 | -6,81 | 9 | 0,00 | ||||
| 2026-02-17 | 13F | Spears Abacus Advisors LLC | 298.769 | -0,74 | 20.385 | 5,59 | ||||
| 2026-02-13 | 13F | Barclays Plc | 146.392 | -7,16 | 9.988 | -1,24 | ||||
| 2026-02-10 | 13F | Kentucky Retirement Systems Insurance Trust Fund | 8.514 | 0,00 | 581 | 6,23 | ||||
| 2026-02-13 | 13F | Marshall Wace, Llp | 0 | -100,00 | 0 | |||||
| 2026-02-13 | 13F | Wells Fargo & Company/mn | 352.506 | 18,16 | 24.052 | 25,69 | ||||
| 2026-02-13 | 13F | Neuberger Berman Group LLC | 22.210 | -5,97 | 1.517 | 0,07 | ||||
| 2026-02-13 | 13F | American Century Companies Inc | 160.913 | 28,66 | 10.980 | 36,86 | ||||
| 2026-01-23 | 13F | Burney Co/ | 3.860 | -2,53 | 263 | 3,95 | ||||
| 2026-02-13 | 13F | Royal London Asset Management Ltd | 16.930 | 4,58 | 1.155 | 11,27 | ||||
| 2025-11-14 | 13F | JCP Investment Management, LLC | 0 | -100,00 | 0 | -100,00 | ||||
| 2026-04-13 | 13F | Trust Co | 10 | 0,00 | 1 | |||||
| 2025-11-14 | 13F | Twinbeech Capital Lp | 0 | -100,00 | 0 | |||||
| 2026-02-13 | 13F | OpenArc Corporate Advisory, LLC | 17.521 | 1.195 | ||||||
| 2026-02-10 | 13F | Savant Capital, LLC | 4.874 | 333 | ||||||
| 2026-02-12 | 13F | Quadrant Capital Group Llc | 11.164 | -0,91 | 762 | 5,40 | ||||
| 2025-11-13 | 13F | Riggs Asset Managment Co. Inc. | 0 | -100,00 | 0 | |||||
| 2026-02-13 | 13F | Arrowstreet Capital, Limited Partnership | 21.750 | 1.484 | ||||||
| 2026-04-13 | 13F | St Germain D J Co Inc | 10 | 0,00 | 1 | |||||
| 2026-02-13 | 13F | Bridgefront Capital, LLC | 0 | -100,00 | 0 | |||||
| 2026-02-17 | 13F | Alliancebernstein L.p. | 146.353 | 0,39 | 9.986 | 6,79 | ||||
| 2025-11-13 | 13F | GeoWealth Management, LLC | 0 | -100,00 | 0 | -100,00 | ||||
| 2026-01-28 | 13F | HB Wealth Management, LLC | 10.795 | 28,02 | 737 | 36,30 | ||||
| 2026-02-13 | 13F | Timelo Investment Management Inc. | 30.000 | 2.047 | ||||||
| 2026-04-07 | 13F | Central Pacific Bank - Trust Division | 21.204 | 1.567 | ||||||
| 2026-04-17 | 13F | Cidel Asset Management Inc | 693.116 | 79,30 | 51.126 | 93,57 | ||||
| 2026-02-17 | 13F | Creative Planning | 60.644 | 5,52 | 4.138 | 12,24 | ||||
| 2026-02-17 | 13F | Jain Global LLC | 8.246 | 563 | ||||||
| 2026-02-13 | 13F | National Bank Of Canada /fi/ | 3.832.184 | 5,93 | 259.418 | 12,04 | ||||
| 2026-02-17 | 13F | Kemnay Advisory Services Inc. | 95 | 6 | ||||||
| 2026-02-13 | 13F | Van Eck Associates Corp | 223.566 | 15 | ||||||
| 2026-02-17 | 13F | Safe Harbor Fiduciary, LLC | 1 | 0,00 | 0 | |||||
| 2026-02-17 | 13F | Utah Retirement Systems | 53.395 | 0,00 | 3.647 | 6,45 | ||||
| 2026-04-23 | 13F | Oppenheimer Asset Management Inc. | 113.100 | 3.223,54 | 8.358 | 3.502,59 | ||||
| 2026-02-13 | 13F | Motiv8 Investments LLC | 18 | 0 | ||||||
| 2026-02-10 | 13F | Measured Wealth Private Client Group, LLC | 350 | 0,00 | 24 | 4,55 | ||||
| 2026-02-12 | 13F | Penserra Capital Management LLC | 21 | 0,00 | 0 | |||||
| 2026-02-10 | 13F | Cornerstone Select Advisors, LLC | 3.261 | 222 | ||||||
| 2026-02-13 | 13F | FORA Capital, LLC | 0 | -100,00 | 0 | |||||
| 2026-04-08 | 13F | Wealth Enhancement Advisory Services, Llc | 294.561 | 12,10 | 22.278 | 25,24 | ||||
| 2026-04-24 | 13F | Kendall Capital Management | 12.905 | 2,87 | 954 | 11,46 | ||||
| 2026-02-09 | 13F | Hantz Financial Services, Inc. | 3.275 | -0,94 | 0 | |||||
| 2026-02-23 | 13F | Mv Capital Management, Inc. | 15 | 1 | ||||||
| 2025-11-14 | 13F | AXA Investment Managers S.A. | 643.585 | 41.280 | ||||||
| 2026-01-26 | 13F | Cwm, Llc | 6.873 | 168,16 | 0 | |||||
| 2026-02-12 | 13F | Bank Of Montreal /can/ | Call | 400 | -60,00 | 27 | -57,81 | |||
| 2026-02-13 | 13F | Commerce Bank | 32.564 | -26,97 | 2.222 | -22,34 | ||||
| 2026-04-08 | 13F | NorthCrest Asset Manangement, LLC | 3.655 | 6,50 | 280 | 21,83 | ||||
| 2026-02-12 | 13F | Bank Of Montreal /can/ | Put | 300 | -99,77 | 20 | -99,76 | |||
| 2026-02-12 | 13F | Bank Of Montreal /can/ | 15.219.947 | 25,54 | 1.038.599 | 33,56 | ||||
| 2026-04-15 | 13F | FNY Investment Advisers, LLC | 0 | -100,00 | 0 | |||||
| 2026-02-12 | 13F | Foster Dykema Cabot & Partners, Llc | 0 | -100,00 | 0 | |||||
| 2026-02-19 | 13F | CI Private Wealth, LLC | 26.011 | 87,93 | 1.775 | 100,00 | ||||
| 2026-02-17 | 13F | Align Financial, LLC | 14.738 | 15 | ||||||
| 2026-02-17 | 13F | Fmr Llc | 7.941.984 | -9,45 | 541.940 | -3,68 | ||||
| 2026-02-17 | 13F | Quantinno Capital Management LP | 72.062 | 47,35 | 4.917 | 56,76 | ||||
| 2026-02-06 | 13F | Alta Capital Management Llc/ | 47.423 | -69,38 | 3.236 | -67,43 | ||||
| 2026-04-02 | 13F | Byrne Asset Management LLC | 1.755 | -1,40 | 130 | 6,61 | ||||
| 2026-02-17 | 13F | FIL Ltd | 4.430.035 | -0,87 | 302.296 | 5,45 | ||||
| 2026-02-05 | 13F | Dana Investment Advisors, Inc. | 274.727 | -0,62 | 18.745 | 5,72 | ||||
| 2026-04-10 | 13F | Abound Wealth Management | 50 | 4 | ||||||
| 2026-04-24 | 13F | Abacus Wealth Partners, LLC | 2.810 | 208 | ||||||
| 2026-02-17 | 13F | Credit Agricole S A | 25.066 | 467,87 | 1.710 | 504,24 | ||||
| 2025-10-29 | 13F | JCIC Asset Management Inc. | 0 | -100,00 | 0 | |||||
| 2026-02-12 | 13F | Brinker Capital Investments, LLC | 30.401 | -21,03 | 2.074 | -16,00 | ||||
| 2026-02-12 | 13F | Nuveen, LLC | 694.702 | -1,69 | 47.421 | 4,61 | ||||
| 2026-02-17 | 13F | Investment Management Corp of Ontario | 40.217 | 228,62 | 2.744 | 250,00 | ||||
| 2026-02-02 | 13F | Fifth Third Bancorp | 209 | -32,14 | 14 | -26,32 | ||||
| 2026-02-19 | 13F | Invesco Ltd. | 3.469.979 | -4,59 | 236.757 | 1,50 | ||||
| 2026-02-17 | 13F | Schonfeld Strategic Advisors LLC | 41.198 | 2.811 | ||||||
| 2026-02-17 | 13F | Point72 Asset Management, L.P. | 0 | -100,00 | 0 | |||||
| 2026-04-09 | 13F | Park Place Capital Corp | 1.624 | 120 | ||||||
| 2026-02-13 | 13F | National Bank Of Canada /fi/ | Put | 87 | -64,78 | 594 | -62,56 | |||
| 2026-04-01 | 13F | Bangor Savings Bank | 0 | -100,00 | 0 | |||||
| 2026-04-15 | 13F | City Holding Co | 163 | 0,00 | 12 | 9,09 | ||||
| 2026-02-10 | 13F | Natixis Advisors, L.p. | 52.868 | 14,43 | 4 | 50,00 | ||||
| 2026-02-11 | 13F | Parallel Advisors, LLC | 1.636 | 2,63 | 112 | 8,82 | ||||
| 2026-02-13 | 13F | Beutel, Goodman & Co Ltd. | 5.548.020 | 5,99 | 379 | 13,13 | ||||
| 2026-02-13 | 13F | Hudson Bay Capital Management LP | 0 | -100,00 | 0 | |||||
| 2026-01-20 | 13F | Trust Co Of Toledo Na /oh/ | 0 | -100,00 | 0 | |||||
| 2026-02-11 | 13F | Letko, Brosseau & Associates Inc | 604.192 | 0,61 | 41.283 | 7,14 | ||||
| 2026-02-12 | 13F | JPL Wealth Management, LLC | 0 | -100,00 | 0 | |||||
| 2026-02-12 | 13F | Federation des caisses Desjardins du Quebec | 437.567 | -23,30 | 29.762 | -18,70 | ||||
| 2026-02-12 | 13F | Aviva Plc | 248.654 | 5,79 | 16.981 | 12,72 | ||||
| 2026-02-13 | 13F | MAI Capital Management | 4.466 | 0,81 | 305 | 7,04 | ||||
| 2026-02-10 | 13F/A | Northwestern Mutual Wealth Management Co | 104.051 | 7,02 | 7.099 | 13,84 | ||||
| 2026-02-10 | 13F | Phillips Wealth Planners LLC | 4.274 | 1,96 | 291 | 0,69 | ||||
| 2026-02-02 | 13F | Benjamin Edwards Inc | 5.659 | 8,85 | 386 | 15,92 | ||||
| 2026-01-23 | 13F | Nbt Bank N A /ny | 68 | 6,25 | 5 | 25,00 | ||||
| 2026-02-18 | 13F | Guardian Capital Lp | 881.913 | -21,44 | 60.208 | -16,41 | ||||
| 2026-02-10 | 13F | Nomura Asset Management Co Ltd | 0 | 0 | ||||||
| 2026-02-06 | 13F | Lloyd Advisory Services, LLC. | 364 | 25 | ||||||
| 2026-02-11 | 13F | Fiera Capital Corp | 6.835.522 | 38,20 | 466.595 | 47,10 | ||||
| 2026-02-13 | 13F | Bank Of Nova Scotia | 824.469 | -21,39 | 56.258 | -16,45 | ||||
| 2026-02-12 | 13F | New York State Common Retirement Fund | 196.100 | 0,00 | 13.380 | 6,38 | ||||
| 2025-11-13 | 13F | RDST Capital LLC | 0 | -100,00 | 0 | |||||
| 2026-04-24 | 13F | Strs Ohio | 9.639 | 3,10 | 712 | 11,60 | ||||
| 2025-11-12 | 13F | Park Square Financial Group, LLC | 0 | -100,00 | 0 | -100,00 | ||||
| 2026-01-27 | 13F | Zurcher Kantonalbank (Zurich Cantonalbank) | 148.717 | 10.161 | ||||||
| 2026-02-10 | 13F | Connor, Clark & Lunn Investment Management Ltd. | 570.138 | 712,45 | 38.906 | 764,56 | ||||
| 2026-02-11 | 13F | Capital International Ltd /ca/ | 288.203 | 23,80 | 19.664 | 31,70 | ||||
| 2026-02-11 | 13F | Winton Capital Group Ltd | 5.200 | 355 | ||||||
| 2026-02-17 | 13F | DV Trading LLC | 1.000 | 68 | ||||||
| 2026-02-17 | 13F | Wellington Management Group Llp | 34.276 | 45,53 | 2.342 | 54,93 | ||||
| 2026-02-11 | 13F | Capital International Sarl | 471.677 | 32,90 | 32.183 | 41,38 | ||||
| 2026-01-15 | 13F | Royal Fund Management, LLC | 15.030 | -24,59 | 1.025 | -19,80 | ||||
| 2026-02-05 | 13F | Qsemble Capital Management, LP | 24.054 | 1.641 | ||||||
| 2026-02-17 | 13F | Royal Bank Of Canada | 18.544.727 | -19,62 | 1.265.308 | -14,50 | ||||
| 2025-11-14 | 13F | Peak6 Llc | Call | 0 | -100,00 | 0 | ||||
| 2026-04-22 | 13F | Canoe Financial LP | 3.348.043 | 34,48 | 247.664 | 45,78 | ||||
| 2026-02-13 | 13F | Walleye Trading LLC | Put | 23.200 | 107,14 | 1.583 | 120,33 | |||
| 2026-02-13 | 13F | Walleye Trading LLC | Call | 92.600 | 16,04 | 6.318 | 23,45 | |||
| 2026-02-13 | 13F | National Bank Of Canada /fi/ | Call | 496 | -37,61 | 3.384 | -33,65 | |||
| 2026-02-17 | 13F | Cresset Asset Management, LLC | 0 | -100,00 | 0 | -100,00 | ||||
| 2026-02-17 | 13F | Warren Averett Asset Management, LLC | 39.954 | 12,13 | 2.726 | 19,30 | ||||
| 2025-11-12 | 13F | Andra AP-fonden | 0 | -100,00 | 0 | |||||
| 2026-02-05 | 13F | Atria Investments Llc | 6.289 | 12,34 | 429 | 19,50 | ||||
| 2026-04-09 | 13F | Cullen Investment Group, Ltd. | 8.257 | -8,42 | 610 | -1,93 | ||||
| 2026-04-15 | 13F | Activest Wealth Management | 0 | -100,00 | 0 | |||||
| 2026-02-09 | 13F | Huntington National Bank | 812 | 18,02 | 55 | 25,00 | ||||
| 2025-11-14 | 13F | Redwood Investment Management, Llc | 0 | -100,00 | 0 | |||||
| 2026-02-17 | 13F | Shelton Capital Management | 5.460 | -1,78 | 373 | 4,49 | ||||
| 2026-02-13 | 13F | Rhumbline Advisers | 304.025 | -1,62 | 20.744 | 4,65 | ||||
| 2026-04-24 | 13F | UMA Financial Services, Inc. | 8 | 0,00 | 1 | |||||
| 2026-02-17 | 13F | Advisory Services Network, LLC | 0 | -100,00 | 0 | |||||
| 2026-02-13 | 13F | Caitong International Asset Management Co., Ltd | 0 | -100,00 | 0 | |||||
| 2026-02-12 | 13F | Advisors Asset Management, Inc. | 1.300 | -3,42 | 89 | 2,33 | ||||
| 2026-02-13 | 13F | Partners Capital Investment Group, Llp | 53.939 | -15,56 | 3.680 | -10,18 | ||||
| 2026-01-26 | 13F | Private Trust Co Na | 0 | -100,00 | 0 | |||||
| 2026-02-17 | 13F | Susquehanna International Group, Llp | 0 | -100,00 | 0 | |||||
| 2025-10-27 | 13F | Concurrent Investment Advisors, LLC | 0 | -100,00 | 0 | -100,00 | ||||
| 2026-02-10 | 13F | Td Asset Management Inc | 5.544.780 | 0,71 | 378.851 | 7,24 | ||||
| 2026-02-11 | 13F | Argonautica Private Wealth Management, Inc | 9.006 | 60,74 | 614 | 71,03 | ||||
| 2026-02-17 | 13F | Range Rock Capital, LLC | 37.613 | 2.566 | ||||||
| 2026-02-17 | 13F | Cetera Investment Advisers | 53.672 | 8,80 | 3.662 | 15,74 | ||||
| 2026-04-10 | 13F | Salvus Wealth Management, LLC | 7.544 | 558 | ||||||
| 2026-02-17 | 13F | Bank Of America Corp /de/ | 2.022.208 | 4,49 | 137.975 | 11,16 | ||||
| 2026-02-17 | 13F | Tower Research Capital LLC (TRC) | 0 | -100,00 | 0 | |||||
| 2026-02-12 | 13F | BlackRock, Inc. | 7.522.380 | 3,12 | 513.252 | 9,69 | ||||
| 2026-02-13 | 13F | Walleye Capital LLC | 52 | -99,35 | 4 | -99,42 | ||||
| 2026-02-12 | 13F | Skandinaviska Enskilda Banken AB (publ) | 42.983 | -2,85 | 2.933 | 3,35 | ||||
| 2026-02-12 | 13F | Burkett Asset Management Ltd | 24.772 | 1.693 | ||||||
| 2026-02-13 | 13F | Walleye Capital LLC | Call | 24.600 | 278,46 | 1.678 | 303,37 | |||
| 2026-02-13 | 13F | Walleye Capital LLC | Put | 5.400 | -73,27 | 368 | -71,58 | |||
| 2026-02-12 | 13F | Jane Street Group, Llc | Call | 313.000 | -17,02 | 21.356 | -11,72 | |||
| 2026-02-12 | 13F | Jane Street Group, Llc | 17.881 | 66,99 | 1.220 | 77,84 | ||||
| 2026-02-13 | 13F | Sumitomo Life Insurance Co | 8.442 | -0,08 | 576 | 6,28 | ||||
| 2026-02-12 | 13F | Pitcairn Co | 0 | -100,00 | 0 | |||||
| 2025-11-14 | 13F | Delta Global Management LP | 0 | -100,00 | 0 | -100,00 | ||||
| 2026-02-13 | 13F | Citigroup Inc | 133.787 | -21,09 | 9.141 | -15,98 | ||||
| 2026-02-18 | 13F | GWM Advisors LLC | 0 | -100,00 | 0 | |||||
| 2026-02-13 | 13F | Whetstone Capital Advisors, LLC | 3.245 | -11,02 | 221 | -5,15 | ||||
| 2026-02-13 | 13F | Pitcairn Wealth Advisors LLC | 9.672 | 660 | ||||||
| 2026-04-22 | 13F | Gold Investment Management Ltd. | 49 | 0,00 | 4 | 0,00 | ||||
| 2026-02-10 | 13F | Goldman Sachs Group Inc | 2.523.391 | -75,35 | 172.171 | -73,78 | ||||
| 2025-11-14 | 13F | Gluskin Sheff & Assoc Inc | 0 | -100,00 | 0 | |||||
| 2026-02-09 | 13F | Keating Financial Advisory Services, Inc. | 1 | 0 | ||||||
| 2026-01-22 | 13F | Bartlett & Co. Wealth Management Llc | 635 | 0,00 | 44 | 4,88 | ||||
| 2026-02-13 | 13F | Sei Investments Co | 52.564 | 0,52 | 3.587 | 6,95 | ||||
| 2026-01-29 | 13F | UBS Group AG | Call | 0 | -100,00 | 0 | -100,00 | |||
| 2026-02-13 | 13F | Resources Investment Advisors, LLC. | 7.526 | -48,69 | 514 | -45,43 | ||||
| 2026-02-13 | 13F | Ieq Capital, Llc | 9.009 | 56,73 | 615 | 66,85 | ||||
| 2026-02-05 | 13F | Donoghue Forlines LLC | 32.389 | 2.210 | ||||||
| 2026-01-15 | 13F | Allspring Global Investments Holdings, LLC | 59.306 | 1,73 | 4.022 | 4,25 | ||||
| 2026-04-23 | 13F | Founders Capital Management, Llc | 41.816 | 0,00 | 3.090 | 8,31 | ||||
| 2026-04-23 | 13F | Harbor Investment Advisory, Llc | 108 | 0,00 | 8 | 0,00 | ||||
| 2026-02-17 | 13F | Susquehanna International Group, Llp | Put | 303.400 | -11,44 | 20.701 | -5,80 | |||
| 2026-04-14 | 13F | Prospera Financial Services Inc | 7.898 | 9,47 | 584 | 18,70 | ||||
| 2026-02-17 | 13F | Susquehanna International Group, Llp | Call | 273.400 | -25,67 | 18.654 | -20,92 | |||
| 2026-02-11 | 13F | LPL Financial LLC | 152.119 | 5,01 | 10.379 | 11,71 | ||||
| 2026-02-13 | 13F | Golden State Wealth Management, LLC | 123 | 0,00 | 8 | 14,29 | ||||
| 2026-02-17 | 13F | SIG North Trading, ULC | 0 | -100,00 | 0 | |||||
| 2026-04-22 | 13F | Janney Montgomery Scott LLC | 150.190 | 622,94 | 11 | 1.000,00 | ||||
| 2026-02-11 | 13F | Capital World Investors | 43.525.570 | 7,66 | 2.969.819 | 14,52 | ||||
| 2026-02-09 | 13F | Cary Street Partners Financial Llc | 52.413 | 0,09 | 3.576 | 6,49 | ||||
| 2026-02-17 | 13F | Qube Research & Technologies Ltd | 82.854 | 284,67 | 5.653 | 309,34 | ||||
| 2026-02-11 | 13F | Twin Tree Management, LP | Call | 79.900 | 237,13 | 5.452 | 258,62 | |||
| 2026-04-08 | 13F | Wealth Science Advisors LLC | 20 | 1 | ||||||
| 2026-04-15 | 13F | Hartford Financial Management Inc. | 319 | -8,07 | 24 | 0,00 | ||||
| 2025-10-28 | 13F | Campbell & CO Investment Adviser LLC | 0 | -100,00 | 0 | |||||
| 2026-04-13 | 13F | Creative Financial Designs Inc /adv | 113 | 4,63 | 8 | 14,29 | ||||
| 2025-11-07 | 13F | Shell Asset Management Co | 0 | 0 | ||||||
| 2026-04-21 | 13F | Bennett Selby Investments Lp | 24.817 | -0,10 | 1.834 | 8,21 | ||||
| 2025-11-07 | 13F | Synovus Financial Corp | 3.478 | 0,00 | 223 | -3,04 | ||||
| 2026-02-05 | 13F | North Dakota State Investment Board | 11.400 | 778 | ||||||
| 2026-02-17 | 13F | Strategic Investment Advisors / MI | 6.174 | -4,97 | 421 | 1,20 | ||||
| 2026-01-29 | 13F | Quest 10 Wealth Builders, Inc. | 145 | 4,32 | 10 | 12,50 | ||||
| 2026-04-24 | 13F | Triasima Portfolio Management inc. | 26.800 | 1.977 | ||||||
| 2026-01-28 | 13F | DekaBank Deutsche Girozentrale | 42.344 | 0,00 | 3 | 50,00 | ||||
| 2026-02-02 | 13F | Wolverine Asset Management Llc | 10.787 | -0,42 | 736 | 5,91 | ||||
| 2026-02-10 | 13F | Bnp Paribas Arbitrage, Sa | 17.598 | -13,62 | 1.201 | -8,12 | ||||
| 2025-11-04 | 13F | Legend Financial Advisors, Inc. | 0 | -100,00 | 0 | |||||
| 2026-02-09 | 13F | Coldstream Capital Management Inc | 0 | -100,00 | 0 | |||||
| 2025-11-14 | 13F | Wetherby Asset Management Inc | 4.102 | -9,83 | 263 | -12,62 | ||||
| 2026-02-13 | 13F | Aviso Financial Inc. | 0 | -100,00 | 0 | |||||
| 2026-04-23 | 13F | Iridian Asset Management Llc/ct | 29.819 | -18,77 | 2.204 | -12,02 | ||||
| 2026-01-27 | 13F | Asset Management One Co., Ltd. | 57.512 | 0,34 | 3.967 | 7,89 | ||||
| 2026-04-22 | 13F | Horizon Bancorp Inc /in/ | 31 | 0 | ||||||
| 2026-02-17 | 13F | Bank OZK | 17.274 | 1.179 | ||||||
| 2026-02-11 | 13F | Capital Research Global Investors | 2.040.125 | 0,07 | 139.198 | 6,45 | ||||
| 2026-04-14 | 13F | Nova Wealth Management, Inc. | 15 | 0,00 | 1 | 0,00 | ||||
| 2026-04-22 | 13F | Pictet Asset Management Holding SA | 124.628 | -0,31 | 9.193 | 7,62 | ||||
| 2026-02-09 | 13F | Roundview Capital LLC | 7.816 | 0,80 | 533 | 7,24 | ||||
| 2026-02-12 | 13F | Jane Street Group, Llc | Put | 0 | -100,00 | 0 | -100,00 | |||
| 2026-04-15 | 13F | Addenda Capital Inc. | 310.216 | -2,51 | 32.218 | 7,13 | ||||
| 2026-04-23 | 13F | Oppenheimer & Co Inc | 37.447 | 6,37 | 2.767 | 15,20 | ||||
| 2026-02-10 | 13F | Scheer, Rowlett & Associates Investment Management Ltd. | 373.562 | -13,14 | 25.492 | -7,58 | ||||
| 2026-04-20 | 13F | Cardinal Point Capital Management, ULC | 3.197 | -11,12 | 236 | -3,67 | ||||
| 2026-04-22 | 13F | Sterling Capital Management LLC | 5.714 | -32,11 | 422 | -26,48 | ||||
| 2026-02-02 | 13F | Truist Financial Corp | 34.096 | -1,33 | 2.326 | 4,96 | ||||
| 2026-04-20 | 13F | City State Bank | 400 | -18,37 | 30 | -12,12 | ||||
| 2026-02-04 | 13F | Beverly Hills Private Wealth, LLC | 5.467 | 0,00 | 351 | 0,00 | ||||
| 2026-02-13 | 13F | SRS Capital Advisors, Inc. | 378 | -6,44 | 26 | 0,00 | ||||
| 2026-02-11 | 13F | Tacita Capital Inc | 5.061 | 8,26 | 346 | 15,00 | ||||
| 2026-02-17 | 13F | Captrust Financial Advisors | 15.136 | 1,95 | 1.033 | 8,40 | ||||
| 2026-02-17 | 13F | Royal Bank Of Canada | Put | 0 | -100,00 | 0 | ||||
| 2026-01-29 | 13F | Quent Capital, LLC | 76 | 40,74 | 5 | 66,67 | ||||
| 2026-02-09 | 13F | Continental Grain Co | 559.178 | 0,00 | 38.153 | 6,38 | ||||
| 2026-04-24 | 13F | USS Investment Management Ltd | 29.214 | 3,78 | 2.157 | 12,05 | ||||
| 2026-02-13 | 13F | Banco Santander, S.A. | 0 | -100,00 | 0 | |||||
| 2026-02-17 | 13F | Aqr Capital Management Llc | 62.394 | 187,17 | 4.257 | 205,60 | ||||
| 2026-02-13 | 13F | Hudson Portfolio Management LLC | 18.942 | 0,00 | 1.292 | 6,43 | ||||
| 2026-02-06 | 13F | Hardy Reed LLC | 5.397 | 0,47 | 368 | 6,98 | ||||
| 2026-02-17 | 13F | Maryland State Retirement & Pension System | 15.725 | 0,00 | 1.073 | 6,35 | ||||
| 2026-02-12 | 13F | Commonwealth Equity Services, Llc | 93.836 | 69,27 | 6.402 | 213.300,00 | ||||
| 2026-04-20 | 13F | Jfs Wealth Advisors, Llc | 8 | -89,61 | 1 | -100,00 | ||||
| 2026-01-23 | 13F | Assetmark, Inc | 35.224 | 11,93 | 2.403 | 19,08 | ||||
| 2026-04-13 | 13F | Gateway Investment Advisers Llc | 24.718 | -4,20 | 1.827 | 3,75 | ||||
| 2026-02-10 | 13F | AdvisorShares Investments LLC | 1.900 | 130 | ||||||
| 2026-02-11 | 13F | Fox Run Management, L.l.c. | 19.448 | 59,71 | 1.327 | 69,78 | ||||
| 2026-02-13 | 13F | Fiduciary Trust Co | 18.843 | -0,97 | 1.286 | 5,33 | ||||
| 2026-02-17 | 13F | Soroban Capital Partners LP | 300.000 | 0,00 | 19.242 | 0,00 | ||||
| 2026-02-11 | 13F | Westerkirk Capital Inc. | 890 | -93,55 | 61 | -93,21 | ||||
| 2026-02-17 | 13F | EdgePoint Investment Group Inc. | 16.645.003 | 11,69 | 1.135.844 | 18,83 | ||||
| 2026-02-17 | 13F | Janus Henderson Group Plc | 430.868 | 1,35 | 29.404 | 7,76 | ||||
| 2026-02-11 | 13F | Capital International Inc /ca/ | 239.219 | 8,39 | 16.322 | 15,30 | ||||
| 2026-02-05 | 13F | Thrivent Financial For Lutherans | 19.019 | 1 | ||||||
| 2026-02-13 | 13F | Manufacturers Life Insurance Company, The | 0 | -100,00 | 0 | |||||
| 2026-01-30 | 13F | Lincluden Management Ltd | 467.154 | -3,51 | 44 | 0,00 | ||||
| 2026-01-29 | 13F | Teachers Retirement System Of The State Of Kentucky | 86.700 | 0,00 | 6 | 0,00 | ||||
| 2025-11-03 | 13F | Novare Capital Management Llc | 0 | -100,00 | 0 | |||||
| 2026-04-13 | 13F | True Wealth Design, LLC | 259 | 475,56 | 19 | 533,33 | ||||
| 2026-04-23 | 13F | McMillan Office, Inc. | 110 | 0,00 | 8 | 14,29 | ||||
| 2026-02-12 | 13F | MetLife Investment Management, LLC | 15.240 | 0,52 | 1.040 | 6,89 | ||||
| 2026-02-11 | 13F | Group One Trading, L.p. | Put | 30.700 | 31,20 | 2.095 | 39,60 | |||
| 2026-02-10 | 13F | Gulf International Bank (UK) Ltd | 14.292 | 0,00 | 1 | -100,00 | ||||
| 2026-02-11 | 13F | Group One Trading, L.p. | 2.316 | 158 | ||||||
| 2026-02-11 | 13F | Group One Trading, L.p. | Call | 46.300 | -38,43 | 3.159 | -34,50 | |||
| 2026-04-09 | 13F | Sanders Morris Harris Llc | 10.250 | 757 | ||||||
| 2026-04-13 | 13F | GoalVest Advisory LLC | 0 | -100,00 | 0 | |||||
| 2025-11-06 | 13F | Whipplewood Advisors, LLC | 0 | -100,00 | 0 | |||||
| 2026-02-05 | 13F | Bessemer Group Inc | 411 | 59,92 | 0 | |||||
| 2026-01-30 | 13F | Caldwell Securities, Inc | 2.078 | -0,91 | 142 | 5,22 | ||||
| 2025-11-10 | 13F | Journey Advisory Group, LLC | 0 | -100,00 | 0 | |||||
| 2026-02-12 | 13F | BRYN MAWR TRUST Co | 4.328 | 0,14 | 295 | 6,50 | ||||
| 2025-11-12 | 13F | 111 Capital | 0 | -100,00 | 0 | |||||
| 2026-02-10 | 13F | Hazlett, Burt & Watson, Inc. | 480 | 0,00 | 0 | |||||
| 2026-02-13 | 13F | Aigen Investment Management, Lp | 9.384 | 768 | ||||||
| 2026-04-13 | 13F | IFP Advisors, Inc | 828 | -3,72 | 61 | 5,17 | ||||
| 2026-02-17 | 13F | Tudor Investment Corp Et Al | Call | 4.800 | -38,46 | 328 | -34,60 | |||
| 2026-04-09 | 13F | Dorato Capital Management | 13.435 | 0,59 | 1.042 | 11,68 | ||||
| 2026-04-23 | 13F | Lansforsakringar Fondforvaltning AB (publ) | 75.362 | 0,40 | 5.559 | 8,39 | ||||
| 2026-01-22 | 13F | Mechanics Financial Corp | 174 | 0,00 | 12 | 0,00 | ||||
| 2026-02-19 | 13F | Mcguire Capital Advisors Inc | 18 | 1 | ||||||
| 2026-02-13 | 13F | Baupost Group Llc/ma | 8.080.112 | -2,09 | 551 | 4,16 | ||||
| 2026-01-27 | 13F | TD Waterhouse Canada Inc. | 974.201 | -15,60 | 66.227 | -13,73 | ||||
| 2026-02-17 | 13F | Freestone Grove Partners LP | 46.756 | -56,35 | 3.190 | -53,57 | ||||
| 2026-02-18 | 13F | Mackenzie Financial Corp | 1.818.754 | -3,88 | 124.744 | 2,79 | ||||
| 2026-01-15 | 13F | Mn Services Vermogensbeheer B.V. | 118.082 | 1,53 | 8 | 14,29 | ||||
| 2026-02-13 | 13F | BNP Paribas Asset Management Holding S.A. | 609.993 | 42 | ||||||
| 2026-04-15 | 13F | Financial Management Professionals, Inc. | 108 | 0,00 | 8 | 14,29 | ||||
| 2026-02-13 | 13F | Maven Securities LTD | 30.000 | 2.047 | ||||||
| 2026-02-09 | 13F | Geode Capital Management, Llc | 5.216.985 | 6,01 | 365.279 | 13,11 | ||||
| 2026-02-13 | 13F | Verition Fund Management LLC | 138.707 | -1,28 | 9.464 | 5,02 | ||||
| 2026-02-12 | 13F | Federated Hermes, Inc. | 68.789 | 16,65 | 4.693 | 24,09 | ||||
| 2026-01-26 | 13F | Asset Dedication, LLC | 23 | 0,00 | 2 | 0,00 | ||||
| 2026-02-10 | 13F | CIBC World Markets Inc. | 3.689.706 | 31,48 | 251.749 | 39,87 | ||||
| 2026-02-11 | 13F | Capital Analysts, Inc. | 924 | 20,63 | 0 | |||||
| 2026-02-17 | 13F | Capital Fund Management S.a. | 0 | -100,00 | 0 | -100,00 | ||||
| 2026-02-12 | 13F | Hrt Financial Lp | 0 | -100,00 | 0 | |||||
| 2026-04-15 | 13F/A | Sl Advisors, Llc | 0 | -100,00 | 0 | |||||
| 2026-02-17 | 13F | Capital Fund Management S.a. | Put | 0 | -100,00 | 0 | -100,00 | |||
| 2025-11-04 | 13F | Ogorek Anthony Joseph /ny/ /adv | 0 | -100,00 | 0 | |||||
| 2026-02-10 | 13F | CIBC Asset Management Inc | 1.317.198 | -38,92 | 90.369 | -34,89 | ||||
| 2026-02-11 | 13F | Picton Mahoney Asset Management | 17.498 | 53,12 | 1.194 | |||||
| 2026-02-13 | 13F | Alerus Financial Na | 2.969 | -82,69 | 203 | -81,62 | ||||
| 2026-02-17 | 13F | Woodline Partners LP | 406.487 | 27.735 | ||||||
| 2026-04-16 | 13F | SG Americas Securities, LLC | 88.563 | 1.576,06 | 7 | |||||
| 2026-02-13 | 13F | Public Sector Pension Investment Board | 0 | -100,00 | 0 | |||||
| 2026-02-12 | 13F | Brown Brothers Harriman & Co | 386 | 18,04 | 26 | 30,00 | ||||
| 2026-02-13 | 13F | Pathstone Holdings, LLC | 9.549 | 1,47 | 652 | 7,95 | ||||
| 2026-02-03 | 13F | Sequoia Financial Advisors, LLC | 8.929 | 10,85 | 609 | 18,02 | ||||
| 2026-02-13 | 13F | Pinnacle Wealth Planning Services, Inc. | 308 | 21 | ||||||
| 2026-02-05 | 13F | Chase Investment Counsel Corp | 0 | -100,00 | 0 | |||||
| 2026-02-17 | 13F | Toronto Dominion Bank | 3.307.584 | 165,18 | 225.711 | 181,57 | ||||
| 2026-02-17 | 13F | Toronto Dominion Bank | Call | 6.700 | -33,66 | 457 | -29,37 | |||
| 2026-02-17 | 13F | Toronto Dominion Bank | Put | 175.300 | 155,91 | 11.962 | 172,30 | |||
| 2026-03-03 | 13F | Platinum Paramount Investment Ltd. | 4.118.904 | 281.033 | ||||||
| 2026-01-29 | 13F | Nichols & Pratt Advisers Llp /ma | 53.634 | 24,24 | 3.659 | 32,19 | ||||
| 2026-02-17 | 13F | Quantessence Capital LLC | 0 | -100,00 | 0 | |||||
| 2026-02-17 | 13F | Gotham Asset Management, LLC | 78.474 | 134,48 | 5.354 | 149,49 | ||||
| 2026-02-03 | 13F | Chesapeake Capital Corp /il/ | 8.101 | 553 | ||||||
| 2026-02-14 | 13F | POM Investment Strategies, LLC | 117 | 8 | ||||||
| 2026-04-20 | 13F | Ronald Blue Trust, Inc. | 543 | 0,00 | 40 | 8,11 | ||||
| 2026-01-30 | 13F | Exencial Wealth Advisors, Llc | 7.268 | 4,10 | 496 | 10,74 | ||||
| 2026-02-13 | 13F | Stifel Financial Corp | 54.231 | 50,83 | 3.700 | 60,45 | ||||
| 2026-02-03 | 13F | Crossmark Global Holdings, Inc. | 13.417 | -27,10 | 915 | -22,46 | ||||
| 2026-02-06 | 13F | Leonteq Securities AG | 7.312 | -30,63 | 499 | -26,33 | ||||
| 2026-04-13 | 13F | Hm Payson & Co | 618 | 0,00 | 46 | 7,14 | ||||
| 2026-02-13 | 13F | Police & Firemen's Retirement System of New Jersey | 49.580 | -5,03 | 3.383 | 1,02 | ||||
| 2026-02-10 | 13F | Forsta Ap-fonden | 71.600 | -4,28 | 4.892 | 1,94 | ||||
| 2026-02-11 | 13F | Primecap Management Co/ca/ | 37.600 | 0,00 | 2.565 | 6,39 | ||||
| 2026-04-02 | 13F | Hilltop National Bank | 22.657 | -3,78 | 1.674 | 4,23 | ||||
| 2026-04-21 | 13F | Financial Consulate, Inc | 208 | 550,00 | 15 | 650,00 | ||||
| 2026-02-10 | 13F | Bank of New York Mellon Corp | 1.001.210 | -3,24 | 68.313 | 2,93 | ||||
| 2026-04-16 | 13F | First Community Trust Na | 75 | 0,00 | 6 | 0,00 | ||||
| 2026-04-13 | 13F | Lee Financial Co | 19.611 | -0,55 | 1.451 | 7,72 | ||||
| 2026-01-22 | 13F | Massachusetts Financial Services Co /ma/ | 0 | -100,00 | 0 | |||||
| 2026-02-23 | 13F | Wealth Preservation Advisors, LLC | 149 | -2,61 | 10 | 11,11 | ||||
| 2026-02-04 | 13F | Swiss Life Asset Management Ltd | 21.197 | -0,36 | 1.446 | 5,86 | ||||
| 2026-02-06 | 13F | Envestnet Portfolio Solutions, Inc. | 4.905 | 1,85 | 335 | 8,44 | ||||
| 2026-02-06 | 13F | Cumberland Partners Ltd | 0 | -100,00 | 0 | |||||
| 2026-02-10 | 13F | Kentucky Retirement Systems | 20.313 | 0,00 | 1.386 | 6,37 | ||||
| 2026-04-21 | 13F | Vise Technologies, Inc. | 5.257 | 0,00 | 359 | 0,00 | ||||
| 2026-02-06 | 13F | Larson Financial Group LLC | 364 | 1.922,22 | 25 | 2.300,00 | ||||
| 2026-04-15 | 13F | Merit Financial Group, LLC | 4.997 | 41,20 | 369 | 53,11 | ||||
| 2026-02-11 | 13F | Metis Global Partners, LLC | 10.255 | -24,01 | 700 | -19,19 | ||||
| 2026-04-08 | 13F | Legacy Wealth Asset Management, LLC | 8.167 | 1,72 | 604 | 10,24 | ||||
| 2026-02-02 | 13F | Cornerstone Planning Group LLC | 73 | 630,00 | 5 | |||||
| 2026-02-24 | 13F | River Road Asset Management, LLC | 863.570 | -40,81 | 58.921 | -37,04 | ||||
| 2026-02-12 | 13F | Voya Investment Management Llc | 84.170 | 162,65 | 5.743 | 179,42 | ||||
| 2026-02-17 | 13F | Pinnacle Financial Partners, Inc. | 3.478 | 237 | ||||||
| 2026-02-02 | 13F | Inkwell Capital Llc | 49.315 | -1,44 | 3.365 | 4,83 | ||||
| 2026-02-05 | 13F | Td Private Client Wealth Llc | 5.432 | -5,74 | 371 | 0,27 | ||||
| 2026-02-17 | 13F | Advisor Group Holdings, Inc. | 22.274 | 27,17 | 1.520 | 35,23 | ||||
| 2026-04-22 | 13F | Braun Stacey Associates Inc | 16.250 | -0,15 | 1.201 | 8,11 | ||||
| 2026-02-12 | 13F | Swiss National Bank | 825.430 | -7,82 | 56.441 | -1,79 | ||||
| 2025-11-14 | 13F | Axa S.a. | 0 | -100,00 | 0 | |||||
| 2026-01-23 | 13F | FSM Wealth Advisors, LLC | 4.378 | 8,91 | 299 | 15,95 | ||||
| 2026-02-10 | 13F | Fiduciary Family Office, Llc | 22.848 | 4,32 | 1.559 | 10,97 | ||||
| 2026-02-13 | 13F | Dynamic Technology Lab Private Ltd | 37.367 | 2.550 | ||||||
| 2026-02-06 | 13F | Covestor Ltd | 1.575 | -13,46 | 0 | |||||
| 2026-04-10 | 13F | Waldron Private Wealth LLC | 4.150 | 0,00 | 309 | 8,42 | ||||
| 2026-02-12 | 13F | Wealthspire Advisors, LLC | 0 | -100,00 | 0 | |||||
| 2026-01-21 | 13F | Raleigh Capital Management Inc. | 6.418 | -5,96 | 438 | 0,00 | ||||
| 2026-02-12 | 13F | Earnest Partners Llc | 59.368 | -20,55 | 4.051 | -15,48 | ||||
| 2026-02-17 | 13F | Optiver Holding B.V. | 0 | -100,00 | 0 | |||||
| 2026-04-06 | 13F | Versant Capital Management, Inc | 3.271 | 70,72 | 242 | 85,38 | ||||
| 2026-02-05 | 13F | Applied Finance Capital Management, LLC | 9.440 | 1,93 | 644 | 8,42 | ||||
| 2026-02-17 | 13F | Ameriprise Financial Inc | 203.312 | 716,48 | 14.021 | 699,32 | ||||
| 2026-02-13 | 13F | Prudential Financial Inc | 9.442 | -43,33 | 644 | -39,70 | ||||
| 2026-04-13 | 13F | Massmutual Trust Co Fsb/adv | 828 | -26,33 | 61 | -19,74 | ||||
| 2026-04-14 | 13F | Meadowbrook Wealth Management, LLC | 4.640 | -2,11 | 343 | 5,88 | ||||
| 2026-02-20 | 13F | Sunbelt Securities, Inc. | 14 | 366,67 | 1 | |||||
| 2026-02-06 | 13F | Cullen/frost Bankers, Inc. | 159.816 | 12,42 | 10.904 | 19,59 | ||||
| 2026-02-17 | 13F | Parallax Volatility Advisers, L.P. | 780 | -67,32 | 53 | -65,36 | ||||
| 2026-02-17 | 13F | Wiley Bros.-aintree Capital, Llc | 36.228 | 12,81 | 2.472 | 20,65 | ||||
| 2026-02-17 | 13F | Parallax Volatility Advisers, L.P. | Put | 24.000 | 0,00 | 1.638 | 6,37 | |||
| 2026-02-04 | 13F | Abc Arbitrage Sa | 4.344 | 296 | ||||||
| 2026-02-09 | 13F | Legal & General Group Plc | 1.693.511 | 5,06 | 115.708 | 11,87 | ||||
| 2026-02-11 | 13F | Simplex Trading, Llc | Put | 25.400 | -20,38 | 1.733 | 86.550,00 | |||
| 2026-04-15 | 13F | Exchange Traded Concepts, Llc | 0 | -100,00 | 0 | |||||
| 2026-02-11 | 13F | Simplex Trading, Llc | Call | 73.600 | 5,60 | 5.022 | 125.425,00 | |||
| 2026-02-17 | 13F | Wealth Watch Advisors, INC | 397 | 26,43 | 27 | 35,00 | ||||
| 2026-02-17 | 13F | Hutner Capital Management Inc | 17.788 | 12,68 | 1.214 | 19,86 | ||||
| 2025-11-14 | 13F | Maverick Capital Ltd | 0 | -100,00 | 0 | |||||
| 2026-02-09 | 13F | Atlantic Trust, LLC | 128 | 236,84 | 9 | 300,00 | ||||
| 2026-02-17 | 13F | Dimension Capital Management Llc | 3.501 | 0,00 | 239 | 6,25 | ||||
| 2026-01-30 | 13F | Us Bancorp \de\ | 8.952 | 8,83 | 611 | 15,75 | ||||
| 2026-04-13 | 13F | Loring Wolcott & Coolidge Fiduciary Advisors Llp/ma | 432 | 0,00 | 33 | 13,79 | ||||
| 2026-04-20 | 13F | Sowell Financial Services LLC | 5.910 | 5,22 | 437 | 13,84 | ||||
| 2026-02-10 | 13F | Rothschild Investment Llc | 87 | 314,29 | 6 | 400,00 | ||||
| 2026-04-15 | 13F | Avanza Fonder AB | 21.589 | 0,00 | 2.222 | 9,89 | ||||
| 2026-02-17 | 13F | Citadel Advisors Llc | Put | 146.600 | -7,80 | 10.003 | -1,92 | |||
| 2026-02-17 | 13F | Hook Mill Capital Partners, LP | 222.958 | 15.212 | ||||||
| 2026-02-17 | 13F | Occudo Quantitative Strategies Lp | 65.144 | 4.445 | ||||||
| 2025-11-07 | 13F | Sierra Ocean, Llc | 0 | -100,00 | 0 | -100,00 | ||||
| 2026-02-10 | 13F | MidAtlantic Capital Management, Inc. | 155 | 11 | ||||||
| 2026-02-06 | 13F | Partners Group Holding AG | 24.645 | 1.682 | ||||||
| 2026-02-13 | 13F | State Street Corp | 3.155.112 | 1,12 | 217.195 | 7,50 | ||||
| 2026-02-13 | 13F | Boston Partners | 29.564 | 40,64 | 2.017 | 170,74 | ||||
| 2026-02-17 | 13F | Citadel Advisors Llc | Call | 182.600 | -20,88 | 12.459 | -15,84 | |||
| 2026-02-17 | 13F | Quantitative Investment Management, LLC | 0 | -100,00 | 0 | |||||
| 2026-02-17 | 13F | Citadel Advisors Llc | 1.188.246 | -37,29 | 81.074 | -33,29 | ||||
| 2026-01-16 | 13F | Crewe Advisors LLC | 1.013 | 0,00 | 69 | 7,81 | ||||
| 2026-02-17 | 13F | Millennium Management Llc | Call | 11.000 | 134,04 | 751 | 149,17 | |||
| 2026-02-17 | 13F | Millennium Management Llc | 493.468 | 690,13 | 33.669 | 740,67 | ||||
| 2026-02-10 | 13F | Quantbot Technologies LP | 0 | -100,00 | 0 | |||||
| 2026-02-13 | 13F | Morgan Stanley | 8.429.121 | 24,19 | 575.119 | 32,11 | ||||
| 2026-02-13 | 13F | Knollwood Investment Advisory, LLC | 6.278 | 0,00 | 428 | 6,47 | ||||
| 2026-02-17 | 13F | MIRAE ASSET GLOBAL ETFS HOLDINGS Ltd. | 10.504 | 717 | ||||||
| 2026-01-09 | 13F | Pacifica Partners Inc. | 0 | -100,00 | 0 | |||||
| 2026-02-17 | 13F | Millennium Management Llc | Put | 8.000 | 110,53 | 546 | 124,28 | |||
| 2026-04-06 | 13F | GAMMA Investing LLC | 2.344 | 5,68 | 173 | 14,57 | ||||
| 2025-11-14 | 13F | Cubist Systematic Strategies, LLC | Call | 5.100 | -64,58 | 327 | -65,72 | |||
| 2025-11-14 | 13F | Cubist Systematic Strategies, LLC | Put | 5.100 | 0,00 | 327 | -3,25 | |||
| 2026-02-17 | 13F | Lombard Odier Asset Management (Switzerland) SA | 13.841 | 945 | ||||||
| 2025-11-14 | 13F | Virtu Financial LLC | 0 | -100,00 | 0 | |||||
| 2026-02-13 | 13F | Meritage Group LP | 3.200.731 | -2,44 | 218.386 | 3,78 | ||||
| 2026-02-10 | 13F | Seven Grand Managers, Llc | 350.000 | 23.880 | ||||||
| 2026-02-17 | 13F | Weiss Asset Management LP | 0 | -100,00 | 0 | -100,00 | ||||
| 2026-02-17 | 13F | Capstone Investment Advisors, Llc | 0 | -100,00 | 0 | -100,00 | ||||
| 2026-02-11 | 13F | Capital Group Investment Management Pte. Ltd. | 58.966 | 25,65 | 4.023 | 33,70 | ||||
| 2026-02-13 | 13F | Bridgewater Associates, LP | 80.173 | -29,62 | 5.470 | -25,13 | ||||
| 2026-02-13 | 13F | Ubs Asset Management Americas Inc | 10.937 | 746 | ||||||
| 2026-01-29 | 13F | IMC-Chicago, LLC | Put | 28.000 | -5,08 | 1.910 | 0,95 | |||
| 2026-01-20 | 13F | Cigna Investments Inc /new | 5.506 | 0,00 | 0 | |||||
| 2026-01-29 | 13F | IMC-Chicago, LLC | Call | 33.600 | -42,07 | 2.293 | -38,39 | |||
| 2026-04-15 | 13F | DAVENPORT & Co LLC | 5.977 | 98,24 | 442 | 115,12 | ||||
| 2026-02-17 | 13F | Blackstone Group Inc | 0 | -100,00 | 0 | |||||
| 2026-02-17 | 13F | Jones Financial Companies Lllp | 5.444 | 32,59 | 371 | 39,47 | ||||
| 2026-01-21 | 13F | Sound Income Strategies, LLC | 177 | 0,00 | 12 | 9,09 | ||||
| 2026-02-02 | 13F | Savoir Faire Capital Management, L.P. | 18.063 | -48,57 | 1.232 | -45,29 | ||||
| 2026-04-06 | 13F | Rosenberg Matthew Hamilton | 1.000 | 0,00 | 74 | 7,35 | ||||
| 2025-11-14 | 13F | Point72 (DIFC) Ltd | 50.506 | 3.239 | ||||||
| 2026-02-12 | 13F | Great Lakes Retirement, Inc. | 32.280 | 2.222 | ||||||
| 2026-04-08 | 13F | Grove Bank & Trust | 804 | -0,12 | 59 | 9,26 | ||||
| 2026-02-10 | 13F | Machina Capital S.a.s. | 48.590 | 156,67 | 3.315 | 173,06 | ||||
| 2026-02-11 | 13F | O'shaughnessy Asset Management, Llc | 11.511 | 9,17 | 785 | 16,12 | ||||
| 2026-02-11 | 13F | Syon Capital Llc | 5.661 | 386 | ||||||
| 2026-02-17 | 13F | Trexquant Investment LP | 189.069 | 12.900 | ||||||
| 2026-04-24 | 13F | Yousif Capital Management, Llc | 7.635 | 4,09 | 564 | 12,80 | ||||
| 2026-03-06 | 13F | Hsbc Holdings Plc | Put | 0 | -100,00 | 0 | ||||
| 2026-03-06 | 13F | Hsbc Holdings Plc | 0 | -100,00 | 0 | |||||
| 2025-11-03 | 13F | Annis Gardner Whiting Capital Advisors, LLC | 0 | -100,00 | 0 | |||||
| 2026-02-17 | 13F | Northern Trust Corp | 945.500 | 1,29 | 64.511 | 7,75 | ||||
| 2026-02-09 | 13F | AIA Group Ltd | 89.710 | -19,30 | 6.121 | -14,17 | ||||
| 2026-02-13 | 13F | PCM Encore, LLC | 14.604 | 996 | ||||||
| 2025-10-30 | 13F | Twin Peaks Wealth Advisors, LLC | 0 | -100,00 | 0 | |||||
| 2026-02-13 | 13F | First Trust Advisors Lp | 17.974 | 5,48 | 1.226 | 12,17 | ||||
| 2026-02-13 | 13F | Squarepoint Ops LLC | Call | 12.700 | -73,81 | 867 | -72,15 | |||
| 2026-02-13 | 13F | Squarepoint Ops LLC | 569.717 | 49,49 | 38.872 | 59,02 | ||||
| 2025-10-30 | 13F | Ridgewood Investments LLC | 0 | -100,00 | 0 | |||||
| 2026-02-11 | 13F | Zions Bancorporation, National Association /ut/ | 181 | 12 | ||||||
| 2026-02-06 | 13F | Tortoise Investment Management, LLC | 0 | -100,00 | 0 | |||||
| 2026-02-11 | 13F | Manchester Capital Management LLC | 3 | 0 | ||||||
| 2026-01-23 | 13F | Smallwood Wealth Investment Management, LLC | 0 | -100,00 | 0 | |||||
| 2026-04-10 | 13F | Cerro Pacific Wealth Advisors LLC | 2.965 | 219 | ||||||
| 2026-02-12 | 13F | Scotia Capital Inc. | 1.457.477 | -2,87 | 99.089 | 2,95 | ||||
| 2026-02-13 | 13F | Mariner, LLC | 17.336 | -1,10 | 1.184 | 5,34 | ||||
| 2026-01-20 | 13F | AdvisorNet Financial, Inc | 0 | -100,00 | 0 | |||||
| 2026-02-13 | 13F | Mml Investors Services, Llc | 8.980 | 23,15 | 613 | 31,05 | ||||
| 2025-11-14 | 13F | Wolverine Trading, Llc | 16.520 | -12,35 | 1.084 | -12,02 | ||||
| 2025-11-14 | 13F | Wolverine Trading, Llc | Call | 61.100 | 3,56 | 4.008 | 3,97 | |||
| 2026-02-06 | 13F | GPS Wealth Strategies Group, LLC | 0 | -100,00 | 0 | |||||
| 2025-11-14 | 13F | Wolverine Trading, Llc | Put | 74.800 | 7,78 | 4.907 | 8,18 | |||
| 2026-01-29 | 13F | D.a. Davidson & Co. | 8.451 | 1,86 | 577 | 8,27 | ||||
| 2026-01-29 | 13F | UBS Group AG | 1.408.839 | 42,53 | 96.125 | 51,62 | ||||
| 2026-02-17 | 13F | XTX Topco Ltd | 8.819 | 139,84 | 602 | 155,74 | ||||
| 2026-02-17 | 13F | Canada Pension Plan Investment Board | 2.750.378 | -5,12 | 187.684 | 0,95 | ||||
| 2026-04-22 | 13F | Louisbourg Investments Inc. | 60.059 | -23,10 | 4.435 | -16,89 | ||||
| 2026-02-17 | 13F | Ancora Advisors, LLC | 17 | 1 | ||||||
| 2026-03-12 | 13F | Nalls Sherbakoff Group, Llc | 54 | 0,00 | 4 | -25,00 | ||||
| 2026-01-13 | 13F | Stonehage Fleming Financial Services Holdings Ltd | 1.300 | 0,00 | 89 | 6,02 | ||||
| 2026-02-17 | 13F | Amundi | 354.158 | 7,24 | 24.164 | 6,25 | ||||
| 2026-02-17 | 13F | New Vernon Capital Holdings II LLC | 707 | 0,00 | 66 | 46,67 | ||||
| 2026-02-17 | 13F | First Manhattan Co | 182.326 | 0,99 | 12.553 | 7,37 | ||||
| 2026-04-15 | 13F | Valley National Advisers Inc | 495 | 0,00 | 0 | |||||
| 2026-04-24 | 13F | Sage Investment Counsel LLC | 2.865 | 212 | ||||||
| 2026-02-10 | 13F | Hillsdale Investment Management Inc. | 376.147 | 851,50 | 25.713 | 914,32 | ||||
| 2026-02-12 | 13F | Principal Securities, Inc. | 7.032 | 6,32 | 480 | 12,97 | ||||
| 2026-02-17 | 13F | Skye Global Management LP | 31.815 | -74,75 | 2.171 | -73,15 | ||||
| 2026-01-29 | 13F | Rakuten Securities, Inc. | 1 | 0,00 | 0 | |||||
| 2026-02-17 | 13F | Engineers Gate Manager LP | 177.647 | 624,26 | 12.121 | 670,50 | ||||
| 2026-02-13 | 13F | Kestra Advisory Services, LLC | 0 | -100,00 | 0 | |||||
| 2026-02-02 | 13F | Robertson Stephens Wealth Management, LLC | 3.490 | 0,00 | 240 | 6,19 | ||||
| 2026-02-06 | 13F | EverSource Wealth Advisors, LLC | 1.067 | 195,57 | 73 | 213,04 | ||||
| 2025-11-26 | 13F/A | Evelyn Partners Investment Management Services Ltd | 0 | -100,00 | 0 | -100,00 | ||||
| 2026-02-17 | 13F | Polar Asset Management Partners Inc. | Put | 0 | -100,00 | 0 | ||||
| 2026-01-30 | 13F | Bogart Wealth, LLC | 613 | -23,38 | 42 | -19,61 | ||||
| 2026-01-28 | 13F | Lebenthal Global Advisors, LLC | 27.831 | 118,54 | 1.899 | 132,60 | ||||
| 2026-02-05 | 13F | Cambridge Investment Research Advisors, Inc. | 8.186 | -2,63 | 1 | |||||
| 2026-02-05 | 13F | Navalign, LLC | 83 | 6 | ||||||
| 2026-02-12 | 13F | Rossby Financial, LCC | 27 | 12,50 | 2 | 0,00 | ||||
| 2026-02-02 | 13F | Intact Investment Management Inc. | 504.261 | -33,60 | 34.408 | -29,38 | ||||
| 2026-02-17 | 13F | Mercer Global Advisors Inc /adv | 13.292 | 29,65 | 907 | 37,90 | ||||
| 2026-01-26 | 13F | AE Wealth Management LLC | 11.626 | 5,45 | 793 | 12,16 | ||||
| 2026-02-12 | 13F | Richard W. Paul & Associates, LLC | 5.043 | -4,29 | 344 | 2,08 | ||||
| 2026-02-02 | 13F | Principal Financial Group Inc | 7.639 | -27,80 | 521 | -23,16 | ||||
| 2026-02-11 | 13F | First Command Advisory Services, Inc. | 83 | 6 | ||||||
| 2026-02-13 | 13F | BRITISH COLUMBIA INVESTMENT MANAGEMENT Corp | 171.808 | -8,93 | 11.724 | -3,10 | ||||
| 2026-04-20 | 13F | Ritholtz Wealth Management | 7.349 | 39,79 | 543 | 51,68 | ||||
| 2025-11-12 | 13F | CIBC Bancorp USA Inc. | 17.144 | 1.169 | ||||||
| 2026-04-15 | 13F | Consolidated Capital Management, Llc | 0 | -100,00 | 0 | |||||
| 2026-02-13 | 13F | Umb Bank N A/mo | 639 | 50,35 | 44 | 59,26 | ||||
| 2026-02-13 | 13F | Charles Schwab Investment Management Inc | 959.998 | 3,06 | 65.585 | 9,74 | ||||
| 2026-02-18 | 13F | State of Tennessee, Treasury Department | 171.261 | -3,50 | 11.538 | 1,32 | ||||
| 2026-04-23 | 13F | North Star Investment Management Corp. | 11 | 1 | ||||||
| 2026-01-23 | 13F | Westside Investment Management, Inc. | 116 | 0,00 | 8 | 0,00 | ||||
| 2026-02-17 | 13F | Price T Rowe Associates Inc /md/ | 161.222 | 7,73 | 11 | 22,22 | ||||
| 2026-02-17 | 13F | Private Advisor Group, LLC | 4.184 | -0,74 | 285 | 5,56 | ||||
| 2026-01-29 | 13F | Sanctuary Advisors, LLC | 4.519 | 11,69 | 308 | 18,92 | ||||
| 2026-02-05 | 13F | Amalgamated Bank | 23.225 | 0,78 | 2 | 0,00 | ||||
| 2026-02-17 | 13F | Polar Asset Management Partners Inc. | 0 | -100,00 | 0 | |||||
| 2026-02-17 | 13F | Balyasny Asset Management Llc | Put | 100.000 | -59,60 | 6.823 | -57,02 | |||
| 2026-01-15 | 13F | Nisa Investment Advisors, Llc | 3.610 | 94,61 | 249 | 104,96 | ||||
| 2026-02-10 | 13F | Intech Investment Management Llc | 7.891 | 0,00 | 539 | 6,52 | ||||
| 2026-04-21 | 13F | Pflug Koory, LLC | 716 | 0,00 | 53 | 8,33 | ||||
| 2026-02-13 | 13F | JustInvest LLC | 12.094 | 29,17 | 825 | 37,50 | ||||
| 2026-02-10 | 13F | MUFG Securities EMEA plc | 0 | -100,00 | 0 | |||||
| 2026-04-14 | 13F | Beacon Investment Advisory Services, Inc. | 568 | 42 | ||||||
| 2026-02-13 | 13F | Mufg Securities (canada), Ltd. | 499.134 | -7,98 | 34.067 | -2,09 | ||||
| 2026-02-24 | 13F | Stone Wealth Partners | 5.068 | 349 | ||||||
| 2026-04-02 | 13F | Ares Financial Consulting, LLC | 49 | 2,08 | 4 | 0,00 | ||||
| 2026-02-03 | 13F | Generali Asset Management SPA SGR | 8.965 | 10,57 | 840 | 16,04 | ||||
| 2026-01-30 | 13F/A | M&t Bank Corp | 25.739 | 5,79 | 1.756 | 12,50 | ||||
| 2026-02-13 | 13F | Epoch Investment Partners, Inc. | 846.963 | -3,57 | 57.788 | 2,58 | ||||
| 2026-01-23 | 13F | Steigerwald, Gordon & Koch Inc. | 450 | 0,00 | 31 | 7,14 | ||||
| 2026-04-10 | 13F | Pure Financial Advisors, Inc. | 2.737 | 202 | ||||||
| 2026-04-14 | 13F | Bay Harbor Wealth Management, LLC | 1.330 | -4,04 | 99 | 4,21 | ||||
| 2026-02-14 | 13F | Rockefeller Capital Management L.P. | 327.887 | 27,65 | 22.291 | 35,30 | ||||
| 2025-11-13 | 13F | Macquarie Group Ltd | 0 | -100,00 | 0 | -100,00 | ||||
| 2026-02-13 | 13F | Landscape Capital Management, L.l.c. | 66.603 | 9,74 | 4.544 | 16,75 | ||||
| 2026-02-12 | 13F | State Board Of Administration Of Florida Retirement System | 191.887 | 65,71 | 13.092 | 76,28 | ||||
| 2026-02-10 | 13F | Norges Bank | 3.820.684 | 260.709 | ||||||
| 2026-02-17 | 13F | Corvex Management LP | 2.408.743 | 0,00 | 164.349 | 6,38 | ||||
| 2026-01-15 | 13F | Nilsine Partners, LLC | 14.887 | 5,09 | 1.016 | 11,78 | ||||
| 2026-02-13 | 13F | Great West Life Assurance Co /can/ | 135.610 | -37,55 | 9 | -35,71 | ||||
| 2026-02-17 | 13F | California State Teachers Retirement System | 20.138 | -1,78 | 1.374 | 4,49 | ||||
| 2026-01-20 | 13F | Cromwell Holdings LLC | 1.079 | 0,00 | 74 | 7,25 | ||||
| 2026-02-17 | 13F | D. E. Shaw & Co., Inc. | Call | 45.900 | 3.132 | |||||
| 2026-01-07 | 13F | Procyon Private Wealth Partners, LLC | 2.961 | 202 | ||||||
| 2026-02-12 | 13F | Bank Of Nova Scotia Trust Co | 328.140 | 9,76 | 22.389 | 16,76 | ||||
| 2026-02-17 | 13F | D. E. Shaw & Co., Inc. | 286.960 | 396,47 | 19.582 | 428,39 | ||||
| 2026-02-05 | 13F | Allworth Financial LP | 1.912 | 31,14 | 130 | 39,78 | ||||
| 2026-03-24 | 13F/A | Barclays Plc | Put | 0 | -100,00 | 0 | -100,00 | |||
| 2025-11-06 | 13F | Aspect Partners, LLC | 0 | -100,00 | 0 | -100,00 | ||||
| 2026-04-23 | 13F | Farmers & Merchants Investments Inc | 261 | 0,00 | 19 | 11,76 | ||||
| 2025-11-14 | 13F | Mount Yale Investment Advisors, LLC | 0 | -100,00 | 0 | -100,00 | ||||
| 2025-11-05 | 13F | Moloney Securities Asset Management, LLC | 13.746 | -41,44 | 882 | -43,38 | ||||
| 2026-02-17 | 13F | Duquesne Family Office LLC | 1.209.000 | 6,86 | 82 | 13,89 | ||||
| 2026-02-04 | 13F | Tsfg, Llc | 61 | 0,00 | 0 | |||||
| 2026-02-17 | 13F | MIC Capital Management UK LLP | 386.203 | 0,00 | 26.351 | 6,37 | ||||
| 2026-04-22 | 13F | Pinnacle Bancorp, Inc. | 357 | 0,00 | 26 | 8,33 | ||||
| 2026-04-22 | 13F | Spire Wealth Management | 100 | 0,00 | 7 | 16,67 | ||||
| 2026-02-17 | 13F | Point72 Asset Management, L.P. | Put | 5.100 | 348 | |||||
| 2026-02-17 | 13F | Point72 Asset Management, L.P. | Call | 33.000 | 0,00 | 2.252 | 6,38 | |||
| 2026-04-14 | 13F | Nbc Securities, Inc. | 9.903 | 0,20 | 732 | 8,46 | ||||
| 2025-11-14 | 13F | Verition Fund Management LLC | Put | 0 | -100,00 | 0 | -100,00 | |||
| 2026-02-06 | 13F | Entrust Financial Llc | 62 | 4 | ||||||
| 2026-01-21 | 13F | Indiana Trust & Investment Management CO | 127 | 0,00 | 9 | 0,00 | ||||
| 2026-04-24 | 13F | Capricorn Fund Managers Ltd | 65.089 | 0,00 | 4.810 | 8,31 | ||||
| 2025-11-12 | 13F | Burgundy Asset Management Ltd. | 1.742.299 | 9,85 | 110.267 | 5,00 | ||||
| 2026-02-11 | 13F | Franklin Resources Inc | 88.747 | 6,25 | 6.056 | 13,05 | ||||
| 2026-01-29 | 13F | Vanguard Group Inc | 15.983.585 | 2,20 | 1.090.684 | 8,71 | ||||
| 2026-02-13 | 13F | Quarry LP | 147 | -97,71 | 10 | -97,57 | ||||
| 2026-04-13 | 13F | Baskin Financial Services Inc. | 341.152 | -2,55 | 25 | 8,70 | ||||
| 2026-02-03 | 13F | ASR Vermogensbeheer N.V. | 13.583 | 0,00 | 928 | 6,54 | ||||
| 2026-02-02 | 13F | Horizon Investments, LLC | 3 | 0 | ||||||
| 2026-02-12 | 13F | UniSuper Management Pty Ltd | 5.200 | 0,00 | 487 | 4,96 | ||||
| 2025-11-12 | 13F | NewSquare Capital LLC | 0 | -100,00 | 0 | -100,00 |