Grundlæggende statistik
| Institutionelle ejere | 392 total, 365 long only, 4 short only, 23 long/short - change of 18,37% MRQ |
| Gennemsnitlig porteføljeallokering | 0.2872 % - change of 13,06% MRQ |
| Institutionelle aktier (lange) | 23.091.886 (ex 13D/G) - change of 0,68MM shares 3,05% MRQ |
| Institutionel værdi (lang) | $ 2.251.638 USD ($1000) |
Institutionelt ejerskab og aktionærer
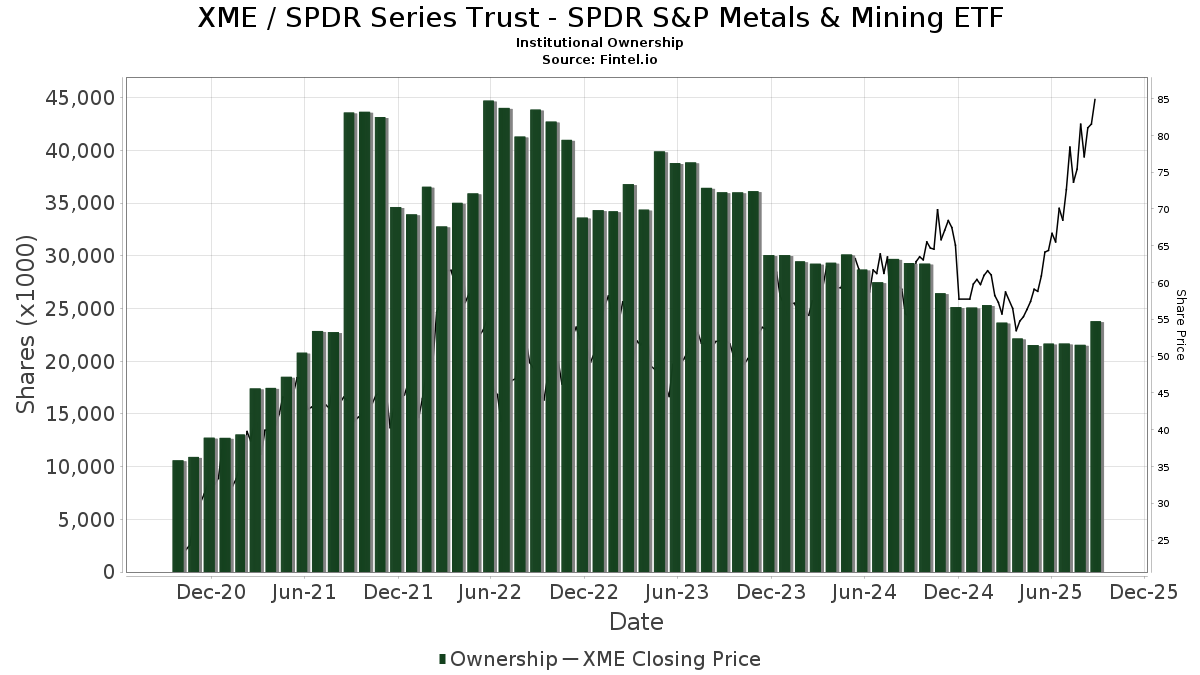
SPDR Series Trust - State Street SPDR S&P Metals & Mining ETF (US:XME) har 392 institutionelle ejere og aktionærer, der har indsendt 13D/G- eller 13F-formularer til Securities Exchange Commission (SEC). Disse institutioner har i alt 23,091,886 aktier. Største aktionærer omfatter Morgan Stanley, Bank Of America Corp /de/, UBS Group AG, Barclays Plc, UBS Group AG, UBS Group AG, Bnp Paribas Arbitrage, Sa, Susquehanna International Group, Llp, Jane Street Group, Llc, and Citadel Advisors Llc .
SPDR Series Trust - State Street SPDR S&P Metals & Mining ETF (ARCA:XME) institutionel ejerskabsstruktur viser aktuelle positioner i virksomheden efter institutioner og fonde, samt seneste ændringer i positionsstørrelse. Større aktionærer kan omfatte individuelle investorer, investeringsforeninger, hedgefonde eller institutioner. Skema 13D angiver, at investoren besidder (eller besidder) mere end 5 % af virksomheden og har til hensigt (eller har til hensigt at) aktivt at forfølge en ændring i forretningsstrategi. Skema 13G indikerer en passiv investering på over 5%.
The share price as of April 10, 2026 is 113,56 / share. Previously, on April 14, 2025, the share price was 54,49 / share. This represents an increase of 108,41% over that period.
Fondens stemningsscore
Fund Sentiment Score (fka Ownership Accumulation Score) finder de aktier, der bliver mest købt af fonde. Det er resultatet af en sofistikeret, multi-faktor kvantitativ model, der identificerer virksomheder med de højeste niveauer af institutionel akkumulering. Scoringsmodellen bruger en kombination af den samlede stigning i oplyste ejere, ændringerne i porteføljeallokeringer i disse ejere og andre målinger. Tallet går fra 0 til 100, hvor højere tal indikerer et højere niveau af akkumulering for sine jævnaldrende, og 50 er gennemsnittet.
Opdateringsfrekvens: Dagligt
Se Ownership Explorer, som giver en liste over højest rangerende virksomheder.
AI+ Ask Fintel’s AI assistant about SPDR Series Trust - State Street SPDR S&P Metals & Mining ETF.
Select a question to share a public post with an AI-crafted answer.
Thinking of good questions…
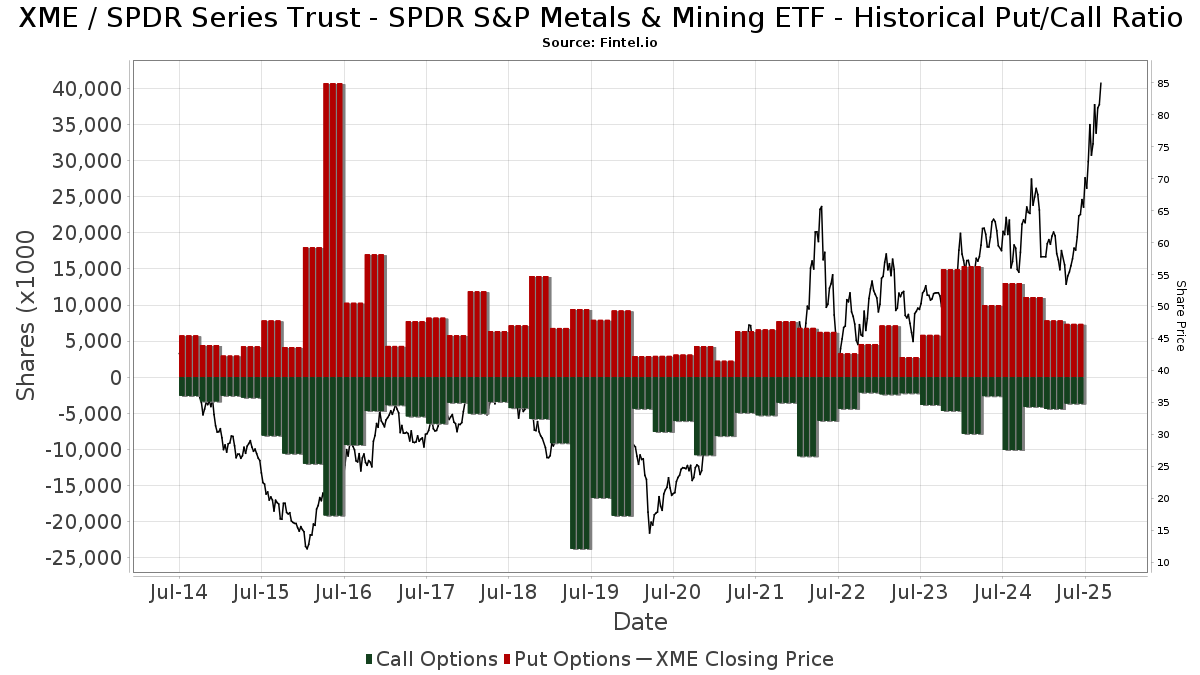
Institutionel Put/Call-forhold
Ud over at indberette standardaktie- og gældsudstedelser skal institutter med mere end 100 mill. aktiver under forvaltning også oplyse deres put- og call-optionsbeholdninger. Da salgsoptioner generelt indikerer negativ stemning, og købsoptioner indikerer positiv stemning, kan vi få en fornemmelse af den overordnede institutionelle stemning ved at plotte forholdet mellem put og kald. Diagrammet til højre viser det historiske put/call-forhold for dette instrument.
Brug af Put/Call Ratio som en indikator for investorernes stemning overvinder en af de vigtigste mangler ved at bruge totalt institutionelt ejerskab, som er, at en betydelig mængde af aktiver under forvaltning investeres passivt for at spore indekser. Passivt forvaltede fonde køber typisk ikke optioner, så indikatoren for put/call-forholdet følger mere nøje følelsen af aktivt forvaltede fonde.
13F og NPORT arkivering
Detaljer om 13F-arkivering er gratis. Detaljer om NP-ansøgninger kræver et premium-medlemskab. Grønne rækker angiver nye positioner. Røde rækker angiver lukkede positioner. Klik på linket ikon for at se den fulde transaktionshistorik.
Opgrader
for at låse premium-data op og eksportere til Excel ![]() .
.
| Fil dato | Kilde | Investor | Type | Gennemsnitlig pris (Øst) |
Aktier | Δ Aktier (%) |
Rapporteret Værdi ($1000) |
Δ Værdi (%) |
Port Alloc (%) |
|
|---|---|---|---|---|---|---|---|---|---|---|
| 2026-01-22 | 13F | Harwood Advisory Group, LLC | 18.690 | -5,53 | 1.936 | 5,05 | ||||
| 2026-02-13 | 13F | Gen-Wealth Partners Inc | 206 | 21 | ||||||
| 2026-02-13 | 13F | Toroso Investments, LLC | 55.130 | -73,44 | 5.712 | -70,47 | ||||
| 2026-04-07 | 13F | Heartwood Wealth Advisors LLC | 15.541 | -14,02 | 1.679 | -10,36 | ||||
| 2026-01-28 | 13F | Fischer Investment Strategies, Llc | 18.964 | 1.965 | ||||||
| 2026-01-26 | 13F | Whittier Trust Co | 788 | 0,00 | 91 | 18,42 | ||||
| 2026-02-13 | 13F | Capula Management Ltd | Call | 400.000 | 41.444 | |||||
| 2026-02-11 | 13F | Capital Analysts, Inc. | 85 | 0,00 | 0 | |||||
| 2026-02-13 | 13F | Kestra Advisory Services, LLC | 0 | -100,00 | 0 | |||||
| 2026-02-02 | 13F | Montag A & Associates Inc | 11.951 | 0,00 | 1.238 | 11,23 | ||||
| 2026-02-09 | 13F | Hantz Financial Services, Inc. | 39 | 0,00 | 0 | |||||
| 2026-02-13 | 13F | Natixis | 453.635 | -43,62 | 47.001 | -37,32 | ||||
| 2026-02-03 | 13F | Winch Advisory Services, LLC | 485 | 11,75 | 50 | 25,00 | ||||
| 2026-01-30 | 13F | Kohmann Bosshard Financial Services, LLC | 240 | 25 | ||||||
| 2026-01-12 | 13F | Rialto Wealth Management, LLC | 1.806 | 0,00 | 187 | 11,31 | ||||
| 2026-04-07 | 13F | U.S. Capital Wealth Advisors, LLC | 2.537 | 274 | ||||||
| 2026-02-19 | 13F | CI Private Wealth, LLC | 18.645 | -2,06 | 1.934 | 9,02 | ||||
| 2026-02-13 | 13F | Ubs Asset Management Americas Inc | 951 | 99 | ||||||
| 2026-04-08 | 13F | Cadent Capital Advisors, LLC | 10.788 | -47,30 | 1.165 | -45,07 | ||||
| 2026-02-04 | 13F | Ballast Rock Private Wealth LLC | 9.223 | 956 | ||||||
| 2026-02-06 | 13F | Global Retirement Partners, LLC | 3.647 | 1,99 | 378 | 13,21 | ||||
| 2026-02-06 | 13F | IFP Advisors, Inc | 12.523 | -21,92 | 1.298 | -13,19 | ||||
| 2026-02-11 | 13F | Prudential Plc | 0 | -100,00 | 0 | |||||
| 2026-01-29 | 13F | Camelot Portfolios, LLC | 52 | 5 | ||||||
| 2025-11-14 | 13F/A | NorthRock Partners, LLC | 0 | -100,00 | 0 | |||||
| 2026-01-20 | 13F | AdvisorNet Financial, Inc | 304 | 31 | ||||||
| 2026-01-16 | 13F | Compagnie Lombard Odier SCmA | 30.500 | 8,16 | 3.160 | 20,29 | ||||
| 2026-02-13 | 13F | Smartleaf Asset Management LLC | 101 | 11 | ||||||
| 2026-02-17 | 13F | D. E. Shaw & Co., Inc. | 125.310 | 12.983 | ||||||
| 2025-11-12 | 13F | Creekmur Asset Management LLC | 247 | 0,00 | 23 | 43,75 | ||||
| 2026-02-17 | 13F | Capital Fund Management S.a. | Put | 184.800 | 57,95 | 19.147 | 75,61 | |||
| 2026-01-13 | 13F | Synergy Financial Management, LLC | 26.507 | 60,88 | 2.746 | 102,21 | ||||
| 2026-01-16 | 13F | Ronald Blue Trust, Inc. | 300 | 0,00 | 31 | 14,81 | ||||
| 2026-02-10 | 13F | Texas Yale Capital Corp. | 7.954 | 6,71 | 824 | 18,73 | ||||
| 2026-01-26 | 13F | Private Trust Co Na | 2.439 | 37,41 | 253 | 52,73 | ||||
| 2026-02-17 | 13F | J. Goldman & Co LP | Put | 15.000 | 1.554 | |||||
| 2026-01-15 | 13F | Columbus Macro, LLC | 5.460 | 0,00 | 566 | 11,22 | ||||
| 2026-02-17 | 13F | J. Goldman & Co LP | Call | 5.000 | 518 | |||||
| 2026-02-17 | 13F | J. Goldman & Co LP | 17.629 | -56,12 | 1.827 | -51,22 | ||||
| 2026-02-10 | 13F | Operose Advisors LLC | 809 | 58,01 | 84 | 76,60 | ||||
| 2026-02-13 | 13F | Hudson Bay Capital Management LP | 7.500 | 777 | ||||||
| 2026-02-13 | 13F | Mariner, LLC | 49.082 | 0,97 | 5.085 | 12,25 | ||||
| 2026-02-17 | 13F | Bank Of America Corp /de/ | Put | 0 | -100,00 | 0 | ||||
| 2026-01-21 | 13F | Kaizen Financial Strategies | 2.144 | 222 | ||||||
| 2026-01-23 | 13F | Sumitomo Mitsui Trust Holdings, Inc. | 7.000 | 0,00 | 725 | 11,20 | ||||
| 2026-02-03 | 13F | Insight 2811, Inc. | 6.222 | 0,00 | 645 | 11,23 | ||||
| 2026-02-06 | 13F/A | Rathbone Brothers plc | 1.975 | 205 | ||||||
| 2026-01-23 | 13F | Fifth Third Securities, Inc. | 26.696 | -18,85 | 2.766 | -9,79 | ||||
| 2026-02-12 | 13F | Schneider Downs Wealth Management Advisors, LP | 2.217 | 0,00 | 230 | 11,17 | ||||
| 2026-02-17 | 13F | Creative Planning | 8.544 | 20,61 | 885 | 34,09 | ||||
| 2026-02-13 | 13F | Neuberger Berman Group LLC | 4.706 | 488 | ||||||
| 2026-01-21 | 13F | Sowell Financial Services LLC | 22.574 | 2.339 | ||||||
| 2026-01-23 | 13F | Guidance Capital, Inc | 3.582 | 468 | ||||||
| 2026-02-05 | 13F | Bright Futures Wealth Management, LLC. | 12.875 | -0,43 | 1.334 | 10,71 | ||||
| 2026-02-17 | 13F | Per Stirling Capital Management, LLC. | 5.363 | 556 | ||||||
| 2026-02-17 | 13F | Capital Wealth Alliance, LLC | 18.412 | -0,67 | 2.310 | 33,76 | ||||
| 2026-02-13 | 13F | Integrity Financial Corp /WA | 18 | 0,00 | 2 | 0,00 | ||||
| 2026-02-17 | 13F | Capital Fund Management S.a. | Call | 66.900 | 205,48 | 6.932 | 239,75 | |||
| 2025-11-04 | 13F | ASB Consultores, LLC | 0 | -100,00 | 0 | |||||
| 2026-02-11 | 13F | Strategic Advocates LLC | 150 | 0,00 | 16 | 15,38 | ||||
| 2026-01-29 | 13F | IMC-Chicago, LLC | 12.231 | 1.267 | ||||||
| 2026-02-17 | 13F | Royal Bank Of Canada | 262.062 | -21,17 | 27.152 | -12,36 | ||||
| 2026-02-11 | 13F | O'shaughnessy Asset Management, Llc | 877 | 23,35 | 91 | 36,36 | ||||
| 2026-02-17 | 13F | Ancora Advisors, LLC | 1.132 | 2,44 | 117 | 14,71 | ||||
| 2026-02-13 | 13F | Searle & Co. | 0 | -100,00 | 0 | |||||
| 2026-01-26 | 13F | Merit Financial Group, LLC | 10.784 | 3,22 | 1.117 | 14,80 | ||||
| 2026-02-12 | 13F | Ardent Capital Management, Inc. | 2.195 | 0,00 | 227 | 11,27 | ||||
| 2026-02-10 | 13F | Founders Financial Securities Llc | 30.790 | 2,90 | 3.190 | 14,42 | ||||
| 2026-02-12 | 13F | Jane Street Group, Llc | Call | 303.700 | 32,04 | 31.466 | 46,81 | |||
| 2026-02-13 | 13F | Solstein Capital, LLC | 1.793 | 0,00 | 186 | 10,78 | ||||
| 2026-02-12 | 13F | Jane Street Group, Llc | Put | 1.160.600 | 70,93 | 120.250 | 90,04 | |||
| 2026-04-07 | 13F | Central Pacific Bank - Trust Division | 11 | 0,00 | 1 | 0,00 | ||||
| 2026-01-30 | 13F | Kiker Wealth Management, LLC | 0 | -100,00 | 0 | |||||
| 2026-04-10 | 13F | Lake Hills Wealth Management, LLC | 0 | -100,00 | 0 | |||||
| 2026-02-05 | 13F | Allworth Financial LP | 4.191 | 11,23 | 434 | 23,65 | ||||
| 2026-02-17 | 13F | Susquehanna International Group, Llp | Call | 837.600 | 65,14 | 86.784 | 83,61 | |||
| 2026-01-26 | 13F | Decker Retirement Planning Inc. | 90.053 | 88,45 | 9.330 | 109,52 | ||||
| 2026-02-13 | 13F | Mml Investors Services, Llc | 15.467 | -37,23 | 1.603 | -30,23 | ||||
| 2026-01-14 | 13F | Wealthcare Advisory Partners LLC | 0 | -100,00 | 0 | -100,00 | ||||
| 2026-02-17 | 13F | Susquehanna International Group, Llp | 146.151 | -14,25 | 15.143 | -4,67 | ||||
| 2025-11-14 | 13F | Hrt Financial Lp | 0 | -100,00 | 0 | |||||
| 2025-11-14 | 13F | Capstone Investment Advisors, Llc | Put | 1.054.700 | 182,31 | 98.287 | 291,38 | |||
| 2026-02-10 | 13F | Nelson Capital Management, LLC | 1.963 | 203 | ||||||
| 2026-02-17 | 13F | Susquehanna International Group, Llp | Put | 1.168.000 | 8,72 | 121.016 | 20,88 | |||
| 2026-01-26 | 13F | Main Street Group, LTD | 0 | -100,00 | 0 | -100,00 | ||||
| 2026-02-17 | 13F | Greenline Partners, LLC | 40.612 | -2,93 | 4.208 | 7,90 | ||||
| 2026-02-17 | 13F | Jones Financial Companies Lllp | 49 | -81,23 | 5 | -79,17 | ||||
| 2025-11-14 | 13F | Capstone Investment Advisors, Llc | Call | 1.054.700 | 182,31 | 98.287 | 291,38 | |||
| 2025-11-14 | 13F | Credit Agricole S A | 0 | -100,00 | 0 | |||||
| 2026-02-12 | 13F | Pettinga Financial Advisors, LLC | 9.369 | -27,20 | 971 | -19,10 | ||||
| 2026-02-17 | 13F | Balyasny Asset Management Llc | 38.800 | -29,20 | 4.020 | -21,27 | ||||
| 2026-02-13 | 13F | SRS Capital Advisors, Inc. | 15 | 2 | ||||||
| 2025-11-14 | 13F | Capstone Investment Advisors, Llc | 2.183 | -89,82 | 203 | -85,92 | ||||
| 2026-02-10 | 13F | Calton & Associates, Inc. | 17.558 | -2,12 | 1.819 | 8,86 | ||||
| 2026-02-12 | 13F | DRW Securities, LLC | 9.736 | -12,73 | 1.009 | -2,70 | ||||
| 2026-02-13 | 13F | Morgan Stanley | 2.465.518 | -2,66 | 255.452 | 8,23 | ||||
| 2026-02-13 | 13F | OpenArc Corporate Advisory, LLC | 7.692 | 797 | ||||||
| 2026-01-26 | 13F | AE Wealth Management LLC | 89.014 | 21,21 | 9.223 | 34,77 | ||||
| 2026-02-17 | 13F | Prelude Capital Management, Llc | 0 | -100,00 | 0 | |||||
| 2026-02-04 | 13F | Ground Swell Capital, LLC | 2.134 | 221 | ||||||
| 2026-02-05 | 13F | AlphaCore Capital LLC | 68 | -91,73 | 7 | -90,79 | ||||
| 2026-01-21 | 13F | Stone House Investment Management, LLC | 27 | 3 | ||||||
| 2026-02-12 | 13F | Amitell Capital Pte Ltd | 51.573 | 5.343 | ||||||
| 2026-01-29 | 13F | D.a. Davidson & Co. | 3.655 | 7,91 | 379 | 20,00 | ||||
| 2026-02-11 | 13F | Simplex Trading, Llc | 43.012 | 4.456 | ||||||
| 2026-04-08 | 13F | First Heartland Consultants, Inc. | 14.211 | 1.535 | ||||||
| 2026-02-05 | 13F | L & S Advisors Inc | 3.147 | 326 | ||||||
| 2026-03-13 | 13F | Lane Brothers & Co Inc | 19.815 | 2.053 | ||||||
| 2026-02-17 | 13F | Quadrature Capital Ltd | 25.114 | 50,53 | 2.602 | 67,44 | ||||
| 2025-11-12 | 13F | Huntington National Bank | 0 | -100,00 | 0 | |||||
| 2026-02-13 | 13F | Caxton Associates Llp | 0 | -100,00 | 0 | |||||
| 2025-11-12 | 13F | HAP Trading, LLC | Call | 30.100 | 502 | |||||
| 2026-02-05 | 13F | Pinnacle Associates Ltd | 22.597 | 1,80 | 2.341 | 13,20 | ||||
| 2025-11-13 | 13F | Renaissance Technologies Llc | 0 | -100,00 | 0 | |||||
| 2026-02-17 | 13F | Northern Trust Corp | 2.161 | 0,00 | 224 | 10,95 | ||||
| 2026-02-11 | 13F | TCTC Holdings, LLC | 7.695 | 0,00 | 797 | 11,16 | ||||
| 2026-01-29 | 13F | Sanctuary Advisors, LLC | 15.948 | 1.652 | ||||||
| 2026-02-17 | 13F | Integrated Advisors Network LLC | 0 | -100,00 | 0 | -100,00 | ||||
| 2026-02-13 | 13F | Marshall Wace, Llp | 0 | -100,00 | 0 | |||||
| 2026-02-12 | 13F | August Group Capital Ltd | 3.791 | 393 | ||||||
| 2026-02-05 | 13F | Western Wealth Management, LLC | 3.459 | 358 | ||||||
| 2026-01-30 | 13F | Us Bancorp \de\ | 1.360 | 10,48 | 141 | 22,81 | ||||
| 2026-02-17 | 13F | Private Advisor Group, LLC | 114.867 | 19,85 | 11.901 | 33,25 | ||||
| 2026-01-22 | 13F | Comprehensive Money Management Services LLC | 2.535 | 0,00 | 263 | 11,02 | ||||
| 2026-02-11 | 13F | Franklin Resources Inc | 201 | -26,91 | 21 | -20,00 | ||||
| 2026-01-30 | 13F | Citizens Financial Group Inc/ri | 13.432 | 0,12 | 1.392 | 11,28 | ||||
| 2026-02-06 | 13F | Keystone Financial Group | 2.003 | 208 | ||||||
| 2026-02-17 | 13F | Russell Investments Group, Ltd. | 66 | -8,33 | 7 | 0,00 | ||||
| 2026-02-10 | 13F | Lido Advisors, LLC | 8.124 | 26,82 | 807 | 35,23 | ||||
| 2026-02-12 | 13F | Menora Mivtachim Holdings Ltd. | 0 | -100,00 | 0 | |||||
| 2026-02-17 | 13F | Imprint Wealth LLC | 7 | -50,00 | 1 | -100,00 | ||||
| 2026-02-13 | 13F | Barclays Plc | 522.406 | -36,00 | 54.126 | -28,84 | ||||
| 2026-02-05 | 13F | Berman McAleer LLC | 4.796 | -28,95 | 497 | -21,14 | ||||
| 2026-02-09 | 13F | Fisher Asset Management, LLC | 27.055 | 0,04 | 2.803 | 11,23 | ||||
| 2026-01-27 | 13F | Regions Financial Corp | 3.605 | -3,53 | 374 | 7,18 | ||||
| 2025-10-31 | 13F | Chilton Capital Management Llc | 0 | -100,00 | 0 | |||||
| 2026-02-10 | 13F | Private Wealth Asset Management, LLC | 450 | 0,00 | 47 | 12,20 | ||||
| 2026-02-12 | 13F | JT Stratford LLC | 7.017 | 727 | ||||||
| 2026-02-12 | 13F | EHP Funds Inc. | 15.400 | -23,38 | 1.596 | -14,84 | ||||
| 2026-02-13 | 13F | Barclays Plc | Put | 741.200 | -33,51 | 76.796 | -26,08 | |||
| 2026-02-10 | 13F | Wormser Freres Gestion | 1.535 | -23,25 | 157 | -15,59 | ||||
| 2026-01-29 | 13F | St. Johns Investment Management Company, LLC | 323 | 0,00 | 33 | 10,00 | ||||
| 2026-02-17 | 13F | Advisory Services Network, LLC | 15.011 | 38,91 | 1.555 | 54,42 | ||||
| 2026-01-12 | 13F | Daymark Wealth Partners, Llc | 7.319 | 19,61 | 758 | 32,98 | ||||
| 2026-02-04 | 13F | Midwest Trust Co | 2.300 | 0,00 | 238 | 11,21 | ||||
| 2026-01-21 | 13F | Vanderbilt University | 973.559 | 0,12 | 100.870 | 11,31 | ||||
| 2026-01-30 | 13F | SOL Capital Management CO | 3.000 | 0,00 | 0 | |||||
| 2026-02-13 | 13F | Citigroup Inc | 504.017 | 3,73 | 52.221 | 15,33 | ||||
| 2026-02-13 | 13F | Citigroup Inc | Put | 380.000 | 39.372 | |||||
| 2026-04-08 | 13F | Dynamic Advisor Solutions LLC | 40.581 | -5,63 | 4.383 | -1,62 | ||||
| 2026-01-23 | 13F | E&G Advisors, LP | 11.726 | 8,66 | 1.215 | 20,80 | ||||
| 2026-02-13 | 13F | Barclays Plc | Call | 1.636.500 | 341,58 | 169.558 | 390,96 | |||
| 2026-02-12 | 13F | Philadelphia Trust Co | 3.416 | 0 | ||||||
| 2026-01-30 | 13F | Strategic Blueprint, LLC | 2.252 | -52,45 | 233 | -47,17 | ||||
| 2026-04-07 | 13F | Eastern Bank | 15 | 2 | ||||||
| 2026-02-17 | 13F | Millennium Management Llc | Call | 156.000 | 0,00 | 16.163 | 11,19 | |||
| 2026-01-27 | 13F | Retirement Income Solutions, Inc | 8.858 | -14,41 | 918 | -4,88 | ||||
| 2026-02-17 | 13F | Millennium Management Llc | Put | 603.000 | 2,20 | 62.477 | 13,63 | |||
| 2026-02-17 | 13F | Sig Brokerage, Lp | Call | 15.000 | 1.554 | |||||
| 2026-01-29 | 13F | Comerica Bank | 7.648 | -25,61 | 792 | -17,33 | ||||
| 2026-02-05 | 13F | ARS Investment Partners, LLC | 43.127 | -3,27 | 4.468 | 7,56 | ||||
| 2026-02-17 | 13F | Raymond James Financial Inc | 406.953 | 10,02 | 42.164 | 22,32 | ||||
| 2025-11-14 | 13F | Squarepoint Ops LLC | 0 | -100,00 | 0 | -100,00 | ||||
| 2026-04-07 | 13F | SMI Advisory Services, LLC | 180.486 | 62,30 | 19.893 | 48,46 | ||||
| 2026-02-17 | 13F | Sig Brokerage, Lp | Put | 10.500 | 1.088 | |||||
| 2026-02-11 | 13F | Cerity Partners LLC | 5.321 | 50,27 | 551 | 66,97 | ||||
| 2026-01-05 | 13F | Roxbury Financial LLC | 144 | 0,00 | 15 | 7,69 | ||||
| 2026-01-30 | 13F | Pekin Hardy Strauss, Inc. | 28.463 | 7,96 | 2.949 | 20,07 | ||||
| 2026-01-27 | 13F | Silver Coast Investments LLC | 32.826 | -13,48 | 3.401 | -3,79 | ||||
| 2026-02-06 | 13F | Larson Financial Group LLC | 313 | 0,00 | 32 | 10,34 | ||||
| 2026-01-15 | 13F | Royal Fund Management, LLC | 27.753 | 7.320,59 | 1.654 | 12.623,08 | ||||
| 2026-02-11 | 13F | Deutsche Bank Ag\ | 288 | 0,00 | 30 | 11,54 | ||||
| 2026-02-06 | 13F | HighTower Advisors, LLC | 285.852 | -11,59 | 29.617 | -1,71 | ||||
| 2026-02-17 | 13F | Fmr Llc | 5.230 | 61,42 | 542 | 79,73 | ||||
| 2026-02-18 | 13F | First Citizens Bank & Trust Co | 2.078 | 215 | ||||||
| 2026-02-09 | 13F | Wellington Shields Capital Management, LLC | 59.341 | 27,01 | 6.148 | 41,24 | ||||
| 2026-02-10 | 13F | Crescent Grove Advisors, LLC | 2.070 | 214 | ||||||
| 2026-02-12 | 13F | Marex Group plc | 9.588 | 68,00 | 993 | 87,01 | ||||
| 2026-02-17 | 13F | Cresset Asset Management, LLC | 62.857 | -35,81 | 6.513 | -28,64 | ||||
| 2026-02-10 | 13F | Envestnet Asset Management Inc | 31.663 | -81,59 | 3.281 | -79,53 | ||||
| 2026-01-21 | 13F | Walkner Condon Financial Advisors LLC | 4.109 | 0,54 | 426 | 11,84 | ||||
| 2026-01-26 | 13F | JGP Global Gestao de Recursos Ltda. | 9.800 | 1.015 | ||||||
| 2026-02-12 | 13F | Tripletail Wealth Management, LLC | 200 | 0,00 | 21 | 0,00 | ||||
| 2026-02-17 | 13F | Millennium Management Llc | 29.395 | -76,32 | 3.046 | -73,67 | ||||
| 2026-02-10 | 13F | Root Financial Partners, LLC | 0 | -100,00 | 0 | |||||
| 2026-02-17 | 13F | Strive Financial Group ,LLC | 378 | 39 | ||||||
| 2026-01-21 | 13F | Heritage Oak Wealth Advisors Llc | 32.310 | -0,29 | 3.348 | 10,86 | ||||
| 2026-02-13 | 13F | Venture Visionary Partners LLC | 5.676 | -0,02 | 588 | 11,15 | ||||
| 2026-02-06 | 13F | Pnc Financial Services Group, Inc. | 79.994 | 7,30 | 8.288 | 19,30 | ||||
| 2026-02-10 | 13F | Essex Financial Services, Inc. | 2.477 | 257 | ||||||
| 2026-02-17 | 13F | Atom Investors LP | 0 | -100,00 | 0 | |||||
| 2026-02-06 | 13F | Forefront Wealth Partners, LLC | 2.582 | 3,36 | 268 | 15,09 | ||||
| 2026-02-09 | 13F | Integrity Alliance, Llc. | 5.693 | 590 | ||||||
| 2026-02-13 | 13F | Centaurus Financial, Inc. | 1.599 | 1,07 | 0 | |||||
| 2026-02-03 | 13F | Harel Insurance Investments & Financial Services Ltd. | 921.500 | 0,00 | 95 | 11,76 | ||||
| 2026-04-08 | 13F | Clarus Wealth Advisors | 22.760 | 1,25 | 2.499 | -7,17 | ||||
| 2026-02-10 | 13F | Meitav Dash Investments Ltd | 839.104 | 9.641,17 | 86.940 | 10.740,27 | ||||
| 2026-01-12 | 13F | Salem Investment Counselors Inc | 0 | -100,00 | 0 | |||||
| 2026-02-13 | 13F | Colony Group, LLC | 63.845 | 543,60 | 6.615 | 615,80 | ||||
| 2026-02-12 | 13F | Bank Of Montreal /can/ | Put | 100.000 | 0,00 | 10.361 | 11,18 | |||
| 2026-02-12 | 13F | Bank Of Montreal /can/ | 103.385 | 2,82 | 10.712 | 14,31 | ||||
| 2025-11-13 | 13F | BancorpSouth Bank | 0 | -100,00 | 0 | |||||
| 2026-02-12 | 13F | Fox Hill Wealth Management | 10.067 | -0,22 | 1.043 | 10,96 | ||||
| 2026-02-17 | 13F | Modern Wealth Management, LLC | 9.276 | -3,28 | 961 | 7,61 | ||||
| 2026-02-04 | 13F | Pensionmark Financial Group, Llc | 4.089 | 15,12 | 424 | 27,79 | ||||
| 2026-02-10 | 13F | Amica Mutual Insurance Co | 3.441 | -46,98 | 0 | |||||
| 2026-04-01 | 13F | Bangor Savings Bank | 100 | 0,00 | 11 | 0,00 | ||||
| 2026-04-07 | 13F | CoreCap Advisors, LLC | 2.106 | 120,75 | 227 | 131,63 | ||||
| 2026-02-17 | 13F | Hilltop Holdings Inc. | 29.498 | 10,15 | 3.056 | 22,48 | ||||
| 2026-04-08 | 13F | Moulton Wealth Management, Inc | 0 | -100,00 | 0 | |||||
| 2026-02-04 | 13F | Meridian Wealth Management, LLC | 27.501 | -4,27 | 2.849 | 6,43 | ||||
| 2026-02-11 | 13F | Twin Tree Management, LP | 4.531 | -75,72 | 469 | -73,01 | ||||
| 2026-02-03 | 13F | Credit Industriel Et Commercial | 29 | -95,79 | 3 | -95,31 | ||||
| 2026-02-03 | 13F | Credit Industriel Et Commercial | Put | 60.000 | 0,00 | 6.217 | 11,18 | |||
| 2026-02-17 | 13F | Equitable Holdings, Inc. | 7.457 | 23,46 | 773 | 37,37 | ||||
| 2026-02-18 | 13F | Beacon Pointe Advisors, LLC | 58.993 | 83,59 | 6.112 | 104,14 | ||||
| 2026-02-09 | 13F | Harbour Investments, Inc. | 23.122 | 2,49 | 2.396 | 13,94 | ||||
| 2026-02-19 | 13F | Atomi Financial Group, Inc. | 10.572 | -9,14 | 1.095 | 1,01 | ||||
| 2026-01-29 | 13F | Comprehensive Financial Consultants Institutional, Inc. | 7.244 | -1,46 | 751 | 9,49 | ||||
| 2026-02-11 | 13F | Janney Montgomery Scott LLC | 12.843 | -11,88 | 1 | 0,00 | ||||
| 2025-11-14 | 13F | Pinnacle Family Advisors, LLC | 0 | -100,00 | 0 | -100,00 | ||||
| 2026-02-12 | 13F | Brown Brothers Harriman & Co | 1.251 | 0,00 | 130 | 11,21 | ||||
| 2026-02-02 | 13F | Allegheny Financial Group LTD | 2.000 | 207 | ||||||
| 2026-02-13 | 13F | Healthcare Of Ontario Pension Plan Trust Fund | 200.000 | 20.722 | ||||||
| 2026-02-18 | 13F | Caitlin John, LLC | 403 | 291,26 | 42 | 355,56 | ||||
| 2026-02-13 | 13F | Parkside Financial Bank & Trust | 1.945 | 0,10 | 202 | 11,05 | ||||
| 2026-02-17 | 13F | Scopus Asset Management, L.p. | Put | 300.000 | -62,50 | 31.083 | -58,31 | |||
| 2026-02-17 | 13F | Two Sigma Securities, Llc | 3.574 | 370 | ||||||
| 2026-01-21 | 13F | Newbridge Financial Services Group, Inc. | 800 | -92,56 | 83 | -91,81 | ||||
| 2026-02-17 | 13F | Jump Financial, LLC | 105.950 | 10.977 | ||||||
| 2026-02-12 | 13F | Principal Securities, Inc. | 0 | -100,00 | 0 | -100,00 | ||||
| 2026-02-03 | 13F | Bokf, Na | 1.427 | 0,00 | 148 | 11,36 | ||||
| 2026-04-07 | 13F | Park Avenue Securities Llc | 30.329 | 3 | ||||||
| 2026-02-13 | 13F | Aptus Capital Advisors, LLC | 30 | 0,00 | 3 | 50,00 | ||||
| 2026-01-26 | 13F | Reyes Financial Architecture, Inc. | 540 | -49,63 | 56 | -44,44 | ||||
| 2026-01-21 | 13F | Sound Income Strategies, LLC | 2.262 | 70,59 | 281 | 107,41 | ||||
| 2026-01-14 | 13F | WESPAC Advisors, LLC | 5.486 | -39,53 | 568 | -32,78 | ||||
| 2026-01-22 | 13F | BOCHK Asset Management Ltd | 200 | -66,67 | 21 | -63,64 | ||||
| 2026-02-13 | 13F | McAdam, LLC | 4.225 | 7,86 | 438 | 19,73 | ||||
| 2026-02-03 | 13F | We Are One Seven, LLC | 3.315 | -47,90 | 343 | -42,06 | ||||
| 2026-02-04 | 13F | Fortem Financial Group, Llc | 107.272 | 0,30 | 11.114 | 11,52 | ||||
| 2026-02-12 | 13F | Steward Partners Investment Advisory, Llc | 5.296 | 140,62 | 549 | 167,32 | ||||
| 2026-02-12 | 13F | Wealthspire Advisors, LLC | 0 | -100,00 | 0 | |||||
| 2026-04-08 | 13F | Wealth Enhancement Advisory Services, Llc | 6.162 | 107,75 | 683 | 100,00 | ||||
| 2026-01-13 | 13F | Parsons Capital Management Inc/ri | 3.168 | 9,24 | 328 | 21,48 | ||||
| 2026-02-06 | 13F | Creative Financial Designs Inc /adv | 4.204 | -87,27 | 436 | -85,87 | ||||
| 2026-02-13 | 13F | Macquarie Group Ltd | 0 | -100,00 | 0 | |||||
| 2026-01-23 | 13F | Legend Financial Advisors, Inc. | 92.318 | -14,52 | 9.565 | -4,95 | ||||
| 2026-02-13 | 13F | Marshall Wace, Llp | Call | 3.200 | 332 | |||||
| 2026-02-13 | 13F | Squarepoint Ops LLC | Call | 350.100 | 36.274 | |||||
| 2026-02-13 | 13F | Marshall Wace, Llp | Put | 5.300 | 549 | |||||
| 2026-02-13 | 13F | Squarepoint Ops LLC | Put | 386.200 | 40.014 | |||||
| 2026-02-17 | 13F | Black Maple Capital Management LP | 10.500 | 0,00 | 1.088 | 11,15 | ||||
| 2026-02-19 | 13F | Claris Financial LLC | 2.560 | 265 | ||||||
| 2026-01-27 | 13F | PFG Advisors | 25.930 | -15,13 | 2.687 | -5,66 | ||||
| 2026-02-10 | 13F | Baker Avenue Asset Management, LP | 29.931 | 3.101 | ||||||
| 2026-01-20 | 13F | FLP Wealth Management, LLC | 1.658 | -49,57 | 322 | 5,23 | ||||
| 2026-02-13 | 13F | Allianz Se | 85.770 | 1,78 | 8.887 | 13,15 | ||||
| 2026-01-20 | 13F | Stratos Wealth Advisors, LLC | 4.063 | 1,30 | 421 | 12,60 | ||||
| 2026-04-07 | 13F | Farther Finance Advisors, LLC | 20.955 | 164,52 | 2.303 | 180,85 | ||||
| 2026-02-13 | 13F | Potomac Fund Management Inc /adv | 131.633 | -0,37 | 13.638 | 10,77 | ||||
| 2026-01-23 | 13F | Optima Capital Llc | 6.627 | 687 | ||||||
| 2026-02-10 | 13F | Daiwa Securities Group Inc. | 13.580 | -13,94 | 1 | 0,00 | ||||
| 2026-02-13 | 13F | Wexford Capital Lp | 0 | -100,00 | 0 | |||||
| 2026-02-11 | 13F | Arizona PSPRS Trust | 8.100 | 839 | ||||||
| 2025-11-14 | 13F | Eqis Capital Management, Inc. | 0 | -100,00 | 0 | -100,00 | ||||
| 2026-02-04 | 13F | Oxbow Advisors, LLC | 4.075 | 0,00 | 422 | 11,35 | ||||
| 2026-01-20 | 13F | Independence Bank of Kentucky | 545 | 0,00 | 56 | 12,00 | ||||
| 2026-01-30 | 13F | Jennison Associates Llc | 82.708 | -0,94 | 8.569 | 10,14 | ||||
| 2025-11-12 | 13F | Headlands Technologies LLC | 0 | -100,00 | 0 | |||||
| 2026-02-17 | 13F | LaSalle St. Investment Advisors, LLC | 10.608 | 3,19 | 1 | |||||
| 2026-02-27 | 13F | Strategic Investment Solutions, Inc. /IL | 1.120 | 117,48 | 116 | 141,67 | ||||
| 2026-01-14 | 13F | Spire Wealth Management | 500 | 0,00 | 52 | 10,87 | ||||
| 2026-01-15 | 13F | Jaffetilchin Investment Partners, LLC | 53.178 | -0,03 | 5.510 | 11,14 | ||||
| 2026-02-10 | 13F | David R. Rahn & Associates Inc. | 2.607 | 270 | ||||||
| 2026-02-10 | 13F | Evolution Wealth Management Inc. | 296 | 72,09 | 31 | 87,50 | ||||
| 2025-10-31 | 13F | Y-Intercept (Hong Kong) Ltd | 0 | -100,00 | 0 | |||||
| 2026-02-02 | 13F | JDM Financial Group LLC | 66 | 0,00 | 7 | 0,00 | ||||
| 2026-02-12 | 13F | RPg Family Wealth Advisory, LLC | 21.521 | 63,72 | 2.230 | 82,11 | ||||
| 2026-02-17 | 13F | Wiley Bros.-aintree Capital, Llc | 5.763 | 597 | ||||||
| 2026-02-13 | 13F | Arkadios Wealth Advisors | 2.281 | -14,92 | 236 | -5,22 | ||||
| 2026-02-17 | 13F | MGB Wealth Management, LLC | 9.194 | 5,78 | 953 | 17,53 | ||||
| 2026-02-13 | 13F | Walleye Capital LLC | 1.919 | 13,95 | 199 | 26,92 | ||||
| 2026-04-10 | 13F | Armstrong Advisory Group, Inc | 1.125 | 0,00 | 122 | 4,31 | ||||
| 2026-02-10 | 13F/A | Northwestern Mutual Wealth Management Co | 30.963 | 10,59 | 3.208 | 22,96 | ||||
| 2026-02-17 | 13F | Woodline Partners LP | 49.783 | 5.158 | ||||||
| 2026-02-12 | 13F | BlackRock, Inc. | 19.356 | 2.005 | ||||||
| 2026-02-12 | 13F | Founders Financial Alliance, LLC | 24 | 0,00 | 2 | 0,00 | ||||
| 2026-02-13 | 13F | Evernest Financial Advisors, LLC | 3.408 | 0,00 | 428 | 34,70 | ||||
| 2026-02-12 | 13F | BRYN MAWR TRUST Co | 180 | -24,37 | 19 | -18,18 | ||||
| 2026-02-13 | 13F | Walleye Capital LLC | Put | 1.200 | 0,00 | 124 | 11,71 | |||
| 2026-02-17 | 13F | Clark Capital Management Group, Inc. | 0 | -100,00 | 0 | |||||
| 2026-01-27 | 13F | Evergreen Capital Management Llc | 2.779 | 288 | ||||||
| 2026-01-09 | 13F | 180 Wealth Advisors, Llc | 38.875 | 4,07 | 4.028 | 15,72 | ||||
| 2026-02-17 | 13F | Parallax Volatility Advisers, L.P. | 1 | 0,00 | 0 | |||||
| 2026-02-17 | 13F | Cetera Investment Advisers | 105.643 | -0,53 | 10.946 | 10,59 | ||||
| 2026-02-10 | 13F | Quantbot Technologies LP | 6.000 | 622 | ||||||
| 2026-02-10 | 13F | SCS Capital Management LLC | 307.647 | -30,06 | 31.875 | -22,24 | ||||
| 2026-02-03 | 13F | Emerald Investment Partners, Llc | 90 | 0,00 | 9 | 12,50 | ||||
| 2025-11-13 | 13F | HITE Hedge Asset Management LLC | 0 | -100,00 | 0 | |||||
| 2026-02-11 | 13F | LPL Financial LLC | 608.679 | 6,47 | 63.065 | 18,38 | ||||
| 2026-01-30 | 13F | Citizens National Bank Trust Department | 500 | 0,00 | 52 | 10,87 | ||||
| 2026-01-26 | 13F | Cwm, Llc | 189.856 | 976,95 | 20 | 1.800,00 | ||||
| 2026-02-04 | 13F | West Tower Group, LLC | 2.600 | 269 | ||||||
| 2026-02-17 | 13F | Parallax Volatility Advisers, L.P. | Put | 134.000 | 13.884 | |||||
| 2026-01-20 | 13F | Global Trust Asset Management, LLC | 150 | -76,92 | 16 | -75,00 | ||||
| 2026-02-17 | 13F | Parallax Volatility Advisers, L.P. | Call | 161.800 | 66,46 | 16.764 | 85,07 | |||
| 2026-02-23 | 13F | Vinland Capital Management Gestora de Recursos LTDA. | 6.300 | 653 | ||||||
| 2026-02-11 | 13F | J.w. Cole Advisors, Inc. | 3.036 | 20,67 | 233 | -0,43 | ||||
| 2026-01-30 | 13F | Laurel Wealth Advisors LLC | 50 | 5 | ||||||
| 2026-02-17 | 13F | Ameriprise Financial Inc | 124.137 | -0,85 | 12.855 | 10,20 | ||||
| 2026-01-21 | 13F | Prime Capital Investment Advisors, LLC | 2.173 | 225 | ||||||
| 2026-02-11 | 13F | Vermillion Wealth Management, Inc. | 11.595 | -3,58 | 1.201 | 7,23 | ||||
| 2026-02-17 | 13F | Schonfeld Strategic Advisors LLC | 10.301 | 215,11 | 1.067 | 250,99 | ||||
| 2026-02-17 | 13F | Schonfeld Strategic Advisors LLC | Call | 1.400 | 145 | |||||
| 2026-02-18 | 13F | GWM Advisors LLC | 5.879 | 5,40 | 609 | 17,34 | ||||
| 2026-02-17 | 13F | Advisor Group Holdings, Inc. | 120.415 | -6,77 | 12.477 | 6,95 | ||||
| 2026-02-17 | 13F | Rpo Llc | Put | 233.000 | -1,27 | 24.141 | 9,77 | |||
| 2026-02-17 | 13F | Rpo Llc | Call | 12.000 | -82,86 | 1.243 | -80,94 | |||
| 2026-02-20 | 13F | Sunbelt Securities, Inc. | 598 | 0,00 | 62 | 10,91 | ||||
| 2026-01-23 | 13F | Diversify Advisory Services, LLC | 6.381 | 792 | ||||||
| 2026-02-12 | 13F | Stamos Capital Partners, L.p. | 11.880 | 5,14 | 1.231 | 16,92 | ||||
| 2026-01-27 | 13F | Zurcher Kantonalbank (Zurich Cantonalbank) | 774 | 81 | ||||||
| 2026-02-13 | 13F | Alerus Financial Na | 240 | 0,00 | 25 | 9,09 | ||||
| 2026-02-11 | 13F | Jpmorgan Chase & Co | 37.828 | -88,82 | 3.919 | -87,57 | ||||
| 2026-02-13 | 13F | Stifel Financial Corp | 39.544 | 56,49 | 4.097 | 74,04 | ||||
| 2026-02-17 | 13F | BTG Pactual Asset Management US LLC | 0 | -100,00 | 0 | |||||
| 2026-02-18 | 13F | EP Wealth Advisors, Inc. | 5.832 | 27,59 | 604 | 96,74 | ||||
| 2026-01-20 | 13F | Ntv Asset Management Llc | 2.100 | 218 | ||||||
| 2026-01-26 | 13F | Whittier Trust Co Of Nevada Inc | 135 | 0,00 | 16 | 15,38 | ||||
| 2026-02-17 | 13F | Condire Management, LP | 122.451 | 2.904,20 | 12.687 | 3.247,49 | ||||
| 2026-01-07 | 13F | IAM Advisory, LLC | 0 | -100,00 | 0 | |||||
| 2026-01-20 | 13F | Toth Financial Advisory Corp | 15 | 2 | ||||||
| 2026-01-07 | 13F | Baldwin Brothers Inc/ma | 2.950 | 0,00 | 306 | 11,31 | ||||
| 2026-02-13 | 13F | Capital Square, LLC | 4.496 | -3,10 | 466 | 7,64 | ||||
| 2026-04-09 | 13F | Herbst Group, Llc | 40.502 | -33,82 | 4.375 | -31,02 | ||||
| 2026-02-13 | 13F | Level Four Advisory Services, Llc | 2.335 | 242 | ||||||
| 2026-01-20 | 13F | Quintet Private Bank (Europe) S.A. | 750 | 78 | ||||||
| 2026-02-17 | 13F | Risk Paradigm Group, LLC | 20.561 | -58,30 | 2.130 | 64,99 | ||||
| 2026-04-08 | 13F | Fermata Advisors, LLC | 8.534 | 3,01 | 922 | 7,34 | ||||
| 2026-01-12 | 13F | Auour Investments LLC | 2.022 | -30,35 | 209 | -22,59 | ||||
| 2026-02-13 | 13F | National Bank Of Canada /fi/ | 5.603 | -1,55 | 580 | 9,66 | ||||
| 2026-04-08 | 13F | FOCUS Wealth Advisors, LLC | 70.975 | -5,37 | 7.666 | -1,36 | ||||
| 2025-10-29 | 13F | Mizuho Markets Americas Llc | 0 | -100,00 | 0 | |||||
| 2026-01-29 | 13F | UBS Group AG | Put | 1.713.300 | 2.102,19 | 177.515 | 2.348,48 | |||
| 2026-01-29 | 13F | UBS Group AG | Call | 1.585.800 | 158,44 | 164.305 | 187,34 | |||
| 2026-01-29 | 13F | UBS Group AG | 1.496.807 | 386,42 | 155.084 | 440,81 | ||||
| 2026-02-09 | 13F | Marshall Investment Management, Llc | 6.695 | 694 | ||||||
| 2026-02-17 | 13F | Qube Research & Technologies Ltd | 24.100 | 2.497 | ||||||
| 2026-01-23 | 13F | Private Wealth Management Group, LLC | 640 | 0,00 | 66 | 11,86 | ||||
| 2026-01-29 | 13F | Almanack Investment Partners, LLC. | 0 | -100,00 | 0 | -100,00 | ||||
| 2026-02-10 | 13F | Nomura Asset Management Co Ltd | 2.700 | -86,55 | 280 | -85,08 | ||||
| 2026-02-09 | 13F | Leavell Investment Management, Inc. | 2.172 | 0,00 | 225 | 11,39 | ||||
| 2026-02-11 | 13F | Commonwealth Retirement Investments LLC | 96 | 10 | ||||||
| 2026-04-07 | 13F | Financially Speaking Inc | 1 | -99,99 | 0 | -100,00 | ||||
| 2026-02-13 | 13F | Integrated Wealth Concepts LLC | 2.020 | -78,53 | 209 | -76,14 | ||||
| 2026-02-03 | 13F | Legacy Wealth Managment, LLC/ID | 479 | 91,60 | 50 | 113,04 | ||||
| 2026-02-13 | 13F | Baird Financial Group, Inc. | 2.390 | -86,62 | 248 | -85,17 | ||||
| 2026-02-03 | 13F | AnglePoint Asset Management Ltd | 19.600 | 2.031 | ||||||
| 2026-02-09 | 13F | Capital Management Associates /ny/ | 8.000 | 829 | ||||||
| 2026-02-13 | 13F | Bank Of Nova Scotia | 1.035.072 | 412,28 | 107.244 | 469,56 | ||||
| 2026-02-12 | 13F | Triumph Capital Management | 3.712 | -5,21 | 385 | 5,49 | ||||
| 2026-02-13 | 13F | Wells Fargo & Company/mn | 770.551 | -4,43 | 79.837 | 6,26 | ||||
| 2026-04-08 | 13F | BOS Asset Management, LLC | 15.850 | -2,23 | 1.712 | 1,91 | ||||
| 2026-02-17 | 13F | Signature Equity Partners, LLC | 38 | 4 | ||||||
| 2026-02-17 | 13F | Ibex Wealth Advisors | 0 | -100,00 | 0 | |||||
| 2026-02-10 | 13F | Ted Buchan & Co | 75.960 | 4,29 | 7.870 | 15,96 | ||||
| 2026-02-14 | 13F | Rockefeller Capital Management L.P. | 26.057 | 127,06 | 2.700 | 152,48 | ||||
| 2026-02-17 | 13F | Bank Of America Corp /de/ | Call | 0 | -100,00 | 0 | ||||
| 2026-02-13 | 13F | Resources Investment Advisors, LLC. | 0 | -100,00 | 0 | |||||
| 2026-02-09 | 13F | Choate Investment Advisors | 2.646 | 0,00 | 274 | 11,38 | ||||
| 2026-02-03 | 13F | Strengthening Families & Communities, LLC | 100 | 10 | ||||||
| 2026-02-09 | 13F | Kingsview Wealth Management, LLC | 70.785 | -11,65 | 7.334 | -1,77 | ||||
| 2026-02-12 | 13F | Federation des caisses Desjardins du Quebec | 1.440 | 0,00 | 149 | 11,19 | ||||
| 2026-01-30 | 13F | Yong Rong (HK) Asset Management Ltd | 30.000 | 3 | ||||||
| 2026-02-13 | 13F | Wells Fargo & Company/mn | Put | 80.200 | -38,31 | 8.310 | -31,41 | |||
| 2026-02-17 | 13F | DV Trading LLC | 500 | 52 | ||||||
| 2026-04-08 | 13F | Arlington Trust Co LLC | 20 | 2 | ||||||
| 2026-02-13 | 13F | Volterra Technologies LP | Put | 224.300 | -2,35 | 23.240 | 8,57 | |||
| 2026-02-13 | 13F | Schroder Investment Management Group | 156.000 | 16.338 | ||||||
| 2026-02-17 | 13F | IHT Wealth Management, LLC | 20.756 | -7,58 | 2.150 | 2,77 | ||||
| 2026-01-28 | 13F | Geneos Wealth Management Inc. | 287 | 30 | ||||||
| 2025-11-12 | 13F | Transce3nd, LLC | 0 | -100,00 | 0 | -100,00 | ||||
| 2026-02-13 | 13F | Gts Securities Llc | 25.408 | 2.633 | ||||||
| 2026-01-27 | 13F | Magnolia Capital Management Ltd | 4.065 | 0,00 | 0 | |||||
| 2025-11-14 | 13F | Two Sigma Investments, Lp | 0 | -100,00 | 0 | -100,00 | ||||
| 2026-02-17 | 13F | Aqr Capital Management Llc | 4.816 | 499 | ||||||
| 2026-02-02 | 13F | Advisors Preferred, LLC | 148 | 16 | ||||||
| 2026-02-06 | 13F | Private Wealth Advisors, LLC | 38.678 | -25,54 | 4.007 | -17,21 | ||||
| 2026-02-12 | 13F | Commonwealth Equity Services, Llc | 79.640 | 55,74 | 8.251 | 206.175,00 | ||||
| 2026-02-17 | 13F | Polymer Capital Management (US) LLC | Call | 0 | -100,00 | 0 | ||||
| 2026-02-13 | 13F | Flow Traders U.s. Llc | 9.205 | -56,55 | 1 | -100,00 | ||||
| 2026-02-13 | 13F | Ausdal Financial Partners, Inc. | 9.529 | 16,68 | 987 | 29,70 | ||||
| 2026-01-23 | 13F | Assetmark, Inc | 572 | 0,00 | 59 | 11,32 | ||||
| 2026-02-12 | 13F | Scotia Capital Inc. | 40.272 | 7,87 | 4.173 | 19,92 | ||||
| 2026-01-29 | 13F | Riggs Asset Managment Co. Inc. | 4.234 | 2,27 | 439 | 13,77 | ||||
| 2026-01-15 | 13F | Lodestone Wealth Management LLC | 242 | 25 | ||||||
| 2026-02-17 | 13F | Mercer Global Advisors Inc /adv | 1.970 | 204 | ||||||
| 2026-02-17 | 13F | Tudor Investment Corp Et Al | 74.913 | 7.762 | ||||||
| 2026-02-17 | 13F | Tudor Investment Corp Et Al | Call | 150.000 | 15.542 | |||||
| 2025-11-14 | 13F | Wolverine Trading, Llc | Put | 0 | -100,00 | 0 | ||||
| 2025-11-14 | 13F | Wolverine Trading, Llc | Call | 0 | -100,00 | 0 | ||||
| 2026-01-21 | 13F | Y.D. More Investments Ltd | 11.000 | 0,00 | 1.140 | 11,12 | ||||
| 2026-02-13 | 13F | Okabena Investment Services Inc | 65.387 | 0,00 | 6.775 | 11,18 | ||||
| 2026-01-28 | 13F | EPG Wealth Management LLC | 0 | -100,00 | 0 | |||||
| 2026-02-13 | 13F | Wells Fargo & Company/mn | Call | 0 | -100,00 | 0 | -100,00 | |||
| 2025-11-14 | 13F | Wolverine Trading, Llc | 0 | -100,00 | 0 | |||||
| 2026-02-06 | 13F | Evoke Wealth, Llc | 61.031 | 5,82 | 6.323 | 17,64 | ||||
| 2026-02-03 | 13F | Orion Capital Management LLC | 28 | -64,10 | 3 | -71,43 | ||||
| 2026-02-06 | 13F | Keudell/Morrison Wealth Management | 2.795 | 290 | ||||||
| 2026-02-17 | 13F | Captrust Financial Advisors | 29.648 | 98,58 | 3.072 | 120,78 | ||||
| 2026-02-13 | 13F | Volterra Technologies LP | Call | 227.100 | 11,49 | 23.530 | 23,95 | |||
| 2026-02-17 | 13F | XTX Topco Ltd | 5.763 | 597 | ||||||
| 2025-11-07 | 13F | Amica Retiree Medical Trust | 646 | 0,00 | 0 | |||||
| 2026-01-14 | 13F | ORG Partners LLC | 1.199 | 88,23 | 124 | 110,17 | ||||
| 2026-02-02 | 13F | CENTRAL TRUST Co | 4.149 | -18,85 | 430 | -9,87 | ||||
| 2026-02-06 | 13F | Kingdom Financial Group LLC. | 0 | 0 | ||||||
| 2026-02-13 | 13F | Ingalls & Snyder Llc | 2.000 | 0 | ||||||
| 2026-04-06 | 13F | CX Institutional | 625 | -15,99 | 0 | |||||
| 2026-01-20 | 13F | Steel Peak Wealth Management LLC | 22.856 | 2.368 | ||||||
| 2026-02-17 | 13F | Man Group plc | 0 | -100,00 | 0 | -100,00 | ||||
| 2026-02-13 | 13F | K2 Principal Fund, L.p. | Put | 20.000 | 2.072 | |||||
| 2026-02-13 | 13F | Maven Securities LTD | 29.246 | -42,48 | 3.033 | -36,01 | ||||
| 2026-02-12 | 13F | Barometer Capital Management Inc. | 0 | -100,00 | 0 | -100,00 | ||||
| 2026-02-10 | 13F | Main Management LLC | 2.000 | 0,00 | 0 | |||||
| 2026-01-27 | 13F | Friedenthal Financial | 1.495 | -12,21 | 155 | -2,53 | ||||
| 2026-02-17 | 13F | GeoWealth Management, LLC | 7.283 | -50,43 | 755 | -44,92 | ||||
| 2025-11-10 | 13F | Everstar Asset Management, LLC | 0 | -100,00 | 0 | |||||
| 2026-02-10 | 13F | Bank of New York Mellon Corp | 13.669 | 1.416 | ||||||
| 2026-02-05 | 13F | Cambridge Investment Research Advisors, Inc. | 51.150 | -7,83 | 5 | 0,00 | ||||
| 2026-02-17 | 13F | Yaupon Capital Management LP | Put | 200.000 | 20.722 | |||||
| 2025-11-12 | 13F | Park Square Financial Group, LLC | 0 | -100,00 | 0 | -100,00 | ||||
| 2026-02-09 | 13F | Prospera Financial Services Inc | 3.016 | 313 | ||||||
| 2026-02-13 | 13F | Verition Fund Management LLC | 20.000 | 2.072 | ||||||
| 2026-02-02 | 13F | Horizon Investments, LLC | 29 | 61,11 | 3 | 200,00 | ||||
| 2026-02-17 | 13F | Jain Global LLC | 0 | -100,00 | 0 | |||||
| 2026-02-17 | 13F | Chicago Wealth Management, Inc. | 25.739 | 2.667 | ||||||
| 2026-01-27 | 13F | TD Waterhouse Canada Inc. | 22.640 | 6,09 | 2.342 | 15,43 | ||||
| 2026-02-17 | 13F | Bank Of America Corp /de/ | 1.881.869 | 0,65 | 194.980 | 11,90 | ||||
| 2025-11-14 | 13F | Strategic Wealth Partners, Ltd. | 100 | 0,00 | 9 | 50,00 | ||||
| 2026-02-12 | 13F | Providence Capital Advisors, LLC | 0 | -100,00 | 0 | |||||
| 2026-02-17 | 13F | Elliott Investment Management L.P. | Put | 900.000 | -35,71 | 93.249 | -28,53 | |||
| 2026-03-19 | 13F | Painted Porch Advisors LLC | 0 | -100,00 | 0 | |||||
| 2026-01-07 | 13F | Harbor Investment Advisory, Llc | 60 | 0,00 | 6 | 20,00 | ||||
| 2026-02-17 | 13F | SIH Partners, LLLP | 0 | -100,00 | 0 | |||||
| 2026-02-17 | 13F | Snowden Capital Advisors LLC | 19.379 | 4,03 | 2.008 | 15,68 | ||||
| 2026-02-17 | 13F | Graham Capital Management, L.P. | 0 | -100,00 | 0 | |||||
| 2026-02-13 | 13F | Quarry LP | 19.431 | -39,79 | 2.013 | -33,06 | ||||
| 2026-03-12 | 13F/A | Peak6 Llc | Put | 46.400 | 439,53 | 4.808 | 500,12 | |||
| 2026-01-09 | 13F | SG Americas Securities, LLC | 90.825 | 88,08 | 9 | 125,00 | ||||
| 2026-02-17 | 13F | Citadel Advisors Llc | Call | 1.155.700 | 335,62 | 119.742 | 384,33 | |||
| 2026-02-13 | 13F | Volterra Technologies LP | 0 | -100,00 | 0 | -100,00 | ||||
| 2025-11-12 | 13F | Clal Insurance Enterprises Holdings Ltd | 0 | -100,00 | 0 | |||||
| 2026-02-17 | 13F | Westwood Holdings Group Inc | 140.479 | 14.555 | ||||||
| 2026-02-09 | 13F | Wellington Shields & Co., LLC | 500 | -71,43 | 52 | -68,71 | ||||
| 2026-02-10 | 13F | Goldman Sachs Group Inc | Call | 19.900 | 0,00 | 2.062 | 11,17 | |||
| 2026-02-13 | 13F | Uniting Wealth Partners, LLC | 53.454 | 5.538 | ||||||
| 2026-02-13 | 13F | Tradewinds, LLC. | 48.968 | 1,42 | 5.074 | 12,76 | ||||
| 2025-11-13 | 13F | Bnp Paribas Arbitrage, Sa | Put | 0 | -100,00 | 0 | -100,00 | |||
| 2026-01-27 | 13F | Belpointe Asset Management LLC | 3.957 | -8,59 | 410 | 1,74 | ||||
| 2026-02-13 | 13F | Ieq Capital, Llc | 0 | -100,00 | 0 | |||||
| 2026-02-03 | 13F | Sigma Investment Counselors Inc | 6.357 | -0,72 | 659 | 10,40 | ||||
| 2026-02-17 | 13F | III Capital Management | Call | 33.100 | 3.429 | |||||
| 2026-02-17 | 13F | Citadel Advisors Llc | Put | 328.300 | -11,77 | 34.015 | -1,90 | |||
| 2026-02-17 | 13F | Citadel Advisors Llc | 13.325 | -30,47 | 1.381 | -22,69 | ||||
| 2026-03-12 | 13F/A | Peak6 Llc | Call | 445.400 | 21,76 | 46.148 | 35,38 | |||
| 2026-01-21 | 13F | Flagship Harbor Advisors, Llc | 5.371 | 92,72 | 557 | 114,67 | ||||
| 2026-02-03 | 13F | Sequoia Financial Advisors, LLC | 12.364 | 0,01 | 1.281 | 11,20 | ||||
| 2026-02-10 | 13F | Bnp Paribas Arbitrage, Sa | Call | 150 | 0,00 | 1.554 | 11,24 | |||
| 2026-02-12 | 13F | Yahav Achim Ve Achayot - Provident Funds Management Co Ltd. | 14.200 | 1.471 | ||||||
| 2026-02-10 | 13F | Bnp Paribas Arbitrage, Sa | 1.377.712 | 27,49 | 142.745 | 41,74 | ||||
| 2026-02-13 | 13F | MAI Capital Management | 965 | 26,14 | 100 | 39,44 | ||||
| 2026-02-17 | 13F | Tower Research Capital LLC (TRC) | 13.778 | 194,21 | 1.428 | 227,29 | ||||
| 2026-02-04 | 13F | Ameritas Advisory Services, LLC | 0 | -100,00 | 0 | |||||
| 2026-02-12 | 13F | Advocate Investing Services LLC | 31.326 | 3.246 | ||||||
| 2026-02-17 | 13F | Manatuck Hill Partners, LLC | 0 | -100,00 | 0 | |||||
| 2026-02-11 | 13F | Parallel Advisors, LLC | 2 | 0,00 | 0 | |||||
| 2026-02-10 | 13F | CIBC World Markets Inc. | 31.799 | -5,83 | 3.295 | 4,70 | ||||
| 2026-01-26 | 13F | Asset Dedication, LLC | 52 | 0,00 | 5 | 25,00 | ||||
| 2026-04-10 | 13F | TCP Asset Management, LLC | 40.383 | 4.362 | ||||||
| 2026-02-12 | 13F | Beacon Capital Management, Inc. | 22 | 2 | ||||||
| 2026-01-08 | 13F | Chesapeake Asset Management Llc | 3.079 | -56,55 | 319 | -51,67 | ||||
| 2026-02-20 | 13F | Talisman Wealth Advisors LLC | 4.540 | 271 | ||||||
| 2026-02-17 | 13F | Caption Management, LLC | Call | 200.000 | 100,00 | 20.722 | 122,36 | |||
| 2026-02-10 | 13F | Goldman Sachs Group Inc | 1.154.554 | -3,68 | 119.623 | 7,09 | ||||
| 2026-02-06 | 13F | Axxcess Wealth Management, Llc | 18.637 | 1.931 | ||||||
| 2026-02-06 | 13F | Envestnet Portfolio Solutions, Inc. | 0 | -100,00 | 0 | |||||
| 2026-02-13 | 13F | Walleye Trading LLC | 38.596 | 3.999 | ||||||
| 2026-02-13 | 13F | Walleye Trading LLC | Call | 103.000 | 44,46 | 10.672 | 60,61 | |||
| 2026-01-21 | 13F | Canton Hathaway, LLC | 1.110 | -53,28 | 115 | -47,96 | ||||
| 2026-01-22 | 13F | Glass Jacobson Investment Advisors llc | 0 | -100,00 | 0 | |||||
| 2026-02-02 | 13F | Truist Financial Corp | 7.434 | 105,25 | 770 | 128,49 | ||||
| 2026-02-13 | 13F | Walleye Trading LLC | Put | 190.400 | 33,24 | 19.727 | 48,15 | |||
| 2026-02-17 | 13F | Banco Bilbao Vizcaya Argentaria, S.a. | 0 | -100,00 | 0 | |||||
| 2026-02-17 | 13F | Blair William & Co/il | 2.412 | -2,43 | 250 | 8,26 | ||||
| 2026-02-17 | 13F | Caption Management, LLC | Put | 229.400 | 23.768 | |||||
| 2026-02-17 | 13F | Minichmacgregor Wealth Management, Llc | 0 | -100,00 | 0 | |||||
| 2026-02-17 | 13F | Caption Management, LLC | 52.400 | 5.429 | ||||||
| 2026-01-30 | 13F | Wealthfront Advisers Llc | 54.395 | 17,34 | 5.636 | 30,47 | ||||
| 2025-11-13 | 13F | Empowered Funds, LLC | 0 | -100,00 | 0 | |||||
| 2026-01-26 | 13F | Mirae Asset Global Investments Co., Ltd. | 0 | -100,00 | 0 | |||||
| 2026-02-06 | 13F | Cullen/frost Bankers, Inc. | 1.483 | 0,00 | 154 | 10,87 |