Grundlæggende statistik
| Institutionelle ejere | 313 total, 297 long only, 2 short only, 14 long/short - change of -2,17% MRQ |
| Gennemsnitlig porteføljeallokering | 0.1200 % - change of -16,47% MRQ |
| Institutionelle aktier (lange) | 15.332.875 (ex 13D/G) - change of -2,67MM shares -14,84% MRQ |
| Institutionel værdi (lang) | $ 1.566.371 USD ($1000) |
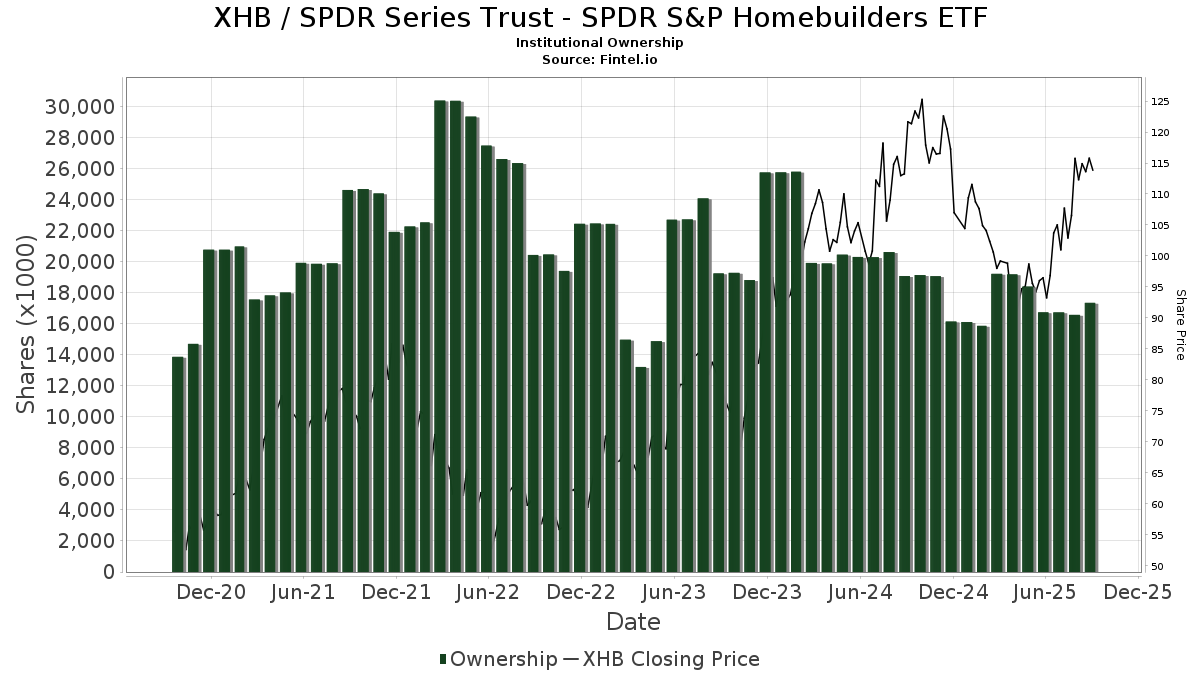
Institutionelt ejerskab og aktionærer
SPDR Series Trust - State Street SPDR S&P Homebuilders ETF (US:XHB) har 313 institutionelle ejere og aktionærer, der har indsendt 13D/G- eller 13F-formularer til Securities Exchange Commission (SEC). Disse institutioner har i alt 15,332,875 aktier. Største aktionærer omfatter Jane Street Group, Llc, Goldman Sachs Group Inc, Barclays Plc, Nomura Holdings Inc, Citadel Advisors Llc, Citadel Advisors Llc, Susquehanna International Group, Llp, Citigroup Inc, Morgan Stanley, and Peak6 Llc .
SPDR Series Trust - State Street SPDR S&P Homebuilders ETF (ARCA:XHB) institutionel ejerskabsstruktur viser aktuelle positioner i virksomheden efter institutioner og fonde, samt seneste ændringer i positionsstørrelse. Større aktionærer kan omfatte individuelle investorer, investeringsforeninger, hedgefonde eller institutioner. Skema 13D angiver, at investoren besidder (eller besidder) mere end 5 % af virksomheden og har til hensigt (eller har til hensigt at) aktivt at forfølge en ændring i forretningsstrategi. Skema 13G indikerer en passiv investering på over 5%.
The share price as of April 24, 2026 is 108,45 / share. Previously, on April 28, 2025, the share price was 93,77 / share. This represents an increase of 15,66% over that period.
Fondens stemningsscore
Fund Sentiment Score (fka Ownership Accumulation Score) finder de aktier, der bliver mest købt af fonde. Det er resultatet af en sofistikeret, multi-faktor kvantitativ model, der identificerer virksomheder med de højeste niveauer af institutionel akkumulering. Scoringsmodellen bruger en kombination af den samlede stigning i oplyste ejere, ændringerne i porteføljeallokeringer i disse ejere og andre målinger. Tallet går fra 0 til 100, hvor højere tal indikerer et højere niveau af akkumulering for sine jævnaldrende, og 50 er gennemsnittet.
Opdateringsfrekvens: Dagligt
Se Ownership Explorer, som giver en liste over højest rangerende virksomheder.
AI+ Ask Fintel’s AI assistant about SPDR Series Trust - State Street SPDR S&P Homebuilders ETF.
Select a question to share a public post with an AI-crafted answer.
Thinking of good questions…
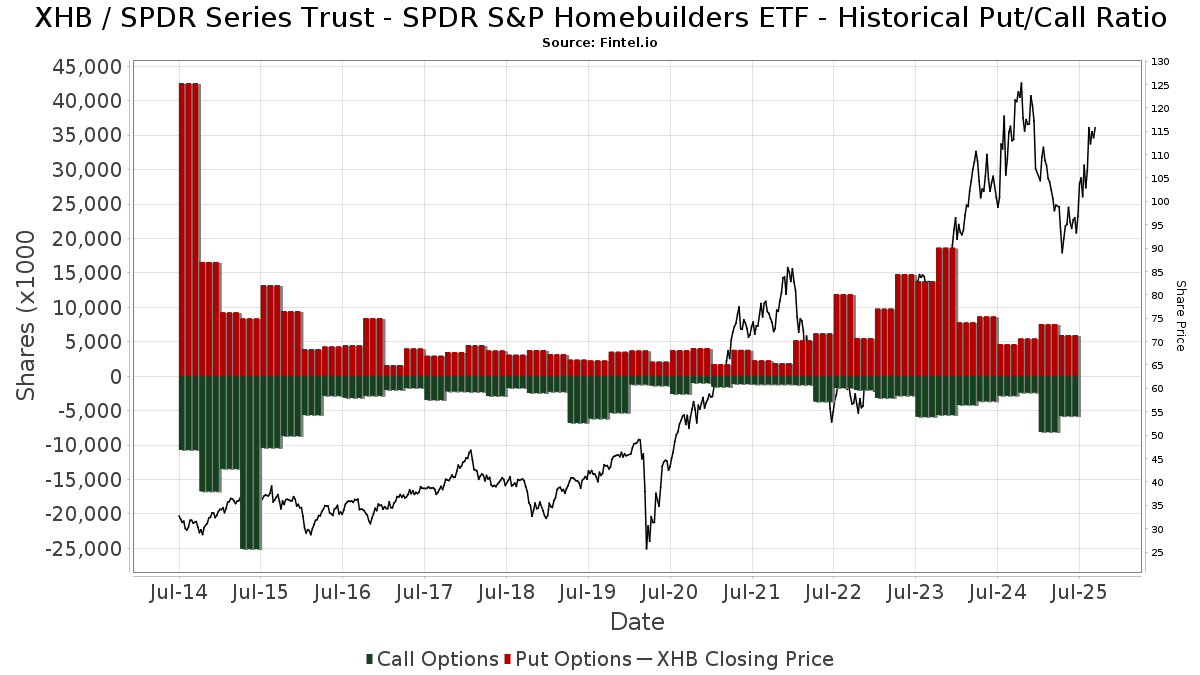
Institutionel Put/Call-forhold
Ud over at indberette standardaktie- og gældsudstedelser skal institutter med mere end 100 mill. aktiver under forvaltning også oplyse deres put- og call-optionsbeholdninger. Da salgsoptioner generelt indikerer negativ stemning, og købsoptioner indikerer positiv stemning, kan vi få en fornemmelse af den overordnede institutionelle stemning ved at plotte forholdet mellem put og kald. Diagrammet til højre viser det historiske put/call-forhold for dette instrument.
Brug af Put/Call Ratio som en indikator for investorernes stemning overvinder en af de vigtigste mangler ved at bruge totalt institutionelt ejerskab, som er, at en betydelig mængde af aktiver under forvaltning investeres passivt for at spore indekser. Passivt forvaltede fonde køber typisk ikke optioner, så indikatoren for put/call-forholdet følger mere nøje følelsen af aktivt forvaltede fonde.
13F og NPORT arkivering
Detaljer om 13F-arkivering er gratis. Detaljer om NP-ansøgninger kræver et premium-medlemskab. Grønne rækker angiver nye positioner. Røde rækker angiver lukkede positioner. Klik på linket ikon for at se den fulde transaktionshistorik.
Opgrader
for at låse premium-data op og eksportere til Excel ![]() .
.
| Fil dato | Kilde | Investor | Type | Gennemsnitlig pris (Øst) |
Aktier | Δ Aktier (%) |
Rapporteret Værdi ($1000) |
Δ Værdi (%) |
Port Alloc (%) |
|
|---|---|---|---|---|---|---|---|---|---|---|
| 2026-02-04 | 13F | Atlantic Union Bankshares Corp | 43 | 4 | ||||||
| 2026-01-26 | 13F | Main Street Group, LTD | 0 | -100,00 | 0 | |||||
| 2026-02-10 | 13F | Chartist Inc /ca/ | 10.001 | -2,79 | 1.030 | -9,66 | ||||
| 2026-02-13 | 13F | Toroso Investments, LLC | 13.507 | 36,64 | 1.391 | 26,94 | ||||
| 2026-04-21 | 13F | Wealth Effects Llc | 5.805 | 0,02 | 573 | -4,02 | ||||
| 2026-02-13 | 13F | SRS Capital Advisors, Inc. | 94 | 10 | ||||||
| 2026-01-26 | 13F | Whittier Trust Co | 750 | 0,00 | 79 | -5,95 | ||||
| 2026-02-02 | 13F | Montag A & Associates Inc | 904 | -39,89 | 93 | -43,98 | ||||
| 2026-02-13 | 13F | Thomist Capital Management, LP | 0 | -100,00 | 0 | |||||
| 2026-03-12 | 13F/A | Peak6 Llc | Put | 0 | -100,00 | 0 | -100,00 | |||
| 2025-11-05 | 13F | Bessemer Group Inc | 0 | -100,00 | 0 | |||||
| 2026-02-10 | 13F | REAP Financial Group, LLC | 601 | 62 | ||||||
| 2026-02-19 | 13F | CI Private Wealth, LLC | 6.179 | 116,73 | 584 | 85,08 | ||||
| 2026-02-13 | 13F | Natixis | 852.133 | -22,59 | 87.736 | -28,06 | ||||
| 2025-11-13 | 13F | Glenmede Investment Management, LP | 950 | 0,00 | 105 | 12,90 | ||||
| 2026-04-07 | 13F | U.S. Capital Wealth Advisors, LLC | 2.900 | 286 | ||||||
| 2026-02-13 | 13F | Ubs Asset Management Americas Inc | 116 | 12 | ||||||
| 2026-02-03 | 13F | Winch Advisory Services, LLC | 239 | 0,42 | 25 | -7,69 | ||||
| 2026-04-08 | 13F | Cadent Capital Advisors, LLC | 2.807 | -54,46 | 277 | -56,31 | ||||
| 2026-01-28 | 13F | Turtle Creek Wealth Advisors, LLC | 3.612 | 372 | ||||||
| 2026-01-26 | 13F | Private Trust Co Na | 734 | -44,98 | 76 | -48,98 | ||||
| 2026-01-20 | 13F | Stratos Wealth Partners, LTD. | 3.334 | -5,39 | 343 | -12,05 | ||||
| 2025-11-12 | 13F | Creekmur Asset Management LLC | 664 | 0,15 | 74 | 12,31 | ||||
| 2026-02-05 | 13F | Pacific Sun Financial Corp | 1.989 | 205 | ||||||
| 2026-02-17 | 13F | Royal Bank Of Canada | Put | 250.000 | 25.740 | |||||
| 2025-11-03 | 13F | Private Wealth Asset Management, LLC | 0 | -100,00 | 0 | -100,00 | ||||
| 2025-11-14 | 13F/A | NorthRock Partners, LLC | 0 | -100,00 | 0 | -100,00 | ||||
| 2026-02-17 | 13F | Capital Fund Management S.a. | Call | 142.500 | 69,04 | 14.672 | 57,08 | |||
| 2026-02-17 | 13F | Atom Investors LP | 3.759 | -97,35 | 387 | -97,54 | ||||
| 2026-02-06 | 13F | Mizuho Markets Cayman LP | 2.287 | 157,84 | 235 | 139,80 | ||||
| 2026-02-17 | 13F | D. E. Shaw & Co., Inc. | 226.355 | 4.383,16 | 23.306 | 4.069,05 | ||||
| 2026-04-07 | 13F | Blueline Advisors Llc | 1.163 | 0,00 | 115 | -4,20 | ||||
| 2026-02-17 | 13F | Capital Fund Management S.a. | Put | 170.200 | -35,09 | 17.524 | -39,68 | |||
| 2026-01-15 | 13F | Brookstone Capital Management | 0 | -100,00 | 0 | |||||
| 2026-02-17 | 13F | J. Goldman & Co LP | 35.722 | 0,90 | 3.678 | -6,25 | ||||
| 2026-04-24 | 13F | Wagner Wealth Management, Llc | 217 | 0,46 | 21 | -4,55 | ||||
| 2026-01-26 | 13F | Annex Advisory Services, LLC | 0 | -100,00 | 0 | |||||
| 2026-01-28 | 13F | HB Wealth Management, LLC | 3.600 | 0,00 | 371 | -7,04 | ||||
| 2026-02-17 | 13F | Jain Global LLC | Call | 500.000 | 51.480 | |||||
| 2026-02-17 | 13F | Jain Global LLC | Put | 100.000 | 10.296 | |||||
| 2026-02-10 | 13F | Operose Advisors LLC | 1.393 | 31,91 | 143 | 22,22 | ||||
| 2026-02-17 | 13F | Point72 Asset Management, L.P. | 13.800 | -31,00 | 1.421 | -35,92 | ||||
| 2026-04-08 | 13F | AAFMAA Wealth Management & Trust LLC | 10.475 | -60,83 | 1.034 | -62,44 | ||||
| 2026-02-12 | 13F | Jane Street Group, Llc | Call | 2.391.200 | 823,96 | 246.198 | 758,58 | |||
| 2026-02-10 | 13F | Zweig-DiMenna Associates LLC | 18.800 | 104,35 | 1.936 | 89,89 | ||||
| 2026-02-17 | 13F | Creative Planning | 10.098 | 16,93 | 1.040 | 8,68 | ||||
| 2026-01-15 | 13F | Bernard Wealth Management Corp. | 839 | 0,00 | 86 | -6,52 | ||||
| 2026-01-23 | 13F | Guidance Capital, Inc | 16.478 | 23,47 | 1.872 | 28,86 | ||||
| 2026-02-06 | 13F | Global Retirement Partners, LLC | 866 | -70,17 | 89 | -72,27 | ||||
| 2026-02-17 | 13F | Royal Bank Of Canada | 282.935 | -3,52 | 29.131 | -10,34 | ||||
| 2026-01-23 | 13F | Smith, Moore & Co. | 5.814 | -4,25 | 599 | -11,01 | ||||
| 2026-02-13 | 13F | Neuberger Berman Group LLC | 4.002 | 0,00 | 412 | -7,00 | ||||
| 2026-02-14 | 13F | Rockefeller Capital Management L.P. | 31.189 | 173,68 | 3.211 | 154,44 | ||||
| 2026-02-17 | 13F | Sender Co & Partners, Inc. | Put | 0 | -100,00 | 0 | ||||
| 2026-03-27 | 13F | Prosperity Wealth Management, Inc. | 2.051 | -9,81 | 211 | -15,94 | ||||
| 2026-02-09 | 13F | Carl P. Sherr & Co., LLC | 6.030 | 0,10 | 654 | -2,10 | ||||
| 2026-02-17 | 13F | Ancora Advisors, LLC | 74 | 0,00 | 8 | -12,50 | ||||
| 2026-02-06 | 13F | Vestmark Advisory Solutions, Inc. | 12.699 | 257,42 | 1.307 | 232,57 | ||||
| 2025-11-14 | 13F | Wealthspire Advisors, LLC | 0 | 0 | ||||||
| 2026-02-12 | 13F | Jane Street Group, Llc | Put | 415.700 | -44,72 | 42.800 | -48,63 | |||
| 2026-04-16 | 13F | Smith, Salley & Associates | 3.240 | 0,00 | 320 | -4,20 | ||||
| 2026-02-17 | 13F | Susquehanna International Group, Llp | Put | 1.314.400 | -15,00 | 135.331 | -21,01 | |||
| 2026-02-17 | 13F | Susquehanna International Group, Llp | Call | 726.200 | -11,79 | 74.770 | -18,04 | |||
| 2026-02-17 | 13F | Susquehanna International Group, Llp | 75.122 | -31,80 | 7.735 | -36,62 | ||||
| 2026-02-17 | 13F | Polar Asset Management Partners Inc. | Call | 50.000 | 5.148 | |||||
| 2026-02-17 | 13F | Balyasny Asset Management Llc | 158.578 | 16.327 | ||||||
| 2026-02-03 | 13F/A | Bank Of America Corp /de/ | Call | 0 | -100,00 | 0 | -100,00 | |||
| 2026-04-22 | 13F | Apollon Wealth Management, LLC | 6.693 | 48,14 | 661 | 41,94 | ||||
| 2025-11-06 | 13F | Gateway Wealth Partners, LLC | 0 | -100,00 | 0 | |||||
| 2026-02-02 | 13F | Breakwater Investment Management | 1.720 | 0,00 | 177 | -6,84 | ||||
| 2026-02-13 | 13F | Jacobi Capital Management LLC | 4.620 | -1,07 | 476 | -8,12 | ||||
| 2026-02-13 | 13F | Mml Investors Services, Llc | 22.174 | 21,58 | 2.283 | 13,02 | ||||
| 2026-02-17 | 13F | Perennial Investment Advisors, LLC | 3.140 | -31,08 | 323 | -35,91 | ||||
| 2026-02-13 | 13F | GM Advisory Group, Inc. | 2.632 | 271 | ||||||
| 2026-04-23 | 13F | J.w. Cole Advisors, Inc. | 2.675 | 0,15 | 264 | 22,22 | ||||
| 2026-02-05 | 13F | Allworth Financial LP | 1.140 | -1,21 | 117 | -7,87 | ||||
| 2026-02-17 | 13F | Jones Financial Companies Lllp | 12.097 | 10,78 | 1.246 | 3,32 | ||||
| 2026-02-17 | 13F | Moore Capital Management, Lp | 6.032 | -98,65 | 621 | -98,75 | ||||
| 2026-02-17 | 13F | Quadrature Capital Ltd | 50.994 | 5.250 | ||||||
| 2026-02-06 | 13F | Axxcess Wealth Management, Llc | 0 | -100,00 | 0 | |||||
| 2026-02-02 | 13F | Chung Wu Investment Group, LLC | 150 | 50,00 | 15 | 36,36 | ||||
| 2026-02-17 | 13F | Two Sigma Investments, Lp | 177.191 | 18.244 | ||||||
| 2026-02-06 | 13F | GPS Wealth Strategies Group, LLC | 0 | -100,00 | 0 | |||||
| 2026-02-12 | 13F | Gerber Kawasaki Wealth & Investment Management | 40.511 | 1,47 | 4.171 | -5,72 | ||||
| 2026-02-13 | 13F | Pin Oak Investment Advisors Inc | 1.650 | 0,00 | 0 | -100,00 | ||||
| 2026-01-15 | 13F | MOR Wealth Management, LLC | 2.896 | 298 | ||||||
| 2026-02-10 | 13F | Moment Partners, LLC | 2.386 | 0,00 | 246 | -7,20 | ||||
| 2026-04-24 | 13F | SOL Capital Management CO | 0 | -100,00 | 0 | |||||
| 2026-02-11 | 13F | O'shaughnessy Asset Management, Llc | 371 | -2,37 | 38 | -9,52 | ||||
| 2026-02-17 | 13F | Bank Of America Corp /de/ | Put | 0 | -100,00 | 0 | -100,00 | |||
| 2026-02-17 | 13F | Polymer Capital Management (US) LLC | Put | 0 | -100,00 | 0 | ||||
| 2026-04-16 | 13F | Bricktown Capital, LLC | 29.034 | 0,00 | 2.866 | -4,12 | ||||
| 2026-02-12 | 13F | Founders Financial Alliance, LLC | 0 | -100,00 | 0 | |||||
| 2026-04-20 | 13F | Sowell Financial Services LLC | 8.269 | 3,10 | 816 | -1,09 | ||||
| 2026-04-21 | 13F | Ground Swell Capital, LLC | 0 | -100,00 | 0 | |||||
| 2026-01-23 | 13F | Assetmark, Inc | 262 | 0,00 | 27 | -10,34 | ||||
| 2026-02-05 | 13F | AlphaCore Capital LLC | 857 | 6,72 | 88 | 0,00 | ||||
| 2026-02-10 | 13F | Florida Financial Advisors, Llc | 0 | -100,00 | 0 | |||||
| 2026-02-11 | 13F | Lyell Wealth Management, Lp | 8.178 | -0,63 | 842 | -7,57 | ||||
| 2026-01-26 | 13F | AE Wealth Management LLC | 113 | 25,56 | 12 | 10,00 | ||||
| 2026-03-12 | 13F | Nalls Sherbakoff Group, Llc | 0 | -100,00 | 0 | |||||
| 2026-02-12 | 13F | Leigh Baldwin & Co., Llc | 0 | -100,00 | 0 | -100,00 | ||||
| 2026-02-11 | 13F | Simplex Trading, Llc | 17.381 | -69,19 | 1.790 | 29.716,67 | ||||
| 2026-02-04 | 13F | Ameritas Advisory Services, LLC | 0 | -100,00 | 0 | |||||
| 2026-04-06 | 13F | GAMMA Investing LLC | 518 | 0,00 | 51 | -3,77 | ||||
| 2026-02-18 | 13F | Galaxy Group Investments LLC | 4.500 | 463 | ||||||
| 2026-01-29 | 13F | Aprio Wealth Management, LLC | 2.000 | 206 | ||||||
| 2026-02-13 | 13F | Umb Bank N A/mo | 1.545 | 0,00 | 159 | -7,02 | ||||
| 2026-02-18 | 13F | Financial Advisory Service, Inc. | 250 | 0,00 | 26 | -7,41 | ||||
| 2026-01-30 | 13F | Us Bancorp \de\ | 210 | 0,00 | 22 | -8,70 | ||||
| 2026-02-11 | 13F | Group One Trading, L.p. | 0 | -100,00 | 0 | |||||
| 2026-02-13 | 13F | Mariner, LLC | 10.321 | -0,65 | 1.063 | -7,73 | ||||
| 2026-02-13 | 13F | Financial Freedom, LLC | 3.996 | 0,05 | 411 | -7,01 | ||||
| 2026-02-20 | 13F | Sunbelt Securities, Inc. | 72 | 0,00 | 7 | 0,00 | ||||
| 2026-02-24 | 13F | MidFirst Bank | 6.042 | 622 | ||||||
| 2026-02-12 | 13F | Commonwealth Equity Services, Llc | 17.059 | -55,98 | 1.756 | 43.800,00 | ||||
| 2025-11-13 | 13F | Oaktree Capital Management Lp | Put | 0 | -100,00 | 0 | -100,00 | |||
| 2026-02-11 | 13F | Manchester Capital Management LLC | 1.500 | 154 | ||||||
| 2026-02-11 | 13F | Franklin Resources Inc | 100 | -50,00 | 10 | -54,55 | ||||
| 2026-02-17 | 13F | Aqr Capital Management Llc | 2.350 | 242 | ||||||
| 2026-02-04 | 13F | Byrne Financial Freedom, Llc | 3.461 | 0,00 | 356 | -7,05 | ||||
| 2026-02-17 | 13F | Private Advisor Group, LLC | 105.250 | 12,54 | 10.837 | 4,57 | ||||
| 2026-04-22 | 13F | Gemmer Asset Management LLC | 0 | -100,00 | 0 | |||||
| 2026-02-17 | 13F | Quantitative Investment Management, LLC | 0 | -100,00 | 0 | |||||
| 2026-04-08 | 13F | Accel Wealth Management | 8.431 | -1,35 | 832 | -5,35 | ||||
| 2026-01-27 | 13F | Friedenthal Financial | 0 | -100,00 | 0 | |||||
| 2026-02-13 | 13F | Citigroup Inc | Call | 71.000 | -41,32 | 7.310 | -45,47 | |||
| 2026-02-13 | 13F | Citigroup Inc | Put | 19.500 | -78,69 | 2.008 | -80,20 | |||
| 2026-04-14 | 13F | Nbc Securities, Inc. | 51 | 0,00 | 5 | 0,00 | ||||
| 2025-11-14 | 13F | Balyasny Asset Management Llc | Call | 0 | -100,00 | 0 | ||||
| 2026-02-13 | 13F | Barclays Plc | 618.589 | -29,04 | 63.690 | -34,07 | ||||
| 2025-11-13 | 13F | Riggs Asset Managment Co. Inc. | 0 | -100,00 | 0 | |||||
| 2026-02-11 | 13F | Passaic Partners LLC | 288.379 | 74,44 | 29.692 | 62,10 | ||||
| 2026-02-11 | 13F | Agave Capital Management Ltd | 67.846 | 7.024 | ||||||
| 2026-02-11 | 13F | MCF Advisors LLC | 229 | 0,00 | 24 | -8,00 | ||||
| 2026-02-13 | 13F | Barclays Plc | Call | 2.000.000 | 205.920 | |||||
| 2026-02-17 | 13F | Capital Fund Management S.a. | 161.373 | 1.067,59 | 16.615 | 985,17 | ||||
| 2026-02-17 | 13F | Wealth Watch Advisors, INC | 737 | 33,51 | 76 | 22,95 | ||||
| 2026-02-17 | 13F | Russell Investments Group, Ltd. | 121 | -3,20 | 12 | -7,69 | ||||
| 2025-11-12 | 13F | CIBC Bancorp USA Inc. | 6.060 | 671 | ||||||
| 2026-02-17 | 13F | National Asset Management, Inc. | 4.958 | 510 | ||||||
| 2026-01-29 | 13F | St. Johns Investment Management Company, LLC | 8.253 | 3,97 | 850 | -3,41 | ||||
| 2026-02-13 | 13F | Morgan Stanley | 967.556 | -33,43 | 99.620 | -38,14 | ||||
| 2026-01-27 | 13F | Q3 Asset Management | 0 | -100,00 | 0 | |||||
| 2026-01-23 | 13F | Altfest L J & Co Inc | 2.536 | 0,08 | 261 | -6,79 | ||||
| 2026-02-17 | 13F | Element Capital Management Llc | 0 | -100,00 | 0 | |||||
| 2026-04-14 | 13F | Banque Pictet & Cie Sa | 8.635 | 0,00 | 852 | -4,16 | ||||
| 2026-02-04 | 13F | Peterson Wealth Management | 27.557 | -31,16 | 2.837 | -36,03 | ||||
| 2026-01-15 | 13F | Columbus Macro, LLC | 0 | -100,00 | 0 | |||||
| 2026-02-17 | 13F | Raymond James Financial Inc | 378.758 | 58,53 | 38.997 | 47,31 | ||||
| 2026-02-13 | 13F | Kestra Advisory Services, LLC | 0 | -100,00 | 0 | |||||
| 2026-01-15 | 13F | Allspring Global Investments Holdings, LLC | 300 | 0,00 | 32 | -6,06 | ||||
| 2026-02-04 | 13F | Money Concepts Capital Corp | 0 | -100,00 | 0 | |||||
| 2026-04-24 | 13F | Seamount Financial Group Inc | 8.869 | 2,66 | 876 | -1,57 | ||||
| 2026-02-05 | 13F | Maxele Advisors, LLC | 2.980 | -6,29 | 307 | -13,07 | ||||
| 2026-02-13 | 13F | Brown Advisory Inc | 2.787 | 0,00 | 287 | -7,14 | ||||
| 2026-02-11 | 13F | J.Safra Asset Management Corp | 5.500 | 566 | ||||||
| 2026-02-13 | 13F | Citigroup Inc | 1.195.351 | -44,85 | 123.073 | -48,75 | ||||
| 2026-02-12 | 13F | Summit Financial, LLC | 10.707 | -0,50 | 1.102 | -7,55 | ||||
| 2026-02-13 | 13F | Cordoba Advisory Partners LLC | 14.730 | 1.520 | ||||||
| 2026-02-17 | 13F | Millennium Management Llc | 151.596 | -57,86 | 15.608 | -60,84 | ||||
| 2026-01-29 | 13F | Quest 10 Wealth Builders, Inc. | 31 | -8,82 | 3 | 0,00 | ||||
| 2026-01-21 | 13F | Palumbo Wealth Management LLC | 27.687 | 2.851 | ||||||
| 2026-02-17 | 13F | Sig Brokerage, Lp | Put | 10.400 | 420,00 | 1.071 | 384,16 | |||
| 2026-02-17 | 13F | Point72 Asset Management, L.P. | Put | 0 | -100,00 | 0 | ||||
| 2026-02-12 | 13F | Menora Mivtachim Holdings Ltd. | 4.000 | 412 | ||||||
| 2026-01-14 | 13F | ORG Wealth Partners, LLC | 916 | -2,86 | 94 | -9,62 | ||||
| 2026-02-13 | 13F | Golden State Wealth Management, LLC | 2 | 0,00 | 0 | |||||
| 2026-02-17 | 13F | Millennium Management Llc | Put | 358.000 | -32,55 | 36.860 | -37,33 | |||
| 2026-01-29 | 13F | Comerica Bank | 764 | -75,24 | 79 | -77,13 | ||||
| 2026-02-13 | 13F | National Bank Of Canada /fi/ | 1.198 | -1,64 | 123 | -8,21 | ||||
| 2026-02-13 | 13F | Capula Management Ltd | Call | 0 | -100,00 | 0 | ||||
| 2026-02-17 | 13F | Fmr Llc | 8.027 | 14,72 | 827 | 6,58 | ||||
| 2026-02-17 | 13F | J. Goldman & Co LP | Put | 0 | -100,00 | 0 | -100,00 | |||
| 2025-11-13 | 13F | Mackenzie Financial Corp | 0 | -100,00 | 0 | |||||
| 2026-01-27 | 13F | Elevated Capital Advisors, LLC | 269 | 28 | ||||||
| 2026-02-11 | 13F | Madden Advisory Services, Inc. | 3.919 | -1,14 | 404 | -8,20 | ||||
| 2026-02-13 | 13F | Colony Group, LLC | 6.959 | -23,94 | 721 | -28,92 | ||||
| 2026-02-17 | 13F | Millennium Management Llc | Call | 648.000 | 306,78 | 66.718 | 278,01 | |||
| 2026-04-24 | 13F | Essex Financial Services, Inc. | 0 | -100,00 | 0 | |||||
| 2026-02-13 | 13F/A | Ontario Teachers Pension Plan Board | Put | 0 | -100,00 | 0 | ||||
| 2026-02-12 | 13F | CIBC Private Wealth Group, LLC | 4.860 | 0,00 | 500 | -7,06 | ||||
| 2026-04-14 | 13F | Prospera Financial Services Inc | 2.365 | -2,27 | 233 | -6,43 | ||||
| 2026-02-11 | 13F | Total Wealth Planning & Management, Inc. | 4.140 | -10,87 | 426 | -6,78 | ||||
| 2026-02-06 | 13F | HighTower Advisors, LLC | 10.085 | 22,45 | 1.038 | 13,82 | ||||
| 2026-02-10 | 13F | Envestnet Asset Management Inc | 14.778 | -43,04 | 1.522 | -47,08 | ||||
| 2026-04-22 | 13F | Janney Montgomery Scott LLC | 6.465 | -50,53 | 1 | -100,00 | ||||
| 2026-02-17 | 13F | BlueCrest Capital Management Ltd | 0 | -100,00 | 0 | -100,00 | ||||
| 2026-02-17 | 13F | Advisory Services Network, LLC | 16.679 | -0,61 | 1.717 | -7,64 | ||||
| 2026-01-16 | 13F | Ronald Blue Trust, Inc. | 0 | -100,00 | 0 | |||||
| 2026-02-17 | 13F | SageView Advisory Group, LLC | 42 | 4 | ||||||
| 2026-04-21 | 13F | FLP Wealth Management, LLC | 1.580 | -4,07 | 253 | 3,27 | ||||
| 2026-02-02 | 13F | Ellis Investment Partners, LLC | 45.801 | 5,04 | 4.716 | -2,40 | ||||
| 2026-02-12 | 13F | Hamilton Point Investment Advisors, LLC | 555 | 57 | ||||||
| 2026-02-17 | 13F | BlueCrest Capital Management Ltd | Call | 6.800 | 700 | |||||
| 2026-02-06 | 13F | Larson Financial Group LLC | 892 | 0,00 | 92 | -7,14 | ||||
| 2026-02-12 | 13F | Rossby Financial, LCC | 68 | 7 | ||||||
| 2026-02-10 | 13F | Meitav Dash Investments Ltd | 205.359 | -0,25 | 21.144 | -7,30 | ||||
| 2026-02-06 | 13F | Pnc Financial Services Group, Inc. | 37.858 | -30,29 | 3.898 | -35,23 | ||||
| 2026-02-17 | 13F | CastleKnight Management LP | 5.000 | 515 | ||||||
| 2026-02-12 | 13F | Bank Of Montreal /can/ | 60.115 | 162,14 | 6.189 | 143,66 | ||||
| 2025-11-14 | 13F | State Of Wisconsin Investment Board | 0 | -100,00 | 0 | -100,00 | ||||
| 2026-04-17 | 13F | Old North State Wealth Management, LLC | 2.761 | 0,22 | 273 | -3,89 | ||||
| 2026-02-13 | 13F | Centiva Capital, LP | 2.500 | 257 | ||||||
| 2026-02-13 | 13F | Centaurus Financial, Inc. | 23.893 | 7,10 | 2 | 0,00 | ||||
| 2026-04-15 | 13F | Sage Capital Management, LLC | 10.755 | 0,20 | 1.062 | -3,98 | ||||
| 2026-01-28 | 13F | Kingswood Wealth Advisors, Llc | 2.843 | 27,72 | 293 | 18,70 | ||||
| 2026-02-10 | 13F | Foundations Investment Advisors, LLC | 16.797 | 1.729 | ||||||
| 2026-02-12 | 13F | Steward Partners Investment Advisory, Llc | 715 | -3,12 | 74 | -9,88 | ||||
| 2026-02-12 | 13F | Castleark Management Llc | 0 | -100,00 | 0 | |||||
| 2026-04-01 | 13F | Bangor Savings Bank | 400 | 0,00 | 39 | -4,88 | ||||
| 2025-11-10 | 13F | Greenland Capital Management LP | 0 | -100,00 | 0 | -100,00 | ||||
| 2026-02-12 | 13F | Mount Yale Investment Advisors, LLC | 12.866 | 259,39 | 1.325 | 234,34 | ||||
| 2026-01-26 | 13F | SeaBridge Investment Advisors LLC | 2.070 | 0,00 | 213 | -6,99 | ||||
| 2026-04-24 | 13F | Financial Life Planners | 437 | 43 | ||||||
| 2026-02-13 | 13F | Soros Fund Management Llc | 202.579 | 20.858 | ||||||
| 2026-02-17 | 13F | FIL Ltd | 0 | -100,00 | 0 | |||||
| 2025-11-13 | 13F | Total Investment Management Inc | 0 | -100,00 | 0 | |||||
| 2025-11-14 | 13F | Trexquant Investment LP | 0 | -100,00 | 0 | |||||
| 2026-04-07 | 13F | CoreCap Advisors, LLC | 238.094 | -0,72 | 23.505 | -4,82 | ||||
| 2026-02-12 | 13F | Fortress Private Ledger, Llc | 0 | -100,00 | 0 | |||||
| 2026-02-13 | 13F | Healthcare Of Ontario Pension Plan Trust Fund | 450.000 | -43,75 | 46.332 | -47,73 | ||||
| 2026-04-23 | 13F | Intrua Financial, LLC | 3.063 | 0,10 | 302 | -4,13 | ||||
| 2026-04-21 | 13F | Pinnacle Wealth Management Advisory Group, LLC | 2.535 | 0,00 | 250 | -4,21 | ||||
| 2026-04-17 | 13F | Viewpoint Capital Management LLC | 62.864 | 6,17 | 6.206 | 1,79 | ||||
| 2026-04-20 | 13F | Inscription Capital, LLC | 4.801 | 0,17 | 474 | -4,06 | ||||
| 2026-02-17 | 13F | Guardian Partners Inc. | 0 | -100,00 | 0 | |||||
| 2026-04-06 | 13F | CX Institutional | 104 | -8,77 | 0 | |||||
| 2026-02-13 | 13F | Squarepoint Ops LLC | 12.772 | -34,89 | 1.315 | -39,48 | ||||
| 2026-01-26 | 13F | Cwm, Llc | 3.378 | 7,41 | 0 | |||||
| 2026-02-02 | 13F | Manhattan West Asset Management, LLC | 2.322 | 239 | ||||||
| 2026-02-09 | 13F | Hartland & Co., LLC | 1.890 | -3,96 | 195 | -11,01 | ||||
| 2026-01-21 | 13F | Sound Income Strategies, LLC | 98 | 11 | ||||||
| 2026-02-13 | 13F | Aptus Capital Advisors, LLC | 1.055 | 0,00 | 109 | -6,90 | ||||
| 2026-02-13 | 13F | Squarepoint Ops LLC | Call | 13.100 | -25,14 | 1.349 | -30,48 | |||
| 2026-02-13 | 13F | Squarepoint Ops LLC | Put | 21.200 | -26,13 | 2.183 | -31,36 | |||
| 2026-04-08 | 13F | Wealth Enhancement Advisory Services, Llc | 5.475 | -27,61 | 538 | -32,87 | ||||
| 2026-02-13 | 13F | Marshall Wace, Llp | 184.800 | 19.027 | ||||||
| 2026-02-13 | 13F | Marshall Wace, Llp | Call | 4.400 | 453 | |||||
| 2026-02-09 | 13F | Harbour Investments, Inc. | 8.921 | 0,29 | 919 | -6,80 | ||||
| 2026-02-10 | 13F | Bearing Point Capital, Llc | 4.184 | 431 | ||||||
| 2026-04-24 | 13F | Black Swift Group, LLC | 5.000 | 494 | ||||||
| 2026-02-13 | 13F | Ares Management Llc | Put | 0 | -100,00 | 0 | ||||
| 2026-04-16 | 13F | Toth Financial Advisory Corp | 26.210 | 3,40 | 2.587 | -0,84 | ||||
| 2026-02-17 | 13F | Strive Financial Group ,LLC | 300 | 31 | ||||||
| 2026-02-10 | 13F/A | Northwestern Mutual Wealth Management Co | 14.874 | -0,10 | 1.531 | -7,16 | ||||
| 2025-11-14 | 13F | XTX Topco Ltd | 0 | -100,00 | 0 | |||||
| 2026-02-17 | 13F | Sona Asset Management (us) Llc | Call | 0 | -100,00 | 0 | ||||
| 2026-04-07 | 13F | Farther Finance Advisors, LLC | 1.354 | 4.413,33 | 134 | 4.366,67 | ||||
| 2026-01-20 | 13F | Independence Bank of Kentucky | 160 | 0,00 | 16 | -5,88 | ||||
| 2026-02-13 | 13F | Marshall Wace, Llp | Put | 0 | -100,00 | 0 | ||||
| 2025-11-14 | 13F | Candlestick Capital Management LP | Call | 0 | -100,00 | 0 | -100,00 | |||
| 2026-01-13 | 13F | Stephens Consulting, LLC | 1.000 | 0,00 | 103 | -7,27 | ||||
| 2026-02-12 | 13F | BlackRock, Inc. | 136.037 | 0,27 | 14.006 | -6,82 | ||||
| 2026-02-04 | 13F | Meridian Wealth Management, LLC | 2.483 | -6,30 | 256 | -12,97 | ||||
| 2026-02-13 | 13F | Arkadios Wealth Advisors | 4.969 | -4,33 | 512 | -11,13 | ||||
| 2026-04-16 | 13F | Phillips Financial Management, Llc | 95 | 0,00 | 9 | 0,00 | ||||
| 2026-02-09 | 13F | Annis Gardner Whiting Capital Advisors, LLC | 308 | 32 | ||||||
| 2026-01-27 | 13F | CenterStar Asset Management, LLC | 0 | -100,00 | 0 | |||||
| 2026-02-17 | 13F | BTG Pactual Asset Management US LLC | 0 | -100,00 | 0 | |||||
| 2026-04-17 | 13F | AdvisorNet Financial, Inc | 205 | -6,82 | 20 | -9,09 | ||||
| 2026-02-12 | 13F | BRYN MAWR TRUST Co | 1.200 | 0,00 | 124 | -6,82 | ||||
| 2026-01-16 | 13F | Trust Co Of Vermont | 0 | -100,00 | 0 | |||||
| 2026-02-02 | 13F | Sachetta, LLC | 0 | -100,00 | 0 | |||||
| 2026-01-28 | 13F | Geneos Wealth Management Inc. | 500 | 0,00 | 51 | -7,27 | ||||
| 2025-11-05 | 13F | Key FInancial Inc | 0 | -100,00 | 0 | |||||
| 2026-04-10 | 13F | Field & Main Bank | 3.665 | -8,15 | 362 | -11,95 | ||||
| 2026-02-13 | 13F | Stifel Financial Corp | 88.293 | 132,62 | 9.091 | 116,17 | ||||
| 2026-02-11 | 13F | LPL Financial LLC | 260.996 | -30,78 | 26.872 | -35,68 | ||||
| 2026-04-16 | 13F | Terra Nova Asset Management LLC | 0 | -100,00 | 0 | |||||
| 2026-04-17 | 13F | IFC & Insurance Marketing, Inc. | 0 | -100,00 | 0 | |||||
| 2026-02-06 | 13F | Aspen Investment Management Inc | 0 | -100,00 | 0 | |||||
| 2026-02-10 | 13F | Quantbot Technologies LP | 142 | -66,67 | 15 | -70,21 | ||||
| 2026-01-29 | 13F | UBS Group AG | Put | 70.000 | 0,00 | 7.207 | -7,08 | |||
| 2026-01-29 | 13F | UBS Group AG | Call | 2.992 | 308 | |||||
| 2026-02-10 | 13F | Rothschild Investment Llc | 4.000 | 0,00 | 412 | -7,22 | ||||
| 2026-02-17 | 13F | Freestone Grove Partners LP | 94.602 | 9.740 | ||||||
| 2026-02-17 | 13F | Integrated Advisors Network LLC | 7.732 | 270,84 | 796 | 244,59 | ||||
| 2026-02-17 | 13F | Parallax Volatility Advisers, L.P. | Put | 200 | 21 | |||||
| 2026-01-12 | 13F | World Equity Group, Inc. | 0 | -100,00 | 0 | |||||
| 2026-02-17 | 13F | Cetera Investment Advisers | 57.003 | -31,11 | 5.869 | -35,99 | ||||
| 2026-02-04 | 13F | West Tower Group, LLC | 2.500 | 257 | ||||||
| 2026-02-17 | 13F | Parallax Volatility Advisers, L.P. | 1 | 0 | ||||||
| 2026-02-17 | 13F | Parallax Volatility Advisers, L.P. | Call | 15.100 | 1.555 | |||||
| 2026-02-02 | 13F | Cornerstone Planning Group LLC | 71 | 115,15 | 8 | -63,16 | ||||
| 2026-02-11 | 13F | Kranot Hishtalmut Le Morim Ve Gananot Havera Menahelet LTD | 147.504 | 0,00 | 15.187 | -6,82 | ||||
| 2026-02-17 | 13F | Aster Capital Management (DIFC) Ltd | 37.690 | 3.881 | ||||||
| 2026-02-17 | 13F | Schonfeld Strategic Advisors LLC | 2.562 | 0,00 | 264 | -7,07 | ||||
| 2026-02-17 | 13F | Nomura Holdings Inc | Call | 2.000.000 | 2.757,14 | 205.920 | 2.554,98 | |||
| 2026-02-17 | 13F | Brevan Howard Capital Management LP | 0 | -100,00 | 0 | |||||
| 2026-02-11 | 13F | LPL Financial LLC | Call | 3.000 | 309 | |||||
| 2026-02-12 | 13F | Brinker Capital Investments, LLC | 0 | -100,00 | 0 | |||||
| 2026-02-11 | 13F | Jpmorgan Chase & Co | 116.648 | -77,82 | 12.010 | -79,39 | ||||
| 2026-02-10 | 13F | Measured Wealth Private Client Group, LLC | 14 | 1 | ||||||
| 2026-01-30 | 13F | Caldwell Securities, Inc | 7 | 0,00 | 1 | |||||
| 2025-11-12 | 13F | Headlands Technologies LLC | 0 | -100,00 | 0 | -100,00 | ||||
| 2026-04-22 | 13F | JNBA Financial Advisors | 0 | -100,00 | 0 | |||||
| 2026-02-12 | 13F | Tocqueville Asset Management L.p. | 17.185 | -60,88 | 1.769 | 36,92 | ||||
| 2026-02-18 | 13F | GWM Advisors LLC | 329 | -73,21 | 34 | -75,74 | ||||
| 2026-02-17 | 13F | Ameriprise Financial Inc | 22.629 | -64,75 | 2.330 | -67,26 | ||||
| 2026-04-13 | 13F | Creative Financial Designs Inc /adv | 131 | 0,00 | 13 | -7,69 | ||||
| 2026-04-22 | 13F | Spire Wealth Management | 5.003 | -11,37 | 494 | -15,15 | ||||
| 2026-04-10 | 13F | Magnus Financial Group LLC | 2.750 | -2,07 | 272 | -6,23 | ||||
| 2026-02-17 | 13F | Tower Research Capital LLC (TRC) | 0 | -100,00 | 0 | |||||
| 2026-02-02 | 13F | Benjamin Edwards Inc | 5.540 | 0,05 | 571 | -7,01 | ||||
| 2026-02-17 | 13F | Concentric Capital Strategies, LP | 100.117 | 10.308 | ||||||
| 2025-11-13 | 13F | Vestcor Inc | 0 | -100,00 | 0 | -100,00 | ||||
| 2026-02-05 | 13F | Phoenix Holdings Ltd. | 42.580 | -0,90 | 4.384 | -7,90 | ||||
| 2026-01-30 | 13F | Sigma Planning Corp | 9.592 | 9,06 | 988 | 1,33 | ||||
| 2026-02-12 | 13F | Jane Street Group, Llc | 0 | -100,00 | 0 | -100,00 | ||||
| 2026-02-13 | 13F | Macquarie Group Ltd | 0 | -100,00 | 0 | |||||
| 2026-01-16 | 13F | Surience Private Wealth Llc | 0 | -100,00 | 0 | |||||
| 2026-01-21 | 13F | Signature Resources Capital Management, LLC | 0 | -100,00 | 0 | |||||
| 2026-04-24 | 13F | James Investment Research Inc | 10.328 | -0,66 | 1.020 | -4,77 | ||||
| 2026-01-26 | 13F | Childress Capital Advisors, Llc | 0 | -100,00 | 0 | |||||
| 2026-01-27 | 13F | Belpointe Asset Management LLC | 0 | -100,00 | 0 | |||||
| 2026-01-27 | 13F | Institute for Wealth Management, LLC. | 19.192 | -1,02 | 1.976 | -8,05 | ||||
| 2026-01-29 | 13F | UBS Group AG | 188.350 | -63,52 | 19.393 | -66,10 | ||||
| 2026-02-17 | 13F | Qube Research & Technologies Ltd | 143.471 | 526,70 | 14.772 | 482,45 | ||||
| 2026-02-10 | 13F | Nomura Asset Management Co Ltd | 800 | -60,00 | 82 | -62,90 | ||||
| 2026-02-03 | 13F | International Assets Investment Management, Llc | 64 | 7 | ||||||
| 2026-02-13 | 13F | Capital Square, LLC | 5.910 | -32,24 | 609 | -37,06 | ||||
| 2026-02-13 | 13F | Garrison Point Advisors, Llc | 9.955 | 1,48 | 1.025 | -5,71 | ||||
| 2026-02-09 | 13F | Cypress Capital Management LLC (WY) | 30 | 3 | ||||||
| 2026-04-21 | 13F | Blue Jean Financial Llc | 6.909 | 2,84 | 682 | -1,30 | ||||
| 2026-02-02 | 13F | Fifth Third Bancorp | 400 | 0,00 | 41 | -6,82 | ||||
| 2026-02-04 | 13F | Independent Advisor Alliance | 2.000 | 0,00 | 206 | -7,24 | ||||
| 2026-02-17 | 13F | Shay Capital LLC | 2.500 | 257 | ||||||
| 2026-02-13 | 13F | Wells Fargo & Company/mn | Put | 29.600 | 15,18 | 3.048 | 7,02 | |||
| 2026-04-24 | 13F | UMA Financial Services, Inc. | 290 | 0,00 | 29 | -3,45 | ||||
| 2026-02-13 | 13F | Baird Financial Group, Inc. | 44.517 | 16,31 | 4.583 | 8,09 | ||||
| 2026-02-13 | 13F | Y-Intercept (Hong Kong) Ltd | 10.400 | -64,96 | 1.071 | -67,46 | ||||
| 2026-04-08 | 13F | BOS Asset Management, LLC | 39.301 | -0,68 | 3.880 | -4,79 | ||||
| 2026-02-17 | 13F | Warren Averett Asset Management, LLC | 2.215 | 2,36 | 228 | -4,60 | ||||
| 2026-04-02 | 13F | Noble Wealth Management PBC | 0 | -100,00 | 0 | |||||
| 2026-02-17 | 13F | Two Sigma Securities, Llc | 0 | -100,00 | 0 | |||||
| 2026-02-13 | 13F | Wells Fargo & Company/mn | Call | 499.900 | 899,80 | 51.470 | 829,04 | |||
| 2025-11-14 | 13F | Scopus Asset Management, L.p. | Put | 0 | -100,00 | 0 | -100,00 | |||
| 2026-01-29 | 13F | Investment Management Corp /va/ /adv | 5.505 | -0,04 | 567 | -7,21 | ||||
| 2026-02-09 | 13F | Choate Investment Advisors | 19.499 | 0,00 | 2.008 | -7,08 | ||||
| 2026-02-12 | 13F | Triumph Capital Management | 4 | 0,00 | 0 | |||||
| 2026-04-22 | 13F | Patriot Financial Group Insurance Agency, LLC | 3.920 | 100,00 | 387 | 92,04 | ||||
| 2026-02-13 | 13F | Wells Fargo & Company/mn | 243.324 | 18,56 | 25.053 | 10,17 | ||||
| 2026-04-15 | 13F | City Holding Co | 100 | 0,00 | 10 | -10,00 | ||||
| 2026-02-09 | 13F | Keating Financial Advisory Services, Inc. | 9.286 | 956 | ||||||
| 2026-02-09 | 13F | Kingsview Wealth Management, LLC | 145.338 | 3,77 | 14.964 | -3,58 | ||||
| 2026-02-17 | 13F | Banco Bilbao Vizcaya Argentaria, S.a. | 0 | -100,00 | 0 | |||||
| 2026-02-03 | 13F | Strategic Wealth Advisors LLC | 2.000 | 0 | ||||||
| 2026-02-17 | 13F | DV Trading LLC | 300 | 31 | ||||||
| 2026-02-12 | 13F | Federation des caisses Desjardins du Quebec | 20 | 0,00 | 2 | 0,00 | ||||
| 2026-02-13 | 13F | Schroder Investment Management Group | 8.222 | 855 | ||||||
| 2026-02-11 | 13F | Mirae Asset Securities (usa) Inc. | 500.000 | 0,00 | 51.480 | -7,08 | ||||
| 2026-04-15 | 13F | Merit Financial Group, LLC | 5.926 | 80,67 | 585 | 73,29 | ||||
| 2026-02-04 | 13F | NAN FUNG TRINITY (HK) Ltd | 155.040 | 15.963 | ||||||
| 2025-10-29 | 13F | Harel Insurance Investments & Financial Services Ltd. | 0 | -100,00 | 0 | |||||
| 2026-02-17 | 13F | IHT Wealth Management, LLC | 8.093 | -58,76 | 833 | -61,68 | ||||
| 2026-04-23 | 13F | North Star Investment Management Corp. | 40.482 | 5,35 | 3.996 | 1,01 | ||||
| 2025-10-28 | 13F | Pinnacle Financial Partners Inc | 0 | -100,00 | 0 | -100,00 | ||||
| 2026-04-15 | 13F | Register Financial Advisors LLC | 1.607 | 3,88 | 159 | -0,63 | ||||
| 2026-04-24 | 13F | Alexis Investment Partners, LLC | 0 | -100,00 | 0 | |||||
| 2026-01-23 | 13F | Diversify Advisory Services, LLC | 0 | -100,00 | 0 | |||||
| 2026-04-23 | 13F | Harbor Investment Advisory, Llc | 5 | 0 | ||||||
| 2025-11-14 | 13F | SIH Partners, LLLP | 0 | -100,00 | 0 | -100,00 | ||||
| 2026-01-30 | 13F | Bogart Wealth, LLC | 112 | -99,62 | 12 | -99,66 | ||||
| 2026-02-17 | 13F | Tudor Investment Corp Et Al | Put | 45.000 | -71,06 | 4.633 | -73,11 | |||
| 2026-02-17 | 13F | Tudor Investment Corp Et Al | Call | 71.400 | 760,24 | 7.351 | 699,89 | |||
| 2026-02-11 | 13F | Kranot Hishtalmut Le Morim Tichoniim Havera Menahelet LTD | 53.230 | 0,00 | 5.481 | -6,82 | ||||
| 2025-11-12 | 13F | Itau Unibanco Holding S.A. | 0 | -100,00 | 0 | -100,00 | ||||
| 2025-11-14 | 13F | Wolverine Trading, Llc | Put | 0 | -100,00 | 0 | -100,00 | |||
| 2025-11-14 | 13F | Wolverine Trading, Llc | Call | 0 | -100,00 | 0 | -100,00 | |||
| 2026-01-14 | 13F | Barnes Dennig Private Wealth Management LLC | 0 | -100,00 | 0 | |||||
| 2026-02-13 | 13F | Gts Securities Llc | 0 | -100,00 | 0 | |||||
| 2026-02-17 | 13F | Mercer Global Advisors Inc /adv | 3.443 | 0,23 | 355 | -6,84 | ||||
| 2026-01-22 | 13F | Mh & Associates Securities Management Corp /adv | 10 | 1 | ||||||
| 2026-02-17 | 13F | Pinnacle Family Advisors, LLC | 2.975 | 306 | ||||||
| 2026-02-05 | 13F | Thrivent Financial For Lutherans | 4.379 | 0,00 | 0 | |||||
| 2026-02-17 | 13F | Tudor Investment Corp Et Al | 0 | -100,00 | 0 | -100,00 | ||||
| 2026-04-15 | 13F | Fifth Third Securities, Inc. | 3.466 | 5,45 | 342 | 1,18 | ||||
| 2026-02-17 | 13F | Advisor Group Holdings, Inc. | 39.822 | -10,74 | 4.103 | -18,09 | ||||
| 2026-02-17 | 13F | Perbak Capital Partners LLP | 39.432 | 8,94 | 4.060 | 1,22 | ||||
| 2025-11-12 | 13F | Transce3nd, LLC | 0 | -100,00 | 0 | -100,00 | ||||
| 2026-02-13 | 13F | Maven Securities LTD | 21.562 | -19,94 | 2.221 | -25,57 | ||||
| 2026-02-13 | 13F | Ausdal Financial Partners, Inc. | 2.913 | -12,68 | 300 | -18,97 | ||||
| 2026-04-23 | 13F | WMG Financial Advisors, LLC | 0 | -100,00 | 0 | |||||
| 2026-04-24 | 13F | Means Investment Co., Inc. | 7.553 | -8,71 | 746 | -12,46 | ||||
| 2026-04-14 | 13F | Opal Wealth Advisors, LLC | 7.470 | -0,72 | 737 | -4,78 | ||||
| 2026-02-06 | 13F | Copia Wealth Management | 430 | 79,17 | 44 | 69,23 | ||||
| 2026-01-27 | 13F | Ring Mountain Capital, LLC | 3.283 | -3,72 | 0 | |||||
| 2026-02-17 | 13F | Snowden Capital Advisors LLC | 4.845 | -23,29 | 499 | -28,76 | ||||
| 2026-02-12 | 13F | Hrt Financial Lp | 0 | -100,00 | 0 | |||||
| 2026-02-05 | 13F | Cambridge Investment Research Advisors, Inc. | 17.306 | -1,99 | 2 | 0,00 | ||||
| 2026-02-17 | 13F | Glenmede Trust Co Na | 950 | 0,00 | 98 | 5,43 | ||||
| 2026-04-13 | 13F | True Wealth Design, LLC | 131 | 13 | ||||||
| 2026-02-03 | 13F | American Financial Advisors, LLC | 1.957 | 0,15 | 201 | -6,94 | ||||
| 2026-02-13 | 13F | Verition Fund Management LLC | Put | 0 | -100,00 | 0 | -100,00 | |||
| 2026-02-13 | 13F | Verition Fund Management LLC | 9.096 | -83,77 | 937 | -84,92 | ||||
| 2026-04-20 | 13F | Global Financial Private Client, LLC | 9.296 | 5,53 | 918 | 1,21 | ||||
| 2026-02-13 | 13F | Navis Wealth Advisors, LLC | 3.671 | 0,16 | 378 | -7,14 | ||||
| 2026-02-17 | 13F | Bank Of America Corp /de/ | 728.255 | -22,30 | 74.981 | -27,80 | ||||
| 2026-02-17 | 13F | Citadel Advisors Llc | 421.874 | 472,64 | 43.436 | 432,17 | ||||
| 2026-02-17 | 13F | Citadel Advisors Llc | Call | 1.398.600 | 396,84 | 144.000 | 361,68 | |||
| 2026-02-10 | 13F | 360 Financial, Inc. | 1.945 | 0,00 | 216 | 0,00 | ||||
| 2026-02-13 | 13F | Johnson Investment Counsel Inc | 0 | -100,00 | 0 | |||||
| 2026-04-24 | 13F | Perryman Financial Advisory Inc /ad | 3.015 | 0,00 | 298 | -4,19 | ||||
| 2026-02-17 | 13F | Discovery Capital Management, Llc / Ct | 0 | -100,00 | 0 | |||||
| 2026-01-21 | 13F | Flagship Harbor Advisors, Llc | 140 | 14 | ||||||
| 2026-01-30 | 13F | Wealthfront Advisers Llc | 5.226 | 0,08 | 538 | -6,92 | ||||
| 2026-02-06 | 13F | Investment House Llc | 5.922 | 1,21 | 610 | -6,02 | ||||
| 2026-03-31 | 13F/A | Barclays Plc | Put | 0 | -100,00 | 0 | -100,00 | |||
| 2026-04-07 | 13F | Estate Planners Group, LLC | 214 | 22 | ||||||
| 2026-02-10 | 13F | Goldman Sachs Group Inc | 2.358.013 | 0,54 | 242.781 | -6,57 | ||||
| 2026-02-06 | 13F | Private Wealth Advisors, LLC | 0 | -100,00 | 0 | |||||
| 2026-02-17 | 13F | Brevan Howard Capital Management LP | Call | 660.000 | 340,00 | 67.954 | 308,86 | |||
| 2026-02-11 | 13F | TruNorth Capital Management, LLC | 0 | -100,00 | 0 | |||||
| 2026-04-22 | 13F | HMS Capital Management, LLC | 0 | -100,00 | 0 | |||||
| 2026-04-15 | 13F | Access Financial Services, Inc. | 0 | -100,00 | 0 | |||||
| 2026-02-13 | 13F | MAI Capital Management | 1.087 | 0,00 | 112 | -7,50 | ||||
| 2026-01-28 | 13F | Financial Perspectives, Inc | 144 | 0,00 | 15 | -6,67 | ||||
| 2026-04-21 | 13F | Pinnacle Associates Ltd | 7.316 | 3,17 | 722 | -1,10 | ||||
| 2025-11-14 | 13F | Wolverine Trading, Llc | 0 | -100,00 | 0 | -100,00 | ||||
| 2026-04-16 | 13F | First Community Trust Na | 0 | -100,00 | 0 | |||||
| 2026-02-17 | 13F | Toronto Dominion Bank | 0 | -100,00 | 0 | |||||
| 2026-02-17 | 13F | Citadel Advisors Llc | Put | 1.764.400 | 18,97 | 181.663 | 10,55 | |||
| 2026-03-12 | 13F/A | Peak6 Llc | Call | 913.900 | 246,44 | 94.095 | 221,92 | |||
| 2026-04-13 | 13F | St Germain D J Co Inc | 749 | -98,85 | 74 | -98,91 | ||||
| 2026-02-10 | 13F | Bnp Paribas Arbitrage, Sa | 388.775 | -46,06 | 40.028 | -49,88 | ||||
| 2026-02-10 | 13F | CIBC World Markets Inc. | 4.482 | 12,56 | 461 | 4,54 | ||||
| 2026-02-10 | 13F | Beaton Management Co. Inc. | 0 | -100,00 | 0 | |||||
| 2026-02-12 | 13F | Principal Securities, Inc. | 0 | -100,00 | 0 | -100,00 | ||||
| 2026-02-17 | 13F | Graham Capital Management, L.P. | 87.200 | 8.978 | ||||||
| 2026-02-11 | 13F | Parallel Advisors, LLC | 901 | 0,00 | 93 | -7,07 | ||||
| 2026-04-15 | 13F | RCW Management, LLC | 7.233 | 0,00 | 714 | -4,03 | ||||
| 2026-04-08 | 13F | Holos Integrated Wealth LLC | 50 | 5 | ||||||
| 2026-02-03 | 13F | K.J. Harrison & Partners Inc | 34.000 | 70,00 | 3.501 | 56,81 | ||||
| 2026-04-22 | 13F | Larry Mathis Financial Planning, LLC | 0 | -100,00 | 0 | |||||
| 2026-04-13 | 13F | IFP Advisors, Inc | 125 | 0,00 | 12 | 0,00 | ||||
| 2026-02-03 | 13F | Providence First Trust Co | 0 | -100,00 | 0 | |||||
| 2026-02-17 | 13F | Caption Management, LLC | Put | 100.000 | 0,00 | 10.296 | -7,08 | |||
| 2026-02-13 | 13F | Walleye Trading LLC | 6.102 | -72,51 | 628 | -74,46 | ||||
| 2026-02-17 | 13F | Edmond De Rothschild Holding S.a. | 0 | -100,00 | 0 | |||||
| 2026-02-13 | 13F | Flow Traders U.s. Llc | 13.631 | 1 | ||||||
| 2025-11-14 | 13F | Point72 Hong Kong Ltd | 45.000 | 4.986 | ||||||
| 2026-01-27 | 13F | TD Waterhouse Canada Inc. | 574 | 0,00 | 59 | -7,81 | ||||
| 2026-02-13 | 13F | Walleye Capital LLC | 0 | -100,00 | 0 | |||||
| 2026-04-22 | 13F | Portus Wealth Advisors, LLC | 8 | 1 | ||||||
| 2026-02-12 | 13F | Hollencrest Capital Management | 130 | 0,00 | 13 | -7,14 | ||||
| 2025-11-14 | 13F | Nomura Holdings Inc | Put | 0 | -100,00 | 0 | -100,00 | |||
| 2026-02-13 | 13F | Walleye Trading LLC | Call | 35.500 | 8,56 | 3.655 | 0,88 | |||
| 2025-10-27 | 13F | Roof Eidam & Maycock/adv | 0 | -100,00 | 0 | -100,00 | ||||
| 2026-04-23 | 13F | Oppenheimer & Co Inc | 0 | -100,00 | 0 | |||||
| 2026-02-02 | 13F | Truist Financial Corp | 8.319 | 0,24 | 857 | -6,86 | ||||
| 2026-02-17 | 13F | Blair William & Co/il | 682 | -60,83 | 70 | -63,54 | ||||
| 2026-04-14 | 13F | Sanchez Gaunt Capital Management, LLC | 6.748 | 666 | ||||||
| 2026-01-12 | 13F | Focus Financial Network, Inc. | 0 | -100,00 | 0 | |||||
| 2026-02-13 | 13F | Wexford Capital Lp | 0 | -100,00 | 0 | |||||
| 2026-02-13 | 13F | Walleye Trading LLC | Put | 24.600 | 0,41 | 2.533 | -6,71 | |||
| 2026-04-16 | 13F | SG Americas Securities, LLC | 22.836 | 40,75 | 2 | 100,00 |