Grundlæggende statistik
| Institutionelle ejere | 167 total, 167 long only, 0 short only, 0 long/short - change of -1,18% MRQ |
| Gennemsnitlig porteføljeallokering | 0.4834 % - change of -3,22% MRQ |
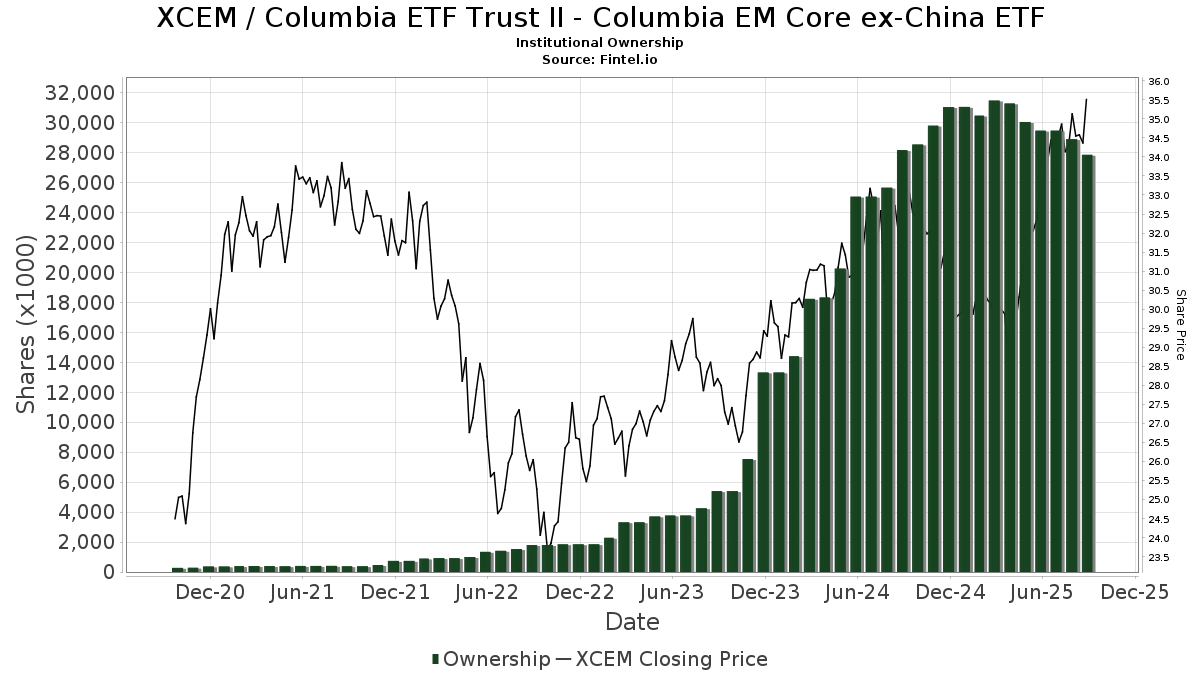
| Institutionelle aktier (lange) | 27.849.495 (ex 13D/G) - change of -1,60MM shares -5,44% MRQ |
| Institutionel værdi (lang) | $ 878.132 USD ($1000) |
Institutionelt ejerskab og aktionærer
Columbia ETF Trust II - Columbia EM Core ex-China ETF (US:XCEM) har 167 institutionelle ejere og aktionærer, der har indsendt 13D/G- eller 13F-formularer til Securities Exchange Commission (SEC). Disse institutioner har i alt 27,849,495 aktier. Største aktionærer omfatter Morgan Stanley, Bank Of America Corp /de/, Northwestern Mutual Wealth Management Co, Penserra Capital Management LLC, LPL Financial LLC, TBFG - The Brinsmere Fund - Growth ETF, Marotta Asset Management, Raymond James Financial Inc, Flaharty Asset Management, LLC, and O'Brien Wealth Partners LLC .
Columbia ETF Trust II - Columbia EM Core ex-China ETF (ARCA:XCEM) institutionel ejerskabsstruktur viser aktuelle positioner i virksomheden efter institutioner og fonde, samt seneste ændringer i positionsstørrelse. Større aktionærer kan omfatte individuelle investorer, investeringsforeninger, hedgefonde eller institutioner. Skema 13D angiver, at investoren besidder (eller besidder) mere end 5 % af virksomheden og har til hensigt (eller har til hensigt at) aktivt at forfølge en ændring i forretningsstrategi. Skema 13G indikerer en passiv investering på over 5%.
The share price as of September 8, 2025 is 35,00 / share. Previously, on September 9, 2024, the share price was 31,79 / share. This represents an increase of 10,10% over that period.
Fondens stemningsscore
Fund Sentiment Score (fka Ownership Accumulation Score) finder de aktier, der bliver mest købt af fonde. Det er resultatet af en sofistikeret, multi-faktor kvantitativ model, der identificerer virksomheder med de højeste niveauer af institutionel akkumulering. Scoringsmodellen bruger en kombination af den samlede stigning i oplyste ejere, ændringerne i porteføljeallokeringer i disse ejere og andre målinger. Tallet går fra 0 til 100, hvor højere tal indikerer et højere niveau af akkumulering for sine jævnaldrende, og 50 er gennemsnittet.
Opdateringsfrekvens: Dagligt
Se Ownership Explorer, som giver en liste over højest rangerende virksomheder.
Institutionel Put/Call-forhold
Ud over at indberette standardaktie- og gældsudstedelser skal institutter med mere end 100 mill. aktiver under forvaltning også oplyse deres put- og call-optionsbeholdninger. Da salgsoptioner generelt indikerer negativ stemning, og købsoptioner indikerer positiv stemning, kan vi få en fornemmelse af den overordnede institutionelle stemning ved at plotte forholdet mellem put og kald. Diagrammet til højre viser det historiske put/call-forhold for dette instrument.
Brug af Put/Call Ratio som en indikator for investorernes stemning overvinder en af de vigtigste mangler ved at bruge totalt institutionelt ejerskab, som er, at en betydelig mængde af aktiver under forvaltning investeres passivt for at spore indekser. Passivt forvaltede fonde køber typisk ikke optioner, så indikatoren for put/call-forholdet følger mere nøje følelsen af aktivt forvaltede fonde.
13F og NPORT arkivering
Detaljer om 13F-arkivering er gratis. Detaljer om NP-ansøgninger kræver et premium-medlemskab. Grønne rækker angiver nye positioner. Røde rækker angiver lukkede positioner. Klik på linket ikon for at se den fulde transaktionshistorik.
Opgrader
for at låse premium-data op og eksportere til Excel ![]() .
.
| Fil dato | Kilde | Investor | Type | Gennemsnitlig pris (Øst) |
Aktier | Δ Aktier (%) |
Rapporteret Værdi ($1000) |
Δ Værdi (%) |
Port Alloc (%) |
|
|---|---|---|---|---|---|---|---|---|---|---|
| 2025-07-11 | 13F | Pinnacle Bancorp, Inc. | 1.816 | 0,00 | 62 | 16,98 | ||||
| 2025-08-14 | 13F | Royal Bank Of Canada | 6.636 | -85,46 | 227 | -83,16 | ||||
| 2025-08-13 | 13F | Northwestern Mutual Wealth Management Co | 1.604.767 | 192,92 | 54.851 | 239,00 | ||||
| 2025-08-14 | 13F | Jane Street Group, Llc | 229.428 | -52,61 | 7.842 | -45,16 | ||||
| 2025-04-25 | 13F | Avidian Wealth Solutions, LLC | 0 | -100,00 | 0 | |||||
| 2025-08-06 | 13F | O'Dell Group, LLC | 243.700 | -1,14 | 8.330 | 14,41 | ||||
| 2025-08-14 | 13F | Mml Investors Services, Llc | 7.418 | -19,99 | 0 | |||||
| 2025-07-25 | 13F | Retirement Planning Group, Llc / Ny | 12.893 | 2,14 | 441 | 18,28 | ||||
| 2025-07-08 | 13F | Richard P Slaughter Associates Inc | 190.789 | 5,06 | 6.521 | 21,59 | ||||
| 2025-08-08 | 13F | Avantax Advisory Services, Inc. | 12.908 | 13,02 | 441 | 30,86 | ||||
| 2025-07-30 | 13F | D.a. Davidson & Co. | 132.466 | -13,19 | 4.528 | 0,47 | ||||
| 2025-08-14 | 13F | Comerica Bank | 2.913 | -32,48 | 100 | -22,05 | ||||
| 2025-08-14 | 13F | Old Mission Capital Llc | 9.993 | -98,20 | 342 | -97,92 | ||||
| 2025-08-05 | 13F | Sigma Planning Corp | 30.484 | 28,80 | 1.042 | 48,93 | ||||
| 2025-07-22 | 13F | Belpointe Asset Management LLC | 45.048 | 1.540 | ||||||
| 2025-07-10 | 13F | Focus Financial Network, Inc. | 90.278 | 3,41 | 3.086 | 19,67 | ||||
| 2025-08-14 | 13F | Tennessee Valley Asset Management Partners | 0 | -100,00 | 0 | |||||
| 2025-08-14 | 13F/A | Rockefeller Capital Management L.P. | 66.318 | 22,31 | 2.267 | 41,54 | ||||
| 2025-08-06 | 13F | Commonwealth Equity Services, Llc | 571.374 | -10,39 | 20 | 5,56 | ||||
| 2025-08-14 | 13F | Graney & King, LLC | 1.087 | 0,00 | 37 | 15,63 | ||||
| 2025-08-05 | 13F | GPS Wealth Strategies Group, LLC | 20.294 | 22,50 | 694 | 41,72 | ||||
| 2025-08-12 | 13F | Main Management LLC | 125 | 0,00 | 0 | |||||
| 2025-04-30 | 13F | Ridgeline Wealth Planning, LLC | 0 | -100,00 | 0 | |||||
| 2025-08-13 | 13F | Vertex Planning Partners, LLC | 99.846 | -0,20 | 3.413 | 15,50 | ||||
| 2025-08-11 | 13F | Private Advisor Group, LLC | 149.448 | -9,14 | 5.108 | 5,17 | ||||
| 2025-08-19 | 13F | Advisory Services Network, LLC | 20.006 | -11,74 | 682 | 1,94 | ||||
| 2025-08-06 | 13F | Golden State Wealth Management, LLC | 816 | 0,00 | 28 | 12,50 | ||||
| 2025-07-17 | 13F | Halbert Hargrove Global Advisors, Llc | 5.136 | 176 | ||||||
| 2025-07-17 | 13F | KWB Wealth | 204.916 | -24,85 | 6.052 | -25,02 | ||||
| 2025-07-30 | 13F | Bogart Wealth, LLC | 900 | 0,00 | 31 | 15,38 | ||||
| 2025-07-24 | 13F | MA Private Wealth | 575.267 | -18,53 | 19.663 | -5,72 | ||||
| 2025-08-19 | 13F | National Asset Management, Inc. | 0 | -100,00 | 0 | |||||
| 2025-09-04 | 13F/A | Advisor Group Holdings, Inc. | 175.053 | -0,16 | 5.983 | 15,55 | ||||
| 2025-07-31 | 13F | CAP Partners, LLC | 0 | -100,00 | 0 | |||||
| 2025-08-11 | 13F | Advisor Resource Council | 0 | -100,00 | 0 | |||||
| 2025-08-01 | 13F | Koss-Olinger Consulting, LLC | 14.091 | -2,62 | 482 | 12,65 | ||||
| 2025-08-12 | 13F | SRS Capital Advisors, Inc. | 1.072 | -87,94 | 37 | -86,26 | ||||
| 2025-08-07 | 13F | McClarren Financial Advisors, Inc. | 0 | -100,00 | 0 | |||||
| 2025-07-23 | 13F | Watershed Private Wealth Llc | 80.351 | -48,94 | 2.746 | -40,91 | ||||
| 2025-07-29 | 13F | Private Trust Co Na | 610 | 46,99 | 21 | 66,67 | ||||
| 2025-08-14 | 13F | First Foundation Advisors | 246.547 | -21,43 | 8.427 | -9,09 | ||||
| 2025-08-11 | 13F | United Advisor Group, LLC | 55.478 | 19,14 | 1.896 | 37,89 | ||||
| 2025-08-13 | 13F | EverSource Wealth Advisors, LLC | 3.783 | 129 | ||||||
| 2025-08-26 | 13F/A | Thrivent Financial For Lutherans | 18.510 | 21,33 | 1 | |||||
| 2025-08-14 | 13F | Ameriprise Financial Inc | 291.840 | 468,84 | 9.975 | 557,98 | ||||
| 2025-08-14 | 13F | Syon Capital Llc | 451.576 | 8,92 | 15.435 | 26,04 | ||||
| 2025-08-12 | 13F | Planning Alternatives Ltd /adv | 324.394 | -0,54 | 11.088 | 15,09 | ||||
| 2025-07-29 | 13F | Activest Wealth Management | 0 | 0 | ||||||
| 2025-07-22 | 13F | Merit Financial Group, LLC | 36.694 | -15,21 | 1.254 | -1,88 | ||||
| 2025-07-24 | 13F | Eastern Bank | 53.748 | -12,03 | 1.837 | 1,83 | ||||
| 2025-07-25 | 13F | Northwest Capital Management Inc | 51.145 | -46,34 | 1.748 | -37,90 | ||||
| 2025-08-14 | 13F | Fmr Llc | 18.049 | -10,06 | 617 | 4,05 | ||||
| 2025-08-12 | 13F | Proequities, Inc. | 0 | 0 | ||||||
| 2025-08-08 | 13F | RAM Investment Partners, LLC | 0 | -100,00 | 0 | |||||
| 2025-08-25 | NP | IETFX - Morningstar Income and Growth ETF Asset Allocation Portfolio Class II | 14.930 | -10,30 | 510 | 3,87 | ||||
| 2025-08-25 | NP | BETFX - Morningstar Balanced ETF Asset Allocation Portfolio Class I | 75.025 | -28,97 | 2.564 | -17,79 | ||||
| 2025-04-24 | 13F | Wingate Wealth Advisors, Inc. | 0 | -100,00 | 0 | |||||
| 2025-08-18 | 13F | Arq Wealth Advisors, Llc | 132.419 | 0,00 | 3.911 | 0,00 | ||||
| 2025-07-25 | 13F | Gw Henssler & Associates Ltd | 14.800 | 0,00 | 506 | 15,56 | ||||
| 2025-08-14 | 13F | Susquehanna International Group, Llp | 25.467 | -91,49 | 870 | -90,15 | ||||
| 2025-07-21 | 13F | Fortis Capital Advisors, LLC | 45.048 | 1.540 | ||||||
| 2025-08-13 | 13F | Twin Peaks Wealth Advisors, LLC | 1.623 | 57 | ||||||
| 2025-08-12 | 13F | AlphaCore Capital LLC | 174.300 | 1,92 | 5.958 | 17,94 | ||||
| 2025-07-14 | 13F | Armstrong Advisory Group, Inc | 2.542 | 87 | ||||||
| 2025-08-11 | 13F | Aptus Capital Advisors, LLC | 165.093 | 3,04 | 5.643 | 19,23 | ||||
| 2025-07-16 | 13F | Pacific Sage Partners, LLC | 9.093 | 23,09 | 311 | 42,20 | ||||
| 2025-08-11 | 13F | Principal Securities, Inc. | 8.715 | 22,09 | 298 | 40,76 | ||||
| 2025-08-08 | 13F | New England Capital Financial Advisors LLC | 105.190 | 0,68 | 3.595 | 16,53 | ||||
| 2025-08-14 | 13F | GWM Advisors LLC | 43.625 | 7,13 | 1.491 | 24,04 | ||||
| 2025-08-14 | 13F | CoreCap Advisors, LLC | 34.365 | -2,55 | 1.174 | 12,78 | ||||
| 2025-07-31 | 13F | Leavell Investment Management, Inc. | 168.346 | 47,99 | 5.754 | 71,30 | ||||
| 2025-07-24 | 13F | McKinley Carter Wealth Services, Inc. | 233.358 | 112,56 | 7.976 | 146,02 | ||||
| 2025-07-15 | 13F | Highland Financial Advisors, LLC | 154.485 | -4,08 | 5.280 | 11,02 | ||||
| 2025-05-15 | 13F | Hrt Financial Lp | 0 | -100,00 | 0 | |||||
| 2025-07-15 | 13F | McAdam, LLC | 8.588 | -30,87 | 294 | -19,95 | ||||
| 2025-08-12 | 13F | Change Path, LLC | 21.147 | -2,76 | 723 | 12,46 | ||||
| 2025-07-09 | 13F | Krilogy Financial LLC | 123.229 | 2,12 | 4.212 | 18,15 | ||||
| 2025-08-05 | 13F | Mission Wealth Management, Lp | 7.431 | -4,08 | 254 | 10,96 | ||||
| 2025-08-01 | 13F | Envestnet Asset Management Inc | 95.127 | 172,95 | 3.251 | 215,94 | ||||
| 2025-08-05 | 13F | Telos Capital Management, Inc. | 21.058 | -6,54 | 720 | 8,12 | ||||
| 2025-08-06 | 13F | Nicholas Hoffman & Company, LLC. | 25.685 | 53,60 | 878 | 77,89 | ||||
| 2025-08-06 | 13F | Prospera Financial Services Inc | 80.028 | 3,04 | 2.735 | 19,28 | ||||
| 2025-08-13 | 13F | Legacy Capital Wealth Partners, LLC | 0 | -100,00 | 0 | |||||
| 2025-05-14 | 13F | Flow Traders U.s. Llc | 0 | -100,00 | 0 | |||||
| 2025-08-05 | 13F | Scarborough Advisors, LLC | 39.424 | 11,10 | 1.348 | 28,53 | ||||
| 2025-08-11 | 13F | Alps Advisors Inc | 410.990 | -32,74 | 14.048 | -22,16 | ||||
| 2025-04-30 | 13F | Valeo Financial Advisors, LLC | 0 | -100,00 | 0 | |||||
| 2025-05-12 | 13F | Quantinno Capital Management LP | 0 | -100,00 | 0 | |||||
| 2025-07-09 | 13F | O'Brien Wealth Partners LLC | 747.975 | 49,53 | 25.566 | 73,04 | ||||
| 2025-07-14 | 13F | U.S. Capital Wealth Advisors, LLC | 71.429 | -33,57 | 2.441 | -23,12 | ||||
| 2025-08-05 | 13F | Snider Financial Group | 15.564 | 8,92 | 532 | 25,83 | ||||
| 2025-08-14 | 13F | Diversify Advisory Services, LLC | 37.554 | 4,49 | 1.315 | 21,09 | ||||
| 2025-04-30 | 13F | Stonebrook Private Inc. | 0 | -100,00 | 0 | |||||
| 2025-08-14 | 13F | Principia Wealth Advisory, LLC | 84 | 0,00 | 3 | 0,00 | ||||
| 2025-07-09 | 13F | WealthCare Investment Partners, LLC | 66.231 | -26,63 | 2.301 | -12,18 | ||||
| 2025-08-14 | 13F | Bank Of America Corp /de/ | 2.817.275 | 1,62 | 96.294 | 17,61 | ||||
| 2025-08-04 | 13F | Amplius Wealth Advisors, LLC | 13.467 | -41,93 | 460 | -32,75 | ||||
| 2025-07-22 | 13F | Miracle Mile Advisors, LLC | 24.589 | -20,39 | 840 | -7,89 | ||||
| 2025-08-08 | 13F | Cetera Investment Advisers | 123.498 | 0,49 | 4.221 | 16,31 | ||||
| 2025-07-24 | 13F | IFP Advisors, Inc | 103 | 0,00 | 4 | 0,00 | ||||
| 2025-07-21 | 13F | Ameritas Advisory Services, LLC | 1.320 | 45 | ||||||
| 2025-08-14 | 13F | Redwood Financial Network Corp | 19.738 | 3,44 | 675 | 19,72 | ||||
| 2025-07-14 | 13F | Abound Wealth Management | 509 | 0,00 | 17 | 13,33 | ||||
| 2025-07-21 | 13F | DHJJ Financial Advisors, Ltd. | 34 | 0,00 | 1 | 0,00 | ||||
| 2025-08-05 | 13F | Sebold Capital Management, Inc. | 99.601 | -4,27 | 3.404 | 10,77 | ||||
| 2025-07-25 | 13F | ONE Advisory Partners, LLC | 10.842 | -92,43 | 378 | -91,08 | ||||
| 2025-07-31 | 13F | SoundView Advisors Inc. | 47.542 | 0,91 | 2 | 0,00 | ||||
| 2025-07-08 | 13F | Prism Advisors, Inc. | 553.088 | -30,31 | 18.905 | -19,35 | ||||
| 2025-07-17 | 13F | Janney Montgomery Scott LLC | 76.118 | -3,68 | 3 | 0,00 | ||||
| 2025-08-13 | 13F | Alerus Financial Na | 1.337 | 46 | ||||||
| 2025-08-12 | 13F | Gladstone Institutional Advisory LLC | 126.097 | 17,66 | 4.310 | 36,18 | ||||
| 2025-08-08 | 13F | Flaharty Asset Management, LLC | 789.437 | 1,22 | 26.983 | 17,13 | ||||
| 2025-07-22 | 13F | Wealthcare Advisory Partners LLC | 191.962 | 2,93 | 6.561 | 19,12 | ||||
| 2025-08-12 | 13F | CIBC Private Wealth Group, LLC | 19.277 | -0,65 | 659 | 27,27 | ||||
| 2025-08-14 | 13F | Atomi Financial Group, Inc. | 8.801 | 301 | ||||||
| 2025-08-25 | NP | GETFX - Morningstar Growth ETF Asset Allocation Portfolio Class I | 164.755 | -37,85 | 5.631 | -28,07 | ||||
| 2025-07-11 | 13F | Farther Finance Advisors, LLC | 22.425 | -79,85 | 766 | -76,89 | ||||
| 2025-07-28 | 13F | Kiker Wealth Management, LLC | 0 | -100,00 | 0 | |||||
| 2025-08-11 | 13F | Citigroup Inc | 4.753 | 162 | ||||||
| 2025-08-12 | 13F | Quadcap Wealth Management, LLC | 58.138 | 4,15 | 1.987 | 20,57 | ||||
| 2025-05-05 | 13F | Jackson Creek Investment Advisors LLC | 0 | -100,00 | 0 | |||||
| 2025-07-14 | 13F | LaFleur & Godfrey LLC | 12.867 | -0,73 | 440 | 14,92 | ||||
| 2025-07-23 | 13F | Heck Capital Advisors, LLC | 0 | -100,00 | 0 | |||||
| 2025-04-28 | 13F | Redmont Wealth Advisors Llc | 18.896 | 0,00 | 558 | -0,18 | ||||
| 2025-07-14 | 13F | Buttonwood Financial Group, LLC | 0 | -100,00 | 0 | |||||
| 2025-07-28 | 13F | RFG Advisory, LLC | 15.685 | 536 | ||||||
| 2025-08-05 | 13F | Westside Investment Management, Inc. | 4.724 | 1,40 | 161 | 17,52 | ||||
| 2025-08-14 | 13F | Goldman Sachs Group Inc | 0 | -100,00 | 0 | |||||
| 2025-08-14 | 13F | Guardian Wealth Advisors, Llc / Nc | 165.093 | 3,04 | 5.643 | 19,23 | ||||
| 2025-07-18 | 13F | BSW Wealth Partners | 8.278 | 5,29 | 283 | 21,55 | ||||
| 2025-08-25 | NP | AGTFX - Morningstar Aggressive Growth ETF Asset Allocation Portfolio Class I | 156.280 | -30,13 | 5.342 | -19,15 | ||||
| 2025-08-11 | 13F | Greykasell Wealth Strategies, Inc. | 0 | -100,00 | 0 | |||||
| 2025-07-25 | 13F | Cwm, Llc | 54.532 | -42,79 | 2 | -50,00 | ||||
| 2025-07-31 | 13F | Cambridge Investment Research Advisors, Inc. | 9.904 | 1,90 | 0 | |||||
| 2025-07-09 | 13F | Brand Asset Management Group, Inc. | 21.904 | 0,00 | 749 | 15,79 | ||||
| 2025-08-06 | 13F | Stone House Investment Management, LLC | 660 | -91,01 | 23 | -89,81 | ||||
| 2025-08-14 | 13F | Oxford Financial Group Ltd | 17.175 | 0,00 | 587 | 15,78 | ||||
| 2025-07-08 | 13F | First National Corp /ma/ /adv | 98.857 | 3,02 | 3.379 | 19,20 | ||||
| 2025-08-12 | 13F | Jpmorgan Chase & Co | 27.362 | -89,12 | 935 | -87,42 | ||||
| 2025-07-08 | 13F | Ehrlich Financial Group | 8.150 | -92,08 | 279 | -90,85 | ||||
| 2025-07-10 | 13F | Fortress Wealth Management, Inc. | 8.142 | -52,70 | 278 | -45,28 | ||||
| 2025-08-04 | 13F | Savvy Advisors, Inc. | 236.697 | -2,04 | 8.090 | 13,37 | ||||
| 2025-08-07 | 13F | Legacy Financial Advisors, Inc. | 34.455 | 127,98 | 1.178 | 163,90 | ||||
| 2025-08-15 | 13F | Kestra Advisory Services, LLC | 54.742 | 39,95 | 1.871 | 61,99 | ||||
| 2025-08-14 | 13F | McIlrath & Eck, LLC | 18.168 | 525,62 | 621 | 629,41 | ||||
| 2025-08-14 | 13F | Raymond James Financial Inc | 856.800 | -1,78 | 29.285 | 13,66 | ||||
| 2025-07-30 | 13F | Exencial Wealth Advisors, Llc | 79.226 | -2,64 | 2.708 | 12,65 | ||||
| 2025-07-16 | 13F | MKT Advisors LLC | 0 | -100,00 | 0 | |||||
| 2025-08-14 | 13F | Qube Research & Technologies Ltd | 7.942 | 10,97 | 271 | 28,44 | ||||
| 2025-08-26 | NP | TBFC - The Brinsmere Fund - Conservative ETF | 375.720 | 6,74 | 12.842 | 23,53 | ||||
| 2025-08-11 | 13F | Tidemark, LLC | 108 | -54,62 | 4 | -57,14 | ||||
| 2025-08-07 | 13F | CENTRAL TRUST Co | 306.581 | 1,31 | 10.479 | 17,24 | ||||
| 2025-07-07 | 13F | Centurion Wealth Management LLC | 0 | -100,00 | 0 | |||||
| 2025-07-17 | 13F | Beacon Capital Management, LLC | 0 | -100,00 | 0 | |||||
| 2025-08-07 | 13F | Hennion & Walsh Asset Management, Inc. | 649.375 | 1,18 | 22.196 | 17,09 | ||||
| 2025-07-17 | 13F | Coastline Trust Co | 31.276 | -3,59 | 1.069 | 11,59 | ||||
| 2025-08-12 | 13F | LPL Financial LLC | 989.110 | -20,44 | 33.808 | -7,93 | ||||
| 2025-08-12 | 13F | Atlas Capital Advisors Llc | 3.639 | 0,00 | 124 | 15,89 | ||||
| 2025-07-09 | 13F | Breakwater Capital Group | 183.340 | -11,39 | 6.267 | 2,55 | ||||
| 2025-08-14 | 13F | UBS Group AG | 481.609 | -5,36 | 16.461 | 9,53 | ||||
| 2025-08-05 | 13F | Sheridan Capital Management, LLC | 0 | -100,00 | 0 | |||||
| 2025-08-14 | 13F | Citadel Advisors Llc | 6.670 | -50,38 | 228 | -42,82 | ||||
| 2025-07-23 | 13F | Nelson Capital Management, LLC | 145.076 | 4.959 | ||||||
| 2025-08-14 | 13F | Colony Group, LLC | 186.594 | 5,28 | 6.378 | 21,84 | ||||
| 2025-08-06 | 13F | Penserra Capital Management LLC | 1.319.497 | 52,29 | 45 | 80,00 | ||||
| 2025-07-30 | 13F | Bleakley Financial Group, LLC | 162.735 | 7,90 | 5.562 | 24,88 | ||||
| 2025-04-14 | 13F | Strategic Wealth Designers | 0 | -100,00 | 0 | -100,00 | ||||
| 2025-08-08 | 13F | Gts Securities Llc | 16.185 | 553 | ||||||
| 2025-07-18 | 13F | Pure Financial Advisors, Inc. | 11.058 | -5,95 | 378 | 8,65 | ||||
| 2025-08-07 | 13F | WESCAP Management Group, Inc. | 7.947 | 272 | ||||||
| 2025-08-13 | 13F | Brown Advisory Inc | 17.514 | 0,00 | 599 | 15,67 | ||||
| 2025-08-13 | 13F | Cerity Partners LLC | 449.478 | -4,83 | 15.363 | 10,14 | ||||
| 2025-08-07 | 13F | Allworth Financial LP | 1.264 | 0,00 | 43 | 16,22 | ||||
| 2025-05-13 | 13F | Skopos Labs, Inc. | 0 | -100,00 | 0 | |||||
| 2025-08-14 | 13F | Wells Fargo & Company/mn | 55.107 | 23,70 | 1.884 | 43,19 | ||||
| 2025-08-11 | 13F | HighTower Advisors, LLC | 197.700 | -3,71 | 6.757 | 11,43 | ||||
| 2025-07-02 | 13F | Marotta Asset Management | 876.654 | 0,98 | 29.964 | 5,66 | ||||
| 2025-07-28 | 13F | Cypress Wealth Services, LLC | 33.109 | -81,21 | 1.132 | -78,26 | ||||
| 2025-08-11 | 13F | Managed Asset Portfolios, Llc | 19.303 | 14,03 | 660 | 32,06 | ||||
| 2025-07-17 | 13F | Nelson, Van Denburg & Campbell Wealth Management Group, LLC | 6.414 | 219 | ||||||
| 2025-08-14 | 13F | Partners Capital Investment Group, Llp | 406.326 | -27,39 | 13.888 | -15,97 | ||||
| 2025-04-22 | 13F | Petra Financial Advisors Inc | 0 | -100,00 | 0 | |||||
| 2025-07-28 | 13F | Harbour Investments, Inc. | 999 | 7,19 | 34 | 25,93 | ||||
| 2025-07-23 | 13F | Financial Life Advisors | 127.507 | 2,78 | 4.358 | 18,94 | ||||
| 2025-08-08 | 13F | Smithfield Trust Co | 6.475 | 16,14 | 0 | |||||
| 2025-07-31 | 13F | Mason & Associates Inc | 90.514 | 2,87 | 3.094 | 19,05 | ||||
| 2025-08-14 | 13F | Stifel Financial Corp | 177.693 | 32,79 | 6.074 | 53,67 | ||||
| 2025-08-26 | NP | TBFG - The Brinsmere Fund - Growth ETF | 943.777 | 83,45 | 32.258 | 112,31 | ||||
| 2025-07-10 | 13F | CWC Advisors, LLC. | 28.898 | 8,05 | 988 | 25,10 | ||||
| 2025-08-08 | 13F | Creative Planning | 89.987 | -0,35 | 3.076 | 15,30 | ||||
| 2025-08-08 | 13F | Larson Financial Group LLC | 6.111 | -11,73 | 209 | 1,96 | ||||
| 2025-07-25 | 13F | Total Clarity Wealth Management, Inc. | 116.885 | 586,87 | 3.995 | 694,23 | ||||
| 2025-08-14 | 13F | Mariner, LLC | 17.264 | -88,21 | 590 | -86,36 | ||||
| 2025-08-15 | 13F | Morgan Stanley | 2.841.783 | -19,53 | 97.132 | -6,87 | ||||
| 2025-08-12 | 13F | MAI Capital Management | 1.751 | -19,31 | 60 | -7,81 | ||||
| 2025-08-13 | 13F | Cresset Asset Management, LLC | 22.393 | 0,00 | 765 | 15,73 | ||||
| 2025-07-29 | 13F | Smithbridge Asset Management Inc/de | 6.845 | -5,36 | 234 | 9,39 |