Grundlæggende statistik
| Institutionelle aktier (lange) | 296.500.543 - 69,92% (ex 13D/G) - change of -4,28MM shares -1,42% MRQ |
| Institutionel værdi (lang) | $ 3.343.690 USD ($1000) |
Institutionelt ejerskab og aktionærer
TeraWulf Inc. (US:WULF) har 428 institutionelle ejere og aktionærer, der har indsendt 13D/G- eller 13F-formularer til Securities Exchange Commission (SEC). Disse institutioner har i alt 296,500,543 aktier. Største aktionærer omfatter Vanguard Group Inc, BlackRock, Inc., Susquehanna International Group, Llp, D. E. Shaw & Co., Inc., Jane Street Group, Llc, Nomura Holdings Inc, Citadel Advisors Llc, Susquehanna International Group, Llp, Morgan Stanley, and Geode Capital Management, Llc .
TeraWulf Inc. (NasdaqCM:WULF) institutionel ejerskabsstruktur viser aktuelle positioner i virksomheden efter institutioner og fonde, samt seneste ændringer i positionsstørrelse. Større aktionærer kan omfatte individuelle investorer, investeringsforeninger, hedgefonde eller institutioner. Skema 13D angiver, at investoren besidder (eller besidder) mere end 5 % af virksomheden og har til hensigt (eller har til hensigt at) aktivt at forfølge en ændring i forretningsstrategi. Skema 13G indikerer en passiv investering på over 5%.
The share price as of April 14, 2026 is 20,95 / share. Previously, on April 15, 2025, the share price was 2,29 / share. This represents an increase of 814,85% over that period.

Fondens stemningsscore
Fund Sentiment Score (fka Ownership Accumulation Score) finder de aktier, der bliver mest købt af fonde. Det er resultatet af en sofistikeret, multi-faktor kvantitativ model, der identificerer virksomheder med de højeste niveauer af institutionel akkumulering. Scoringsmodellen bruger en kombination af den samlede stigning i oplyste ejere, ændringerne i porteføljeallokeringer i disse ejere og andre målinger. Tallet går fra 0 til 100, hvor højere tal indikerer et højere niveau af akkumulering for sine jævnaldrende, og 50 er gennemsnittet.
Opdateringsfrekvens: Dagligt
Se Ownership Explorer, som giver en liste over højest rangerende virksomheder.
AI+ Ask Fintel’s AI assistant about TeraWulf Inc..
Select a question to share a public post with an AI-crafted answer.
Thinking of good questions…
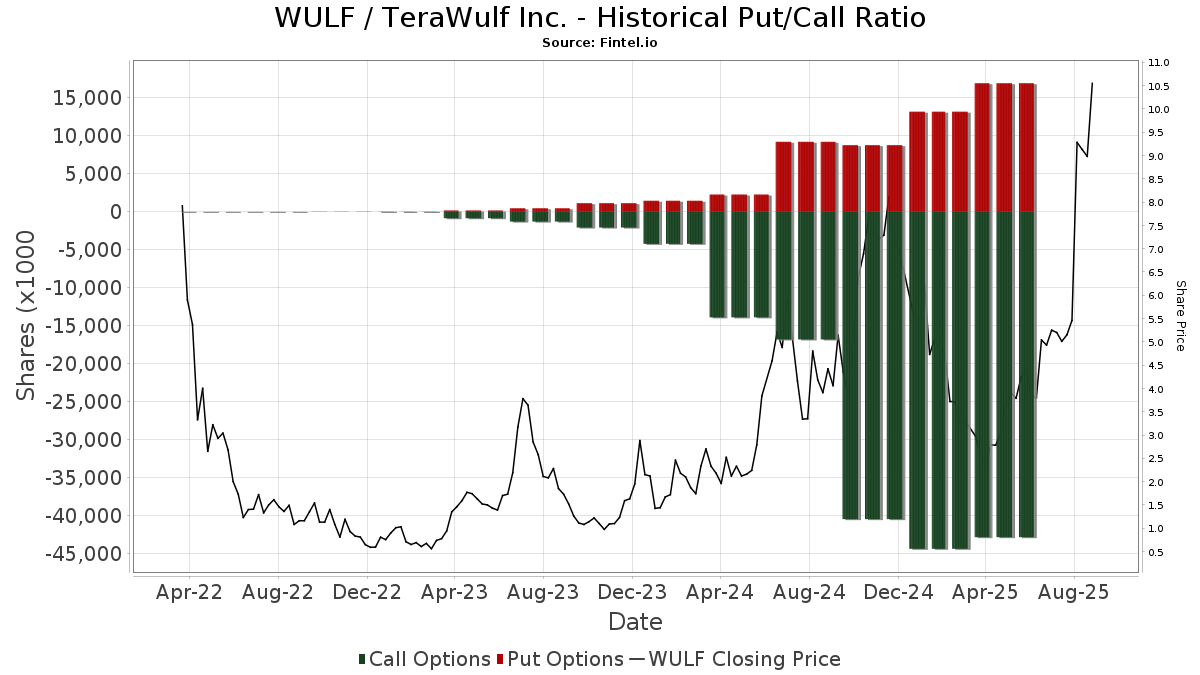
Institutionel Put/Call-forhold
Ud over at indberette standardaktie- og gældsudstedelser skal institutter med mere end 100 mill. aktiver under forvaltning også oplyse deres put- og call-optionsbeholdninger. Da salgsoptioner generelt indikerer negativ stemning, og købsoptioner indikerer positiv stemning, kan vi få en fornemmelse af den overordnede institutionelle stemning ved at plotte forholdet mellem put og kald. Diagrammet til højre viser det historiske put/call-forhold for dette instrument.
Brug af Put/Call Ratio som en indikator for investorernes stemning overvinder en af de vigtigste mangler ved at bruge totalt institutionelt ejerskab, som er, at en betydelig mængde af aktiver under forvaltning investeres passivt for at spore indekser. Passivt forvaltede fonde køber typisk ikke optioner, så indikatoren for put/call-forholdet følger mere nøje følelsen af aktivt forvaltede fonde.
13D/G-arkivering
Vi præsenterer 13D/G ansøgninger separat fra 13F ansøgninger på grund af den forskellige behandling af SEC. 13D/G-ansøgninger kan indgives af grupper af investorer (med én ledende), hvorimod 13F-ansøgninger ikke kan. Dette resulterer i situationer, hvor en investor kan indsende en 13D/G, der rapporterer én værdi for de samlede aktier (der repræsenterer alle de aktier, der ejes af investorgruppen), men derefter indsender en 13F, der rapporterer en anden værdi for de samlede aktier (der udelukkende repræsenterer deres egne) ejendomsret). Det betyder, at aktieejerskab af 13D/G-arkiver og 13F-arkiveringer ofte ikke er direkte sammenlignelige, så vi præsenterer dem separat.
Bemærk: Fra den 16. maj 2021 viser vi ikke længere ejere, der ikke har indsendt en 13D/G inden for det seneste år. Tidligere viste vi den fulde historie af 13D/G-arkiver. Generelt skal enheder, der er forpligtet til at indgive 13D/G-ansøgninger, indgive mindst årligt, før de indsender en afsluttende ansøgning. Dog forlader fonde nogle gange positioner uden at indsende en afsluttende ansøgning (dvs. de afvikler), så visning af den fulde historie resulterede nogle gange i forvirring om det nuværende ejerskab. For at undgå forvirring viser vi nu kun 'aktuelle' ejere - det vil sige - ejere, der har anmeldt inden for det seneste år.
Upgrade to unlock premium data.
| Fil dato | Form | Investor | Forrige Aktier |
Seneste Aktier |
Δ Aktier (Procent) |
Ejendomsret (Procent) |
Δ Ejerskab (Procent) |
|
|---|---|---|---|---|---|---|---|---|
| 2026-03-27 | VANGUARD GROUP INC | 33,643,009 | 0 | -100.00 | 0.00 | -100.00 | ||
| 2026-02-04 | JANE STREET GROUP, LLC | 20,739,133 | 17,677,746 | -14.76 | 4.20 | -17.65 | ||
| 2025-12-08 | Citadel Securities GP LLC | 22,799,811 | 5.40 | |||||
| 2025-08-29 | Bayshore Capital LLC | 20,076,021 | 20,076,021 | 0.00 | 4.90 | -18.33 | ||
| 2025-08-18 | Prager Paul B. | 49,707,285 | 43,364,058 | -12.76 | 10.70 | -52.44 | ||
| 2025-06-09 | Revolve Capital LLC | 19,746,465 | 18,985,071 | -3.86 | 4.90 | -39.51 |
13F og NPORT arkivering
Detaljer om 13F-arkivering er gratis. Detaljer om NP-ansøgninger kræver et premium-medlemskab. Grønne rækker angiver nye positioner. Røde rækker angiver lukkede positioner. Klik på linket ikon for at se den fulde transaktionshistorik.
Opgrader
for at låse premium-data op og eksportere til Excel ![]() .
.
| Fil dato | Kilde | Investor | Type | Gennemsnitlig pris (Øst) |
Aktier | Δ Aktier (%) |
Rapporteret Værdi ($1000) |
Δ Værdi (%) |
Port Alloc (%) |
|
|---|---|---|---|---|---|---|---|---|---|---|
| 2026-02-17 | 13F | Balyasny Asset Management Llc | Call | 156.600 | 1.799 | |||||
| 2026-02-10 | 13F | Thames Capital Management Llc | 770.267 | -46,84 | 8.850 | -46,52 | ||||
| 2026-02-13 | 13F | First Trust Advisors Lp | 900.000 | 70,63 | 10.341 | 71,68 | ||||
| 2026-02-17 | 13F | Beartown Capital Management, LLC | 2.000.000 | 22.980 | ||||||
| 2026-02-17 | 13F | Balyasny Asset Management Llc | Put | 39.700 | -77,31 | 456 | -77,18 | |||
| 2026-02-17 | 13F | Algert Global Llc | 307.710 | 173,74 | 4 | 200,00 | ||||
| 2026-01-09 | 13F | Tactive Advisors, LLC | 17.021 | -48,90 | 196 | -48,68 | ||||
| 2026-02-17 | 13F | Two Sigma Securities, Llc | 0 | -100,00 | 0 | -100,00 | ||||
| 2026-02-13 | 13F | Dockside LLC | 68.091 | 782 | ||||||
| 2026-02-05 | 13F | Cambridge Investment Research Advisors, Inc. | 26.801 | 50,20 | 0 | |||||
| 2026-02-06 | 13F | Covestor Ltd | Call | 329 | 0 | |||||
| 2026-02-13 | 13F | Vontobel Holding Ltd. | 19.406 | -19,70 | 223 | -19,27 | ||||
| 2026-01-15 | 13F | Nisa Investment Advisors, Llc | 77.580 | 0,26 | 891 | 0,91 | ||||
| 2026-01-20 | 13F | Signaturefd, Llc | Call | 0 | -100,00 | 0 | -100,00 | |||
| 2026-01-30 | 13F | State of New Jersey Common Pension Fund D | 179.738 | 2.065 | ||||||
| 2026-02-13 | 13F | Next Century Growth Investors Llc | 1.180.535 | 52,89 | 13.564 | 53,82 | ||||
| 2026-01-20 | 13F | Stratos Wealth Partners, LTD. | 38.292 | -0,04 | 440 | 0,46 | ||||
| 2026-02-13 | 13F | Alyeska Investment Group, L.P. | 0 | -100,00 | 0 | |||||
| 2026-02-11 | 13F | O'shaughnessy Asset Management, Llc | 17.953 | 206 | ||||||
| 2026-02-05 | 13F | Abacus Wealth Partners, LLC | 21.359 | 245 | ||||||
| 2026-04-07 | 13F | U.S. Capital Wealth Advisors, LLC | 16.000 | 231 | ||||||
| 2026-02-06 | 13F | Gsa Capital Partners Llp | 41.160 | -46,86 | 0 | |||||
| 2025-11-14 | 13F | Main Management ETF Advisors, LLC | 0 | -100,00 | 0 | |||||
| 2026-02-17 | 13F | XTX Topco Ltd | 11.885 | -93,58 | 137 | -93,57 | ||||
| 2026-02-09 | 13F | Jefferies Financial Group Inc. | Put | 122.500 | 1.408 | |||||
| 2026-02-09 | 13F | Jefferies Financial Group Inc. | Call | 350.000 | 4.022 | |||||
| 2026-02-09 | 13F | Jefferies Financial Group Inc. | 94.400 | 1.085 | ||||||
| 2026-02-13 | 13F | Sargent Investment Group, LLC | 29.535 | 6,43 | 339 | 7,28 | ||||
| 2026-02-18 | 13F | Vident Advisory, LLC | 1.276.810 | -6,83 | 14.671 | -6,26 | ||||
| 2026-02-13 | 13F | Mml Investors Services, Llc | 32.105 | 12,65 | 369 | 13,23 | ||||
| 2026-02-17 | 13F | Resolute Capital Asset Partners LLC | 40.000 | 460 | ||||||
| 2025-11-24 | 13F | Cherry Tree Wealth Management, LLC | 0 | -100,00 | 0 | |||||
| 2026-04-07 | 13F | Blueline Advisors Llc | 52 | 0,00 | 1 | |||||
| 2026-02-13 | 13F | 1832 Asset Management L.P. | 1.194.848 | 1.171,72 | 13.729 | 1.180,60 | ||||
| 2025-11-12 | 13F | Caitlin John, LLC | 0 | -100,00 | 0 | |||||
| 2025-11-12 | 13F | 111 Capital | 0 | -100,00 | 0 | |||||
| 2026-02-17 | 13F | Oxford Asset Management Llp | 63.209 | 726 | ||||||
| 2026-02-17 | 13F | J. Goldman & Co LP | 559.583 | 6.430 | ||||||
| 2026-02-17 | 13F | J. Goldman & Co LP | Call | 679.000 | 7.802 | |||||
| 2026-02-12 | 13F | Commonwealth Equity Services, Llc | 182.100 | -9,17 | 2.092 | 104.500,00 | ||||
| 2026-02-17 | 13F | Tower Research Capital LLC (TRC) | 6.014 | -74,06 | 69 | -73,86 | ||||
| 2026-02-03 | 13F | RFG Advisory, LLC | 101.862 | -0,53 | 1.170 | 0,09 | ||||
| 2026-02-17 | 13F | Aqr Capital Management Llc | 157.777 | 175,36 | 1.813 | 177,06 | ||||
| 2026-02-17 | 13F | Quadrature Capital Ltd | 97.134 | 1.116 | ||||||
| 2026-02-12 | 13F | Cibc World Markets Corp | 20.079 | -38,83 | 231 | 60,84 | ||||
| 2026-02-17 | 13F | Atom Investors LP | 98.639 | 1.133 | ||||||
| 2026-02-13 | 13F | MYDA Advisors LLC | 380.000 | 4.366 | ||||||
| 2026-02-02 | 13F | Strs Ohio | 47.900 | 91,60 | 550 | 92,98 | ||||
| 2026-02-24 | 13F | Tru Independence Asset Management 2, Llc | 0 | -100,00 | 0 | |||||
| 2026-02-17 | 13F | Clearline Capital LP | 12.755 | 0,00 | 147 | 0,69 | ||||
| 2026-01-28 | 13F | Universal- Beteiligungs- und Servicegesellschaft mbH | 657.953 | -35,45 | 7.408 | -36,37 | ||||
| 2026-01-29 | 13F | Sanctuary Advisors, LLC | 12.602 | -17,04 | 145 | -16,76 | ||||
| 2026-02-12 | 13F | Rossby Financial, LCC | 1.000 | 0,00 | 11 | 0,00 | ||||
| 2026-02-06 | 13F | Vestmark Advisory Solutions, Inc. | 36.596 | 420 | ||||||
| 2026-04-09 | 13F | Epiq Partners, Llc | 10.000 | 144 | ||||||
| 2026-02-13 | 13F | Solstein Capital, LLC | 3.000 | 34 | ||||||
| 2026-02-13 | 13F | SRS Capital Advisors, Inc. | 1.043 | 129,74 | 12 | 120,00 | ||||
| 2026-01-30 | 13F | R Squared Ltd | 22.207 | 4,99 | 255 | 5,81 | ||||
| 2026-02-12 | 13F | Dimensional Fund Advisors Lp | 0 | -100,00 | 0 | |||||
| 2026-02-06 | 13F | Global Retirement Partners, LLC | 5.702 | 1.184,23 | 66 | 1.200,00 | ||||
| 2026-02-11 | 13F | Clearbridge Investments, LLC | 839.662 | -17,79 | 9.648 | -17,29 | ||||
| 2026-02-17 | 13F | Alight Capital Management LP | Call | 150.000 | 1.724 | |||||
| 2025-11-17 | 13F | Harvest Investment Services, LLC | 0 | -100,00 | 0 | -100,00 | ||||
| 2026-02-17 | 13F | Alight Capital Management LP | 320.000 | 113,33 | 3.677 | 114,59 | ||||
| 2026-04-13 | 13F | IFP Advisors, Inc | 8.600 | -30,52 | 124 | -12,68 | ||||
| 2026-01-15 | 13F | Fortitude Family Office, LLC | 204 | -0,49 | 2 | 0,00 | ||||
| 2026-02-06 | 13F | Harvest Portfolios Group Inc. | 204.533 | -26,74 | 2.350 | -26,29 | ||||
| 2026-02-10 | 13F | Zweig-DiMenna Associates LLC | 1.871.700 | -0,64 | 21.506 | -0,03 | ||||
| 2026-02-13 | 13F | Brooklands Fund Management Ltd | 30.000 | 401 | ||||||
| 2026-02-17 | 13F | Bank Of America Corp /de/ | Put | 0 | -100,00 | 0 | ||||
| 2026-02-17 | 13F | Private Advisor Group, LLC | 22.632 | -14,34 | 260 | -13,62 | ||||
| 2026-02-13 | 13F | Motiv8 Investments LLC | 70 | 0 | ||||||
| 2026-02-17 | 13F | Bank Of America Corp /de/ | 5.289.274 | -12,79 | 60.774 | -12,26 | ||||
| 2026-02-11 | 13F | Franklin Resources Inc | 63.005 | 2,04 | 724 | 2,55 | ||||
| 2026-02-17 | 13F | Weiss Asset Management LP | 521.094 | 365,40 | 5.987 | 368,47 | ||||
| 2026-02-09 | 13F | Geode Capital Management, Llc | 8.377.589 | 3,96 | 96.274 | 4,60 | ||||
| 2026-02-17 | 13F | Kemnay Advisory Services Inc. | 1.327 | 15 | ||||||
| 2026-02-10 | 13F | Texas Yale Capital Corp. | 10.725 | 0,00 | 123 | 0,82 | ||||
| 2026-02-13 | 13F | Van Eck Associates Corp | 2.218.217 | 12,90 | 25 | 13,64 | ||||
| 2025-10-28 | 13F | Evolution Wealth Advisors, LLC | 0 | -100,00 | 0 | -100,00 | ||||
| 2026-04-13 | 13F | Cypress Point Wealth Management, LLC | 21.676 | -15,00 | 313 | 6,85 | ||||
| 2026-02-13 | 13F | Platform Technology Partners | 10.400 | 4,00 | 119 | 4,39 | ||||
| 2026-02-17 | 13F | Moore Capital Management, Lp | 740.198 | 8.505 | ||||||
| 2026-02-17 | 13F | Moore Capital Management, Lp | Call | 200.000 | 2.298 | |||||
| 2026-02-19 | 13F/A | Axxcess Wealth Management, Llc | 1.000.000 | 0,00 | 11.490 | 0,61 | ||||
| 2026-02-17 | 13F | Css Llc/il | Put | 64.000 | 735 | |||||
| 2026-02-02 | 13F | Wolverine Asset Management Llc | Put | 4.456.000 | 4,48 | 51.199 | 5,12 | |||
| 2026-02-13 | 13F | Lord, Abbett & Co. Llc | 1.086.254 | 25,88 | 12 | 33,33 | ||||
| 2026-04-08 | 13F | Sax Wealth Advisors, Llc | 16.148 | 0,00 | 186 | 0,00 | ||||
| 2026-02-02 | 13F | Danske Bank A/s | 1.100 | 13 | ||||||
| 2026-02-09 | 13F | Advent Capital Management /de/ | Call | 30.000 | 345 | |||||
| 2026-02-13 | 13F | Public Employees Retirement Association Of Colorado | 34.978 | 390,23 | 0 | |||||
| 2026-02-17 | 13F | Balyasny Asset Management Llc | 0 | -100,00 | 0 | -100,00 | ||||
| 2026-02-10 | 13F | Bank of New York Mellon Corp | 1.002.326 | 18,28 | 11.517 | 19,00 | ||||
| 2026-02-02 | 13F | Principal Financial Group Inc | 17.628 | -18,41 | 203 | -17,89 | ||||
| 2026-02-09 | 13F | GeoSphere Capital Management | 250.000 | 2.872 | ||||||
| 2026-02-12 | 13F | Voya Investment Management Llc | 689.195 | 83,42 | 7.919 | 84,53 | ||||
| 2026-02-17 | 13F | Mercer Global Advisors Inc /adv | 10.187 | 117 | ||||||
| 2025-11-14 | 13F | Point72 Asia (Singapore) Pte. Ltd. | 0 | -100,00 | 0 | -100,00 | ||||
| 2026-04-10 | 13F | Perigon Wealth Management, LLC | 44.962 | 344,82 | 649 | 458,62 | ||||
| 2026-02-13 | 13F | Bridgefront Capital, LLC | 0 | -100,00 | 0 | |||||
| 2026-02-17 | 13F | Trexquant Investment LP | 1.208.806 | 4,16 | 13.889 | 4,80 | ||||
| 2026-02-17 | 13F | Tudor Investment Corp Et Al | Put | 274.100 | 102,44 | 3.149 | 103,69 | |||
| 2026-02-13 | 13F | JustInvest LLC | 15.220 | 14,76 | 175 | 15,23 | ||||
| 2026-02-17 | 13F | Tudor Investment Corp Et Al | 598.238 | -75,11 | 6.874 | -74,96 | ||||
| 2026-02-17 | 13F | Tudor Investment Corp Et Al | Call | 319.600 | 246,64 | 3.672 | 249,05 | |||
| 2026-02-17 | 13F | Guggenheim Capital Llc | 17.652 | 203 | ||||||
| 2026-01-13 | 13F | Kathmere Capital Management, LLC | Call | 10.000 | 0,00 | 18 | -41,38 | |||
| 2026-02-17 | 13F | LMR Partners LLP | Call | 1.276.800 | 14.670 | |||||
| 2025-11-14 | 13F | Symmetry Investments LP | Call | 0 | -100,00 | 0 | ||||
| 2026-02-04 | 13F | Strait & Sound Wealth Management LLC | 12.550 | -9,71 | 144 | -8,86 | ||||
| 2026-02-10 | 13F | Intech Investment Management Llc | 123.812 | 13,92 | 1.423 | 14,59 | ||||
| 2026-01-21 | 13F | Steadtrust LLC | 0 | -100,00 | 0 | -100,00 | ||||
| 2026-01-26 | 13F | Cwm, Llc | 2.402 | 44,26 | 0 | |||||
| 2026-02-10 | 13F | Goldman Sachs Group Inc | Call | 1.880.000 | -21,88 | 21.601 | -21,40 | |||
| 2026-04-08 | 13F | Arlington Trust Co LLC | 80 | 1 | ||||||
| 2026-02-10 | 13F | Goldman Sachs Group Inc | Put | 680.000 | -38,18 | 7.813 | -37,80 | |||
| 2026-02-17 | 13F | Engineers Gate Manager LP | 481.515 | -51,33 | 5.533 | -51,03 | ||||
| 2026-02-10 | 13F | Goldman Sachs Group Inc | 1.846.553 | -53,18 | 21.217 | -52,90 | ||||
| 2026-02-13 | 13F | GM Advisory Group, Inc. | 305.778 | 30,23 | 3.513 | 31,03 | ||||
| 2026-04-15 | 13F | Blue Square Asset Management, Llc | 18.000 | 12,50 | 260 | 41,53 | ||||
| 2026-03-04 | 13F/A | Savant Capital, LLC | 0 | -100,00 | 0 | |||||
| 2026-02-12 | 13F | Ensign Peak Advisors, Inc | 25.250 | -57,24 | 290 | -56,97 | ||||
| 2025-11-12 | 13F | HAP Trading, LLC | Call | 273.100 | 1.029 | |||||
| 2026-02-17 | 13F | Gladstone Institutional Advisory LLC | 19.054 | 33,62 | 219 | 34,57 | ||||
| 2026-02-17 | 13F | Captrust Financial Advisors | 21.958 | 91,46 | 252 | 93,85 | ||||
| 2026-02-12 | 13F | EAM Investors, LLC | 197.362 | -50,96 | 2.268 | -49,87 | ||||
| 2026-02-17 | 13F | Lazard Asset Management Llc | Put | 32.000 | 368 | |||||
| 2026-02-17 | 13F | Soros Capital Management Llc | 726.500 | 61,09 | 8.347 | 62,08 | ||||
| 2025-11-14 | 13F | Point72 (DIFC) Ltd | 8.708 | -88,66 | 99 | -70,54 | ||||
| 2026-02-17 | 13F | Lazard Asset Management Llc | 317.187 | 3.644 | ||||||
| 2026-02-17 | 13F | Lazard Asset Management Llc | Call | 50.000 | 574 | |||||
| 2026-01-29 | 13F | UBS Group AG | Put | 2.295.600 | 31,70 | 26.376 | 32,51 | |||
| 2026-01-29 | 13F | UBS Group AG | Call | 2.981.500 | 262,93 | 34.257 | 265,17 | |||
| 2026-01-29 | 13F | UBS Group AG | 3.471.510 | 28,39 | 39.888 | 29,18 | ||||
| 2026-02-17 | 13F | Merewether Investment Management, LP | 2.164.500 | 24.870 | ||||||
| 2026-02-12 | 13F | Skopos Labs, Inc. | 11.236 | 128 | ||||||
| 2025-10-20 | 13F | XML Financial, LLC | 0 | -100,00 | 0 | -100,00 | ||||
| 2026-02-12 | 13F | State Board Of Administration Of Florida Retirement System | 40.650 | 0,00 | 467 | 0,65 | ||||
| 2026-04-14 | 13F | Seven Mile Advisory | 55.970 | 808 | ||||||
| 2025-11-14 | 13F | Science & Technology Partners, L.P. | 0 | -100,00 | 0 | |||||
| 2026-01-21 | 13F | Sound Income Strategies, LLC | 315 | 4 | ||||||
| 2026-02-03 | 13F | SBI Securities Co., Ltd. | 23.033 | -39,46 | 265 | -39,17 | ||||
| 2026-02-12 | 13F | Groupe la Francaise | 0 | -100,00 | 0 | |||||
| 2026-01-28 | 13F | CAPROCK Group, Inc. | 12.567 | 144 | ||||||
| 2025-11-05 | 13F | Anthracite Investment Company, Inc. | 0 | -100,00 | 0 | |||||
| 2026-02-13 | 13F | Landscape Capital Management, L.l.c. | 0 | -100,00 | 0 | |||||
| 2026-02-17 | 13F | Price T Rowe Associates Inc /md/ | 295.673 | -92,71 | 3 | -93,48 | ||||
| 2026-02-18 | 13F | Galaxy Group Investments LLC | 116.373 | 1.337 | ||||||
| 2026-02-17 | 13F | Vennlight Capital Management, LP | 419.396 | 139,48 | 4.819 | 141,02 | ||||
| 2026-02-17 | 13F | Bayesian Capital Management, LP | 28.600 | 329 | ||||||
| 2026-02-17 | 13F | Vennlight Capital Management, LP | Call | 57.500 | 661 | |||||
| 2026-01-29 | 13F | Vanguard Group Inc | 33.643.009 | 37,43 | 386.558 | 38,27 | ||||
| 2026-02-17 | 13F | Hidden Lake Asset Management LP | 594.476 | 6.831 | ||||||
| 2026-03-23 | 13F | Galaxy Digital Capital Management GP LLC | 116.373 | 1.337 | ||||||
| 2026-02-13 | 13F | Colony Group, LLC | 11.577 | 133 | ||||||
| 2025-11-14 | 13F | Mount Yale Investment Advisors, LLC | 0 | -100,00 | 0 | -100,00 | ||||
| 2026-04-15 | 13F | Exchange Traded Concepts, Llc | 1.139.569 | -8,69 | 16.444 | 14,67 | ||||
| 2026-02-11 | 13F | BIT Capital GmbH | 1.157.735 | 57,05 | 13.302 | 58,02 | ||||
| 2025-11-14 | 13F | Cubist Systematic Strategies, LLC | Call | 280.400 | 3.202 | |||||
| 2026-02-17 | 13F | Cresset Asset Management, LLC | 533.791 | -10,45 | 6.133 | -9,90 | ||||
| 2025-11-14 | 13F | Cubist Systematic Strategies, LLC | 1.015.560 | 11.598 | ||||||
| 2025-11-14 | 13F | Cubist Systematic Strategies, LLC | Put | 12.000 | 137 | |||||
| 2026-02-12 | 13F | Marex Group plc | 1.776.863 | 20.416 | ||||||
| 2026-02-17 | 13F | Abel Hall, LLC | 22.473 | 258 | ||||||
| 2026-01-06 | 13F | Arlington Capital Management, Inc. | 184.105 | 2.115 | ||||||
| 2026-02-05 | 13F | Requisite Capital Management, LLC | 79.723 | 5,43 | 916 | 6,14 | ||||
| 2026-02-10 | 13F | Skaana Management L.P. | 0 | -100,00 | 0 | -100,00 | ||||
| 2026-02-17 | 13F | Numerai GP LLC | 127.715 | 255,65 | 1.467 | 257,80 | ||||
| 2026-02-17 | 13F | Banco Bilbao Vizcaya Argentaria, S.a. | 0 | -100,00 | 0 | |||||
| 2026-02-17 | 13F | Voleon Capital Management Lp | 12.450 | 143 | ||||||
| 2026-02-11 | 13F | Ameritas Investment Partners, Inc. | 25.060 | 288 | ||||||
| 2026-02-17 | 13F | LMR Partners LLP | 0 | -100,00 | 0 | -100,00 | ||||
| 2026-02-06 | 13F | GPS Wealth Strategies Group, LLC | 1.055 | -70,61 | 12 | -70,00 | ||||
| 2026-02-17 | 13F/A | Cantor Fitzgerald, L. P. | 0 | -100,00 | 0 | -100,00 | ||||
| 2026-02-10 | 13F | Acadian Asset Management Llc | 3.443 | 0 | ||||||
| 2025-11-12 | 13F | Intellectus Partners, LLC | 0 | -100,00 | 0 | |||||
| 2026-02-10 | 13F | Skaana Management L.P. | Put | 10.000 | 0,00 | 115 | 0,00 | |||
| 2026-02-17 | 13F | Two Sigma Investments, Lp | Put | 30.300 | 0,00 | 348 | 0,58 | |||
| 2026-02-17 | 13F | Alphadyne Asset Management, LLC | Call | 40.600 | 466 | |||||
| 2026-02-13 | 13F | Smartleaf Asset Management LLC | 535 | 172,96 | 6 | 150,00 | ||||
| 2026-02-17 | 13F | Alphadyne Asset Management, LLC | Put | 42.500 | 488 | |||||
| 2026-01-27 | 13F | GHP Investment Advisors, Inc. | 1.000 | 0,00 | 11 | 0,00 | ||||
| 2026-02-17 | 13F | Two Sigma Investments, Lp | 3.956.129 | -54,45 | 45.456 | -54,18 | ||||
| 2026-02-17 | 13F | Greenland Capital Management LP | Put | 100.000 | 1.149 | |||||
| 2026-01-21 | 13F | SJS Investment Consulting Inc. | 2.142 | 887,10 | 25 | 1.100,00 | ||||
| 2026-02-11 | 13F | MCF Advisors LLC | 1.438 | 45,84 | 17 | 45,45 | ||||
| 2026-02-04 | 13F | LRI Investments, LLC | 42 | 0 | ||||||
| 2026-02-17 | 13F | Sig Brokerage, Lp | Call | 222.500 | 315,89 | 2.557 | 319,02 | |||
| 2026-02-06 | 13F | Legato Capital Management LLC | 40.041 | 460 | ||||||
| 2026-02-17 | 13F | Sig Brokerage, Lp | Put | 112.500 | 125,00 | 1.293 | 126,27 | |||
| 2026-02-17 | 13F | Boothbay Fund Management, Llc | 211.204 | 32,38 | 2.427 | 33,22 | ||||
| 2026-02-12 | 13F | Bank Of Montreal /can/ | Put | 325.200 | -0,31 | 3.737 | 0,30 | |||
| 2026-02-12 | 13F | Bank Of Montreal /can/ | 333.400 | -0,22 | 3.831 | 0,39 | ||||
| 2026-02-13 | 13F | P Schoenfeld Asset Management Lp | Put | 963.100 | -64,98 | 11.066 | -64,77 | |||
| 2026-01-28 | 13F | WPG Advisers, LLC | 972 | 0,00 | 11 | 0,00 | ||||
| 2026-02-13 | 13F | P Schoenfeld Asset Management Lp | Call | 350.000 | 4.022 | |||||
| 2026-02-12 | 13F | Advisors Asset Management, Inc. | 6.742 | -0,88 | 77 | 0,00 | ||||
| 2026-02-17 | 13F | Gillson Capital LP | 0 | -100,00 | 0 | |||||
| 2026-02-13 | 13F | P Schoenfeld Asset Management Lp | 747.000 | -78,72 | 8.583 | -78,59 | ||||
| 2026-02-17 | 13F | Point72 Asset Management, L.P. | 6.374.256 | 2.843,16 | 73.240 | 2.861,59 | ||||
| 2026-02-17 | 13F | Point72 Asset Management, L.P. | Put | 941.000 | 276,40 | 10.812 | 278,70 | |||
| 2026-02-13 | 13F | Parkside Financial Bank & Trust | 274 | 0,00 | 3 | 0,00 | ||||
| 2026-02-17 | 13F | Point72 Asset Management, L.P. | Call | 1.027.500 | 903,42 | 11.806 | 909,84 | |||
| 2026-04-13 | 13F | Creative Financial Designs Inc /adv | 6.140 | 5,86 | 89 | 33,33 | ||||
| 2026-02-13 | 13F | Squarepoint Ops LLC | Put | 102.800 | 155,72 | 1.181 | 157,30 | |||
| 2026-02-13 | 13F | Centiva Capital, LP | Put | 1.539.800 | 207,96 | 17.692 | 209,84 | |||
| 2026-02-12 | 13F | Nuveen, LLC | 1.272.245 | 57,18 | 14.538 | 58,65 | ||||
| 2026-02-13 | 13F | Squarepoint Ops LLC | 2.806.968 | 412,25 | 32.252 | 415,45 | ||||
| 2026-02-06 | 13F | Bare Financial Services, Inc | 74 | 1 | ||||||
| 2026-04-07 | 13F | CoreCap Advisors, LLC | 700 | 0,00 | 10 | 25,00 | ||||
| 2026-02-09 | 13F | Hartland & Co., LLC | 0 | -100,00 | 0 | |||||
| 2026-02-13 | 13F | Johnson Investment Counsel Inc | 0 | -100,00 | 0 | |||||
| 2026-02-13 | 13F | Capula Management Ltd | 0 | -100,00 | 0 | -100,00 | ||||
| 2026-02-13 | 13F | Centiva Capital, LP | 1.054.432 | 12.115 | ||||||
| 2026-01-20 | 13F | Nvwm, Llc | 0 | -100,00 | 0 | |||||
| 2026-02-13 | 13F | Squarepoint Ops LLC | Call | 434.500 | 595,20 | 4.992 | 600,14 | |||
| 2026-02-13 | 13F | Centiva Capital, LP | Call | 405.900 | 4.664 | |||||
| 2026-02-17 | 13F | Alphadyne Asset Management, LLC | 193 | 2 | ||||||
| 2026-04-08 | 13F | Wealth Enhancement Advisory Services, Llc | 1.892.064 | 161,39 | 28.154 | 195,10 | ||||
| 2026-01-30 | 13F | Us Bancorp \de\ | 612 | 31,90 | 7 | 40,00 | ||||
| 2026-02-06 | 13F | Tortoise Investment Management, LLC | 153.218 | 0,00 | 1.760 | 0,63 | ||||
| 2026-02-13 | 13F | Victory Capital Management Inc | 165.533 | 496,49 | 1.902 | 501,58 | ||||
| 2026-02-17 | 13F | Advisory Services Network, LLC | 0 | -100,00 | 0 | |||||
| 2025-11-13 | 13F | Edmond De Rothschild Holding S.a. | 0 | -100,00 | 0 | |||||
| 2026-02-13 | 13F | Alpine Fox Capital LLC | 100.000 | 1.149 | ||||||
| 2026-01-29 | 13F | IMC-Chicago, LLC | 332.724 | 3.823 | ||||||
| 2026-01-15 | 13F | Royal Fund Management, LLC | 18.750 | 215 | ||||||
| 2026-02-12 | 13F | SWAN Capital LLC | 10 | -50,00 | 0 | |||||
| 2026-02-17 | 13F | Jump Financial, LLC | 741.173 | -68,90 | 8.516 | -68,71 | ||||
| 2026-02-12 | 13F | Ci Investments Inc. | 0 | -100,00 | 0 | |||||
| 2026-02-17 | 13F | Northern Trust Corp | 2.608.638 | 0,20 | 29.973 | 0,81 | ||||
| 2026-02-18 | 13F | Beacon Pointe Advisors, LLC | 68.880 | 791 | ||||||
| 2026-04-13 | 13F | GoalVest Advisory LLC | 50.000 | -56,37 | 722 | -45,21 | ||||
| 2026-02-13 | 13F | AlTi Global, Inc. | 409.847 | 1,75 | 4.709 | 2,39 | ||||
| 2026-02-13 | 13F | Headlands Technologies LLC | 160.161 | -63,24 | 1.840 | -63,02 | ||||
| 2026-01-09 | 13F | SG Americas Securities, LLC | 55.701 | 4,13 | 1 | |||||
| 2026-02-13 | 13F | Marshall Wace, Llp | 3.186.200 | 36.609 | ||||||
| 2026-02-17 | 13F | Quantinno Capital Management LP | 32.710 | 65,47 | 376 | 66,67 | ||||
| 2026-02-13 | 13F | Marnell Management LLC | 565.928 | 6.503 | ||||||
| 2026-02-13 | 13F | Manufacturers Life Insurance Company, The | 0 | -100,00 | 0 | |||||
| 2026-02-13 | 13F | Ubs Asset Management Americas Inc | 1.217.293 | 152,87 | 13.987 | 154,43 | ||||
| 2026-02-09 | 13F | Legal & General Group Plc | 331.273 | 6,61 | 3.806 | 7,27 | ||||
| 2026-02-13 | 13F | FORA Capital, LLC | 403.284 | 364,44 | 4.634 | 367,51 | ||||
| 2026-02-10 | 13F | Thoroughbred Financial Services, Llc | 134.600 | 1,62 | 2 | 0,00 | ||||
| 2025-11-14 | 13F | Wolverine Trading, Llc | 37.057 | 8,49 | 430 | 197,92 | ||||
| 2026-02-17 | 13F | Man Group plc | 786.034 | 9.032 | ||||||
| 2025-11-14 | 13F | Wolverine Trading, Llc | Call | 1.355.000 | 95,72 | 15.718 | 438,10 | |||
| 2026-02-17 | 13F | Citadel Advisors Llc | 7.621.915 | 147,80 | 87.576 | 149,32 | ||||
| 2025-11-14 | 13F | Wolverine Trading, Llc | Put | 478.800 | 58,54 | 5.554 | 335,95 | |||
| 2026-02-17 | 13F | Citadel Advisors Llc | Put | 7.842.000 | 44,98 | 90.105 | 45,86 | |||
| 2026-02-17 | 13F | Citadel Advisors Llc | Call | 13.306.500 | 18,97 | 152.892 | 19,69 | |||
| 2026-02-17 | 13F | Alliancebernstein L.p. | 320.683 | 12,64 | 3.685 | 13,32 | ||||
| 2025-11-14 | 13F | Verition Fund Management LLC | 0 | -100,00 | 0 | |||||
| 2026-02-17 | 13F | CastleKnight Management LP | 509.300 | -21,92 | 5.852 | -21,45 | ||||
| 2026-01-29 | 13F | Pictet Asset Management Holding SA | 151.005 | 178,80 | 1.735 | 180,74 | ||||
| 2026-02-17 | 13F | D. E. Shaw & Co., Inc. | Call | 3.845.000 | 41,62 | 44.179 | 42,49 | |||
| 2026-02-17 | 13F | D. E. Shaw & Co., Inc. | Put | 1.685.000 | 173,98 | 19.361 | 175,67 | |||
| 2026-02-17 | 13F | Lighthouse Investment Partners, LLC | 65.000 | 30,00 | 747 | 30,65 | ||||
| 2026-02-11 | 13F | Two Seas Capital LP | 4.502.794 | 16,92 | 51.737 | 17,64 | ||||
| 2026-01-26 | 13F | Private Trust Co Na | 681 | -15,09 | 8 | -22,22 | ||||
| 2026-01-23 | 13F | Valley National Advisers Inc | 200 | 0 | ||||||
| 2026-02-13 | 13F | Quarry LP | 0 | -100,00 | 0 | |||||
| 2026-02-17 | 13F | D. E. Shaw & Co., Inc. | 15.474.258 | 17,45 | 177.799 | 18,17 | ||||
| 2026-02-13 | 13F | Healthcare Of Ontario Pension Plan Trust Fund | 885.884 | 110,15 | 10.179 | 111,47 | ||||
| 2026-02-04 | 13F | Pensionmark Financial Group, Llc | 0 | -100,00 | 0 | |||||
| 2026-01-30 | 13F | North Star Investment Management Corp. | 200 | 2 | ||||||
| 2026-01-29 | 13F | UMA Financial Services, Inc. | 466 | 5 | ||||||
| 2026-02-13 | 13F | Nicholas Investment Partners, LP | 217.667 | 2.501 | ||||||
| 2026-02-13 | 13F | Toroso Investments, LLC | 2.766.336 | -9,39 | 31.785 | -8,83 | ||||
| 2025-10-22 | 13F | Geneos Wealth Management Inc. | 0 | -100,00 | 0 | -100,00 | ||||
| 2026-01-13 | 13F | Regatta Capital Group, Llc | 15.420 | -0,29 | 177 | 0,57 | ||||
| 2026-01-14 | 13F | ORG Partners LLC | 50 | 0,00 | 1 | |||||
| 2026-02-09 | 13F | Integrity Alliance, Llc. | 19.243 | 221 | ||||||
| 2026-02-10 | 13F | Foundations Investment Advisors, LLC | 24.745 | 284 | ||||||
| 2026-02-17 | 13F | Corigliano Investment Advisers, LLC | 47.000 | -6,00 | 540 | -5,43 | ||||
| 2026-02-17 | 13F | Voloridge Investment Management, Llc | 6.206.294 | 2,71 | 71.310 | 3,34 | ||||
| 2026-02-13 | 13F | Absolute Gestao de Investimentos Ltda. | 21.123 | 243 | ||||||
| 2026-02-17 | 13F | Palogic Value Management, L.P. | Call | 0 | -100,00 | 0 | ||||
| 2026-02-12 | 13F | Xponance, Inc. | 23.928 | 7,71 | 275 | 8,30 | ||||
| 2026-01-28 | 13F | Kingswood Wealth Advisors, Llc | 52.189 | 600 | ||||||
| 2026-02-13 | 13F | Neuberger Berman Group LLC | 13.502 | 28,92 | 155 | 30,25 | ||||
| 2026-02-17 | 13F | California State Teachers Retirement System | 288.426 | 0,73 | 3.314 | 1,38 | ||||
| 2026-02-13 | 13F | Mariner, LLC | 77.002 | 164,68 | 886 | 166,57 | ||||
| 2026-02-17 | 13F | Canada Pension Plan Investment Board | 2.600.057 | 29.875 | ||||||
| 2026-03-04 | 13F | SHP Wealth Management | 328 | 4 | ||||||
| 2026-01-29 | 13F | Camelot Portfolios, LLC | 10.000 | 115 | ||||||
| 2026-02-13 | 13F | Public Sector Pension Investment Board | 974.296 | 11.195 | ||||||
| 2026-01-30 | 13F | Levin Capital Strategies, L.p. | 10.000 | 115 | ||||||
| 2026-01-28 | 13F | Proathlete Wealth Management Llc | 40 | 5,26 | 0 | |||||
| 2026-02-17 | 13F | MIRAE ASSET GLOBAL ETFS HOLDINGS Ltd. | 1.961.009 | -34,11 | 22.530 | -33,71 | ||||
| 2026-02-17 | 13F | Creative Planning | 86.713 | 22,93 | 996 | 23,73 | ||||
| 2026-02-17 | 13F | Capital Fund Management S.a. | Put | 29.700 | 341 | |||||
| 2026-02-17 | 13F | Capital Fund Management S.a. | Call | 215.400 | 2.475 | |||||
| 2026-02-13 | 13F | Clearfield Capital Management Lp | 111.700 | 1.283 | ||||||
| 2025-11-21 | 13F/A | CIBC Bancorp USA Inc. | 30.260 | 346 | ||||||
| 2026-03-20 | 13F | Purpose Unlimited Inc. | 98.297 | 1.129 | ||||||
| 2025-12-02 | 13F | Allworth Financial LP | Call | 10 | ||||||
| 2026-01-21 | 13F | Greenleaf Trust | 19.153 | 0,00 | 220 | 0,92 | ||||
| 2026-02-12 | 13F | Brinker Capital Investments, LLC | 18.511 | 77,51 | 213 | 78,15 | ||||
| 2026-02-13 | 13F | Capula Management Ltd | Call | 50.000 | -64,54 | 574 | -64,35 | |||
| 2026-02-06 | 13F | EverSource Wealth Advisors, LLC | 428 | -25,69 | 5 | -33,33 | ||||
| 2026-02-13 | 13F | Capula Management Ltd | Put | 50.000 | -64,54 | 574 | -64,35 | |||
| 2026-02-05 | 13F | Allworth Financial LP | 10.373 | 4,68 | 119 | 5,31 | ||||
| 2026-02-17 | 13F | Beartown Capital Management, LLC | Call | 400.000 | 4.596 | |||||
| 2026-03-26 | 13F/A | Peak6 Llc | 0 | -100,00 | 0 | -100,00 | ||||
| 2026-02-10 | 13F | KERR FINANCIAL PLANNING Corp | 27 | 0 | ||||||
| 2026-02-17 | 13F | Qube Research & Technologies Ltd | 0 | -100,00 | 0 | |||||
| 2026-01-26 | 13F | Means Investment Co., Inc. | Call | 11.100 | 8 | |||||
| 2026-02-17 | 13F | Scientech Research LLC | 0 | -100,00 | 0 | |||||
| 2025-11-14 | 13F | Lighthouse Investment Partners, LLC | Put | 0 | -100,00 | 0 | -100,00 | |||
| 2026-02-06 | 13F | Pnc Financial Services Group, Inc. | 7.722 | 44,44 | 89 | 44,26 | ||||
| 2026-02-11 | 13F | Vermillion Wealth Management, Inc. | 2.595 | 1.191,04 | 30 | 1.350,00 | ||||
| 2026-02-10 | 13F | Quantbot Technologies LP | 43.767 | -85,08 | 503 | -85,01 | ||||
| 2026-02-17 | 13F | Torno Capital, Llc | Call | 450.000 | 5.170 | |||||
| 2026-01-30 | 13F | Activest Wealth Management | 4.000 | 46 | ||||||
| 2026-02-17 | 13F | Torno Capital, Llc | 5.000 | 57 | ||||||
| 2026-02-03 | 13F | International Assets Investment Management, Llc | 200 | 2 | ||||||
| 2026-02-10 | 13F | Axq Capital, Lp | 43.258 | 497 | ||||||
| 2026-02-13 | 13F | DeepCurrents Investment Group LLC | Call | 9.000 | 350,00 | 10.341 | 352,76 | |||
| 2026-02-13 | 13F | DeepCurrents Investment Group LLC | 100.000 | 1.149 | ||||||
| 2026-02-17 | 13F | Parallax Volatility Advisers, L.P. | 269.651 | -83,93 | 3.098 | -83,83 | ||||
| 2026-02-17 | 13F | Parallax Volatility Advisers, L.P. | Call | 5.121.000 | 189,60 | 58.840 | 191,39 | |||
| 2026-01-07 | 13F | Harbor Investment Advisory, Llc | 1.200 | -14,29 | 14 | -13,33 | ||||
| 2026-02-13 | 13F | Prudential Financial Inc | 73.405 | -38,80 | 843 | -38,42 | ||||
| 2026-02-17 | 13F | Parallax Volatility Advisers, L.P. | Put | 3.258.500 | 174,75 | 37.440 | 176,43 | |||
| 2026-04-08 | 13F | E Fund Management (Hong Kong) Co., Ltd. | 649 | 9 | ||||||
| 2026-02-11 | 13F | LPL Financial LLC | Call | 0 | -100,00 | 0 | -100,00 | |||
| 2026-02-17 | 13F | Nishkama Capital, LLC | 1.019.138 | -11,22 | 11.710 | -10,69 | ||||
| 2026-01-28 | 13F | N.E.W. Advisory Services LLC | 920 | 0,00 | 11 | 0,00 | ||||
| 2026-02-17 | 13F | Prelude Capital Management, Llc | 12.017 | -93,99 | 138 | -93,96 | ||||
| 2026-02-11 | 13F | Trivest Advisors Ltd | 401.875 | 4.618 | ||||||
| 2026-02-10 | 13F | CIBC Asset Management Inc | 15.939 | 183 | ||||||
| 2026-02-17 | 13F | Sona Asset Management (us) Llc | 125.000 | 1.436 | ||||||
| 2026-02-13 | 13F | Barclays Plc | Put | 431.500 | 4.958 | |||||
| 2026-02-13 | 13F | Barclays Plc | Call | 713.800 | 249,90 | 8.202 | 252,13 | |||
| 2026-02-13 | 13F | Barclays Plc | 839.323 | 26,60 | 9.644 | 27,37 | ||||
| 2026-02-17 | 13F | SIH Partners, LLLP | 16.573 | 190 | ||||||
| 2026-04-14 | 13F | Prospera Financial Services Inc | 0 | -100,00 | 0 | |||||
| 2026-01-16 | 13F | FNY Investment Advisers, LLC | Call | 40 | -13,04 | 0 | ||||
| 2026-02-17 | 13F | Nomura Holdings Inc | 2.998.941 | 21,58 | 34.458 | 22,32 | ||||
| 2026-02-17 | 13F | Nomura Holdings Inc | Call | 13.474.600 | 14,64 | 154.823 | 15,34 | |||
| 2026-02-17 | 13F | Nomura Holdings Inc | Put | 1.665.000 | -3,23 | 19.131 | -2,64 | |||
| 2026-02-17 | 13F | Schonfeld Strategic Advisors LLC | 678.340 | 225,44 | 7.794 | 227,48 | ||||
| 2026-02-17 | 13F | Sig Brokerage, Lp | 0 | -100,00 | 0 | |||||
| 2026-02-17 | 13F | Keebeck Wealth Management, LLC | 22.800 | 0,00 | 262 | 0,38 | ||||
| 2026-01-16 | 13F | FNY Investment Advisers, LLC | 13.200 | -74,00 | 0 | |||||
| 2026-02-10 | 13F | Hazlett, Burt & Watson, Inc. | 300 | 0,00 | 0 | |||||
| 2026-01-30 | 13F | Sigma Planning Corp | 31.550 | 6,71 | 363 | 7,42 | ||||
| 2026-02-06 | 13F | ProShare Advisors LLC | 56.731 | 16,87 | 652 | 17,51 | ||||
| 2026-01-28 | 13F | Chicago Partners Investment Group LLC | 0 | -100,00 | 0 | |||||
| 2026-02-13 | 13F/A | Abound Financial, Llc | 1.030 | 12 | ||||||
| 2026-02-04 | 13F | Virginia Retirement Systems Et Al | 10.600 | 122 | ||||||
| 2026-02-12 | 13F | Counterpoint Mutual Funds LLC | 250.853 | 2.882 | ||||||
| 2026-01-13 | 13F | Ferguson Wellman Capital Management, Inc | 15.610 | 179 | ||||||
| 2026-02-17 | 13F | Scoggin Management Lp | Put | 5.500.000 | 109,52 | 63.195 | 110,81 | |||
| 2026-01-27 | 13F | Members Advisory Group LLC | 0 | -100,00 | 0 | |||||
| 2026-02-05 | 13F | Am Investment Strategies Llc | 10.100 | 0,00 | 0 | |||||
| 2026-02-17 | 13F | Scoggin Management Lp | 6.325.000 | -7,66 | 72.674 | -7,10 | ||||
| 2026-02-17 | 13F | Scoggin Management Lp | Call | 6.850.000 | 61,18 | 78.706 | 62,16 | |||
| 2026-02-10 | 13F | Connor, Clark & Lunn Investment Management Ltd. | 2.653.730 | 37,34 | 30.491 | 38,18 | ||||
| 2026-02-03 | 13F | Navellier & Associates Inc | 36.319 | -30,17 | 417 | -29,68 | ||||
| 2026-02-11 | 13F | First Dallas Securities Inc. | 180.000 | 2.068 | ||||||
| 2026-03-05 | 13F | Gunpowder Capital Management, LLC dba Oliver Wealth Management | 5.370 | 62 | ||||||
| 2026-02-02 | 13F | Oppenheimer & Co Inc | 140.101 | 45,14 | 1.610 | 46,01 | ||||
| 2026-02-12 | 13F | Steward Partners Investment Advisory, Llc | 10.197 | 0,00 | 117 | 0,86 | ||||
| 2026-02-17 | 13F | Millennium Management Llc | Call | 300.000 | 434,76 | 3.447 | 438,59 | |||
| 2026-01-12 | 13F | World Equity Group, Inc. | 0 | -100,00 | 0 | |||||
| 2026-02-17 | 13F | Millennium Management Llc | Put | 1.000.000 | 1.682,53 | 11.490 | 1.695,31 | |||
| 2026-02-17 | 13F | Millennium Management Llc | 1.825.307 | -54,56 | 20.973 | -54,28 | ||||
| 2026-02-13 | 13F | Ranger Investment Management, L.P. | 182.000 | 2.091 | ||||||
| 2026-02-17 | 13F | SummitTX Capital, L.P. | 0 | -100,00 | 0 | |||||
| 2026-02-13 | 13F | Y-Intercept (Hong Kong) Ltd | 0 | -100,00 | 0 | |||||
| 2026-02-17 | 13F | Russell Investments Group, Ltd. | 156.029 | 303,43 | 1.793 | 306,35 | ||||
| 2026-02-17 | 13F | DZ BANK AG Deutsche Zentral Genossenschafts Bank, Frankfurt am Main | 541.149 | -11,49 | 6.218 | -10,96 | ||||
| 2026-01-28 | 13F | Evergreen Private Wealth LLC | 0 | -100,00 | 0 | |||||
| 2026-02-02 | 13F | Wolverine Asset Management Llc | 752.685 | 8.648 | ||||||
| 2026-02-17 | 13F | Fmr Llc | 6.367.776 | 123,88 | 73.166 | 125,25 | ||||
| 2026-02-17 | 13F | ExodusPoint Capital Management, LP | Put | 0 | -100,00 | 0 | -100,00 | |||
| 2026-02-17 | 13F | Mangrove Partners | 13.191 | 152 | ||||||
| 2026-01-16 | 13F | Marquette Asset Management, LLC | 43 | 0 | ||||||
| 2026-02-17 | 13F | Wellington Management Group Llp | 4.544.242 | 16,46 | 52.213 | 17,18 | ||||
| 2025-11-14 | 13F | Toronto Dominion Bank | 0 | -100,00 | 0 | -100,00 | ||||
| 2026-02-10 | 13F | Rothschild Investment Llc | 545 | 2,83 | 6 | 0,00 | ||||
| 2026-02-12 | 13F | Hollencrest Capital Management | 74.190 | -6,80 | 852 | -6,27 | ||||
| 2026-02-19 | 13F | Mcguire Capital Advisors Inc | 200 | 2 | ||||||
| 2026-02-04 | 13F | Swiss Life Asset Management Ltd | 14.664 | 0,00 | 168 | 0,60 | ||||
| 2026-02-17 | 13F | Private Advisor Group, LLC | Call | 0 | -100,00 | 0 | ||||
| 2026-02-12 | 13F | Hollencrest Capital Management | Call | 500 | -94,44 | 6 | -95,10 | |||
| 2026-02-17 | 13F | Raymond James Financial Inc | 114.314 | -78,87 | 1.313 | -78,74 | ||||
| 2026-02-12 | 13F | Federation des caisses Desjardins du Quebec | 1.900 | 26,67 | 22 | 23,53 | ||||
| 2026-02-09 | 13F | Keating Financial Advisory Services, Inc. | 9 | 0 | ||||||
| 2025-10-30 | 13F | Twin Peaks Wealth Advisors, LLC | 0 | -100,00 | 0 | |||||
| 2026-04-06 | 13F | Rosenberg Matthew Hamilton | 2.781 | -50,93 | 40 | -38,46 | ||||
| 2026-02-17 | 13F | Royal Bank Of Canada | 215.637 | 33,61 | 2.478 | 34,45 | ||||
| 2025-10-27 | 13F | Concurrent Investment Advisors, LLC | 0 | -100,00 | 0 | -100,00 | ||||
| 2026-02-11 | 13F | Deutsche Bank Ag\ | 535.875 | 5,31 | 6.157 | 5,95 | ||||
| 2026-02-09 | 13F | Quest Partners LLC | 15.573 | -76,06 | 179 | -76,01 | ||||
| 2026-02-10 | 13F | Envestnet Asset Management Inc | 35.893 | -24,02 | 412 | -23,56 | ||||
| 2026-02-17 | 13F | ExodusPoint Capital Management, LP | Call | 0 | -100,00 | 0 | -100,00 | |||
| 2026-04-08 | 13F | Hardin Capital Partners, LLC | 25.000 | 38,89 | 361 | 74,76 | ||||
| 2026-02-11 | 13F | Winton Capital Group Ltd | 287.196 | -4,88 | 3.300 | -4,32 | ||||
| 2026-02-17 | 13F | ExodusPoint Capital Management, LP | 0 | -100,00 | 0 | -100,00 | ||||
| 2026-02-13 | 13F | Kestra Advisory Services, LLC | 0 | -100,00 | 0 | |||||
| 2026-01-13 | 13F | Stablepoint Partners, LLC | 10.000 | 115 | ||||||
| 2026-02-17 | 13F | Concentric Capital Strategies, LP | 110.475 | -22,92 | 1.269 | -22,43 | ||||
| 2026-02-05 | 13F | Tucker Asset Management Llc | 160 | 2 | ||||||
| 2026-02-17 | 13F | Shay Capital LLC | Call | 206.000 | -48,50 | 2.367 | -48,20 | |||
| 2026-02-06 | 13F | HighTower Advisors, LLC | Put | 0 | -100,00 | 0 | -100,00 | |||
| 2026-04-02 | 13F | Aspect Partners, LLC | 20 | -99,65 | 0 | -100,00 | ||||
| 2026-02-17 | 13F | Shay Capital LLC | 165.326 | -35,80 | 1.900 | -35,41 | ||||
| 2026-02-10 | 13F | Allen Investment Management LLC | 18.503 | 0,00 | 213 | 0,47 | ||||
| 2026-02-06 | 13F | HighTower Advisors, LLC | 87.069 | -6,89 | 1.000 | -6,28 | ||||
| 2026-02-17 | 13F | Optiver Holding B.V. | 2.595 | 56,23 | 30 | 61,11 | ||||
| 2026-04-14 | 13F | Nbc Securities, Inc. | 149.785 | 0,10 | 2.161 | 25,71 | ||||
| 2026-02-17 | 13F | Susquehanna International Group, Llp | Call | 16.221.000 | -20,78 | 186.379 | -20,29 | |||
| 2026-01-20 | 13F | Toth Financial Advisory Corp | 2.000 | 23 | ||||||
| 2026-02-17 | 13F | Susquehanna International Group, Llp | 2.848.703 | 428,72 | 32.732 | 431,95 | ||||
| 2026-01-21 | 13F | Raleigh Capital Management Inc. | 200 | 2 | ||||||
| 2026-02-17 | 13F | Susquehanna International Group, Llp | Put | 10.223.200 | 43,56 | 117.465 | 44,44 | |||
| 2026-02-05 | 13F | Phoenix Holdings Ltd. | 22.359 | 0,00 | 257 | 0,39 | ||||
| 2025-11-12 | 13F | Clare Market Investments LLC | 115.979 | 1.324 | ||||||
| 2026-01-29 | 13F | Comerica Bank | 19.629 | -19,68 | 226 | -19,35 | ||||
| 2026-02-13 | 13F | MYDA Advisors LLC | Call | 0 | -100,00 | 0 | -100,00 | |||
| 2026-02-13 | 13F | Senator Investment Group LP | 85.000 | 977 | ||||||
| 2026-01-14 | 13F | Jfs Wealth Advisors, Llc | 40.000 | -11,11 | 460 | -10,53 | ||||
| 2026-01-14 | 13F | Q Fund Management (Hong Kong) Ltd | 24.000 | 276 | ||||||
| 2026-02-17 | 13F | National Asset Management, Inc. | 10.000 | 115 | ||||||
| 2026-02-11 | 13F | Group One Trading, L.p. | 225.836 | -82,47 | 2.595 | -82,37 | ||||
| 2026-02-17 | 13F | Capital Fund Management S.a. | 315.884 | 3.630 | ||||||
| 2025-11-07 | 13F | HighTower Advisors, LLC | Call | 0 | -100,00 | 0 | -100,00 | |||
| 2026-02-12 | 13F | Jane Street Group, Llc | 8.205.046 | -1,63 | 94.276 | -1,02 | ||||
| 2026-02-17 | 13F | Dark Forest Capital Management Lp | 132.892 | 62,77 | 1.527 | 63,73 | ||||
| 2026-02-12 | 13F | Jane Street Group, Llc | Call | 13.712.700 | 29,25 | 157.559 | 30,04 | |||
| 2026-04-07 | 13F | Cooper Financial Group | 15.334 | 221 | ||||||
| 2026-02-12 | 13F | Jane Street Group, Llc | Put | 7.303.900 | 147,67 | 83.922 | 149,19 | |||
| 2026-02-17 | 13F | Arosa Capital Management LP | Call | 2.710.000 | 31.138 | |||||
| 2026-02-17 | 13F | Fred Alger Management, Llc | 229.112 | 2.632 | ||||||
| 2026-02-17 | 13F | Arosa Capital Management LP | 292.870 | 3.365 | ||||||
| 2026-01-23 | 13F | Sippican Capital Advisors | 71.650 | 112,93 | 823 | 114,32 | ||||
| 2026-02-11 | 13F | Hodges Capital Management Inc. | 2.866.544 | -24,28 | 32.937 | -23,82 | ||||
| 2026-04-07 | 13F | Signaturefd, Llc | 9.607 | 6,26 | 139 | 33,98 | ||||
| 2026-02-09 | 13F | Harbour Investments, Inc. | 3.346 | 9,45 | 38 | 11,76 | ||||
| 2026-02-12 | 13F | CIBC Private Wealth Group, LLC | 368 | 26,46 | 4 | 33,33 | ||||
| 2026-02-05 | 13F | Central Asset Investments & Management Holdings (HK) Ltd | 0 | -100,00 | 0 | |||||
| 2026-02-17 | 13F | Silverback Asset Management Llc | 96.600 | 1.110 | ||||||
| 2026-02-13 | 13F | Integrated Wealth Concepts LLC | 30.552 | 113,38 | 351 | 115,34 | ||||
| 2026-01-14 | 13F | Hennion & Walsh Asset Management, Inc. | 33.407 | 384 | ||||||
| 2026-02-13 | 13F | Vontobel Holding Ltd. | Call | 0 | -100,00 | 0 | -100,00 | |||
| 2026-04-06 | 13F | Versant Capital Management, Inc | 226 | 3 | ||||||
| 2026-02-05 | 13F | Plante Moran Financial Advisors, LLC | 0 | -100,00 | 0 | |||||
| 2026-02-11 | 13F | Los Angeles Capital Management Llc | 56.112 | 13,60 | 832 | 47,34 | ||||
| 2026-02-17 | 13F | Feynman Point Asset Management LLC | 167.961 | 1.930 | ||||||
| 2026-02-17 | 13F | Limestone Investment Advisors LP | 0 | -100,00 | 0 | |||||
| 2026-02-13 | 13F | Brown Advisory Inc | 31.055 | -24,36 | 357 | -23,93 | ||||
| 2026-02-13 | 13F | State Street Corp | 7.349.508 | 4,24 | 84.446 | 4,87 | ||||
| 2026-02-17 | 13F | Elequin Capital Lp | 4.436 | 51 | ||||||
| 2026-02-17 | 13F | Ardsley Advisory Partners Lp | 1.165.000 | -2,92 | 13.386 | -2,58 | ||||
| 2026-02-17 | 13F | Gratia Capital, Llc | 304.038 | 3.493 | ||||||
| 2026-02-17 | 13F | Two Sigma Advisers, Lp | 2.137.800 | -72,97 | 24.563 | -72,80 | ||||
| 2026-02-18 | 13F | GWM Advisors LLC | 52.933 | 104,49 | 608 | 106,10 | ||||
| 2026-02-17 | 13F | Janus Henderson Group Plc | 451.832 | 241,29 | 5.190 | 243,41 | ||||
| 2026-01-07 | 13F | Harbour Capital Advisors, LLC | 96.620 | -3,64 | 1.231 | 1,40 | ||||
| 2026-02-10 | 13F | Norges Bank | 399.600 | 4.591 | ||||||
| 2026-02-17 | 13F | Ameriprise Financial Inc | 30.955 | 142,40 | 356 | 144,83 | ||||
| 2026-02-02 | 13F | CENTRAL TRUST Co | 1.000 | 11 | ||||||
| 2026-02-17 | 13F | Covalis (Gibraltar) Ltd | 939.911 | 10.800 | ||||||
| 2026-01-30 | 13F/A | M&t Bank Corp | 30.857 | 26,39 | 354 | 26,88 | ||||
| 2026-02-10 | 13F | Florida Financial Advisors, Llc | 18.037 | 72,97 | 207 | 73,95 | ||||
| 2026-01-05 | 13F | Catherine Avery Investment Management LLC | 0 | -100,00 | 0 | -100,00 | ||||
| 2026-02-17 | 13F | Yaupon Capital Management LP | 0 | -100,00 | 0 | |||||
| 2026-02-18 | 13F | Mackenzie Financial Corp | 16.403 | -2,81 | 183 | -5,21 | ||||
| 2026-01-13 | 13F | Stonehage Fleming Financial Services Holdings Ltd | 722 | 8 | ||||||
| 2026-02-13 | 13F | MAI Capital Management | 317 | 190,83 | 4 | 200,00 | ||||
| 2026-02-13 | 13F | Citigroup Inc | Put | 705.500 | 70.450,00 | 8.106 | 73.590,91 | |||
| 2026-02-13 | 13F | Citigroup Inc | 2.300.218 | -39,31 | 26.430 | -38,94 | ||||
| 2026-02-13 | 13F | ParaFi Capital LP | 200.200 | 2.300 | ||||||
| 2026-02-13 | 13F | Citigroup Inc | Call | 72.500 | -67,92 | 833 | -67,71 | |||
| 2026-01-21 | 13F | Kraematon Investment Advisors, Inc | 42.452 | 2,29 | 488 | 2,96 | ||||
| 2026-01-28 | 13F | Arizona State Retirement System | 84.541 | -6,74 | 971 | -6,18 | ||||
| 2026-02-11 | 13F | Parallel Advisors, LLC | 358 | -32,96 | 4 | -33,33 | ||||
| 2026-02-10 | 13F | Bnp Paribas Arbitrage, Sa | 63.166 | -83,08 | 726 | -82,99 | ||||
| 2026-02-11 | 13F | Inceptionr Llc | 0 | -100,00 | 0 | -100,00 | ||||
| 2026-02-26 | 13F | TD Capital Management LLC | 120 | 0,00 | 1 | 0,00 | ||||
| 2026-02-17 | 13F | Fortress Investment Group LLC | 0 | -100,00 | 0 | |||||
| 2026-02-17 | 13F | Driehaus Capital Management Llc | 5.864.195 | -34,89 | 67.380 | -34,49 | ||||
| 2026-02-13 | 13F | Walleye Trading LLC | 38.533 | 443 | ||||||
| 2026-02-12 | 13F | BlackRock, Inc. | 27.897.829 | 7,27 | 320.546 | 7,93 | ||||
| 2026-02-13 | 13F | Walleye Trading LLC | Put | 1.089.300 | 9,01 | 12.516 | 9,67 | |||
| 2026-02-13 | 13F | Walleye Trading LLC | Call | 2.218.800 | 62,16 | 25.494 | 63,16 | |||
| 2026-02-13 | 13F | Gts Securities Llc | 16.325 | 46,41 | 188 | 47,24 | ||||
| 2026-02-12 | 13F | MetLife Investment Management, LLC | 167.494 | 1,36 | 1.925 | 1,96 | ||||
| 2026-02-12 | 13F | Hrt Financial Lp | 1.881.982 | -14,46 | 22 | -16,00 | ||||
| 2026-02-02 | 13F | Truist Financial Corp | 51.714 | -0,17 | 594 | 0,51 | ||||
| 2026-01-26 | 13F | Lionsbridge Wealth Management LLC | 146.157 | -8,20 | 1.679 | -7,65 | ||||
| 2026-02-11 | 13F | Jpmorgan Chase & Co | 726.418 | -83,78 | 8.347 | -83,68 | ||||
| 2026-02-11 | 13F | Simplex Trading, Llc | 1.941.017 | 125,12 | 22.302 | 247.700,00 | ||||
| 2025-11-13 | 13F | Banque Cantonale Vaudoise | 0 | -100,00 | 0 | |||||
| 2026-02-13 | 13F | Police & Firemen's Retirement System of New Jersey | 81.725 | 3,78 | 939 | 4,45 | ||||
| 2026-01-28 | 13F | Teacher Retirement System Of Texas | 10.016 | -74,97 | 115 | -74,84 | ||||
| 2026-02-17 | 13F | RiverPark Advisors, LLC | 3.576 | 41 | ||||||
| 2026-01-12 | 13F | Edge Wealth Management LLC | 20.000 | 0,00 | 230 | 0,44 | ||||
| 2026-02-17 | 13F | Permanens Capital L.P. | 0 | -100,00 | 0 | -100,00 | ||||
| 2026-02-11 | 13F | Arsenal Capital Advisors LLC | 63.565 | 730 | ||||||
| 2026-02-13 | 13F | Charles Schwab Investment Management Inc | 2.697.924 | 6,51 | 30.999 | 7,16 | ||||
| 2026-02-13 | 13F | Sei Investments Co | 67.450 | -7,44 | 775 | -6,97 | ||||
| 2026-01-28 | 13F | Klp Kapitalforvaltning As | 65.800 | 1,70 | 756 | 2,44 | ||||
| 2026-02-17 | 13F | CastleKnight Management LP | Call | 0 | -100,00 | 0 | ||||
| 2025-11-13 | 13F | Chesapeake Capital Corp /il/ | 0 | -100,00 | 0 | |||||
| 2026-02-17 | 13F | Covalis Capital Llp | 2.427.296 | 27.890 | ||||||
| 2026-02-11 | 13F | Harvest Fund Management Co., Ltd | 7.851 | 0,00 | 0 | |||||
| 2026-02-17 | 13F | Value Aligned Research Advisors, LLC | 0 | -100,00 | 0 | |||||
| 2026-02-17 | 13F | Old Mission Capital Llc | 32.764 | 376 | ||||||
| 2026-02-11 | 13F | LPL Financial LLC | 291.715 | 12,49 | 3.352 | 13,17 | ||||
| 2026-02-06 | 13F | Handelsbanken Fonder AB | 84.400 | 1 | ||||||
| 2026-02-17 | 13F | Prelude Capital Management, Llc | Call | 0 | -100,00 | 0 | ||||
| 2026-01-16 | 13F | Ronald Blue Trust, Inc. | 1.000 | 0,00 | 11 | 0,00 | ||||
| 2026-02-17 | 13F | State Of Wisconsin Investment Board | 350.760 | -0,38 | 4.030 | 0,25 | ||||
| 2026-01-22 | 13F | Financial Consulate, Inc | 0 | -100,00 | 0 | |||||
| 2026-02-13 | 13F | Pinnacle Wealth Planning Services, Inc. | 114 | 1 | ||||||
| 2026-02-17 | 13F | Engle Capital Management, L.P. | 437.500 | 5.027 | ||||||
| 2026-04-07 | 13F | Farther Finance Advisors, LLC | 13.615 | -2,37 | 197 | 23,13 | ||||
| 2026-01-20 | 13F | AdvisorNet Financial, Inc | 3.250 | 0,00 | 37 | 0,00 | ||||
| 2026-02-23 | 13F | Virtu Financial LLC | 10.928 | -95,89 | 0 | -100,00 | ||||
| 2026-02-13 | 13F | Rhumbline Advisers | 360.591 | -8,75 | 4.143 | -8,18 | ||||
| 2026-02-17 | 13F | Brevan Howard Capital Management LP | 147.600 | 524,63 | 1.696 | 530,11 | ||||
| 2026-02-17 | 13F | Brevan Howard Capital Management LP | Put | 250.000 | 2.872 | |||||
| 2026-02-13 | 13F | Walleye Capital LLC | Call | 306.100 | 10,47 | 3.517 | 11,16 | |||
| 2026-02-10 | 13F/A | Northwestern Mutual Wealth Management Co | 449 | 12,25 | 5 | 25,00 | ||||
| 2026-02-13 | 13F | Walleye Capital LLC | Put | 384.400 | 112,49 | 4.417 | 113,85 | |||
| 2026-02-13 | 13F | Morgan Stanley | 9.641.209 | 8,12 | 110.778 | 8,79 | ||||
| 2026-02-13 | 13F | Walleye Capital LLC | 1.029.683 | 116,26 | 11.831 | 117,60 | ||||
| 2026-02-17 | 13F | Brevan Howard Capital Management LP | Call | 250.000 | 2.872 | |||||
| 2026-02-17 | 13F | Tortoise Capital Advisors, L.l.c. | 194.912 | 59,04 | 2.240 | 60,04 | ||||
| 2026-02-06 | 13F | Pinnbrook Capital Management Lp | Call | 0 | -100,00 | 0 | ||||
| 2026-02-13 | 13F | Sterling Capital Management LLC | 2.840 | 63,88 | 33 | 68,42 | ||||
| 2026-02-12 | 13F | New York State Common Retirement Fund | 162.323 | 96,76 | 1.865 | 97,98 | ||||
| 2026-04-06 | 13F | GAMMA Investing LLC | 2.706 | 95,38 | 39 | 160,00 | ||||
| 2025-11-14 | 13F | Daiwa Securities Group Inc. | 0 | -100,00 | 0 | |||||
| 2026-02-10 | 13F | Root Financial Partners, LLC | 10 | 0 | ||||||
| 2026-02-19 | 13F | Invesco Ltd. | 3.575.310 | 149,83 | 41.080 | 151,36 | ||||
| 2025-10-17 | 13F | Apollon Wealth Management, LLC | 0 | -100,00 | 0 | -100,00 | ||||
| 2026-02-02 | 13F | Montag A & Associates Inc | 0 | -100,00 | 0 | |||||
| 2026-02-13 | 13F | Rafferty Asset Management, LLC | 19.038 | 42,87 | 219 | 43,42 | ||||
| 2025-11-13 | 13F | Aurelius Capital Management, LP | 450.000 | 5.139 | ||||||
| 2026-02-11 | 13F | Next Capital Management LLC | 10.525 | 0,00 | 121 | 0,00 | ||||
| 2026-02-05 | 13F | Amalgamated Bank | 9.535 | 2,89 | 0 | |||||
| 2026-02-13 | 13F | Silicon Valley Capital Partners | 2.000 | 23 | ||||||
| 2026-02-12 | 13F | Federated Hermes, Inc. | 1.384 | -98,01 | 16 | -98,11 | ||||
| 2026-02-13 | 13F | National Bank Of Canada /fi/ | 2.860 | 55,43 | 33 | 60,00 | ||||
| 2026-02-06 | 13F | Larson Financial Group LLC | 302 | 3 | ||||||
| 2026-02-17 | 13F | Park West Asset Management LLC | 1.423.100 | 145,36 | 16.351 | 146,88 | ||||
| 2026-02-17 | 13F | Cetera Investment Advisers | 83.017 | -38,52 | 954 | -38,20 | ||||
| 2026-02-06 | 13F | Covestor Ltd | 164.053 | 73,44 | 2 | 0,00 | ||||
| 2026-01-30 | 13F | Wealthfront Advisers Llc | 20.830 | 34,94 | 239 | 35,80 | ||||
| 2026-01-27 | 13F | Atlantic Edge Private Wealth Management, LLC | 1.500 | 0,00 | 17 | 0,00 | ||||
| 2026-02-13 | 13F | Fieldview Capital Management, LLC | 12.777 | 147 | ||||||
| 2026-02-13 | 13F | Stifel Financial Corp | 40.326 | -24,19 | 463 | -23,72 | ||||
| 2025-11-17 | 13F | Sender Co & Partners, Inc. | 0 | -100,00 | 0 | |||||
| 2026-02-17 | 13F | One68 Global Capital, LLC | 11.626 | 134 | ||||||
| 2026-02-17 | 13F | Caption Management, LLC | Put | 3.672.500 | 112,65 | 42.197 | 113,96 | |||
| 2026-02-17 | 13F | Hamilton Wealth, LLC | 4.865 | -64,75 | 1.069 | 580,89 | ||||
| 2026-02-17 | 13F | Caption Management, LLC | Call | 5.664.600 | -3,72 | 65.086 | -3,13 | |||
| 2026-02-17 | 13F | Caption Management, LLC | 1.664.636 | 19.127 | ||||||
| 2026-02-13 | 13F | Wells Fargo & Company/mn | 449.908 | -54,25 | 5.169 | -53,97 | ||||
| 2026-02-17 | 13F | Azora Capital LP | 0 | -100,00 | 0 | |||||
| 2026-01-30 | 13F | Archer Investment Corp | 392 | -65,97 | 5 | -69,23 | ||||
| 2026-02-17 | 13F | Quantitative Investment Management, LLC | 18.516 | 0 | ||||||
| 2026-02-11 | 13F | J.w. Cole Advisors, Inc. | 20.509 | -37,61 | 236 | -37,33 | ||||
| 2026-02-14 | 13F | Rockefeller Capital Management L.P. | 1.790 | 21 | ||||||
| 2026-02-12 | 13F | Swiss National Bank | 606.500 | 2,04 | 6.969 | 2,65 | ||||
| 2025-11-14 | 13F | Ardsley Advisory Partners Lp | Call | 0 | -100,00 | 0 | -100,00 | |||
| 2026-02-12 | 13F | Quadrant Capital Group Llc | 207 | 0,00 | 2 | 0,00 | ||||
| 2025-10-22 | 13F | Cerity Partners LLC | 0 | -100,00 | 0 | -100,00 | ||||
| 2026-03-12 | 13F/A | Peak6 Llc | Call | 3.744.300 | -38,43 | 43.022 | -38,06 | |||
| 2026-02-12 | 13F | RR Advisors, LLC | 918.972 | -18,39 | 10.559 | 87.883,33 | ||||
| 2026-03-12 | 13F/A | Peak6 Llc | Put | 385.000 | -43,28 | 4.424 | -42,94 | |||
| 2025-11-14 | 13F | Cooper Creek Partners Management Llc | 0 | -100,00 | 0 | |||||
| 2026-02-17 | 13F | Advisor Group Holdings, Inc. | 25.159 | -11,96 | 289 | -11,08 | ||||
| 2026-03-03 | 13F/A | Caitong International Asset Management Co., Ltd | 81.632 | 421,74 | 938 | 426,40 | ||||
| 2026-01-26 | 13F | KBC Group NV | 12.349 | 0,00 | 0 | |||||
| 2026-02-17 | 13F/A | Uniplan Investment Counsel, Inc. | 620.674 | 1,71 | 7.131 | 2,32 | ||||
| 2026-02-13 | 13F | BNP Paribas Asset Management Holding S.A. | 4.126 | 47,46 | 0 | |||||
| 2026-02-10 | 13F | 1492 Capital Management LLC | 85.151 | 0,00 | 978 | 0,62 | ||||
| 2026-02-17 | 13F | Worth Venture Partners, LLC | 0 | -100,00 | 0 | |||||
| 2026-02-06 | 13F | Little House Capital Llc | 20.000 | -20,00 | 230 | -19,65 | ||||
| 2026-02-27 | 13F | Strategic Investment Solutions, Inc. /IL | 0 | -100,00 | 100 | -85,29 | ||||
| 2026-01-27 | 13F | Zurcher Kantonalbank (Zurich Cantonalbank) | 108.161 | 20,49 | 1.243 | 21,17 | ||||
| 2026-01-29 | 13F | Teachers Retirement System Of The State Of Kentucky | 112.615 | 13,01 | 1 | 0,00 | ||||
| 2025-11-14 | 13F | Goodlander Investment Management, LLC | 0 | -100,00 | 0 | |||||
| 2026-03-13 | 13F | Spear Advisors LLC | 576.598 | 6.625 |
Other Listings
| IT:1WULF | 17,10 € |