Grundlæggende statistik
| Institutionelle ejere | 211 total, 211 long only, 0 short only, 0 long/short - change of 3,92% MRQ |
| Gennemsnitlig porteføljeallokering | 0.3484 % - change of -0,29% MRQ |
| Institutionelle aktier (lange) | 5.098.998 (ex 13D/G) - change of 0,40MM shares 8,41% MRQ |
| Institutionel værdi (lang) | $ 1.273.948 USD ($1000) |
Institutionelt ejerskab og aktionærer
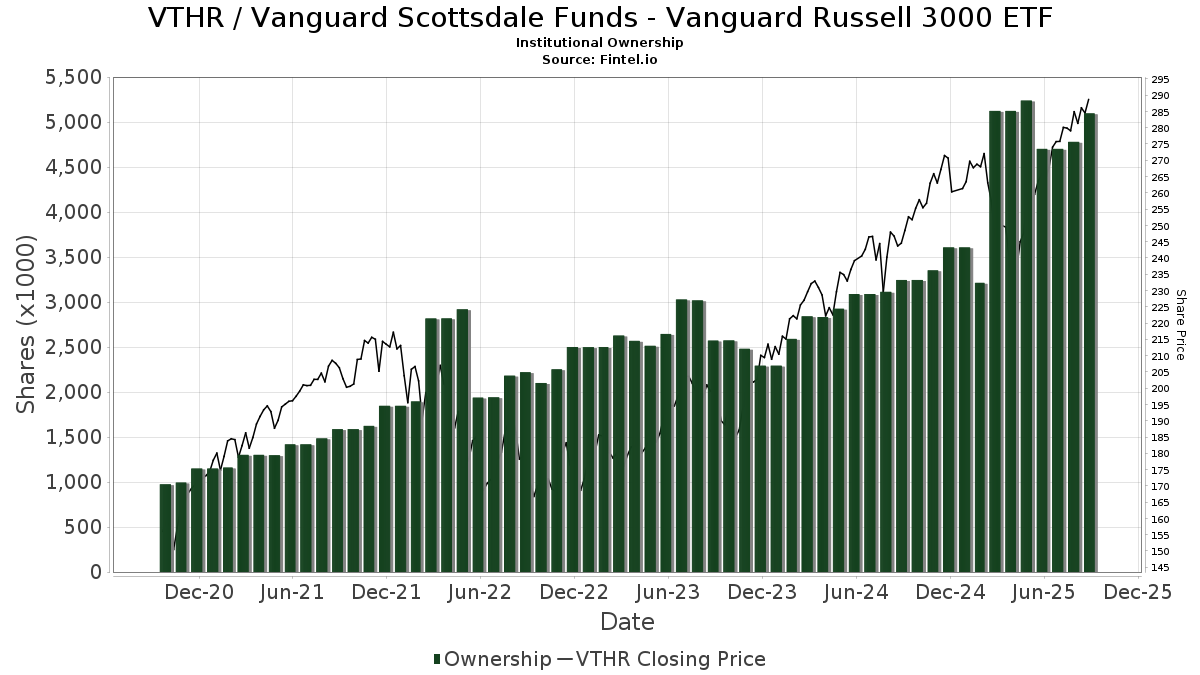
Vanguard Scottsdale Funds - Vanguard Russell 3000 ETF (US:VTHR) har 211 institutionelle ejere og aktionærer, der har indsendt 13D/G- eller 13F-formularer til Securities Exchange Commission (SEC). Disse institutioner har i alt 5,098,998 aktier. Største aktionærer omfatter Ameriprise Financial Inc, Lincoln National Corp, LINCOLN VARIABLE INSURANCE PRODUCTS TRUST - LVIP Vanguard Domestic Equity ETF Fund Standard Class, Cliffwater LLC, Morgan Stanley, Colony Group, LLC, Natixis Advisors, L.p., Tompkins Financial Corp, Cerity Partners LLC, and Fund Evaluation Group, LLC .
Vanguard Scottsdale Funds - Vanguard Russell 3000 ETF (NasdaqGM:VTHR) institutionel ejerskabsstruktur viser aktuelle positioner i virksomheden efter institutioner og fonde, samt seneste ændringer i positionsstørrelse. Større aktionærer kan omfatte individuelle investorer, investeringsforeninger, hedgefonde eller institutioner. Skema 13D angiver, at investoren besidder (eller besidder) mere end 5 % af virksomheden og har til hensigt (eller har til hensigt at) aktivt at forfølge en ændring i forretningsstrategi. Skema 13G indikerer en passiv investering på over 5%.
The share price as of September 10, 2025 is 288,67 / share. Previously, on September 11, 2024, the share price was 244,53 / share. This represents an increase of 18,05% over that period.
Fondens stemningsscore
Fund Sentiment Score (fka Ownership Accumulation Score) finder de aktier, der bliver mest købt af fonde. Det er resultatet af en sofistikeret, multi-faktor kvantitativ model, der identificerer virksomheder med de højeste niveauer af institutionel akkumulering. Scoringsmodellen bruger en kombination af den samlede stigning i oplyste ejere, ændringerne i porteføljeallokeringer i disse ejere og andre målinger. Tallet går fra 0 til 100, hvor højere tal indikerer et højere niveau af akkumulering for sine jævnaldrende, og 50 er gennemsnittet.
Opdateringsfrekvens: Dagligt
Se Ownership Explorer, som giver en liste over højest rangerende virksomheder.
Institutionel Put/Call-forhold
Ud over at indberette standardaktie- og gældsudstedelser skal institutter med mere end 100 mill. aktiver under forvaltning også oplyse deres put- og call-optionsbeholdninger. Da salgsoptioner generelt indikerer negativ stemning, og købsoptioner indikerer positiv stemning, kan vi få en fornemmelse af den overordnede institutionelle stemning ved at plotte forholdet mellem put og kald. Diagrammet til højre viser det historiske put/call-forhold for dette instrument.
Brug af Put/Call Ratio som en indikator for investorernes stemning overvinder en af de vigtigste mangler ved at bruge totalt institutionelt ejerskab, som er, at en betydelig mængde af aktiver under forvaltning investeres passivt for at spore indekser. Passivt forvaltede fonde køber typisk ikke optioner, så indikatoren for put/call-forholdet følger mere nøje følelsen af aktivt forvaltede fonde.

13F og NPORT arkivering
Detaljer om 13F-arkivering er gratis. Detaljer om NP-ansøgninger kræver et premium-medlemskab. Grønne rækker angiver nye positioner. Røde rækker angiver lukkede positioner. Klik på linket ikon for at se den fulde transaktionshistorik.
Opgrader
for at låse premium-data op og eksportere til Excel ![]() .
.
| Fil dato | Kilde | Investor | Type | Gennemsnitlig pris (Øst) |
Aktier | Δ Aktier (%) |
Rapporteret Værdi ($1000) |
Δ Værdi (%) |
Port Alloc (%) |
|
|---|---|---|---|---|---|---|---|---|---|---|
| 2025-07-31 | 13F | City State Bank | 50 | 0,00 | 14 | 8,33 | ||||
| 2025-08-08 | 13F | Firestone Capital Management | 1.000 | 0,00 | 273 | 10,57 | ||||
| 2025-08-13 | 13F | Quadrant Capital Group Llc | 0 | -100,00 | 0 | |||||
| 2025-08-01 | 13F | Chilton Capital Management Llc | 203 | 0,00 | 55 | 10,00 | ||||
| 2025-07-25 | 13F | NorthRock Partners, LLC | 41 | -73,55 | 11 | -71,05 | ||||
| 2025-08-11 | 13F | Wealthspire Advisors, LLC | 3.417 | 0,00 | 932 | 10,56 | ||||
| 2025-08-14 | 13F | Mariner, LLC | 74.648 | 214,84 | 20.360 | 248,03 | ||||
| 2025-08-15 | 13F | Kestra Advisory Services, LLC | 10.327 | 30,89 | 2.817 | 44,71 | ||||
| 2025-07-21 | 13F | Verus Financial Partners, Inc. | 8.358 | 1,31 | 2.305 | 18,09 | ||||
| 2025-08-08 | 13F | Pnc Financial Services Group, Inc. | 10.046 | -16,66 | 2.740 | -7,87 | ||||
| 2025-08-14 | 13F | Raymond James Financial Inc | 78.929 | -0,10 | 21.528 | 10,42 | ||||
| 2025-07-16 | 13F | Dakota Wealth Management | 903 | 0,00 | 246 | 10,81 | ||||
| 2025-08-14 | 13F | Glenmede Investment Management, LP | 21.100 | 5.755 | ||||||
| 2025-08-14 | 13F | Old Mission Capital Llc | 1.966 | 0,31 | 536 | 10,97 | ||||
| 2025-08-07 | 13F | Kestra Private Wealth Services, Llc | 883 | 241 | ||||||
| 2025-08-13 | 13F | Natixis Advisors, L.p. | 222.295 | 0,36 | 61 | 11,11 | ||||
| 2025-07-15 | 13F | Main Street Group, LTD | 0 | -100,00 | 0 | |||||
| 2025-08-11 | 13F | Lowe Brockenbrough & Co Inc | 36.664 | 10.000 | ||||||
| 2025-08-07 | 13F | Evoke Wealth, Llc | 10.182 | 2.777 | ||||||
| 2025-08-12 | 13F | SRS Capital Advisors, Inc. | 50 | 14 | ||||||
| 2025-08-28 | 13F/A | Tolleson Wealth Management, Inc. | 16.701 | 0,00 | 4.555 | 10,53 | ||||
| 2025-09-04 | 13F/A | Advisor Group Holdings, Inc. | 2.580 | -11,76 | 703 | -2,63 | ||||
| 2025-07-09 | 13F | Bowman & Co S.C. | 1.045 | 14,33 | 285 | 26,67 | ||||
| 2025-08-13 | 13F | Virtue Capital Management, LLC | 0 | -100,00 | 0 | |||||
| 2025-07-28 | 13F | Corundum Trust Company, INC | 1.892 | 0,00 | 516 | 10,73 | ||||
| 2025-08-07 | 13F | Tacita Capital Inc | 625 | 0,00 | 170 | 10,39 | ||||
| 2025-08-13 | 13F | Jones Financial Companies Lllp | 551 | 1.024,49 | 150 | 1.141,67 | ||||
| 2025-08-14 | 13F | GWM Advisors LLC | 3.377 | -14,01 | 921 | -4,95 | ||||
| 2025-07-24 | 13F | Lokken Investment Group LLC | 1.905 | 520 | ||||||
| 2025-07-22 | 13F | Evensky & Katz LLC | 44.464 | 429,40 | 12 | 500,00 | ||||
| 2025-07-07 | 13F | Global Wealth Strategies & Associates | 0 | -100,00 | 0 | |||||
| 2025-07-31 | 13F | Mycio Wealth Partners, Llc | 314 | 86 | ||||||
| 2025-08-14 | 13F | Wells Fargo & Company/mn | 17.779 | 46,32 | 4.849 | 61,74 | ||||
| 2025-08-04 | 13F | Linscomb & Williams, Inc. | 26.427 | -1,73 | 7.208 | 8,62 | ||||
| 2025-07-18 | 13F | Centricity Wealth Management, LLC | 287 | 0,00 | 78 | 11,43 | ||||
| 2025-08-15 | 13F | Koesten, Hirschmann & Crabtree, INC. | 452 | 0,22 | 123 | 10,81 | ||||
| 2025-08-12 | 13F | Steward Partners Investment Advisory, Llc | 14.447 | 0,38 | 3.940 | 10,95 | ||||
| 2025-07-29 | 13F | Stratos Wealth Advisors, LLC | 16.417 | 1,40 | 4.478 | 12,07 | ||||
| 2025-07-21 | 13F | Precedent Wealth Partners, Llc | 1.820 | 9,84 | 496 | 21,57 | ||||
| 2025-07-31 | 13F | Sage Mountain Advisors LLC | 420 | 0,00 | 115 | 10,68 | ||||
| 2025-07-09 | 13F | Radnor Capital Management, LLC | 1.100 | 0,00 | 0 | |||||
| 2025-08-07 | 13F | Allworth Financial LP | 586 | 0,34 | 160 | 12,77 | ||||
| 2025-08-07 | 13F | Fund Evaluation Group, LLC | 139.081 | 37.934 | ||||||
| 2025-07-30 | 13F | Arbor Investment Advisors, LLC | 1.787 | -11,80 | 487 | -2,40 | ||||
| 2025-08-05 | 13F | Lincoln National Corp | 466.325 | 1,42 | 127.190 | 12,10 | ||||
| 2025-08-14 | 13F | Gould Capital, LLC | 13 | 8,33 | 4 | 50,00 | ||||
| 2025-08-13 | 13F | Lido Advisors, LLC | 12.533 | 0,01 | 3.418 | 10,54 | ||||
| 2025-07-31 | 13F | Fiduciary Wealth Partners, LLC | 0 | -100,00 | 0 | -100,00 | ||||
| 2025-08-14 | 13F | Ieq Capital, Llc | 21.194 | -22,13 | 5.781 | -13,92 | ||||
| 2025-08-19 | 13F/A | Pitcairn Co | 23.421 | -18,27 | 6.388 | -9,66 | ||||
| 2025-07-25 | 13F | Johnson Investment Counsel Inc | 4.802 | 0,00 | 1.310 | 10,56 | ||||
| 2025-07-25 | 13F | Investment Advisory Group, LLC | 5.978 | -0,91 | 1.631 | 9,54 | ||||
| 2025-07-31 | 13F | Nilsine Partners, LLC | 1.498 | -5,96 | 409 | 3,82 | ||||
| 2025-08-11 | 13F | Diversified Portfolios, Inc. | 53.527 | 1,70 | 14.599 | 12,41 | ||||
| 2025-07-09 | 13F | Inspirion Wealth Advisors, Llc | 0 | -100,00 | 0 | |||||
| 2025-07-02 | 13F | Central Pacific Bank - Trust Division | 24 | 0,00 | 7 | 20,00 | ||||
| 2025-07-28 | 13F | Harbour Investments, Inc. | 0 | -100,00 | 0 | |||||
| 2025-08-05 | 13F | Bank Of Montreal /can/ | 136 | 0,00 | 37 | 12,12 | ||||
| 2025-08-14 | 13F | Atomi Financial Group, Inc. | 1.478 | 0,00 | 403 | 10,71 | ||||
| 2025-07-30 | 13F | Forum Financial Management, LP | 2.448 | 0,29 | 668 | 10,80 | ||||
| 2025-08-14 | 13F | Citadel Advisors Llc | 2.847 | -66,80 | 777 | -63,31 | ||||
| 2025-07-30 | 13F | Whittier Trust Co | 5.659 | 0,00 | 1.543 | 10,53 | ||||
| 2025-08-07 | 13F | Resources Investment Advisors, LLC. | 3.081 | -0,03 | 840 | 10,53 | ||||
| 2025-08-04 | 13F | Flagship Harbor Advisors, Llc | 5.648 | 7,07 | 1.541 | 18,37 | ||||
| 2025-08-12 | 13F | Howe & Rusling Inc | 281 | 0,00 | 77 | 10,14 | ||||
| 2025-08-18 | 13F | Geneos Wealth Management Inc. | 2.966 | 56,60 | 809 | 73,02 | ||||
| 2025-07-11 | 13F | Farther Finance Advisors, LLC | 2.406 | 74,22 | 656 | 91,81 | ||||
| 2025-07-10 | 13F | Wedmont Private Capital | 5.599 | -0,94 | 1.544 | 16,37 | ||||
| 2025-04-24 | 13F | Wingate Wealth Advisors, Inc. | 0 | -100,00 | 0 | |||||
| 2025-08-13 | 13F | Russell Investments Group, Ltd. | 1.691 | 461 | ||||||
| 2025-08-06 | NP | LINCOLN VARIABLE INSURANCE PRODUCTS TRUST - LVIP Vanguard Domestic Equity ETF Fund Standard Class | 466.325 | 1,42 | 127.190 | 12,10 | ||||
| 2025-07-31 | 13F | FSA Investment Group, LLC | 9.255 | 36,10 | 2.524 | 50,42 | ||||
| 2025-08-15 | 13F | Captrust Financial Advisors | 15.001 | 43,50 | 4.092 | 58,63 | ||||
| 2025-07-22 | 13F | Bay Harbor Wealth Management, LLC | 16 | 0,00 | 4 | 33,33 | ||||
| 2025-08-07 | 13F | BOK Financial Private Wealth, Inc. | 1.807 | 0,00 | 493 | 10,56 | ||||
| 2025-08-05 | 13F | Centennial Bank/AR/ | 4.946 | 210,29 | 1.349 | 243,26 | ||||
| 2025-07-09 | 13F | Christopher J. Hasenberg, Inc | 12.886 | -55,06 | 3.515 | -50,53 | ||||
| 2025-08-12 | 13F | O'shaughnessy Asset Management, Llc | 40 | 0,00 | 11 | 11,11 | ||||
| 2025-08-13 | 13F | Northwestern Mutual Wealth Management Co | 1.384 | 5,09 | 378 | 16,00 | ||||
| 2025-08-14 | 13F/A | Rockefeller Capital Management L.P. | 15.292 | 0,94 | 4.171 | 11,56 | ||||
| 2025-08-14 | 13F | EP Wealth Advisors, Inc. | 1.372 | -15,52 | 374 | -6,50 | ||||
| 2025-04-23 | 13F | Moran Wealth Management, LLC | 0 | -100,00 | 0 | |||||
| 2025-08-14 | 13F | Moneta Group Investment Advisors Llc | 1.616 | 0,00 | 441 | 10,55 | ||||
| 2025-08-19 | 13F | Asset Dedication, LLC | 208 | 0,00 | 57 | 9,80 | ||||
| 2025-07-15 | 13F | DB Fitzpatrick & Co, Inc | 14.210 | -2,70 | 3.876 | 7,55 | ||||
| 2025-08-12 | 13F/A | Cozad Asset Management Inc | 2.493 | 0,00 | 680 | 10,41 | ||||
| 2025-08-11 | 13F | Banque Cantonale Vaudoise | 1.794 | 0,00 | 0 | |||||
| 2025-08-13 | 13F | Cliffwater LLC | 235.936 | -9,98 | 64.352 | -0,50 | ||||
| 2025-08-13 | 13F | Cresset Asset Management, LLC | 4.027 | -8,58 | 1.099 | 1,10 | ||||
| 2025-07-17 | 13F | Coastline Trust Co | 12.240 | -2,67 | 3.338 | 7,57 | ||||
| 2025-08-06 | 13F | Wedbush Securities Inc | 9.546 | -1,99 | 3 | 0,00 | ||||
| 2025-08-14 | 13F | Tennessee Valley Asset Management Partners | 12.549 | 3,47 | 3.423 | 14,37 | ||||
| 2025-07-18 | 13F | BSW Wealth Partners | 771 | 210 | ||||||
| 2025-07-10 | 13F | Wealth Enhancement Advisory Services, Llc | 14.617 | 17,07 | 4.038 | 31,10 | ||||
| 2025-07-11 | 13F | Diversified Trust Co | 84.088 | 0,02 | 22.935 | 10,56 | ||||
| 2025-07-31 | 13F | Oppenheimer & Co Inc | 0 | -100,00 | 0 | |||||
| 2025-08-08 | 13F | Thoroughbred Financial Services, Llc | 0 | -100,00 | 0 | |||||
| 2025-08-14 | 13F | Goldman Sachs Group Inc | 64.547 | 19,84 | 17.605 | 32,47 | ||||
| 2025-07-08 | 13F | Nbc Securities, Inc. | 11.000 | -5,71 | 3 | 50,00 | ||||
| 2025-08-04 | 13F | Assetmark, Inc | 719 | -49,61 | 196 | -44,32 | ||||
| 2025-07-17 | 13F | Janney Montgomery Scott LLC | 901 | -30,59 | 0 | |||||
| 2025-07-30 | 13F | Strategic Blueprint, LLC | 0 | -100,00 | 0 | |||||
| 2025-07-07 | 13F | Wesbanco Bank Inc | 5.005 | 0,00 | 1.365 | 10,53 | ||||
| 2025-08-12 | 13F | Coldstream Capital Management Inc | 1.368 | 2,86 | 373 | 13,72 | ||||
| 2025-08-08 | 13F | Hartland & Co., LLC | 14.849 | 0,53 | 4.050 | 11,14 | ||||
| 2025-07-22 | 13F | Belpointe Asset Management LLC | 1.132 | 0,00 | 309 | 10,39 | ||||
| 2025-08-06 | 13F | Commonwealth Equity Services, Llc | 16.033 | -0,71 | 4 | 33,33 | ||||
| 2025-07-24 | 13F | IFP Advisors, Inc | 2.887 | -0,62 | 787 | 9,92 | ||||
| 2025-07-11 | 13F | Orrstown Financial Services Inc | 8.373 | -2,71 | 2.284 | 7,54 | ||||
| 2025-08-01 | 13F | Envestnet Asset Management Inc | 31.081 | -28,87 | 8.477 | -21,38 | ||||
| 2025-08-12 | 13F | Pathstone Holdings, LLC | 24.501 | 26,74 | 6.683 | 40,08 | ||||
| 2025-05-06 | 13F | Venturi Wealth Management, LLC | 0 | -100,00 | 0 | |||||
| 2025-08-04 | 13F | JDM Financial Group LLC | 59 | 0,00 | 16 | 14,29 | ||||
| 2025-05-08 | 13F | Armis Advisers, LLC | 0 | -100,00 | 0 | |||||
| 2025-07-31 | 13F | Brighton Jones Llc | 1.190 | 0,25 | 325 | 10,96 | ||||
| 2025-07-25 | 13F | Sequoia Financial Advisors, LLC | 3.309 | 33,54 | 903 | 47,63 | ||||
| 2025-08-05 | 13F | GPS Wealth Strategies Group, LLC | 24 | 0,00 | 7 | 0,00 | ||||
| 2025-07-31 | 13F | Topsail Wealth Management, LLC | 101 | 0,00 | 28 | 12,50 | ||||
| 2025-08-06 | 13F | Prospera Financial Services Inc | 1.500 | -57,14 | 409 | -52,61 | ||||
| 2025-08-14 | 13F | Royal Bank Of Canada | 12.129 | 7,00 | 3.308 | 18,23 | ||||
| 2025-08-14 | 13F | Mml Investors Services, Llc | 64.523 | -60,37 | 18 | -57,50 | ||||
| 2025-05-14 | 13F | Retirement Capital Strategies | 0 | -100,00 | 0 | |||||
| 2025-07-10 | 13F | NorthCrest Asset Manangement, LLC | 5.590 | 0,00 | 1.544 | 11,97 | ||||
| 2025-08-07 | 13F | CENTRAL TRUST Co | 32 | 0,00 | 9 | 14,29 | ||||
| 2025-08-08 | 13F | SBI Securities Co., Ltd. | 165 | 1,23 | 45 | 12,50 | ||||
| 2025-08-14 | 13F | Warren Averett Asset Management, LLC | 8.925 | 0,00 | 2.434 | 10,54 | ||||
| 2025-07-21 | 13F | Monticello Wealth Management, Llc | 9.411 | 0,00 | 2.567 | 10,51 | ||||
| 2025-04-17 | 13F | Qrg Capital Management, Inc. | 0 | -100,00 | 0 | |||||
| 2025-05-14 | 13F | Huntington National Bank | 116 | -4,96 | ||||||
| 2025-08-14 | 13F | Aqr Capital Management Llc | 63.374 | 81,39 | 17.285 | 100,50 | ||||
| 2025-08-05 | 13F | Bank of New York Mellon Corp | 29.293 | 7.990 | ||||||
| 2025-08-14 | 13F | Silvercrest Asset Management Group Llc | 4.034 | 0,30 | 1.100 | 10,89 | ||||
| 2025-05-15 | 13F | Glenmede Trust Co Na | 21.100 | 0,00 | 5.207 | -5,00 | ||||
| 2025-08-14 | 13F | Graney & King, LLC | 102 | 0,00 | 28 | 8,00 | ||||
| 2025-08-14 | 13F | Bank Of America Corp /de/ | 97.699 | -1,64 | 26.648 | 8,71 | ||||
| 2025-07-07 | 13F | Bangor Savings Bank | 0 | -100,00 | 0 | |||||
| 2025-07-16 | 13F | Embree Financial Group | 9.870 | -0,17 | 2.692 | 10,37 | ||||
| 2025-07-31 | 13F | CNB Bank | 3.189 | -11,54 | 870 | -2,25 | ||||
| 2025-07-25 | 13F | Atria Wealth Solutions, Inc. | 1.636 | -4,05 | 449 | 6,90 | ||||
| 2025-08-13 | 13F | Marshall Wace, Llp | 988 | 269 | ||||||
| 2025-08-14 | 13F | Gotham Asset Management, LLC | 41.208 | 30,62 | 11.239 | 44,37 | ||||
| 2025-08-14 | 13F | Great Valley Advisor Group, Inc. | 4.803 | 0,00 | 1.310 | 10,55 | ||||
| 2025-07-22 | 13F | Wealthcare Advisory Partners LLC | 1.763 | 0,00 | 481 | 10,60 | ||||
| 2025-08-13 | 13F | American Investment Services, Inc. | 0 | -100,00 | 0 | |||||
| 2025-08-12 | 13F | Proequities, Inc. | 0 | 0 | ||||||
| 2025-08-13 | 13F | BCJ Capital Management, LLC | 930 | 0,00 | 254 | 10,48 | ||||
| 2025-07-22 | 13F | Compass Financial Group, INC/SD | 4.665 | 0,00 | 1.272 | 10,51 | ||||
| 2025-07-18 | 13F | Cooper Financial Group | 1.470 | 401 | ||||||
| 2025-08-14 | 13F | Principal Street Partners, LLC | 5.248 | 100,00 | 1.431 | 121,17 | ||||
| 2025-08-11 | 13F | HighTower Advisors, LLC | 93.624 | -1,99 | 25.536 | 8,33 | ||||
| 2025-08-12 | 13F | New Republic Capital, LLC | 1.063 | 290 | ||||||
| 2025-08-14 | 13F | Jane Street Group, Llc | 3.800 | 44,10 | 1.036 | 59,38 | ||||
| 2025-08-12 | 13F | Jpmorgan Chase & Co | 40.506 | -2,51 | 11.048 | 7,76 | ||||
| 2025-08-14 | 13F | Susquehanna International Group, Llp | 75.540 | 105,11 | 20.604 | 126,73 | ||||
| 2025-07-30 | 13F | Brookstone Capital Management | 1.405 | 0,00 | 383 | 10,69 | ||||
| 2025-08-14 | 13F | Ameriprise Financial Inc | 525.460 | 1,47 | 143.561 | 12,46 | ||||
| 2025-08-08 | 13F | Emerald Investment Partners, Llc | 10 | 0,00 | 3 | 0,00 | ||||
| 2025-08-08 | 13F | Jacksonville Wealth Management, LLC | 2.990 | -1,52 | 816 | 8,81 | ||||
| 2025-03-12 | 13F/A | Private Capital Management Llc | 272 | 65 | ||||||
| 2025-07-02 | 13F | First Financial Bank - Trust Division | 3.788 | 1,23 | 1.033 | 11,92 | ||||
| 2025-08-14 | 13F | Mercer Global Advisors Inc /adv | 2.453 | 79,18 | 669 | 98,52 | ||||
| 2025-08-08 | 13F | Capital Investment Advisory Services, LLC | 618 | 0,00 | 168 | 10,53 | ||||
| 2025-08-14 | 13F | Operose Advisors LLC | 5.166 | 0,19 | 1.409 | 10,69 | ||||
| 2025-08-04 | 13F | Pensionmark Financial Group, Llc | 4.250 | -0,86 | 1.159 | 9,65 | ||||
| 2025-08-11 | 13F | Aptus Capital Advisors, LLC | 30 | 0,00 | 8 | 14,29 | ||||
| 2025-08-12 | 13F | MAI Capital Management | 3.505 | -0,79 | 956 | 9,64 | ||||
| 2025-08-29 | 13F | Evolution Wealth Management Inc. | 5.802 | 1.582 | ||||||
| 2025-08-08 | 13F | Cetera Investment Advisers | 18.502 | 2,83 | 5.046 | 13,65 | ||||
| 2025-07-28 | 13F | BRYN MAWR TRUST Co | 2.110 | 0,00 | 576 | 10,58 | ||||
| 2025-08-07 | 13F | Everhart Financial Group, Inc. | 3.148 | 37,11 | 859 | 51,59 | ||||
| 2025-08-14 | 13F | Capital Planning Advisors, LLC | 1.891 | 0,00 | 516 | 10,52 | ||||
| 2025-08-13 | 13F | Cerity Partners LLC | 140.611 | 4,93 | 38.352 | 15,98 | ||||
| 2025-08-08 | 13F | Avantax Advisory Services, Inc. | 6.049 | 2,44 | 1.650 | 13,18 | ||||
| 2025-08-08 | 13F | Family Firm, Inc. | 41.713 | 3,59 | 11.377 | 14,50 | ||||
| 2025-08-14 | 13F | NCP Inc. | 0 | -100,00 | 0 | |||||
| 2025-07-01 | 13F | Harbor Investment Advisory, Llc | 41 | 0,00 | 11 | 10,00 | ||||
| 2025-08-06 | 13F | AE Wealth Management LLC | 26 | 13,04 | 7 | 40,00 | ||||
| 2025-08-14 | 13F | Colony Group, LLC | 224.686 | 0,94 | 61.283 | 11,58 | ||||
| 2025-07-18 | 13F | PBMares Wealth Management LLC | 7.710 | -21,99 | 2.103 | -13,78 | ||||
| 2025-07-28 | 13F | Davidson Investment Advisors | 2.424 | 661 | ||||||
| 2025-08-13 | 13F | EverSource Wealth Advisors, LLC | 1 | 0,00 | 0 | |||||
| 2025-05-07 | 13F | Evermay Wealth Management Llc | 0 | -100,00 | 0 | |||||
| 2025-08-12 | 13F | Fairscale Capital, LLC | 2.655 | 0,00 | 740 | 12,82 | ||||
| 2025-08-13 | 13F | Grove Street Fiduciary, LLC | 1.992 | 0,00 | 543 | 10,59 | ||||
| 2025-07-11 | 13F | Adirondack Trust Co | 24.674 | 20,33 | 6.730 | 33,01 | ||||
| 2025-08-11 | 13F | Sykon Capital Llc | 920 | 0,00 | 251 | 10,13 | ||||
| 2025-07-29 | 13F | International Assets Investment Management, Llc | 0 | -100,00 | 0 | |||||
| 2025-08-08 | 13F | Red Cedar Investment Management, Llc | 14.523 | -9,13 | 3.961 | 0,46 | ||||
| 2025-08-14 | 13F | Fmr Llc | 3.873 | -22,74 | 1.056 | -14,63 | ||||
| 2025-08-13 | 13F | Momentous Wealth Management, Inc. | 943 | 0,00 | 257 | 10,78 | ||||
| 2025-07-10 | 13F | Tompkins Financial Corp | 220.065 | 22,58 | 60.023 | 35,49 | ||||
| 2025-07-22 | 13F | Olistico Wealth, LLC | 6 | 2 | ||||||
| 2025-08-08 | 13F | Creative Planning | 3.967 | 4,86 | 1.082 | 15,86 | ||||
| 2025-08-12 | 13F | Jacobi Capital Management LLC | 1.324 | 0,00 | 361 | 10,74 | ||||
| 2025-08-14 | 13F | Qube Research & Technologies Ltd | 188 | -47,63 | 51 | -42,05 | ||||
| 2025-08-14 | 13F | Pennington Partners & Co., Llc | 46.295 | 7,41 | 12.627 | 18,72 | ||||
| 2025-08-12 | 13F | AlphaCore Capital LLC | 29.711 | 6,76 | 8.104 | 18,00 | ||||
| 2025-08-14 | 13F | Comerica Bank | 14 | -99,34 | 4 | -99,43 | ||||
| 2025-08-12 | 13F | Global Retirement Partners, LLC | 344 | 421,21 | 94 | 447,06 | ||||
| 2025-08-15 | 13F | Morgan Stanley | 224.848 | 2,70 | 61.328 | 13,52 | ||||
| 2025-08-12 | 13F | Coston, McIsaac & Partners | 0 | -100,00 | 0 | |||||
| 2025-07-11 | 13F | AA Financial Advisors, LLC | 1.026 | -0,10 | 280 | 10,28 | ||||
| 2025-08-08 | 13F | Smithfield Trust Co | 340 | 0,00 | 0 | |||||
| 2025-08-14 | 13F | Synovus Financial Corp | 897 | 245 | ||||||
| 2025-07-24 | 13F | Us Bancorp \de\ | 2.681 | 0,00 | 731 | 10,59 | ||||
| 2025-08-13 | 13F | Baker Avenue Asset Management, LP | 1.517 | -45,92 | 414 | -40,32 | ||||
| 2025-08-14 | 13F | CoreCap Advisors, LLC | 0 | -100,00 | 0 | |||||
| 2025-08-13 | 13F | Keystone Financial Group | 2.615 | 0,00 | 713 | 10,54 | ||||
| 2025-08-12 | 13F | LPL Financial LLC | 85.680 | -8,04 | 23.369 | 1,65 | ||||
| 2025-07-31 | 13F | Cambridge Investment Research Advisors, Inc. | 16.341 | 3,35 | 4 | 33,33 | ||||
| 2025-07-10 | 13F | ARS Wealth Advisors Group, LLC | 1.834 | 0,00 | 500 | 10,62 | ||||
| 2025-07-28 | 13F | Private Wealth Asset Management, LLC | 4.400 | 1.200 | ||||||
| 2025-08-14 | 13F | Hrt Financial Lp | 8.737 | 2 | ||||||
| 2025-08-18 | 13F | N.E.W. Advisory Services LLC | 0 | -100,00 | 0 | |||||
| 2025-07-29 | 13F | Activest Wealth Management | 155 | 0,00 | 42 | 10,53 | ||||
| 2025-07-23 | 13F | Hardy Reed LLC | 8.048 | 0,00 | 2.195 | 10,58 | ||||
| 2025-07-09 | 13F | Pallas Capital Advisors LLC | 15.055 | 4.106 | ||||||
| 2025-08-15 | 13F | Tower Research Capital LLC (TRC) | 5.248 | 439,92 | 1.431 | 498,74 | ||||
| 2025-08-14 | 13F | Hirtle Callaghan & Co LLC | 2.500 | -16,67 | 682 | -7,97 | ||||
| 2025-08-07 | 13F | Commerce Bank | 37.517 | -6,38 | 10.233 | 3,48 | ||||
| 2025-06-03 | 13F/A | First National Bank Of Omaha | 1.274 | -39,01 | 314 | -29,28 | ||||
| 2025-04-30 | 13F | Brown Advisory Inc | 0 | -100,00 | 0 | -100,00 | ||||
| 2025-07-08 | 13F | Apella Capital, LLC | 4.269 | 1.170 | ||||||
| 2025-08-11 | 13F | Private Advisor Group, LLC | 32.686 | -14,42 | 8.915 | -5,40 | ||||
| 2025-07-24 | 13F | Jfs Wealth Advisors, Llc | 581 | 0,35 | 158 | 11,27 | ||||
| 2025-07-22 | 13F | Silvia Mccoll Wealth Management, Llc | 2.463 | 0,00 | 672 | 10,54 | ||||
| 2025-08-14 | 13F | Stifel Financial Corp | 19.198 | 31,33 | 5.236 | 45,16 | ||||
| 2025-08-04 | 13F | Silver Coast Investments LLC | 6.052 | 3,36 | 1.651 | 14,27 | ||||
| 2025-08-13 | 13F | Flow Traders U.s. Llc | 2.700 | 1 | ||||||
| 2025-08-14 | 13F | UBS Group AG | 60.887 | 32,10 | 16.607 | 46,01 | ||||
| 2025-07-09 | 13F | Sunpointe, LLC | 1.495 | 408 | ||||||
| 2025-07-24 | 13F | Blair William & Co/il | 386 | 26,56 | 105 | 40,00 | ||||
| 2025-05-02 | 13F | Wealthfront Advisers Llc | 0 | -100,00 | 0 | -100,00 | ||||
| 2025-04-28 | 13F | Strategic Financial Concepts, LLC | 0 | -100,00 | 0 | -100,00 | ||||
| 2025-08-06 | 13F | Paulson Wealth Management Inc. | 1.900 | -0,11 | 518 | 10,45 | ||||
| 2025-07-25 | 13F | Cwm, Llc | 26.918 | 0,96 | 7 | 16,67 | ||||
| 2025-08-14 | 13F | Kovitz Investment Group Partners, LLC | 866 | 0,00 | 236 | 10,80 | ||||
| 2025-07-29 | 13F | Wealthstream Advisors, Inc. | 32.874 | -2,84 | 8.966 | 7,39 | ||||
| 2025-08-11 | 13F | Nations Financial Group Inc, /ia/ /adv | 11.653 | -0,07 | 3.178 | 10,46 | ||||
| 2025-07-30 | 13F | Sonata Capital Group Inc | 850 | 0,00 | 0 |