Grundlæggende statistik
| Institutionelle ejere | 156 total, 151 long only, 0 short only, 5 long/short - change of -36,33% MRQ |
| Gennemsnitlig porteføljeallokering | 0.2823 % - change of 6,00% MRQ |
| Institutionelle aktier (lange) | 46.390.670 (ex 13D/G) - change of -8,60MM shares -15,63% MRQ |
| Institutionel værdi (lang) | $ 2.064.519 USD ($1000) |
Institutionelt ejerskab og aktionærer
Vista Energy, S.A.B. de C.V. - Depositary Receipt (Common Stock) (US:VIST) har 156 institutionelle ejere og aktionærer, der har indsendt 13D/G- eller 13F-formularer til Securities Exchange Commission (SEC). Disse institutioner har i alt 46,390,670 aktier. Største aktionærer omfatter Al Mehwar Commercial Investments LLC, Price T Rowe Associates Inc /md/, Jpmorgan Chase & Co, Capital Research Global Investors, Capital World Investors, Ninety One UK Ltd, Morgan Stanley, Route One Investment Company, L.P., Vontobel Holding Ltd., and Grantham, Mayo, Van Otterloo & Co. LLC .
Vista Energy, S.A.B. de C.V. - Depositary Receipt (Common Stock) (NYSE:VIST) institutionel ejerskabsstruktur viser aktuelle positioner i virksomheden efter institutioner og fonde, samt seneste ændringer i positionsstørrelse. Større aktionærer kan omfatte individuelle investorer, investeringsforeninger, hedgefonde eller institutioner. Skema 13D angiver, at investoren besidder (eller besidder) mere end 5 % af virksomheden og har til hensigt (eller har til hensigt at) aktivt at forfølge en ændring i forretningsstrategi. Skema 13G indikerer en passiv investering på over 5%.
The share price as of April 20, 2026 is 66,50 / share. Previously, on April 21, 2025, the share price was 45,36 / share. This represents an increase of 46,60% over that period.

Fondens stemningsscore
Fund Sentiment Score (fka Ownership Accumulation Score) finder de aktier, der bliver mest købt af fonde. Det er resultatet af en sofistikeret, multi-faktor kvantitativ model, der identificerer virksomheder med de højeste niveauer af institutionel akkumulering. Scoringsmodellen bruger en kombination af den samlede stigning i oplyste ejere, ændringerne i porteføljeallokeringer i disse ejere og andre målinger. Tallet går fra 0 til 100, hvor højere tal indikerer et højere niveau af akkumulering for sine jævnaldrende, og 50 er gennemsnittet.
Opdateringsfrekvens: Dagligt
Se Ownership Explorer, som giver en liste over højest rangerende virksomheder.
AI+ Ask Fintel’s AI assistant about Vista Energy, S.A.B. de C.V. - Depositary Receipt (Common Stock).
Select a question to share a public post with an AI-crafted answer.
Thinking of good questions…
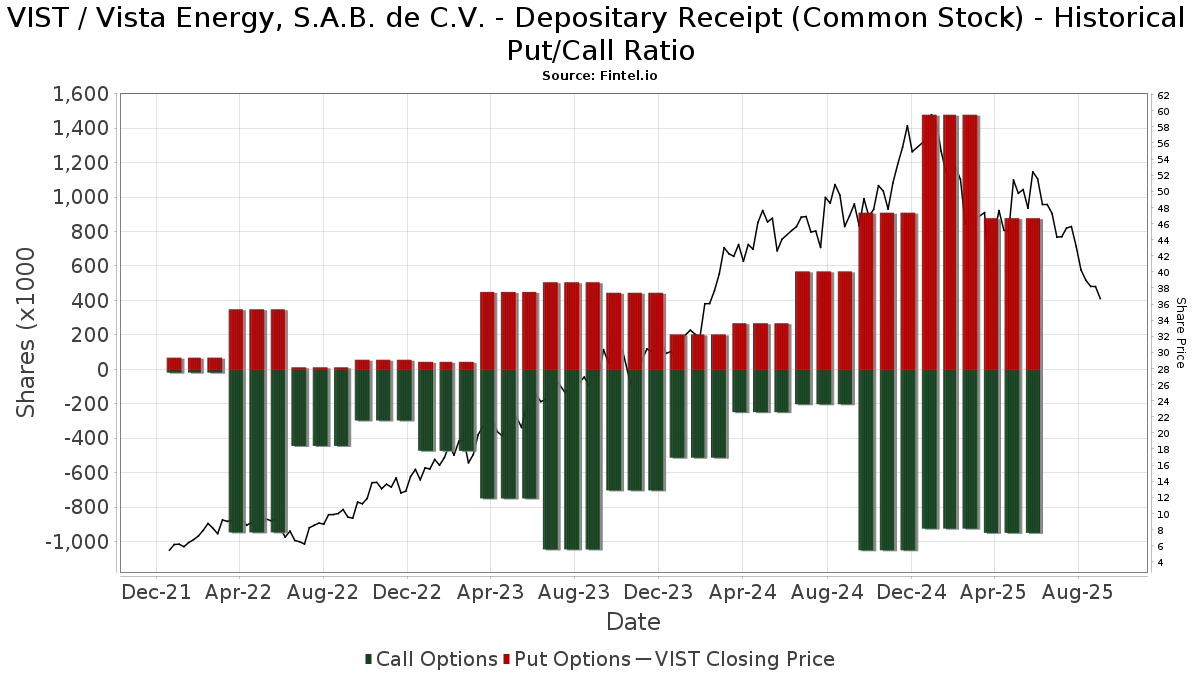
Institutionel Put/Call-forhold
Ud over at indberette standardaktie- og gældsudstedelser skal institutter med mere end 100 mill. aktiver under forvaltning også oplyse deres put- og call-optionsbeholdninger. Da salgsoptioner generelt indikerer negativ stemning, og købsoptioner indikerer positiv stemning, kan vi få en fornemmelse af den overordnede institutionelle stemning ved at plotte forholdet mellem put og kald. Diagrammet til højre viser det historiske put/call-forhold for dette instrument.
Brug af Put/Call Ratio som en indikator for investorernes stemning overvinder en af de vigtigste mangler ved at bruge totalt institutionelt ejerskab, som er, at en betydelig mængde af aktiver under forvaltning investeres passivt for at spore indekser. Passivt forvaltede fonde køber typisk ikke optioner, så indikatoren for put/call-forholdet følger mere nøje følelsen af aktivt forvaltede fonde.
13D/G-arkivering
Vi præsenterer 13D/G ansøgninger separat fra 13F ansøgninger på grund af den forskellige behandling af SEC. 13D/G-ansøgninger kan indgives af grupper af investorer (med én ledende), hvorimod 13F-ansøgninger ikke kan. Dette resulterer i situationer, hvor en investor kan indsende en 13D/G, der rapporterer én værdi for de samlede aktier (der repræsenterer alle de aktier, der ejes af investorgruppen), men derefter indsender en 13F, der rapporterer en anden værdi for de samlede aktier (der udelukkende repræsenterer deres egne) ejendomsret). Det betyder, at aktieejerskab af 13D/G-arkiver og 13F-arkiveringer ofte ikke er direkte sammenlignelige, så vi præsenterer dem separat.
Bemærk: Fra den 16. maj 2021 viser vi ikke længere ejere, der ikke har indsendt en 13D/G inden for det seneste år. Tidligere viste vi den fulde historie af 13D/G-arkiver. Generelt skal enheder, der er forpligtet til at indgive 13D/G-ansøgninger, indgive mindst årligt, før de indsender en afsluttende ansøgning. Dog forlader fonde nogle gange positioner uden at indsende en afsluttende ansøgning (dvs. de afvikler), så visning af den fulde historie resulterede nogle gange i forvirring om det nuværende ejerskab. For at undgå forvirring viser vi nu kun 'aktuelle' ejere - det vil sige - ejere, der har anmeldt inden for det seneste år.
Upgrade to unlock premium data.
| Fil dato | Form | Investor | Forrige Aktier |
Seneste Aktier |
Δ Aktier (Procent) |
Ejendomsret (Procent) |
Δ Ejerskab (Procent) |
|
|---|---|---|---|---|---|---|---|---|
| 2026-02-03 | Al Mehwar Commercial Investments LLC | 13,270,363 | 2,892,409 | -78.20 | 2.80 | -77.95 | ||
| 2025-11-13 | Petronas Carigali Canada B.V. | 7,297,507 | 3,648,754 | -50.00 | 3.50 | -54.31 |
13F og NPORT arkivering
Detaljer om 13F-arkivering er gratis. Detaljer om NP-ansøgninger kræver et premium-medlemskab. Grønne rækker angiver nye positioner. Røde rækker angiver lukkede positioner. Klik på linket ikon for at se den fulde transaktionshistorik.
Opgrader
for at låse premium-data op og eksportere til Excel ![]() .
.
| Fil dato | Kilde | Investor | Type | Gennemsnitlig pris (Øst) |
Aktier | Δ Aktier (%) |
Rapporteret Værdi ($1000) |
Δ Værdi (%) |
Port Alloc (%) |
|
|---|---|---|---|---|---|---|---|---|---|---|
| 2026-02-13 | 13F | Rhumbline Advisers | 835 | -2,34 | 41 | 37,93 | ||||
| 2026-01-14 | 13F | Spire Wealth Management | 7.405 | 360 | ||||||
| 2026-01-14 | 13F | Jfs Wealth Advisors, Llc | 15 | 1 | ||||||
| 2026-02-17 | 13F | Bank Of America Corp /de/ | 100.397 | -75,71 | 4.885 | -65,64 | ||||
| 2026-01-22 | 13F | Vision Financial Markets Llc | 5 | 0,00 | 0 | |||||
| 2026-02-13 | 13F | Ieq Capital, Llc | 19.566 | 0,00 | 952 | 41,46 | ||||
| 2025-11-13 | 13F | Capital Fund Management S.a. | 0 | -100,00 | 0 | -100,00 | ||||
| 2026-04-20 | 13F | Ronald Blue Trust, Inc. | 1.002 | -67,58 | 76 | -50,00 | ||||
| 2026-02-11 | 13F | Group One Trading, L.p. | 30.173 | 69,23 | 1.468 | 139,48 | ||||
| 2026-02-17 | 13F | Northern Trust Corp | 9.394 | 34,20 | 457 | 90,42 | ||||
| 2026-01-21 | 13F | Ameliora Wealth Management Ltd. | 319 | 0,00 | 16 | 50,00 | ||||
| 2026-02-02 | 13F | Truist Financial Corp | 5.837 | 284 | ||||||
| 2026-02-09 | 13F | Leavell Investment Management, Inc. | 9.730 | 12,10 | 473 | 58,72 | ||||
| 2026-02-17 | 13F | Royal Bank Of Canada | 22.673 | 871,42 | 1.103 | 1.261,73 | ||||
| 2026-02-13 | 13F | Motiv8 Investments LLC | 10 | 0 | ||||||
| 2026-02-17 | 13F | Cetera Investment Advisers | 7.428 | -17,66 | 361 | 16,45 | ||||
| 2026-02-02 | 13F | Ping Capital Management, Inc. | 224.900 | 81,52 | 10.944 | 156,76 | ||||
| 2026-02-09 | 13F | Wcm Investment Management, Llc | 345.090 | -2,74 | 16.727 | 33,17 | ||||
| 2025-11-17 | 13F | Laurion Capital Management LP | 0 | -100,00 | 0 | |||||
| 2026-02-13 | 13F | Morgan Stanley | 1.052.775 | 20,33 | 51.228 | 70,21 | ||||
| 2026-02-17 | 13F | VR Advisory Services Ltd | 368.652 | 0,00 | 17.939 | 41,46 | ||||
| 2026-02-13 | 13F | Cape Ann Asset Management Ltd | 689.900 | 18,21 | 33.571 | 67,22 | ||||
| 2026-02-13 | 13F | Banco Santander, S.A. | 49.214 | 63,58 | 2.395 | 131,53 | ||||
| 2026-01-21 | 13F | Stone House Investment Management, LLC | 48 | 0,00 | 2 | 100,00 | ||||
| 2026-02-11 | 13F | Simplex Trading, Llc | 8.399 | -63,76 | 409 | |||||
| 2026-02-17 | 13F | Oaktree Capital Management Lp | 782.250 | -57,52 | 38.064 | -39,91 | ||||
| 2026-02-17 | 13F | LMR Partners LLP | Call | 53.000 | 2.579 | |||||
| 2026-02-10 | 13F | Private Wealth Asset Management, LLC | 10 | 0,00 | 0 | |||||
| 2026-02-10 | 13F | Goldman Sachs Group Inc | 662.965 | -43,57 | 32.260 | -20,18 | ||||
| 2026-04-15 | 13F | Activest Wealth Management | 5.776 | -13,52 | 436 | 33,85 | ||||
| 2025-11-06 | 13F | CIBC World Markets Inc. | 0 | -100,00 | 0 | |||||
| 2026-02-17 | 13F | Susquehanna International Group, Llp | Put | 263.300 | -43,78 | 12.812 | -20,47 | |||
| 2026-02-06 | 13F | Larson Financial Group LLC | 4 | 0 | ||||||
| 2026-02-17 | 13F | Susquehanna International Group, Llp | Call | 500.800 | 138,02 | 24.369 | 236,71 | |||
| 2026-02-17 | 13F | Kirkoswald Asset Management LLC | Call | 171.000 | 8.321 | |||||
| 2026-02-17 | 13F | Kirkoswald Asset Management LLC | 120.000 | 5.816 | ||||||
| 2026-02-11 | 13F | Ramirez Asset Management, Inc. | 13 | 1 | ||||||
| 2025-11-13 | 13F | Parallel Advisors, LLC | 0 | -100,00 | 0 | |||||
| 2025-11-14 | 13F | Axiom International Investors Llc /de | 0 | -100,00 | 0 | |||||
| 2026-02-10 | 13F | BW Gestao de Investimentos Ltda. | 44.500 | 2.165 | ||||||
| 2026-02-17 | 13F | Millennium Management Llc | Call | 0 | -100,00 | 0 | -100,00 | |||
| 2025-11-14 | 13F | Seldon Capital Lp | 0 | -100,00 | 0 | -100,00 | ||||
| 2026-02-05 | 13F | Bessemer Group Inc | 8 | 0,00 | 0 | |||||
| 2026-02-13 | 13F | Boston Partners | 10.764 | 9,71 | 524 | 55,19 | ||||
| 2026-02-13 | 13F | Sofos Investments, Inc. | 0 | -100,00 | 0 | |||||
| 2026-02-17 | 13F | Millennium Management Llc | 0 | -100,00 | 0 | -100,00 | ||||
| 2026-02-13 | 13F | Ubs Asset Management Americas Inc | 49.000 | 2.384 | ||||||
| 2026-01-27 | 13F | Ninety One UK Ltd | 1.237.870 | 4,22 | 60.235 | 47,43 | ||||
| 2026-02-17 | 13F | BTG Pactual Asset Management US LLC | 0 | -100,00 | 0 | |||||
| 2026-02-10 | 13F | Thompson Siegel & Walmsley Llc | 76.900 | 4 | ||||||
| 2026-02-12 | 13F | Dimensional Fund Advisors Lp | 193.878 | -6,48 | 9.431 | 31,76 | ||||
| 2026-04-20 | 13F | North of South Capital LLP | 41.519 | 3.133 | ||||||
| 2026-02-03 | 13F | Legacy Wealth Managment, LLC/ID | 130 | 0,00 | 6 | 50,00 | ||||
| 2026-02-13 | 13F | Y-Intercept (Hong Kong) Ltd | 0 | -100,00 | 0 | |||||
| 2026-02-10 | 13F | Channing Global Advisors, Llc | 4.512 | -0,49 | 220 | 41,29 | ||||
| 2026-04-16 | 13F | Diversified Trust Co | 68.574 | 5.175 | ||||||
| 2026-02-13 | 13F | Pinnacle Wealth Planning Services, Inc. | 340 | 17 | ||||||
| 2026-02-13 | 13F | Caitong International Asset Management Co., Ltd | 0 | -100,00 | 0 | |||||
| 2026-02-17 | 13F | Artisan Partners Limited Partnership | 544.350 | -28,10 | 26.488 | 1,70 | ||||
| 2025-11-14 | 13F | DRW Securities, LLC | 0 | -100,00 | 0 | |||||
| 2025-11-14 | 13F | Millennium Management Llc | Put | 0 | -100,00 | 0 | -100,00 | |||
| 2026-02-17 | 13F | Capital Fund Management S.a. | Call | 0 | -100,00 | 0 | -100,00 | |||
| 2026-01-29 | 13F | IMC-Chicago, LLC | 0 | -100,00 | 0 | |||||
| 2026-02-17 | 13F | Price T Rowe Associates Inc /md/ | 3.989.783 | 11,22 | 194 | 57,72 | ||||
| 2026-04-20 | 13F | White Oak Capital Partners Pte. Ltd. | 158.785 | 11.984 | ||||||
| 2026-01-27 | 13F | TD Waterhouse Canada Inc. | 9.550 | -5,80 | 465 | 36,07 | ||||
| 2026-02-13 | 13F | Peak6 Llc | Put | 0 | -100,00 | 0 | ||||
| 2026-02-13 | 13F | Marshall Wace, Llp | 0 | -100,00 | 0 | |||||
| 2026-02-17 | 13F | Fmr Llc | 696 | 2,96 | 34 | 43,48 | ||||
| 2025-11-04 | 13F | Lingohr & Partner Asset Management GmbH | 8.775 | 0 | ||||||
| 2025-11-14 | 13F | Engineers Gate Manager LP | 0 | -100,00 | 0 | |||||
| 2026-02-17 | 13F | Susquehanna International Group, Llp | 0 | -100,00 | 0 | |||||
| 2026-02-12 | 13F | Ci Investments Inc. | 289.956 | 14.109 | ||||||
| 2026-02-12 | 13F | Jane Street Group, Llc | 142.384 | -40,78 | 6.928 | -16,23 | ||||
| 2026-02-17 | 13F | Encompass Capital Advisors LLC | 594.846 | -38,41 | 28.945 | -12,88 | ||||
| 2026-02-17 | 13F | Grantham, Mayo, Van Otterloo & Co. LLC | 869.908 | -11,50 | 42.330 | 25,19 | ||||
| 2026-02-04 | 13F | Hosking Partners LLP | 113.245 | -1,18 | 5.511 | 39,78 | ||||
| 2026-02-12 | 13F | Jane Street Group, Llc | Put | 35.600 | -63,52 | 1.732 | -48,41 | |||
| 2026-02-12 | 13F | Jane Street Group, Llc | Call | 67.800 | -66,37 | 3.299 | -52,43 | |||
| 2026-02-13 | 13F | Squarepoint Ops LLC | 0 | -100,00 | 0 | |||||
| 2026-02-12 | 13F | Renaissance Technologies Llc | 0 | -100,00 | 0 | |||||
| 2026-04-16 | 13F | SG Americas Securities, LLC | 28.058 | 2 | ||||||
| 2026-02-13 | 13F | Barclays Plc | 64.293 | 11,64 | 3.128 | 57,90 | ||||
| 2026-02-09 | 13F | Legal & General Group Plc | 131.458 | -5,86 | 6.397 | 33,17 | ||||
| 2026-02-13 | 13F | Centiva Capital, LP | 0 | -100,00 | 0 | |||||
| 2025-11-13 | 13F | Wealth High Governance Capital Ltda | 0 | -100,00 | 0 | |||||
| 2026-02-13 | 13F | Victory Capital Management Inc | 249.119 | -1,45 | 12.122 | 39,41 | ||||
| 2026-02-04 | 13F | Schwartz Investment Counsel Inc | 30.000 | 0,00 | 1.460 | 41,38 | ||||
| 2026-04-17 | 13F | Verde Servicos Internacionais S.A. | 8.000 | 1 | ||||||
| 2026-02-17 | 13F | MIRAE ASSET GLOBAL ETFS HOLDINGS Ltd. | 793.291 | -4,25 | 38.602 | 35,45 | ||||
| 2026-01-29 | 13F | Pictet Asset Management Holding SA | 149.310 | 303,96 | 7.265 | 471,60 | ||||
| 2026-02-17 | 13F | Mercer Global Advisors Inc /adv | 13.500 | -0,58 | 657 | 40,47 | ||||
| 2025-11-12 | 13F | William Blair Investment Management, Llc | 0 | -100,00 | 0 | -100,00 | ||||
| 2026-02-17 | 13F | Snowden Capital Advisors LLC | 10.813 | 526 | ||||||
| 2026-02-19 | 13F | CI Private Wealth, LLC | 4.929 | 240 | ||||||
| 2026-02-12 | 13F | Hrt Financial Lp | 0 | -100,00 | 0 | |||||
| 2025-10-31 | 13F | JustInvest LLC | 0 | -100,00 | 0 | -100,00 | ||||
| 2026-02-17 | 13F | Raymond James Financial Inc | 5.009 | 244 | ||||||
| 2026-02-17 | 13F | ACT Capital Management, LLLP | 0 | -100,00 | 0 | |||||
| 2026-02-17 | 13F | Advisor Group Holdings, Inc. | 4.566 | -70,38 | 222 | -62,63 | ||||
| 2026-02-06 | 13F | Pnc Financial Services Group, Inc. | 425 | -2,30 | 21 | 42,86 | ||||
| 2026-02-11 | 13F | Jpmorgan Chase & Co | 3.634.260 | 21,76 | 176.843 | 72,23 | ||||
| 2026-02-13 | 13F | Neuberger Berman Group LLC | 7.531 | -30,04 | 366 | -1,08 | ||||
| 2026-03-06 | 13F | Hsbc Holdings Plc | 13.087 | 633 | ||||||
| 2025-11-13 | 13F | Seacrest Wealth Management, Llc | 0 | -100,00 | 0 | -100,00 | ||||
| 2026-04-13 | 13F | IFP Advisors, Inc | 0 | -100,00 | 0 | |||||
| 2026-01-29 | 13F | UMA Financial Services, Inc. | 6 | 0,00 | 0 | |||||
| 2026-02-17 | 13F | Route One Investment Company, L.P. | 1.024.200 | 49.838 | ||||||
| 2026-01-29 | 13F | Deltec Asset Management Llc | 128.761 | -10,00 | 6.266 | 27,31 | ||||
| 2026-02-12 | 13F | Commonwealth Equity Services, Llc | 13.593 | 0,24 | 661 | |||||
| 2026-01-27 | 13F | WealthCollab, LLC | 254 | 19,81 | 12 | 71,43 | ||||
| 2025-11-14 | 13F | Wealthspire Advisors, LLC | 0 | -100,00 | 0 | -100,00 | ||||
| 2026-01-28 | 13F | Ruffer LLP | 394.510 | 19.227 | ||||||
| 2026-02-02 | 13F | Advisors Preferred, LLC | 13.552 | 661 | ||||||
| 2026-02-12 | 13F | Federated Hermes, Inc. | 4.550 | 221 | ||||||
| 2026-02-17 | 13F | Brevan Howard Capital Management LP | 250.045 | 229,88 | 12.207 | 368,24 | ||||
| 2026-02-17 | 13F | State Of Wisconsin Investment Board | 31.310 | 1.524 | ||||||
| 2026-04-14 | 13F | Beacon Investment Advisory Services, Inc. | 110 | 8 | ||||||
| 2026-02-17 | 13F | Jump Financial, LLC | 82.231 | 4.001 | ||||||
| 2026-02-17 | 13F | Citadel Advisors Llc | Put | 185.100 | -43,12 | 9.007 | -19,54 | |||
| 2026-04-17 | 13F | Bell Investment Advisors, Inc | 20 | 0,00 | 2 | |||||
| 2026-02-17 | 13F | Citadel Advisors Llc | 465.992 | 187,82 | 22.675 | 307,16 | ||||
| 2026-02-17 | 13F | Citadel Advisors Llc | Call | 67.500 | -65,81 | 3.285 | -51,63 | |||
| 2026-02-13 | 13F | Visionary Wealth Advisors | 8.999 | 438 | ||||||
| 2026-01-29 | 13F | UBS Group AG | 323.622 | -12,92 | 15.747 | 23,18 | ||||
| 2026-02-12 | 13F | Insigneo Advisory Services, Llc | 28.131 | -66,79 | 1.369 | -53,04 | ||||
| 2026-02-04 | 13F | Money Concepts Capital Corp | 40.556 | 53,52 | 1.973 | 117,29 | ||||
| 2026-02-17 | 13F | Balyasny Asset Management Llc | 15.881 | -88,67 | 773 | -83,98 | ||||
| 2026-02-17 | 13F | Driehaus Capital Management Llc | 724.010 | 1.123,28 | 35.230 | 1.631,20 | ||||
| 2026-02-11 | 13F | Capital Research Global Investors | 3.335.815 | 26,25 | 162.321 | 78,58 | ||||
| 2026-02-17 | 13F | Russell Investments Group, Ltd. | 228.979 | 24,46 | 11.142 | 76,07 | ||||
| 2025-11-12 | 13F | Itau Unibanco Holding S.A. | 0 | -100,00 | 0 | |||||
| 2026-02-13 | 13F | Sei Investments Co | 127.401 | -4,39 | 6.199 | 35,26 | ||||
| 2026-02-13 | 13F | Fourth Sail Capital LP | 0 | -100,00 | 0 | |||||
| 2026-02-13 | 13F | Squarepoint Ops LLC | Call | 0 | -100,00 | 0 | ||||
| 2026-02-17 | 13F | Two Sigma Securities, Llc | 0 | -100,00 | 0 | |||||
| 2026-02-13 | 13F | Stifel Financial Corp | 8.130 | 4,71 | 396 | 47,94 | ||||
| 2025-11-14 | 13F | Eqis Capital Management, Inc. | 0 | -100,00 | 0 | -100,00 | ||||
| 2026-02-13 | 13F | Mariner, LLC | 7.735 | 376 | ||||||
| 2026-02-17 | 13F | Al Mehwar Commercial Investments LLC | 12.822.581 | 0,00 | 623.947 | 41,45 | ||||
| 2026-02-09 | 13F | Geode Capital Management, Llc | 26.436 | 2,50 | 1.286 | 44,98 | ||||
| 2025-10-30 | 13F | Ridgewood Investments LLC | 0 | -100,00 | 0 | |||||
| 2026-02-13 | 13F | Wells Fargo & Company/mn | 2.731 | -0,33 | 133 | 40,43 | ||||
| 2025-11-14 | 13F | SIR Capital Management, L.P. | 0 | -100,00 | 0 | |||||
| 2026-02-17 | 13F | Capital Fund Management S.a. | Put | 0 | -100,00 | 0 | -100,00 | |||
| 2026-01-07 | 13F | Qp Wealth Management, Llc | 0 | -100,00 | 0 | |||||
| 2025-11-13 | 13F | Wells Fargo & Company/mn | Put | 0 | -100,00 | 0 | -100,00 | |||
| 2026-02-17 | 13F | Mirabella Financial Services Llp | 68.556 | 15,27 | 3.336 | 63,08 | ||||
| 2026-02-17 | 13F | Lighthouse Investment Partners, LLC | 400.000 | 60,00 | 19.464 | 126,33 | ||||
| 2025-11-12 | 13F | LPL Financial LLC | 0 | -100,00 | 0 | |||||
| 2025-11-14 | 13F | Man Group plc | 0 | -100,00 | 0 | |||||
| 2026-02-17 | 13F | XTX Topco Ltd | 24.700 | 109,23 | 1.202 | 195,81 | ||||
| 2026-02-10 | 13F | Bank of New York Mellon Corp | 14.172 | 690 | ||||||
| 2026-02-17 | 13F | Adage Capital Partners Gp, L.l.c. | 0 | -100,00 | 0 | |||||
| 2026-02-12 | 13F | Polen Capital Management Llc | 0 | -100,00 | 0 | |||||
| 2026-02-13 | 13F | Citigroup Inc | 96.473 | 737,80 | 4.694 | 1.085,35 | ||||
| 2026-02-05 | 13F | Center for Financial Planning, Inc. | 0 | -100,00 | 0 | |||||
| 2026-02-11 | 13F | Deutsche Bank Ag\ | 12.575 | 0,00 | 612 | 41,44 | ||||
| 2026-01-28 | 13F | Kapitalo Investimentos Ltda | 0 | -100,00 | 0 | |||||
| 2026-01-26 | 13F | Mirae Asset Global Investments Co., Ltd. | 1.342 | 5,25 | 65 | 51,16 | ||||
| 2026-02-17 | 13F | Qube Research & Technologies Ltd | 0 | -100,00 | 0 | |||||
| 2026-02-10 | 13F | Titan Global Capital Management Usa Llc | 49.195 | 17,46 | 2.394 | 66,18 | ||||
| 2026-02-06 | 13F | Carrhae Capital LLP | 830.212 | 20,60 | 40.398 | 70,59 | ||||
| 2026-02-10 | 13F | NS Partners Ltd | 0 | -100,00 | 0 | |||||
| 2026-02-12 | 13F | Banco BTG Pactual S.A. | 0 | -100,00 | 0 | |||||
| 2025-11-07 | 13F | Fiera Capital Corp | 0 | -100,00 | 0 | -100,00 | ||||
| 2025-11-14 | 13F | Dark Forest Capital Management Lp | 17.056 | 0,00 | 815 | 0,00 | ||||
| 2026-02-11 | 13F | Capital World Investors | 2.479.605 | -16,77 | 120.658 | 17,73 | ||||
| 2026-01-27 | 13F | Ninety One North America, Inc. | 483.830 | -0,75 | 23.543 | 40,40 | ||||
| 2026-02-06 | 13F | HighTower Advisors, LLC | 4.589 | 223 | ||||||
| 2025-11-10 | 13F | X-Square Capital, LLC | 0 | -100,00 | 0 | |||||
| 2026-02-11 | 13F | RWC Asset Management LLP | 746.132 | 87,04 | 36.307 | 164,58 | ||||
| 2026-02-12 | 13F | BlackRock, Inc. | 29.556 | 12,14 | 1.438 | 58,72 | ||||
| 2026-01-06 | 13F | Canal Capital Management, LLC | 5.695 | 277 | ||||||
| 2026-01-23 | 13F | Assetmark, Inc | 34 | 0,00 | 2 | 0,00 | ||||
| 2026-04-14 | 13F | Perpetual Ltd | 20.500 | -24,07 | 1.547 | 17,82 | ||||
| 2026-02-06 | 13F | EverSource Wealth Advisors, LLC | 349 | 23,32 | 17 | 77,78 | ||||
| 2026-04-10 | 13F | Perigon Wealth Management, LLC | 0 | -100,00 | 0 | |||||
| 2026-02-10 | 13F | Bnp Paribas Arbitrage, Sa | 129.491 | -34,92 | 6.301 | -7,95 | ||||
| 2025-11-13 | 13F | B. Metzler seel. Sohn & Co. AG | 0 | -100,00 | 0 | |||||
| 2026-02-17 | 13F | Tudor Investment Corp Et Al | Call | 9.900 | -66,89 | 482 | -53,21 | |||
| 2026-02-17 | 13F | Amundi | 0 | -100,00 | 0 | |||||
| 2026-02-13 | 13F | Cornerstone Financial Management LLC | 18 | 1 | ||||||
| 2026-04-01 | 13F | Confluence Investment Management Llc | 26.827 | 224,35 | 2.025 | 403,48 | ||||
| 2025-11-12 | 13F | American Century Companies Inc | 0 | -100,00 | 0 | |||||
| 2026-02-04 | 13F | Aubrey Capital Management Ltd | 14.579 | -3,90 | 707 | 32,21 | ||||
| 2026-02-11 | 13F | IMA Wealth, Inc. | 6 | 0 | ||||||
| 2026-02-18 | 13F | Vident Advisory, LLC | 12.887 | -9,28 | 627 | 28,48 | ||||
| 2026-02-13 | 13F | State Street Corp | 166.659 | 6,78 | 8.110 | 51,06 | ||||
| 2025-11-14 | 13F | Prelude Capital Management, Llc | 0 | -100,00 | 0 | |||||
| 2026-04-07 | 13F | Farther Finance Advisors, LLC | 551 | 0,00 | 38 | 46,15 | ||||
| 2026-02-13 | 13F | Vontobel Holding Ltd. | 989.803 | -0,49 | 48.164 | 40,76 | ||||
| 2026-02-17 | 13F | Schonfeld Strategic Advisors LLC | 7.313 | -52,11 | 356 | -32,38 | ||||
| 2025-11-12 | 13F | Creekmur Asset Management LLC | 245 | 0,00 | 8 | -27,27 | ||||
| 2025-11-13 | 13F | Quadrature Capital Ltd | 0 | -100,00 | 0 | -100,00 | ||||
| 2026-02-17 | 13F | Discovery Capital Management, Llc / Ct | 0 | -100,00 | 0 | |||||
| 2026-02-17 | 13F | Tudor Investment Corp Et Al | Put | 13.600 | 33,33 | 662 | 88,86 | |||
| 2026-02-12 | 13F | Federation des caisses Desjardins du Quebec | 14.717 | -7,75 | 716 | 30,66 | ||||
| 2026-01-23 | 13F | TT International Asset Management LTD | 27.183 | -9,39 | 1 | -99,90 | ||||
| 2026-02-23 | 13F | Virtu Financial LLC | 0 | -100,00 | 0 | |||||
| 2026-02-13 | 13F | Atlas Capital Advisors Llc | 8.275 | -7,07 | 403 | -5,41 | ||||
| 2026-02-13 | 13F | Verition Fund Management LLC | 50.000 | 2.433 | ||||||
| 2026-01-16 | 13F | FNY Investment Advisers, LLC | 0 | -100,00 | 0 | |||||
| 2026-02-06 | 13F | Kimelman & Baird, LLC | 0 | -100,00 | 0 | |||||
| 2026-02-13 | 13F | Acumen Wealth Advisors, LLC | 185 | 9 | ||||||
| 2025-10-30 | 13F | Twin Peaks Wealth Advisors, LLC | 0 | -100,00 | 0 | |||||
| 2026-02-13 | 13F | Peak6 Llc | Call | 0 | -100,00 | 0 | ||||
| 2026-02-17 | 13F | Interval Partners, LP | 61.483 | 2.992 | ||||||
| 2026-02-12 | 13F | Marex Group plc | 29.586 | 1.440 | ||||||
| 2026-02-03 | 13F | SBI Securities Co., Ltd. | 6.167 | -4,49 | 300 | 35,14 | ||||
| 2026-04-17 | 13F | Tectonic Advisors Llc | 0 | -100,00 | 0 | |||||
| 2026-02-09 | 13F | Frazier Financial Advisors, LLC | 112 | 0,00 | 5 | 66,67 | ||||
| 2026-02-17 | 13F | Wellington Management Group Llp | 0 | -100,00 | 0 | |||||
| 2025-11-07 | 13F | State of New Jersey Common Pension Fund D | 0 | -100,00 | 0 | |||||
| 2026-02-06 | 13F | GPS Wealth Strategies Group, LLC | 0 | -100,00 | 0 | |||||
| 2026-02-13 | 13F | Ubs Oconnor Llc | 0 | -100,00 | 0 | |||||
| 2026-02-13 | 13F | Truffle Hound Capital, LLC | 40.000 | 0,00 | 1.946 | 41,42 | ||||
| 2026-02-18 | 13F | GWM Advisors LLC | 700 | 0,00 | 34 | 41,67 | ||||
| 2025-10-21 | 13F | Global Retirement Partners, LLC | 0 | -100,00 | 0 | |||||
| 2026-02-17 | 13F | Moneda S.A. Administradora General de Fondos | 31.085 | -24,05 | 1.513 | -23,71 | ||||
| 2025-11-14 | 13F | Wolverine Trading, Llc | 18.659 | 661 | ||||||
| 2025-11-14 | 13F | Wolverine Trading, Llc | Call | 25.200 | 892 | |||||
| 2025-11-14 | 13F | Wolverine Trading, Llc | Put | 56.400 | 1.997 | |||||
| 2026-02-10 | 13F/A | Northwestern Mutual Wealth Management Co | 14 | 1 | ||||||
| 2026-02-13 | 13F | Platinum Investment Management Ltd | 1.370 | 67 | ||||||
| 2026-02-13 | 13F | Peak6 Llc | 0 | -100,00 | 0 | |||||
| 2026-04-06 | 13F | GAMMA Investing LLC | 947 | 12,47 | 71 | 77,50 | ||||
| 2026-02-17 | 13F | Advisory Services Network, LLC | 0 | -100,00 | 0 | |||||
| 2026-02-12 | 13F | Campbell & CO Investment Adviser LLC | 64.280 | 63,65 | 3.128 | 131,46 | ||||
| 2026-02-17 | 13F | Ameriprise Financial Inc | 208.413 | -46,03 | 10.141 | -23,65 | ||||
| 2026-02-05 | 13F | DnB Asset Management AS | 197.374 | 9.604 | ||||||
| 2026-02-09 | 13F | Huntington National Bank | 450 | 0,00 | 22 | 40,00 | ||||
| 2026-01-08 | 13F | True Wealth Design, LLC | 0 | -100,00 | 0 | |||||
| 2026-02-17 | 13F | Tower Research Capital LLC (TRC) | 112 | 5 | ||||||
| 2025-11-14 | 13F | Webs Creek Capital Management LP | 0 | -100,00 | 0 | |||||
| 2026-02-13 | 13F | Gemsstock Ltd. | 613.017 | 97,67 | 29.829 | 179,64 | ||||
| 2026-02-17 | 13F | Jones Financial Companies Lllp | 376 | -30,24 | 18 | -5,26 | ||||
| 2025-11-14 | 13F | Lazard Asset Management Llc | 0 | -100,00 | 0 | -100,00 | ||||
| 2026-02-17 | 13F | Mason Hill Advisors Llc | 150.367 | 7.317 |
Other Listings
| DE:1CIA | 53,20 € |