Grundlæggende statistik
| Institutionelle ejere | 306 total, 298 long only, 0 short only, 8 long/short - change of 5,88% MRQ |
| Gennemsnitlig porteføljeallokering | 0.0553 % - change of -37,66% MRQ |
| Institutionelle aktier (lange) | 158.320.949 (ex 13D/G) - change of 2,46MM shares 1,58% MRQ |
| Institutionel værdi (lang) | $ 1.203.775 USD ($1000) |
Institutionelt ejerskab og aktionærer
United Microelectronics Corporation - Depositary Receipt (Common Stock) (US:UMC) har 306 institutionelle ejere og aktionærer, der har indsendt 13D/G- eller 13F-formularer til Securities Exchange Commission (SEC). Disse institutioner har i alt 158,320,949 aktier. Største aktionærer omfatter BlackRock, Inc., Vanguard Group Inc, Aqr Capital Management Llc, SOXL - Direxion Daily Semiconductor Bull 3X Shares, Morgan Stanley, VEIEX - Vanguard Emerging Markets Stock Index Fund Investor Shares, Rafferty Asset Management, LLC, Two Sigma Investments, Lp, Bank Of America Corp /de/, and Barclays Plc .
United Microelectronics Corporation - Depositary Receipt (Common Stock) (NYSE:UMC) institutionel ejerskabsstruktur viser aktuelle positioner i virksomheden efter institutioner og fonde, samt seneste ændringer i positionsstørrelse. Større aktionærer kan omfatte individuelle investorer, investeringsforeninger, hedgefonde eller institutioner. Skema 13D angiver, at investoren besidder (eller besidder) mere end 5 % af virksomheden og har til hensigt (eller har til hensigt at) aktivt at forfølge en ændring i forretningsstrategi. Skema 13G indikerer en passiv investering på over 5%.
The share price as of March 19, 2026 is 9,26 / share. Previously, on March 20, 2025, the share price was 6,73 / share. This represents an increase of 37,59% over that period.

Fondens stemningsscore
Fund Sentiment Score (fka Ownership Accumulation Score) finder de aktier, der bliver mest købt af fonde. Det er resultatet af en sofistikeret, multi-faktor kvantitativ model, der identificerer virksomheder med de højeste niveauer af institutionel akkumulering. Scoringsmodellen bruger en kombination af den samlede stigning i oplyste ejere, ændringerne i porteføljeallokeringer i disse ejere og andre målinger. Tallet går fra 0 til 100, hvor højere tal indikerer et højere niveau af akkumulering for sine jævnaldrende, og 50 er gennemsnittet.
Opdateringsfrekvens: Dagligt
Se Ownership Explorer, som giver en liste over højest rangerende virksomheder.
AI+ Ask Fintel’s AI assistant about United Microelectronics Corporation - Depositary Receipt (Common Stock).
Select a question to share a public post with an AI-crafted answer.
Thinking of good questions…
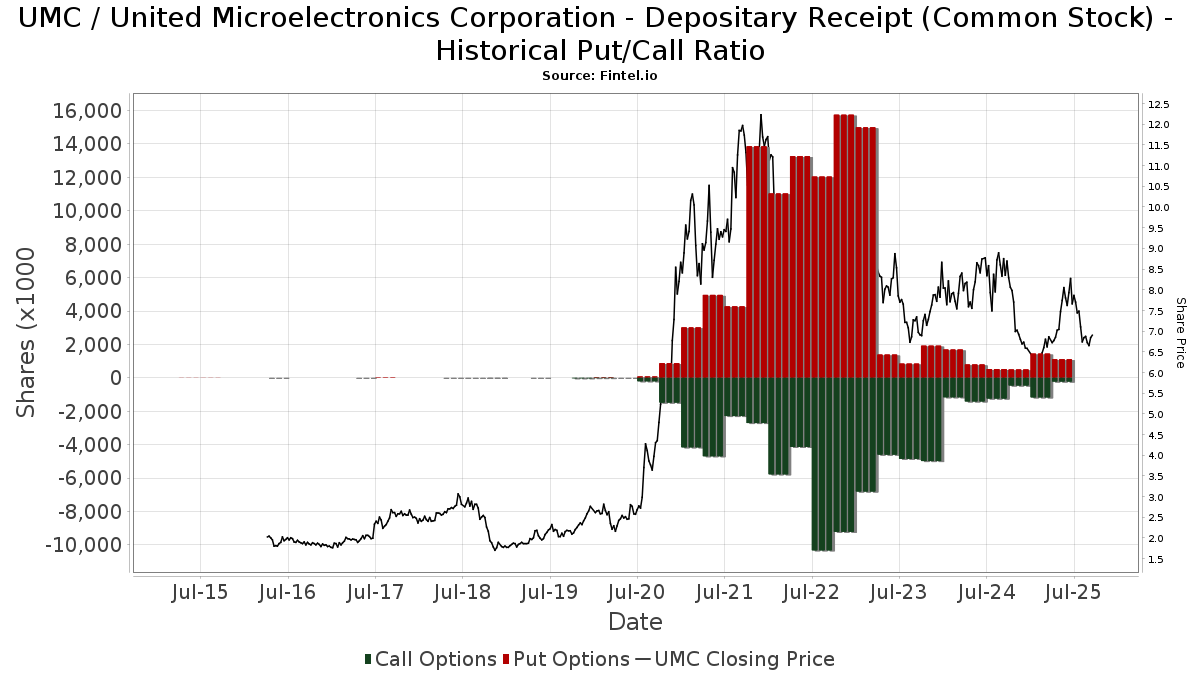
Institutionel Put/Call-forhold
Ud over at indberette standardaktie- og gældsudstedelser skal institutter med mere end 100 mill. aktiver under forvaltning også oplyse deres put- og call-optionsbeholdninger. Da salgsoptioner generelt indikerer negativ stemning, og købsoptioner indikerer positiv stemning, kan vi få en fornemmelse af den overordnede institutionelle stemning ved at plotte forholdet mellem put og kald. Diagrammet til højre viser det historiske put/call-forhold for dette instrument.
Brug af Put/Call Ratio som en indikator for investorernes stemning overvinder en af de vigtigste mangler ved at bruge totalt institutionelt ejerskab, som er, at en betydelig mængde af aktiver under forvaltning investeres passivt for at spore indekser. Passivt forvaltede fonde køber typisk ikke optioner, så indikatoren for put/call-forholdet følger mere nøje følelsen af aktivt forvaltede fonde.
13F og NPORT arkivering
Detaljer om 13F-arkivering er gratis. Detaljer om NP-ansøgninger kræver et premium-medlemskab. Grønne rækker angiver nye positioner. Røde rækker angiver lukkede positioner. Klik på linket ikon for at se den fulde transaktionshistorik.
Opgrader
for at låse premium-data op og eksportere til Excel ![]() .
.
| Fil dato | Kilde | Investor | Type | Gennemsnitlig pris (Øst) |
Aktier | Δ Aktier (%) |
Rapporteret Værdi ($1000) |
Δ Værdi (%) |
Port Alloc (%) |
|
|---|---|---|---|---|---|---|---|---|---|---|
| 2026-02-10 | 13F | Sivia Capital Partners, LLC | 24.794 | -9,28 | 195 | -6,28 | ||||
| 2026-01-09 | 13F | Dynamic Advisor Solutions LLC | 11.655 | 92 | ||||||
| 2026-02-11 | 13F | Vise Technologies, Inc. | 142.234 | 6,01 | 1.118 | 9,94 | ||||
| 2026-02-12 | 13F | Skopos Labs, Inc. | 133.613 | 230,35 | 1.065 | 243,23 | ||||
| 2026-02-11 | 13F | Simplex Trading, Llc | Put | 0 | -100,00 | 0 | ||||
| 2026-02-03 | 13F | Encompass More Asset Management | 0 | -100,00 | 0 | |||||
| 2026-02-13 | 13F | Morgan Stanley | 7.668.830 | -64,90 | 60.277 | -63,61 | ||||
| 2026-02-13 | 13F | SRS Capital Advisors, Inc. | 8.656 | 583,73 | 68 | 655,56 | ||||
| 2026-02-11 | 13F | Simplex Trading, Llc | Call | 0 | -100,00 | 0 | ||||
| 2026-02-11 | 13F | Simplex Trading, Llc | 0 | -100,00 | 0 | |||||
| 2026-01-30 | 13F | R Squared Ltd | 27.926 | 219 | ||||||
| 2026-01-14 | 13F | Generali Investments CEE, investicni spolecnost, a.s. | 101.415 | -40,14 | 797 | -37,93 | ||||
| 2026-01-29 | 13F | Resonant Capital Advisors, LLC | 20.804 | 164 | ||||||
| 2026-02-10 | 13F | Bnp Paribas Arbitrage, Sa | 1.474.210 | -1,48 | 11.587 | 2,16 | ||||
| 2026-02-17 | 13F | United Capital Financial Advisers, Llc | 19.402 | 10,71 | 153 | 15,15 | ||||
| 2026-02-17 | 13F | Summit Global Investments | 261.121 | 80,50 | 2 | 100,00 | ||||
| 2025-10-28 | 13F | BRYN MAWR TRUST Co | 325 | 0,00 | 2 | 0,00 | ||||
| 2026-02-12 | 13F | Wealthspire Advisors, LLC | 10.006 | 1.988,94 | 79 | 2.500,00 | ||||
| 2026-02-13 | 13F | Citigroup Inc | 3.008.360 | 31,07 | 23.646 | 35,91 | ||||
| 2026-01-13 | 13F | CoreCap Advisors, LLC | 369 | -86,84 | 3 | -90,48 | ||||
| 2026-02-17 | 13F | FIL Ltd | 78.854 | 620 | ||||||
| 2025-11-12 | 13F | Park Square Financial Group, LLC | 0 | -100,00 | 0 | |||||
| 2026-01-15 | 13F | Highline Wealth Partners Llc | 795 | 22,87 | 6 | 50,00 | ||||
| 2026-01-26 | 13F | Merit Financial Group, LLC | 10.389 | 82 | ||||||
| 2026-02-23 | 13F | Beaird Harris Wealth Management, LLC | 1.000 | 0,00 | 8 | 0,00 | ||||
| 2026-01-21 | 13F | Leo Wealth, LLC | 14.948 | 2,96 | 117 | 6,36 | ||||
| 2026-01-23 | 13F | Assetmark, Inc | 15.185 | 514,03 | 119 | 561,11 | ||||
| 2026-01-26 | 13F | PDS Planning, Inc | 73.876 | 8,01 | 581 | 11,97 | ||||
| 2026-02-05 | 13F | Abacus Wealth Partners, LLC | 56.625 | 445 | ||||||
| 2026-02-05 | 13F | Bank Julius Baer & Co. Ltd, Zurich | 8.107 | 0,00 | 64 | 3,28 | ||||
| 2026-02-10 | 13F | Verus Capital Partners, Llc | 57.300 | 25,93 | 450 | 30,81 | ||||
| 2025-09-25 | NP | IPAYX - Integrity Dividend Summit Fund Class I | 12.000 | 82 | ||||||
| 2025-12-15 | 13F | FNY Investment Advisers, LLC | 0 | -100,00 | 0 | |||||
| 2026-02-13 | 13F | Y-Intercept (Hong Kong) Ltd | 0 | -100,00 | 0 | |||||
| 2025-09-25 | NP | Dfa Investment Trust Co - The Emerging Markets Series This fund is a listed as child fund of Dimensional Fund Advisors Lp and if that institution has disclosed ownership in this security, then these positions will not be double counted when calculating total shares and total value | 59.082 | 0,00 | 404 | -2,65 | ||||
| 2026-02-17 | 13F | Engineers Gate Manager LP | 32.127 | 13,92 | 253 | 18,31 | ||||
| 2026-02-12 | 13F | Jane Street Group, Llc | Put | 770.100 | -0,36 | 6.053 | 3,31 | |||
| 2026-01-29 | 13F | Vanguard Group Inc | 13.524.036 | -5,11 | 106.299 | -1,61 | ||||
| 2026-02-13 | 13F | Wells Fargo & Company/mn | 3.274 | 15,98 | 26 | 19,05 | ||||
| 2026-02-06 | 13F | Vestmark Advisory Solutions, Inc. | 75.826 | 596 | ||||||
| 2026-02-09 | 13F | Key FInancial Inc | 1.200 | 0,00 | 9 | 12,50 | ||||
| 2026-01-20 | 13F | Arta Finance Wealth Management LLC | 39.294 | 309 | ||||||
| 2025-11-07 | 13F | Sierra Ocean, Llc | 0 | -100,00 | 0 | |||||
| 2025-09-29 | NP | SOXL - Direxion Daily Semiconductor Bull 3X Shares | 7.915.109 | 17,14 | 54.139 | 13,81 | ||||
| 2026-02-12 | 13F | BlackRock, Inc. | 26.983.515 | 11,78 | 212.090 | 15,91 | ||||
| 2026-02-17 | 13F | Silvercrest Asset Management Group Llc | 24.070 | 28,85 | 189 | 34,04 | ||||
| 2026-02-13 | 13F | Inspire Advisors, LLC | 18.872 | 1,25 | 148 | 4,96 | ||||
| 2026-02-13 | 13F | Sofos Investments, Inc. | 1 | 0 | ||||||
| 2025-11-12 | 13F | Steward Partners Investment Advisory, Llc | 0 | -100,00 | 0 | |||||
| 2025-09-25 | NP | DEXC - Dimensional Emerging Markets ex China Core Equity ETF | 89.800 | 18,16 | 614 | 14,77 | ||||
| 2026-01-20 | 13F | Signaturefd, Llc | 230.104 | 1,20 | 1.809 | 4,93 | ||||
| 2026-02-17 | 13F | Susquehanna International Group, Llp | Put | 271.100 | -17,70 | 2.131 | -14,66 | |||
| 2026-02-13 | 13F | Kestra Advisory Services, LLC | 6.679 | 52 | ||||||
| 2026-02-17 | 13F | Susquehanna International Group, Llp | Call | 32.100 | -37,79 | 252 | -35,55 | |||
| 2026-02-13 | 13F | MAI Capital Management | 7.186 | 65,65 | 56 | 75,00 | ||||
| 2026-01-22 | 13F | Venturi Wealth Management, LLC | 14.614 | 115 | ||||||
| 2026-02-13 | 13F | JustInvest LLC | 412.380 | 23,71 | 3.241 | 28,31 | ||||
| 2026-02-13 | 13F | Walleye Trading LLC | Call | 29.300 | 0,00 | 230 | 3,60 | |||
| 2026-02-17 | 13F | Susquehanna International Group, Llp | 470.067 | 7,75 | 3.695 | 11,74 | ||||
| 2026-02-17 | 13F | Guggenheim Capital Llc | 412.327 | 6,81 | 3.241 | 10,73 | ||||
| 2026-02-03 | 13F | Redwood Wealth Management Group, LLC | 0 | -100,00 | 0 | |||||
| 2026-02-13 | 13F | Rhumbline Advisers | 729.332 | 0,94 | 5.733 | 4,67 | ||||
| 2026-02-13 | 13F | Walleye Capital LLC | 16.240 | 128 | ||||||
| 2026-02-13 | 13F | Walleye Capital LLC | Call | 3.300 | -75,19 | 26 | -75,00 | |||
| 2026-02-11 | 13F | LPL Financial LLC | 66.943 | -1,81 | 526 | 1,94 | ||||
| 2026-01-21 | 13F | Stone House Investment Management, LLC | 495 | 83,33 | 4 | 50,00 | ||||
| 2026-02-06 | 13F | Profund Advisors Llc | 125.803 | -4,64 | 989 | -1,10 | ||||
| 2025-09-25 | NP | DFAX - Dimensional World ex U.S. Core Equity 2 ETF | 6.600 | -72,68 | 45 | -75,81 | ||||
| 2026-02-13 | 13F | Walleye Capital LLC | Put | 20.000 | 0,00 | 157 | 3,97 | |||
| 2026-01-29 | 13F | Aprio Wealth Management, LLC | 23.610 | 7,09 | 186 | 10,78 | ||||
| 2025-10-30 | 13F | Twin Peaks Wealth Advisors, LLC | 0 | -100,00 | 0 | |||||
| 2026-02-12 | 13F | Jane Street Group, Llc | Call | 54.000 | 424 | |||||
| 2026-02-12 | 13F | Jane Street Group, Llc | 459.153 | 83,76 | 3.609 | 90,60 | ||||
| 2025-09-25 | NP | VMNVX - Vanguard Global Minimum Volatility Fund Admiral Shares | 4.444.799 | -6,30 | 30.402 | -8,96 | ||||
| 2025-10-21 | 13F | Simon Quick Advisors, Llc | 0 | -100,00 | 0 | -100,00 | ||||
| 2026-02-13 | 13F | Schroder Investment Management Group | 4.104.976 | -1,15 | 32.676 | 3,66 | ||||
| 2026-02-17 | 13F | Ameriprise Financial Inc | 26.577 | 2,81 | 209 | 6,67 | ||||
| 2026-02-11 | 13F | Parallel Advisors, LLC | 121.132 | -0,38 | 952 | 3,37 | ||||
| 2025-09-25 | NP | DFCEX - Emerging Markets Core Equity Portfolio - Institutional Class This fund is a listed as child fund of Dimensional Fund Advisors Lp and if that institution has disclosed ownership in this security, then these positions will not be double counted when calculating total shares and total value | 82.862 | 0,00 | 567 | -2,92 | ||||
| 2025-11-14 | 13F | Mml Investors Services, Llc | 0 | -100,00 | 0 | |||||
| 2026-02-12 | 13F | North of South Capital LLP | 202.000 | 61,60 | 1.588 | 67,58 | ||||
| 2025-10-27 | 13F | Kiker Wealth Management, LLC | 0 | -100,00 | 0 | -100,00 | ||||
| 2026-01-30 | 13F | Bogart Wealth, LLC | 4 | 0,00 | 0 | |||||
| 2025-10-27 | 13F | First Horizon Corp | 0 | -100,00 | 0 | -100,00 | ||||
| 2026-02-17 | 13F | Two Sigma Advisers, Lp | 3.449.200 | 114,28 | 27.111 | 122,19 | ||||
| 2026-02-17 | 13F | Safe Harbor Fiduciary, LLC | 300 | 0,00 | 2 | 0,00 | ||||
| 2026-02-11 | 13F | Cedar Mountain Advisors, LLC | 1.000 | 0,00 | 8 | 0,00 | ||||
| 2026-01-28 | 13F | CAPROCK Group, Inc. | 104.116 | -2,13 | 818 | 16,86 | ||||
| 2026-02-11 | 13F | Buckingham Strategic Partners | 45.925 | 35,70 | 361 | 41,73 | ||||
| 2026-02-06 | 13F | Larson Financial Group LLC | 758 | 1,07 | 6 | 0,00 | ||||
| 2025-09-26 | NP | UUPIX - Ultraemerging Markets Profund Investor Class | 11.400 | 18,49 | 78 | 14,93 | ||||
| 2025-09-25 | NP | DFAE - Dimensional Emerging Core Equity Market ETF | 467.600 | 30,98 | 3.198 | 27,26 | ||||
| 2026-02-05 | 13F | Bessemer Group Inc | 12.558 | 5,23 | 0 | |||||
| 2026-02-03 | 13F | Sageworth Trust Co | 0 | -100,00 | 0 | -100,00 | ||||
| 2026-02-13 | 13F | PCM Encore, LLC | 36.659 | 288 | ||||||
| 2025-10-30 | 13F | Ridgewood Investments LLC | 54.667 | 414 | ||||||
| 2026-02-17 | 13F | Mercer Global Advisors Inc /adv | 39.704 | -2,52 | 312 | 1,30 | ||||
| 2025-11-07 | 13F | Wealth Alliance | 0 | -100,00 | 0 | -100,00 | ||||
| 2025-10-07 | 13F | Carolina Wealth Advisors, LLC | 0 | -100,00 | 0 | |||||
| 2026-02-13 | 13F | Cornerstone Financial Management LLC | 494 | 4 | ||||||
| 2026-02-10 | 13F/A | Northwestern Mutual Wealth Management Co | 2.083 | 2,31 | 16 | 6,67 | ||||
| 2025-11-06 | 13F | Wealthstream Advisors, Inc. | 23.586 | -6,42 | 179 | -7,29 | ||||
| 2025-09-25 | NP | VEU - Vanguard FTSE All-World ex-US Index Fund ETF Shares | 2.242.390 | -1,78 | 15.338 | -4,57 | ||||
| 2026-02-18 | 13F | Mackenzie Financial Corp | 252.150 | 0,09 | 2.003 | 4,92 | ||||
| 2026-01-08 | 13F | True Wealth Design, LLC | 889 | 49,92 | 7 | 50,00 | ||||
| 2026-01-23 | 13F | Bridgewater Advisors Inc. | 78.354 | 0,47 | 872 | 52,98 | ||||
| 2026-02-13 | 13F | Candriam Luxembourg S.C.A. | 28.764 | 0,00 | 226 | 3,67 | ||||
| 2026-02-13 | 13F | Centiva Capital, LP | 13.269 | 104 | ||||||
| 2026-02-13 | 13F | Ubs Asset Management Americas Inc | 25.895 | 204 | ||||||
| 2026-02-09 | 13F | Hantz Financial Services, Inc. | 64.090 | 51,90 | 1 | |||||
| 2026-02-02 | 13F | Qrg Capital Management, Inc. | 40.378 | -8,50 | 317 | -5,09 | ||||
| 2025-11-14 | 13F | Jain Global LLC | 0 | -100,00 | 0 | -100,00 | ||||
| 2026-02-13 | 13F | Ariadne Wealth Management, LP | 42.006 | 0,26 | 432 | 45,45 | ||||
| 2026-02-17 | 13F | Jump Financial, LLC | 94.282 | -57,79 | 741 | -56,21 | ||||
| 2026-02-05 | 13F | Allworth Financial LP | 8.817 | 20,47 | 69 | 25,45 | ||||
| 2026-02-13 | 13F | Umb Bank N A/mo | 0 | -100,00 | 0 | |||||
| 2026-02-13 | 13F | Aigen Investment Management, Lp | 0 | -100,00 | 0 | |||||
| 2026-02-13 | 13F | Toroso Investments, LLC | 147.034 | 21,00 | 1.156 | 25,41 | ||||
| 2026-01-27 | 13F | WealthCollab, LLC | 1.068 | 0,00 | 8 | 0,00 | ||||
| 2026-02-17 | 13F | Man Group plc | 2.123.977 | 340,17 | 16.694 | 356,49 | ||||
| 2025-09-29 | NP | SPTE - SP Funds S&P Global Technology ETF | 85.923 | 35,54 | 588 | 31,61 | ||||
| 2026-02-13 | 13F | Neuberger Berman Group LLC | 56.901 | 76,25 | 447 | 83,20 | ||||
| 2026-01-16 | 13F | Ronald Blue Trust, Inc. | 85.486 | -37,94 | 672 | -35,73 | ||||
| 2026-02-19 | 13F | CI Private Wealth, LLC | 146.966 | 8,44 | 1.155 | 12,46 | ||||
| 2026-02-17 | 13F | Bank Of America Corp /de/ | 5.603.690 | -24,16 | 44.045 | -21,36 | ||||
| 2026-02-03 | 13F | We Are One Seven, LLC | 10.245 | 0,65 | 81 | 3,90 | ||||
| 2026-01-09 | 13F | Diversified Trust Co | 14.835 | 1,07 | 117 | 4,50 | ||||
| 2026-01-26 | 13F | Foster Victor Wealth Advisors, LLC | 38.635 | 35,79 | 359 | 74,27 | ||||
| 2025-11-14 | 13F | Wetherby Asset Management Inc | 320.156 | -2,03 | 2.427 | -3,00 | ||||
| 2025-11-03 | 13F | Valeo Financial Advisors, LLC | 0 | -100,00 | 0 | -100,00 | ||||
| 2026-02-13 | 13F | Rafferty Asset Management, LLC | 6.477.830 | 4,13 | 50.916 | 7,98 | ||||
| 2026-02-09 | 13F | Legal & General Group Plc | 0 | -100,00 | 0 | -100,00 | ||||
| 2026-02-19 | 13F | Atomi Financial Group, Inc. | 53.144 | 18,70 | 418 | 23,01 | ||||
| 2026-02-12 | 13F | Xponance, Inc. | 20.494 | 7,24 | 161 | 11,81 | ||||
| 2026-02-13 | 13F | Arete Wealth Advisors, LLC | 0 | -100,00 | 0 | |||||
| 2026-01-30 | 13F | North Star Investment Management Corp. | 779 | 1.045,59 | 6 | |||||
| 2026-01-29 | 13F | UMA Financial Services, Inc. | 619 | 66,40 | 5 | 100,00 | ||||
| 2026-02-09 | 13F | Cary Street Partner Investment Advisory Llc | 9.553 | 75 | ||||||
| 2026-02-09 | 13F | Cary Street Partners Financial Llc | 1.000 | 8 | ||||||
| 2026-02-06 | 13F | FourThought Financial Partners, LLC | 31.357 | 0,00 | 246 | 3,80 | ||||
| 2026-02-13 | 13F | Cozad Asset Management Inc | 14.129 | 0,00 | 111 | 3,74 | ||||
| 2026-03-04 | 13F | SHP Wealth Management | 1.878 | 15 | ||||||
| 2026-02-03 | 13F | Ethic Inc. | 495.589 | 16,61 | 3.895 | 20,93 | ||||
| 2026-01-26 | 13F | Mirae Asset Global Investments Co., Ltd. | 168.648 | 3.854,23 | 1.326 | 4.040,63 | ||||
| 2026-01-21 | 13F | Greenleaf Trust | 152.034 | 1,16 | 1.195 | 4,83 | ||||
| 2026-01-15 | 13F | Nisa Investment Advisors, Llc | 2.072 | 314,40 | 16 | 433,33 | ||||
| 2026-02-17 | 13F | Advisory Services Network, LLC | 0 | -100,00 | 0 | |||||
| 2026-02-10 | 13F | Savant Capital, LLC | 20.884 | -5,44 | 164 | -1,80 | ||||
| 2026-02-17 | 13F | Balyasny Asset Management Llc | 1.980.820 | 2.011,21 | 15.569 | 2.089,73 | ||||
| 2026-02-13 | 13F | Mariner, LLC | 173.096 | 20,28 | 1.365 | 25,14 | ||||
| 2026-02-17 | 13F | Creative Planning | 2.160.185 | 17,02 | 16.979 | 21,35 | ||||
| 2026-02-13 | 13F | Focused Alpha, Llc | 28.108 | 221 | ||||||
| 2026-01-20 | 13F | Ascent Group, LLC | 14.372 | 2,32 | 113 | 5,66 | ||||
| 2026-02-04 | 13F | BCJ Capital Management, LLC | 25.647 | 26,10 | 202 | 30,52 | ||||
| 2025-09-24 | NP | EMQAX - Ashmore Emerging Markets Active Equity Fund CLASS A | 20.991 | -2,94 | 144 | -20,99 | ||||
| 2025-09-24 | NP | SGIDX - Steward Global Equity Income Fund Class A | 545.983 | 0,85 | 3.735 | -2,02 | ||||
| 2025-09-25 | NP | DFEM - Dimensional Emerging Markets Core Equity 2 ETF | 394.872 | 110,04 | 2.701 | 104,08 | ||||
| 2025-11-12 | 13F | NewSquare Capital LLC | 0 | -100,00 | 0 | -100,00 | ||||
| 2026-02-10 | 13F | Goldman Sachs Group Inc | 4.725.906 | 7,12 | 37.146 | 11,08 | ||||
| 2026-02-17 | 13F | Tower Research Capital LLC (TRC) | 199.675 | 84.508,05 | 1.569 | 156.800,00 | ||||
| 2026-01-08 | 13F | Tuttle Tactical Management LLC | 13.663 | 107 | ||||||
| 2026-02-13 | 13F | NLB Skladi, upravljanje premozenja, d.o.o. | 172.358 | 1.355 | ||||||
| 2025-11-13 | 13F | Glenmede Investment Management, LP | 27.377 | -1,18 | 208 | -1,90 | ||||
| 2025-11-14 | 13F | AXA Investment Managers S.A. | 71.783 | 544 | ||||||
| 2025-09-25 | NP | VEIEX - Vanguard Emerging Markets Stock Index Fund Investor Shares | 6.635.860 | -1,94 | 45.389 | -4,73 | ||||
| 2026-01-26 | 13F | Cwm, Llc | 24.299 | 9,98 | 0 | |||||
| 2026-02-17 | 13F | Ancora Advisors, LLC | 480 | 25,98 | 4 | 50,00 | ||||
| 2026-01-30 | 13F | CBOE Vest Financial, LLC | 21.259 | 53,13 | 167 | 59,05 | ||||
| 2026-01-28 | 13F | HB Wealth Management, LLC | 19.441 | 66,56 | 153 | 72,73 | ||||
| 2026-02-11 | 13F | O'shaughnessy Asset Management, Llc | 383.114 | 3,74 | 3.011 | 7,57 | ||||
| 2026-02-13 | 13F | Vontobel Holding Ltd. | 30.387 | 239 | ||||||
| 2026-02-12 | 13F | Commonwealth Equity Services, Llc | 11.599 | -16,64 | 91 | |||||
| 2026-02-17 | 13F | Aqr Capital Management Llc | 9.464.312 | 873,85 | 74.389 | 909,90 | ||||
| 2026-02-17 | 13F | Laird Norton Trust Company, Llc | 455.045 | 3.577 | ||||||
| 2026-02-11 | 13F | Jpmorgan Chase & Co | 141.340 | -76,75 | 1.111 | -75,91 | ||||
| 2026-02-13 | 13F | Arrowstreet Capital, Limited Partnership | 128.821 | 1.013 | ||||||
| 2026-02-13 | 13F | First Trust Advisors Lp | 433.653 | 3,83 | 3.409 | 7,68 | ||||
| 2026-02-17 | 13F | Optiver Holding B.V. | 0 | -100,00 | 0 | |||||
| 2025-09-24 | NP | SNTKX - Steward International Enhanced Index Fund Class A | 136.133 | 0,00 | 931 | -2,82 | ||||
| 2026-01-26 | 13F | Moran Wealth Management, LLC | 792.367 | 13,76 | 6.228 | 17,98 | ||||
| 2026-02-05 | 13F | Cambridge Investment Research Advisors, Inc. | 75.503 | -6,70 | 1 | |||||
| 2026-02-09 | 13F | Wiser Advisor Group LLC | 1.469 | 0,00 | 12 | 0,00 | ||||
| 2026-02-06 | 13F | GPS Wealth Strategies Group, LLC | 0 | -100,00 | 0 | |||||
| 2026-02-17 | 13F | Aquatic Capital Management LLC | 767.634 | 169,33 | 6.034 | 179,31 | ||||
| 2026-02-18 | 13F | Vident Advisory, LLC | 557.280 | -4,57 | 4.380 | -1,04 | ||||
| 2026-02-11 | 13F | Prestige Wealth Management Group LLC | 661 | 0,00 | 5 | 0,00 | ||||
| 2026-02-14 | 13F | Rockefeller Capital Management L.P. | 0 | -100,00 | 0 | |||||
| 2026-02-17 | 13F | Advisor Group Holdings, Inc. | 21.790 | 81,52 | 171 | 92,13 | ||||
| 2026-02-11 | 13F | Franklin Resources Inc | 23.170 | -0,86 | 182 | 2,82 | ||||
| 2026-02-18 | 13F | EP Wealth Advisors, Inc. | 17.112 | 134 | ||||||
| 2026-02-17 | 13F | KADENSA CAPITAL Ltd | 1.335.392 | 10.496 | ||||||
| 2026-01-28 | 13F | B. Metzler seel. Sohn & Co. AG | 658.821 | 5.197 | ||||||
| 2026-02-06 | 13F | Abn Amro Investment Solutions | 21.900 | 172 | ||||||
| 2026-02-11 | 13F | Empowered Funds, LLC | 1.525.280 | 11.989 | ||||||
| 2026-02-10 | 13F | Natixis Advisors, L.p. | 177.454 | 12,71 | 1 | 0,00 | ||||
| 2026-02-06 | 13F | Lsv Asset Management | 694.211 | 22,74 | 5 | 25,00 | ||||
| 2026-02-05 | 13F | Atria Investments Llc | 15.970 | -0,60 | 126 | 3,31 | ||||
| 2026-01-06 | 13F | Nelson, Van Denburg & Campbell Wealth Management Group, LLC | 15.068 | 4,88 | 118 | 9,26 | ||||
| 2026-02-03 | 13F | Crestwood Advisors Group LLC | 19.501 | 48,96 | 153 | 54,55 | ||||
| 2026-02-10 | 13F | Connor, Clark & Lunn Investment Management Ltd. | 14.467 | 114 | ||||||
| 2026-02-13 | 13F | Flow Traders U.s. Llc | 18.508 | 0 | ||||||
| 2026-02-06 | 13F | Hardy Reed LLC | 11.228 | 88 | ||||||
| 2026-02-12 | 13F | Principal Securities, Inc. | 0 | -100,00 | 0 | |||||
| 2025-09-25 | NP | VGTSX - Vanguard Total International Stock Index Fund Investor Shares | 980.522 | -2,53 | 6.707 | -5,31 | ||||
| 2026-02-03 | 13F | SBI Securities Co., Ltd. | 9.740 | -8,60 | 77 | -5,00 | ||||
| 2026-02-10 | 13F | Envestnet Asset Management Inc | 100.815 | 109,97 | 792 | 118,18 | ||||
| 2025-11-12 | 13F | Creekmur Asset Management LLC | 1 | 0,00 | 0 | |||||
| 2026-02-13 | 13F | State Street Corp | 4.828.090 | 6,59 | 37.949 | 10,52 | ||||
| 2026-02-06 | 13F | HighTower Advisors, LLC | 20.101 | 16,49 | 158 | 20,77 | ||||
| 2026-02-13 | 13F | BNP Paribas Asset Management Holding S.A. | 309.658 | 1.190,24 | 2 | -96,00 | ||||
| 2025-12-16 | 13F | Garde Capital, Inc. | 0 | -100,00 | 0 | -100,00 | ||||
| 2026-01-14 | 13F | Enterprise Financial Services Corp | 12.212 | 96 | ||||||
| 2026-02-17 | 13F | Scientech Research LLC | 12.745 | 100 | ||||||
| 2025-11-14 | 13F | Walleye Trading LLC | Put | 0 | -100,00 | 0 | -100,00 | |||
| 2026-02-13 | 13F | Baird Financial Group, Inc. | 409.703 | -22,43 | 3.220 | -19,56 | ||||
| 2026-02-06 | 13F | Banque Cantonale Vaudoise | 1.549 | 12 | ||||||
| 2026-02-10 | 13F | Greenspring Advisors, LLC | 26.013 | 204 | ||||||
| 2026-02-12 | 13F | Federation des caisses Desjardins du Quebec | 3.300 | 0,00 | 26 | 0,00 | ||||
| 2026-01-23 | 13F | BSW Wealth Partners | 51.573 | 4,85 | 405 | 8,87 | ||||
| 2026-02-06 | 13F | EverSource Wealth Advisors, LLC | 17.980 | -2,10 | 141 | 1,44 | ||||
| 2026-02-12 | 13F | Callan Family Office, LLC | 72.819 | 94,36 | 572 | 102,12 | ||||
| 2026-02-12 | 13F | Barometer Capital Management Inc. | 0 | -100,00 | 0 | |||||
| 2026-02-17 | 13F | CWM Advisors, LLC | 166.912 | 1.312 | ||||||
| 2026-01-29 | 13F | UBS Group AG | Call | 0 | -100,00 | 0 | -100,00 | |||
| 2026-02-12 | 13F | CIBC Private Wealth Group, LLC | 372 | -72,89 | 3 | -80,00 | ||||
| 2026-01-23 | 13F | Rsm Us Wealth Management Llc | 10.488 | 83 | ||||||
| 2025-10-22 | 13F | Geneos Wealth Management Inc. | 0 | -100,00 | 0 | |||||
| 2026-01-27 | 13F | Bayforest Capital Ltd | 70.237 | 17,72 | 552 | 22,12 | ||||
| 2026-02-17 | 13F | Ameriflex Group, Inc. | 267 | -50,00 | 2 | -50,00 | ||||
| 2026-01-30 | 13F | Mizuho Securities Co. Ltd. | 782 | 0,00 | 6 | 20,00 | ||||
| 2025-11-12 | 13F | Victory Capital Management Inc | 0 | -100,00 | 0 | -100,00 | ||||
| 2025-09-26 | 13F | Capital A Wealth Management, LLC | 0 | -100,00 | 0 | -100,00 | ||||
| 2026-01-16 | 13F | CogentBlue Wealth Advisors, LLC | 29.206 | 47,89 | 230 | 53,69 | ||||
| 2026-03-05 | 13F | Bayban | 100 | 1 | ||||||
| 2026-02-10 | 13F | Lido Advisors, LLC | 12.985 | 0,00 | 100 | 2,04 | ||||
| 2026-01-26 | 13F | Clean Yield Group | 218 | 0,00 | 2 | 0,00 | ||||
| 2026-02-12 | 13F | Aviva Plc | 13.807 | 0,00 | 109 | 3,85 | ||||
| 2026-02-10 | 13F | Acadian Asset Management Llc | 2.297.586 | 8.248,48 | 18 | |||||
| 2026-01-22 | 13F | Financial Consulate, Inc | 103 | 1 | ||||||
| 2026-02-09 | 13F | Choate Investment Advisors | 12.864 | 101 | ||||||
| 2026-01-05 | 13F | GAMMA Investing LLC | 12.249 | -0,70 | 96 | 3,23 | ||||
| 2026-02-13 | 13F | Ieq Capital, Llc | 210.410 | 13,00 | 1.654 | 17,15 | ||||
| 2026-02-13 | 13F | Smartleaf Asset Management LLC | 6.835 | 53,73 | 54 | 63,64 | ||||
| 2026-01-14 | 13F | Jfs Wealth Advisors, Llc | 2.826 | 0,00 | 22 | 4,76 | ||||
| 2026-02-13 | 13F | Diametric Capital, LP | 0 | -100,00 | 0 | -100,00 | ||||
| 2026-02-17 | 13F | Jones Financial Companies Lllp | 4.467 | 0,93 | 35 | 6,06 | ||||
| 2026-02-26 | 13F/A | Sculptor Capital LP | Put | 0 | -100,00 | 0 | ||||
| 2025-09-25 | NP | DFSE - Dimensional Emerging Markets Sustainability Core 1 ETF | 17.200 | 118 | ||||||
| 2026-01-14 | 13F | Hennion & Walsh Asset Management, Inc. | 0 | -100,00 | 0 | |||||
| 2026-02-26 | 13F/A | Sculptor Capital LP | 0 | -100,00 | 0 | |||||
| 2025-11-14 | 13F | Eqis Capital Management, Inc. | 0 | -100,00 | 0 | |||||
| 2026-02-17 | 13F | Henry James International Management Inc. | 13.747 | -1,50 | 108 | 2,86 | ||||
| 2026-02-17 | 13F | Wealth Architects, LLC | 14.981 | 0,00 | 118 | 3,54 | ||||
| 2026-02-12 | 13F | Bank Of Montreal /can/ | 55.957 | 197,34 | 440 | 209,15 | ||||
| 2026-03-03 | 13F/A | Caitong International Asset Management Co., Ltd | 11.956 | 1.782,83 | 94 | 2.225,00 | ||||
| 2026-01-29 | 13F | Verdence Capital Advisors LLC | 13.088 | 6,00 | 103 | 9,68 | ||||
| 2026-02-11 | 13F | Cerity Partners LLC | 241.615 | -0,60 | 1.899 | 3,09 | ||||
| 2025-09-25 | NP | VT - Vanguard Total World Stock Index Fund ETF Shares | 30.103 | -41,53 | 206 | -43,37 | ||||
| 2026-02-17 | 13F | SageView Advisory Group, LLC | 2.471 | 19 | ||||||
| 2025-09-25 | NP | DFEV - Dimensional Emerging Markets Value ETF | 308.787 | 0,00 | 2.112 | -2,81 | ||||
| 2026-01-12 | 13F | Abound Wealth Management | 160 | 0,00 | 1 | 0,00 | ||||
| 2026-02-12 | 13F | EntryPoint Capital, LLC | 0 | -100,00 | 0 | |||||
| 2026-02-06 | 13F | Ignite Planners, LLC | 84.928 | -23,26 | 865 | 3,10 | ||||
| 2026-01-30 | 13F | Us Bancorp \de\ | 579.532 | 7,11 | 4.555 | 11,07 | ||||
| 2026-02-17 | 13F | D. E. Shaw & Co., Inc. | 870.260 | 6.840 | ||||||
| 2026-02-17 | 13F | Northern Trust Corp | 3.217.883 | -6,16 | 25.293 | -2,69 | ||||
| 2026-02-12 | 13F | Dimensional Fund Advisors Lp | 2.516.726 | 20,73 | 19.781 | 25,19 | ||||
| 2025-11-13 | 13F | Farringdon Capital, Ltd. | 0 | -100,00 | 0 | -100,00 | ||||
| 2026-01-15 | 13F | Trust Co | 158 | 1 | ||||||
| 2026-02-13 | 13F | Transamerica Financial Advisors, Inc. | 49 | 0 | ||||||
| 2026-01-23 | 13F | Natural Investments, Llc | 19.273 | -2,99 | 0 | |||||
| 2026-02-13 | 13F | Bridgefront Capital, LLC | 54.434 | 333,39 | 428 | 349,47 | ||||
| 2026-02-13 | 13F | Golden State Wealth Management, LLC | 201 | 0,00 | 2 | 0,00 | ||||
| 2026-02-10 | 13F | Quantbot Technologies LP | 56.125 | -76,18 | 441 | -75,29 | ||||
| 2026-02-13 | 13F | Colony Group, LLC | 42.362 | 57,12 | 333 | 62,75 | ||||
| 2026-01-30 | 13F | Valued Wealth Advisors LLC | 423 | 0,00 | 3 | 0,00 | ||||
| 2026-02-06 | 13F | Global Retirement Partners, LLC | 7.842 | -16,49 | 62 | -14,08 | ||||
| 2026-02-12 | 13F | Quadrant Capital Group Llc | 329.426 | -0,96 | 2.589 | 2,70 | ||||
| 2026-01-29 | 13F | UBS Group AG | 4.570.447 | 21,49 | 35.924 | 25,97 | ||||
| 2025-11-14 | 13F | Integrated Wealth Concepts LLC | 0 | -100,00 | 0 | -100,00 | ||||
| 2026-02-11 | 13F | West Family Investments, Inc. | 152.579 | -11,93 | 1.199 | -8,68 | ||||
| 2026-02-17 | 13F | Royal Bank Of Canada | 29.092 | 500,45 | 228 | 516,22 | ||||
| 2026-01-29 | 13F | IMC-Chicago, LLC | Call | 65.900 | 68,54 | 518 | 74,66 | |||
| 2025-11-20 | 13F | First Affirmative Financial Network | 45.578 | 3,04 | 345 | 2,07 | ||||
| 2026-02-10 | 13F | Eurizon Capital SGR S.p.A. | 446.513 | 3.550 | ||||||
| 2026-02-17 | 13F | Quantinno Capital Management LP | 602.554 | 51,13 | 4.736 | 56,72 | ||||
| 2026-02-17 | 13F | Tcw Group Inc | 73.375 | 0,00 | 577 | 3,60 | ||||
| 2026-02-03 | 13F | Ballentine Partners, LLC | 155.105 | -4,92 | 1.219 | -1,38 | ||||
| 2026-02-13 | 13F | Parkside Financial Bank & Trust | 1.020 | 0,00 | 8 | 14,29 | ||||
| 2026-01-29 | 13F | UBS Group AG | Put | 394.500 | 16,00 | 3.101 | 20,29 | |||
| 2026-02-13 | 13F | Pathstone Holdings, LLC | 100.424 | 7,28 | 789 | 11,28 | ||||
| 2025-09-25 | NP | HTECX - Hennessy Technology Fund Investor Class | 16.741 | 12,30 | 115 | 9,62 | ||||
| 2026-02-13 | 13F | Squarepoint Ops LLC | 0 | -100,00 | 0 | -100,00 | ||||
| 2026-02-17 | 13F | Glenmede Trust Co Na | 29.049 | 2,95 | 228 | 13,43 | ||||
| 2026-02-19 | 13F | Invesco Ltd. | 89.935 | 0,83 | 707 | 4,44 | ||||
| 2026-02-17 | 13F | Cetera Investment Advisers | 15.472 | 7,68 | 122 | 12,04 | ||||
| 2025-11-12 | 13F | Modern Wealth Management, LLC | 0 | -100,00 | 0 | |||||
| 2026-02-13 | 13F | Pinnacle Wealth Planning Services, Inc. | 24.620 | -2,76 | 194 | 1,05 | ||||
| 2026-01-23 | 13F | Robeco Institutional Asset Management B.V. | 244.771 | 1.924 | ||||||
| 2026-02-12 | 13F | Groupe la Francaise | 0 | -100,00 | 0 | |||||
| 2026-02-12 | 13F | Brown Brothers Harriman & Co | 458 | 4 | ||||||
| 2026-02-17 | 13F | Capital Fund Management S.a. | 245.558 | 580,22 | 1.930 | 606,96 | ||||
| 2026-02-17 | 13F | GeoWealth Management, LLC | 13.778 | -12,30 | 108 | -9,24 | ||||
| 2025-11-14 | 13F | Credit Agricole S A | 0 | -100,00 | 0 | -100,00 | ||||
| 2026-02-17 | 13F | Citadel Advisors Llc | Put | 35.300 | 19,66 | 277 | 24,22 | |||
| 2026-02-05 | 13F | May Hill Capital, LLC | 28.184 | 133,52 | 222 | 142,86 | ||||
| 2026-02-17 | 13F | Citadel Advisors Llc | 1.124.310 | 2.124,64 | 8.837 | 2.207,31 | ||||
| 2026-02-17 | 13F | Citadel Advisors Llc | Call | 108.000 | -20,24 | 849 | -17,35 | |||
| 2026-01-23 | 13F | Farther Finance Advisors, LLC | 11.345 | 142,21 | 89 | 154,29 | ||||
| 2026-02-12 | 13F | Sepio Capital, LP | 13.169 | -13,88 | 104 | -10,43 | ||||
| 2025-11-14 | 13F | Axa S.a. | 0 | -100,00 | 0 | -100,00 | ||||
| 2025-11-12 | 13F | Stifel Financial Corp | 0 | -100,00 | 0 | |||||
| 2026-01-23 | 13F | Westside Investment Management, Inc. | 1.592 | 0,00 | 12 | 9,09 | ||||
| 2026-01-23 | 13F | Ritholtz Wealth Management | 83.130 | -0,23 | 653 | 3,49 | ||||
| 2026-02-17 | 13F | Millennium Management Llc | Call | 37.200 | 292 | |||||
| 2026-02-17 | 13F | Millennium Management Llc | 695.399 | 122,95 | 5.466 | 131,18 | ||||
| 2026-02-17 | 13F | Millennium Management Llc | Put | 84.400 | 0,00 | 663 | 3,76 | |||
| 2025-09-25 | NP | HFIGX - Hartford Schroders Diversified Growth Fund Class I | 10.417 | -1,99 | 71 | -4,05 | ||||
| 2026-02-13 | 13F | Marshall Wace, Llp | 0 | -100,00 | 0 | |||||
| 2025-09-25 | NP | DEHP - Dimensional Emerging Markets High Profitability ETF | 84.150 | 49,69 | 576 | 45,57 | ||||
| 2025-10-10 | 13F | Viking Fund Management Llc | 0 | -100,00 | 0 | |||||
| 2026-01-16 | 13F | Empirical Financial Services, LLC d.b.a. Empirical Wealth Management | 19.890 | 156 | ||||||
| 2026-01-27 | 13F | Hennessy Advisors Inc | 18.212 | 8,79 | 143 | 13,49 | ||||
| 2026-02-03 | 13F | Sequoia Financial Advisors, LLC | 197.996 | 8,70 | 1.556 | 12,75 | ||||
| 2026-02-11 | 13F | Group One Trading, L.p. | Put | 700 | 6 | |||||
| 2026-02-13 | 13F | Barclays Plc | 5.511.784 | 35,23 | 43.323 | 40,22 | ||||
| 2026-02-04 | 13F | LRI Investments, LLC | 364 | 0,00 | 3 | 0,00 | ||||
| 2026-02-11 | 13F | Group One Trading, L.p. | Call | 132.800 | -3,35 | 1.044 | 0,19 | |||
| 2026-02-11 | 13F | Ameritas Investment Partners, Inc. | 2 | 0 | ||||||
| 2026-02-24 | 13F | Bell Investment Advisors, Inc | 1.618 | -10,01 | 13 | -7,69 | ||||
| 2026-02-06 | 13F | Pnc Financial Services Group, Inc. | 166.562 | 14,77 | 1.309 | 19,00 | ||||
| 2025-11-14 | 13F | Schonfeld Strategic Advisors LLC | 0 | -100,00 | 0 | -100,00 | ||||
| 2026-01-21 | 13F/A | Euro Pacific Asset Management, LLC | 14.716 | 46,92 | 0 | |||||
| 2026-01-21 | 13F | Yousif Capital Management, Llc | 39.941 | 0,00 | 431 | 42,38 | ||||
| 2026-01-27 | 13F | Elevated Capital Advisors, LLC | 500 | 4 | ||||||
| 2026-02-06 | 13F | Leonteq Securities AG | 1 | -99,98 | 0 | -100,00 | ||||
| 2026-02-13 | 13F | Gts Securities Llc | 64.661 | 107,49 | 508 | 115,25 | ||||
| 2025-11-07 | 13F | Shell Asset Management Co | 0 | 0 | ||||||
| 2026-02-17 | 13F | Qube Research & Technologies Ltd | 263.116 | 2.068 | ||||||
| 2026-01-12 | 13F | CVA Family Office, LLC | 69 | 0,00 | 1 | |||||
| 2026-01-30 | 13F | Mitsubishi UFJ Trust & Banking Corp | 0 | -100,00 | 0 | |||||
| 2026-02-02 | 13F | Fifth Third Bancorp | 553 | 0,00 | 4 | 0,00 | ||||
| 2026-02-17 | 13F | Fmr Llc | 213.690 | -0,81 | 1.680 | 2,88 | ||||
| 2026-01-15 | 13F | Frank, Rimerman Advisors LLC | 123.033 | 492,25 | 967 | 515,92 | ||||
| 2026-02-24 | 13F | DGS Capital Management, LLC | 92.945 | -0,71 | 731 | 2,96 | ||||
| 2026-02-17 | 13F | Parallax Volatility Advisers, L.P. | 2.550 | -60,94 | 20 | -59,18 | ||||
| 2026-02-13 | 13F | Prudential Financial Inc | 23.570 | 0,00 | 188 | 5,06 | ||||
| 2026-02-12 | 13F | Advisors Asset Management, Inc. | 306.517 | 10,81 | 2.409 | 14,93 | ||||
| 2026-02-17 | 13F | Parallax Volatility Advisers, L.P. | Put | 20.000 | 0,00 | 157 | 3,97 | |||
| 2026-02-11 | 13F | Syon Capital Llc | 13.069 | 103 | ||||||
| 2026-02-17 | 13F | Sender Co & Partners, Inc. | Call | 12.900 | 101 | |||||
| 2025-09-29 | NP | SPWO - SP Funds S&P World (ex-US) ETF | 29.648 | 49,41 | 203 | 45,32 | ||||
| 2025-11-12 | 13F | Group One Trading, L.p. | 0 | -100,00 | 0 | -100,00 | ||||
| 2026-02-10 | 13F | CIBC World Markets Inc. | 0 | -100,00 | 0 | -100,00 | ||||
| 2026-02-18 | 13F | GWM Advisors LLC | 0 | -100,00 | 0 | |||||
| 2026-01-27 | 13F | Evergreen Capital Management Llc | 37.217 | 29,90 | 293 | 34,56 | ||||
| 2026-02-17 | 13F | Clear Street Markets Llc | 363 | 3 | ||||||
| 2026-01-21 | 13F | Sound Income Strategies, LLC | 100 | 0,00 | 1 | |||||
| 2026-02-17 | 13F | Symmetry Investments LP | Call | 185.900 | 1.461 | |||||
| 2026-02-12 | 13F | Canopy Partners, LLC | 0 | -100,00 | 0 | |||||
| 2026-02-05 | 13F | Td Private Client Wealth Llc | 4.096 | 32 | ||||||
| 2026-02-09 | 13F | Coldstream Capital Management Inc | 19.327 | -25,88 | 152 | -23,35 | ||||
| 2026-02-17 | 13F | Parvin Asset Management, LLC | 6.600 | 52 | ||||||
| 2026-02-03 | 13F | Crossmark Global Holdings, Inc. | 235.317 | -9,48 | 1.850 | -6,14 | ||||
| 2026-02-17 | 13F | Graham Capital Management, L.P. | 11.213 | 88 | ||||||
| 2025-11-13 | 13F | Clear Street Markets Llc | Put | 0 | -100,00 | 0 | -100,00 | |||
| 2026-02-17 | 13F | Russell Investments Group, Ltd. | 81 | -1,22 | 1 | |||||
| 2026-01-15 | 13F | Allspring Global Investments Holdings, LLC | 17.158 | 32,59 | 135 | 41,05 | ||||
| 2026-02-17 | 13F | Raymond James Financial Inc | 17.418 | -50,94 | 137 | -49,44 | ||||
| 2026-02-13 | 13F | Sei Investments Co | 27.798 | 20,45 | 219 | 25,29 | ||||
| 2025-09-29 | NP | AIM INTERNATIONAL MUTUAL FUNDS (INVESCO INTERNATIONAL MUTUAL FUNDS) - Invesco Oppenheimer Global Multi-Asset Growth Fund Class R6 | 8.437 | 6,68 | 58 | 3,64 | ||||
| 2026-02-06 | 13F | IFP Advisors, Inc | 535 | 0,00 | 4 | 0,00 | ||||
| 2026-01-16 | 13F | FNY Investment Advisers, LLC | Call | 21 | 0 | |||||
| 2026-02-04 | 13F | Argos Wealth Advisors, LLC | 18.193 | 143 | ||||||
| 2026-01-21 | 13F | Prime Capital Investment Advisors, LLC | 16.531 | -2,70 | 130 | 0,78 | ||||
| 2026-01-12 | 13F | Foster Group, Inc. | 39.564 | -5,50 | 311 | -2,21 | ||||
| 2025-11-04 | 13F | High Note Wealth, LLC | 0 | -100,00 | 0 | |||||
| 2025-11-06 | 13F | Johnson Investment Counsel Inc | 0 | -100,00 | 0 | -100,00 | ||||
| 2025-09-29 | NP | SOXY - YieldMax(TM) Target 12(TM) Semiconductor Option Income ETF | 4.993 | 19,16 | 34 | 17,24 | ||||
| 2026-02-17 | 13F | Two Sigma Investments, Lp | 5.675.393 | 60,75 | 44.609 | 66,69 | ||||
| 2026-02-17 | 13F | XTX Topco Ltd | 0 | -100,00 | 0 | |||||
| 2025-09-29 | NP | TRFM - AAM Transformers ETF | 38.634 | 76,92 | 264 | 72,55 | ||||
| 2025-11-14 | 13F | Maple Rock Capital Partners Inc. | 0 | -100,00 | 0 | -100,00 | ||||
| 2026-02-13 | 13F | Verition Fund Management LLC | 0 | -100,00 | 0 | |||||
| 2026-02-12 | 13F | Rossby Financial, LCC | 92 | 0,00 | 1 |
Other Listings
| DE:UMCB | 8,10 € |