Grundlæggende statistik
| Institutionelle aktier (lange) | 77.751.263 - 94,12% (ex 13D/G) - change of -4,18MM shares -5,10% MRQ |
| Institutionel værdi (lang) | $ 8.027.681 USD ($1000) |
Institutionelt ejerskab og aktionærer
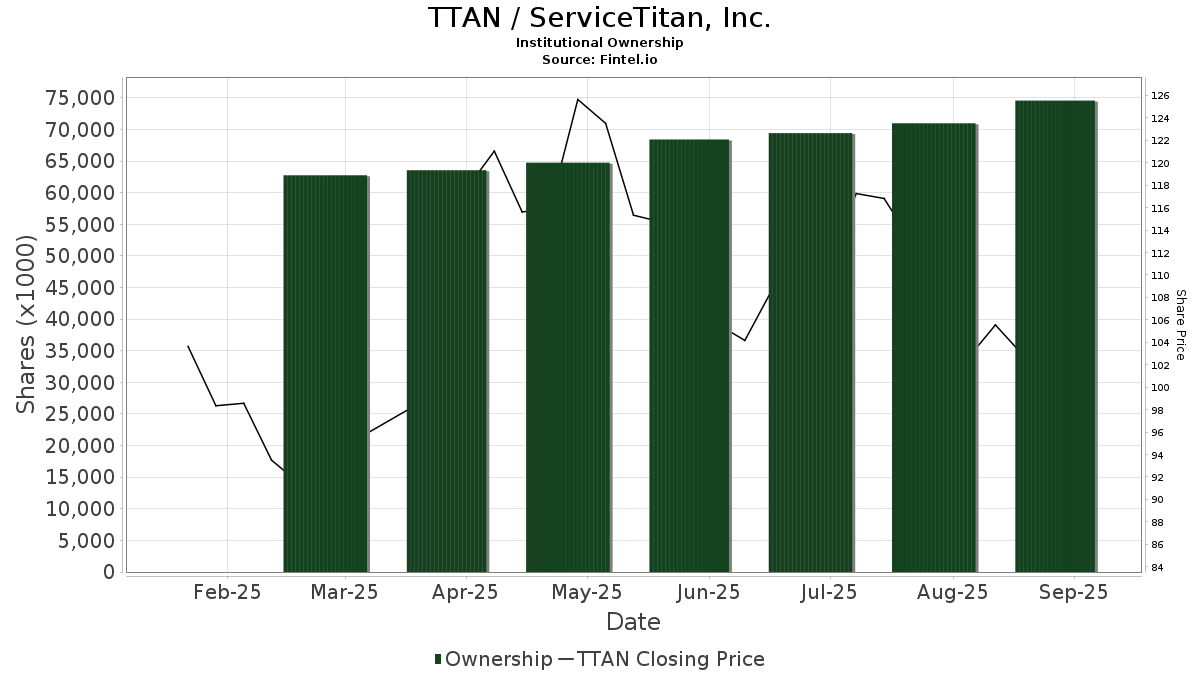
ServiceTitan, Inc. (US:TTAN) har 341 institutionelle ejere og aktionærer, der har indsendt 13D/G- eller 13F-formularer til Securities Exchange Commission (SEC). Disse institutioner har i alt 77,751,263 aktier. Største aktionærer omfatter ICONIQ Capital, LLC, Deer Management Co. LLC, Vanguard Group Inc, Kayne Anderson Rudnick Investment Management Llc, Battery Management Corp., Jpmorgan Chase & Co, Franklin Resources Inc, Fmr Llc, Generation Investment Management Llp, and BlackRock, Inc. .
ServiceTitan, Inc. (NasdaqGS:TTAN) institutionel ejerskabsstruktur viser aktuelle positioner i virksomheden efter institutioner og fonde, samt seneste ændringer i positionsstørrelse. Større aktionærer kan omfatte individuelle investorer, investeringsforeninger, hedgefonde eller institutioner. Skema 13D angiver, at investoren besidder (eller besidder) mere end 5 % af virksomheden og har til hensigt (eller har til hensigt at) aktivt at forfølge en ændring i forretningsstrategi. Skema 13G indikerer en passiv investering på over 5%.
The share price as of April 20, 2026 is 66,28 / share. Previously, on April 21, 2025, the share price was 117,71 / share. This represents a decline of 43,69% over that period.
Fondens stemningsscore
Fund Sentiment Score (fka Ownership Accumulation Score) finder de aktier, der bliver mest købt af fonde. Det er resultatet af en sofistikeret, multi-faktor kvantitativ model, der identificerer virksomheder med de højeste niveauer af institutionel akkumulering. Scoringsmodellen bruger en kombination af den samlede stigning i oplyste ejere, ændringerne i porteføljeallokeringer i disse ejere og andre målinger. Tallet går fra 0 til 100, hvor højere tal indikerer et højere niveau af akkumulering for sine jævnaldrende, og 50 er gennemsnittet.
Opdateringsfrekvens: Dagligt
Se Ownership Explorer, som giver en liste over højest rangerende virksomheder.
AI+ Ask Fintel’s AI assistant about ServiceTitan, Inc..
Select a question to share a public post with an AI-crafted answer.
Thinking of good questions…
Institutionel Put/Call-forhold
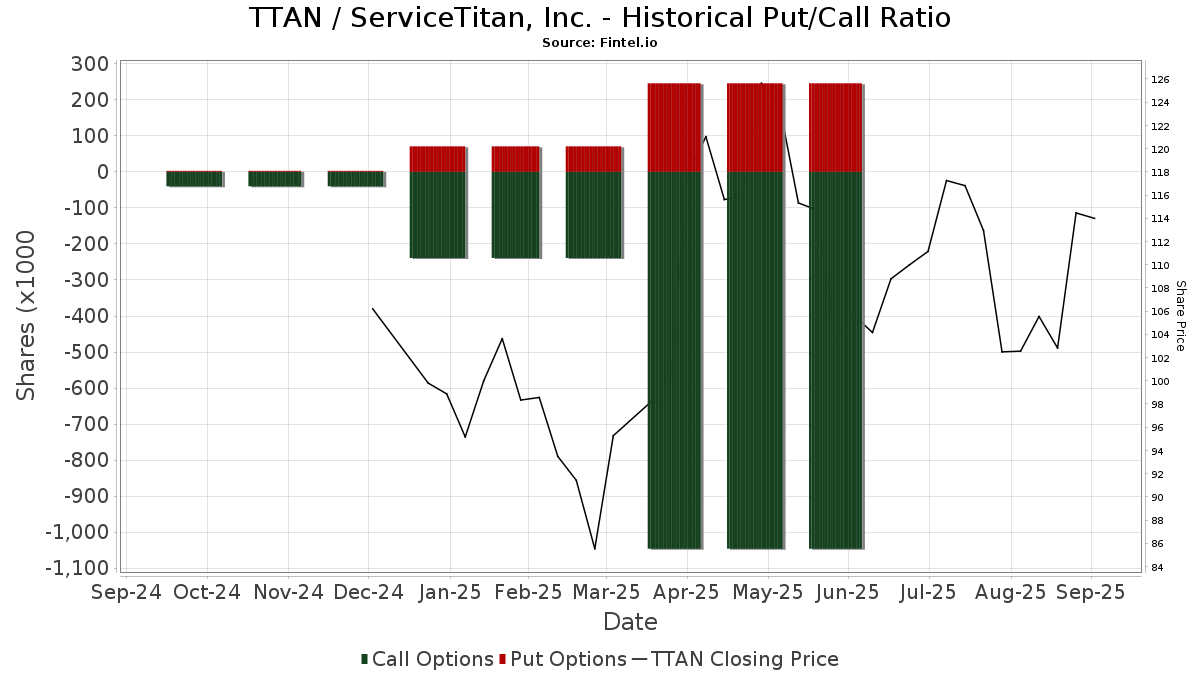
Ud over at indberette standardaktie- og gældsudstedelser skal institutter med mere end 100 mill. aktiver under forvaltning også oplyse deres put- og call-optionsbeholdninger. Da salgsoptioner generelt indikerer negativ stemning, og købsoptioner indikerer positiv stemning, kan vi få en fornemmelse af den overordnede institutionelle stemning ved at plotte forholdet mellem put og kald. Diagrammet til højre viser det historiske put/call-forhold for dette instrument.
Brug af Put/Call Ratio som en indikator for investorernes stemning overvinder en af de vigtigste mangler ved at bruge totalt institutionelt ejerskab, som er, at en betydelig mængde af aktiver under forvaltning investeres passivt for at spore indekser. Passivt forvaltede fonde køber typisk ikke optioner, så indikatoren for put/call-forholdet følger mere nøje følelsen af aktivt forvaltede fonde.
13D/G-arkivering
Vi præsenterer 13D/G ansøgninger separat fra 13F ansøgninger på grund af den forskellige behandling af SEC. 13D/G-ansøgninger kan indgives af grupper af investorer (med én ledende), hvorimod 13F-ansøgninger ikke kan. Dette resulterer i situationer, hvor en investor kan indsende en 13D/G, der rapporterer én værdi for de samlede aktier (der repræsenterer alle de aktier, der ejes af investorgruppen), men derefter indsender en 13F, der rapporterer en anden værdi for de samlede aktier (der udelukkende repræsenterer deres egne) ejendomsret). Det betyder, at aktieejerskab af 13D/G-arkiver og 13F-arkiveringer ofte ikke er direkte sammenlignelige, så vi præsenterer dem separat.
Bemærk: Fra den 16. maj 2021 viser vi ikke længere ejere, der ikke har indsendt en 13D/G inden for det seneste år. Tidligere viste vi den fulde historie af 13D/G-arkiver. Generelt skal enheder, der er forpligtet til at indgive 13D/G-ansøgninger, indgive mindst årligt, før de indsender en afsluttende ansøgning. Dog forlader fonde nogle gange positioner uden at indsende en afsluttende ansøgning (dvs. de afvikler), så visning af den fulde historie resulterede nogle gange i forvirring om det nuværende ejerskab. For at undgå forvirring viser vi nu kun 'aktuelle' ejere - det vil sige - ejere, der har anmeldt inden for det seneste år.
Upgrade to unlock premium data.
| Fil dato | Form | Investor | Forrige Aktier |
Seneste Aktier |
Δ Aktier (Procent) |
Ejendomsret (Procent) |
Δ Ejerskab (Procent) |
|
|---|---|---|---|---|---|---|---|---|
| 2026-02-17 | 15 Angels II LLC | 9,001,101 | 5,796,012 | -35.61 | 7.20 | -38.98 | ||
| 2026-02-17 | Battery Ventures XI-A, L.P. | 4,091,331 | 3,378,017 | -17.43 | 4.20 | -17.65 | ||
| 2025-11-14 | ICONIQ STRATEGIC PARTNERS II, L.P. | 14,094,826 | 11,885,725 | -15.67 | 14.90 | -18.13 | ||
| 2025-10-30 | VANGUARD GROUP INC | 4,429,930 | 5.55 | |||||
| 2025-08-14 | TPG GP A, LLC | 5,107,469 | 0 | -100.00 | 0.00 | -100.00 |
13F og NPORT arkivering
Detaljer om 13F-arkivering er gratis. Detaljer om NP-ansøgninger kræver et premium-medlemskab. Grønne rækker angiver nye positioner. Røde rækker angiver lukkede positioner. Klik på linket ikon for at se den fulde transaktionshistorik.
Opgrader
for at låse premium-data op og eksportere til Excel ![]() .
.
| Fil dato | Kilde | Investor | Type | Gennemsnitlig pris (Øst) |
Aktier | Δ Aktier (%) |
Rapporteret Værdi ($1000) |
Δ Værdi (%) |
Port Alloc (%) |
|
|---|---|---|---|---|---|---|---|---|---|---|
| 2026-02-10 | 13F | REAP Financial Group, LLC | 150 | 0,00 | 16 | 0,00 | ||||
| 2026-02-17 | 13F | Comprehensive Financial Management LLC | 15.236 | 0,00 | 1.623 | 5,60 | ||||
| 2026-02-17 | 13F | Jump Financial, LLC | 18.504 | -61,87 | 1.971 | -59,74 | ||||
| 2026-02-17 | 13F | Fmr Llc | 1.784.520 | 211,70 | 190.051 | 229,23 | ||||
| 2026-02-13 | 13F | Wealth Alliance | 2.448 | 261 | ||||||
| 2026-02-13 | 13F | Healthcare Of Ontario Pension Plan Trust Fund | 213.376 | 25,52 | 22.725 | 32,57 | ||||
| 2026-02-13 | 13F | Wexford Capital Lp | 2.086 | 222 | ||||||
| 2025-11-13 | 13F | Mission Creek Capital Partners, Inc. | 0 | -100,00 | 0 | -100,00 | ||||
| 2026-04-17 | 13F | CENTRAL TRUST Co | 4 | 0,00 | 0 | |||||
| 2026-01-16 | 13F | Hopwood Financial Services, Inc. | 0 | -100,00 | 0 | |||||
| 2025-11-14 | 13F | CI Private Wealth, LLC | 0 | -100,00 | 0 | -100,00 | ||||
| 2026-01-30 | 13F | Kohmann Bosshard Financial Services, LLC | 48 | 5 | ||||||
| 2026-02-17 | 13F | Voloridge Investment Management, Llc | 107.466 | -78,51 | 11.445 | -77,30 | ||||
| 2026-04-16 | 13F | SG Americas Securities, LLC | 0 | -100,00 | 0 | |||||
| 2026-02-12 | 13F | Colonial Trust Co / SC | 66 | 164,00 | 7 | 250,00 | ||||
| 2026-04-15 | 13F | Bayforest Capital Ltd | 397 | 25 | ||||||
| 2026-02-12 | 13F | Wealthspire Advisors, LLC | 0 | -100,00 | 0 | |||||
| 2026-02-13 | 13F | National Bank Of Canada /fi/ | 1.859 | 198 | ||||||
| 2026-01-27 | 13F | PFG Advisors | 3.118 | 8,75 | 332 | 14,88 | ||||
| 2025-11-13 | 13F | Quadrature Capital Ltd | 0 | -100,00 | 0 | |||||
| 2025-11-14 | 13F | Jane Street Group, Llc | 0 | -100,00 | 0 | -100,00 | ||||
| 2026-02-06 | 13F | Gsa Capital Partners Llp | 0 | -100,00 | 0 | |||||
| 2026-02-17 | 13F | Bayesian Capital Management, LP | 0 | -100,00 | 0 | |||||
| 2026-01-28 | 13F | Peregrine Capital Management Llc | 91 | 0,00 | 10 | 0,00 | ||||
| 2026-02-10 | 13F | Envestnet Asset Management Inc | 267.436 | 40,04 | 28.482 | 47,91 | ||||
| 2026-02-18 | 13F/A | Fuller & Thaler Asset Management, Inc. | 842.275 | 89.702 | ||||||
| 2026-02-17 | 13F | Scientech Research LLC | 0 | -100,00 | 0 | -100,00 | ||||
| 2026-01-26 | 13F | Private Trust Co Na | 67 | 63,41 | 7 | 75,00 | ||||
| 2026-02-17 | 13F | Man Group plc | 13.122 | -83,00 | 1.397 | -82,05 | ||||
| 2026-04-17 | 13F | Bell Investment Advisors, Inc | 40 | -2,44 | 3 | -50,00 | ||||
| 2026-02-13 | 13F | Blueshift Asset Management, LLC | 5.734 | 611 | ||||||
| 2026-01-30 | 13F | R Squared Ltd | 0 | -100,00 | 0 | |||||
| 2026-02-17 | 13F | Millennium Management Llc | 282.021 | -18,57 | 30.035 | -13,99 | ||||
| 2026-02-17 | 13F | Cape Investment Advisory, Inc. | 4 | 0 | ||||||
| 2025-11-13 | 13F | Eisler Capital Management Ltd. | 0 | -100,00 | 0 | -100,00 | ||||
| 2026-02-13 | 13F | Neuberger Berman Group LLC | 100.759 | -76,73 | 10.731 | -75,42 | ||||
| 2026-02-11 | 13F | Capital International Investors | 1.224.699 | 23,91 | 130.430 | 30,87 | ||||
| 2026-02-17 | 13F | Jones Financial Companies Lllp | 942 | 99,58 | 100 | 104,08 | ||||
| 2026-02-14 | 13F | Rockefeller Capital Management L.P. | 1.811 | 758,29 | 193 | 814,29 | ||||
| 2026-04-07 | 13F | CoreCap Advisors, LLC | 200 | 238,98 | 13 | 100,00 | ||||
| 2026-02-13 | 13F | Hudson Bay Capital Management LP | 2.680 | 285 | ||||||
| 2026-02-13 | 13F | 1832 Asset Management L.P. | 51.400 | 5.474 | ||||||
| 2026-02-10 | 13F | Sivia Capital Partners, LLC | 1.963 | 209 | ||||||
| 2026-04-08 | 13F | Miracle Mile Advisors, LLC | 17.895 | 38,77 | 1.136 | -17,33 | ||||
| 2026-02-17 | 13F | Longaeva Partners L.P. | 0 | -100,00 | 0 | |||||
| 2026-02-17 | 13F | Quantinno Capital Management LP | 20.850 | -4,27 | 2.221 | 1,09 | ||||
| 2026-02-17 | 13F | Alliancebernstein L.p. | 701.286 | 17,99 | 74.687 | 24,63 | ||||
| 2026-02-13 | 13F | State Street Corp | 328.814 | 18,45 | 35.019 | 25,11 | ||||
| 2026-04-20 | 13F | TFB Advisors LLC | 5.403 | 22,18 | 343 | -27,23 | ||||
| 2025-11-17 | 13F | Gould Capital, LLC | 0 | -100,00 | 0 | |||||
| 2026-04-07 | 13F | U.S. Capital Wealth Advisors, LLC | 7.450 | 473 | ||||||
| 2026-02-09 | 13F | Jefferies Financial Group Inc. | 0 | -100,00 | 0 | |||||
| 2026-02-12 | 13F | Federation des caisses Desjardins du Quebec | 4.046 | 48,91 | 431 | 57,51 | ||||
| 2026-02-17 | 13F | Tower Research Capital LLC (TRC) | 611 | 65 | ||||||
| 2026-03-06 | 13F | Hsbc Holdings Plc | 8.687 | -66,95 | 924 | -64,45 | ||||
| 2026-04-17 | 13F | Anchyra Partners Llc | 16.638 | 0,30 | 1.056 | -40,26 | ||||
| 2026-02-13 | 13F | Marshall Wace, Llp | 359.049 | 38.239 | ||||||
| 2026-02-04 | 13F | Atlantic Union Bankshares Corp | 0 | -100,00 | 0 | |||||
| 2026-01-30 | 13F | Us Bancorp \de\ | 17.938 | 89,94 | 1.910 | 100,63 | ||||
| 2025-11-07 | 13F | Aspiring Ventures, LLC | 0 | -100,00 | 0 | |||||
| 2026-02-06 | 13F | Larson Financial Group LLC | 46 | 0,00 | 5 | 0,00 | ||||
| 2026-02-17 | 13F | Newlands Management Operations LLC | 0 | -100,00 | 0 | |||||
| 2026-01-26 | 13F | Whittier Trust Co | 60.724 | 11.668,22 | 6.180 | 11.784,62 | ||||
| 2026-02-13 | 13F | Vontobel Holding Ltd. | 4.928 | 18,26 | 525 | 24,76 | ||||
| 2026-02-17 | 13F | Jain Global LLC | 2.000 | 213 | ||||||
| 2026-01-29 | 13F | Pictet Asset Management Holding SA | 3.533 | 376 | ||||||
| 2026-02-12 | 13F | Nuveen, LLC | 18.480 | 1.968 | ||||||
| 2026-02-17 | 13F | Northern Trust Corp | 142.925 | 32,03 | 15.222 | 39,45 | ||||
| 2026-01-23 | 13F | Sumitomo Mitsui Trust Holdings, Inc. | 3.293 | 351 | ||||||
| 2026-02-13 | 13F | Ubs Asset Management Americas Inc | 35.875 | 3.821 | ||||||
| 2026-02-12 | 13F | Ci Investments Inc. | 0 | -100,00 | 0 | |||||
| 2026-04-09 | 13F | Thrive Wealth Management, LLC | 0 | -100,00 | 0 | |||||
| 2026-02-11 | 13F | Littlejohn & Co Llc | 184.844 | 19.686 | ||||||
| 2026-04-06 | 13F | Versant Capital Management, Inc | 9 | 1 | ||||||
| 2025-11-14 | 13F | Capstone Investment Advisors, Llc | 0 | -100,00 | 0 | |||||
| 2026-04-13 | 13F | Wolff Wiese Magana Llc | 62 | 55,00 | 4 | -25,00 | ||||
| 2026-02-12 | 13F | Brinker Capital Investments, LLC | 6.135 | -7,45 | 653 | -2,25 | ||||
| 2025-11-14 | 13F | Third Point LLC | 0 | -100,00 | 0 | |||||
| 2026-02-13 | 13F | Squarepoint Ops LLC | 23.897 | 2.545 | ||||||
| 2026-02-17 | 13F | Osterweis Capital Management Inc | 117.055 | 21,29 | 12.466 | 28,11 | ||||
| 2026-02-17 | 13F | Dragoneer Investment Group, LLC | 1.000.885 | 0,00 | 106.594 | 5,62 | ||||
| 2026-02-13 | 13F | Lord, Abbett & Co. Llc | 272.095 | -23,51 | 29 | -20,00 | ||||
| 2026-02-10 | 13F | Acadian Asset Management Llc | 0 | -100,00 | 0 | |||||
| 2026-02-13 | 13F | Inspire Advisors, LLC | 3.500 | 373 | ||||||
| 2026-02-13 | 13F | First Trust Advisors Lp | 768.152 | 14,50 | 81.808 | 20,94 | ||||
| 2026-01-20 | 13F | Nvwm, Llc | 15 | 2 | ||||||
| 2026-02-18 | 13F | Vident Advisory, LLC | 4.824 | 63,91 | 514 | 73,31 | ||||
| 2026-04-10 | 13F | Northside Capital Management, LLC | 6.293 | 0,00 | 399 | -40,45 | ||||
| 2026-02-17 | 13F | FIL Ltd | 586.958 | 6,75 | 62.511 | 12,76 | ||||
| 2026-02-09 | 13F | Legal & General Group Plc | 20.355 | -6,35 | 2.168 | -1,10 | ||||
| 2026-01-22 | 13F | Venturi Wealth Management, LLC | 1.908 | 203 | ||||||
| 2026-01-29 | 13F | Dunhill Financial, LLC | 1 | 0 | ||||||
| 2026-04-10 | 13F | Perigon Wealth Management, LLC | 12.286 | 2,33 | 780 | -39,05 | ||||
| 2026-04-17 | 13F | AdvisorNet Financial, Inc | 62 | 55,00 | 4 | -25,00 | ||||
| 2026-04-08 | 13F | Hamilton Lane Advisors Llc | 4.294 | 1,15 | 272 | -39,82 | ||||
| 2026-02-04 | 13F | Pathway Capital Management, Lp | 19.959 | 2.126 | ||||||
| 2025-11-14 | 13F | Wolverine Trading, Llc | Call | 77.700 | 254,79 | 8.002 | 238,64 | |||
| 2025-11-14 | 13F | Wolverine Trading, Llc | Put | 6.200 | -44,64 | 639 | -47,19 | |||
| 2026-01-28 | 13F | Universal- Beteiligungs- und Servicegesellschaft mbH | 13.808 | 14,12 | 1.471 | 20,49 | ||||
| 2026-02-17 | 13F | Moore Capital Management, Lp | 131.616 | 14.017 | ||||||
| 2026-02-17 | 13F | Artisan Partners Limited Partnership | 1.617.353 | 47,26 | 172.248 | 55,54 | ||||
| 2026-02-11 | 13F | Los Angeles Capital Management Llc | 210 | 20 | ||||||
| 2025-11-14 | 13F | Science & Technology Partners, L.P. | 0 | -100,00 | 0 | |||||
| 2026-01-29 | 13F | Vanguard Group Inc | 4.869.009 | 9,91 | 518.549 | 16,09 | ||||
| 2026-02-12 | 13F | NZS Capital, LLC | 362.203 | 5,99 | 38.575 | 11,94 | ||||
| 2026-04-20 | 13F | LVW Advisors, LLC | 6.390 | 25,49 | 406 | -25,28 | ||||
| 2025-11-14 | 13F | Oxford Asset Management Llp | 3.272 | 17,32 | 330 | 10,40 | ||||
| 2026-01-23 | 13F | Ami Asset Management Corp | 3.886 | -0,99 | 414 | 4,56 | ||||
| 2026-02-06 | 13F | Vestmark Advisory Solutions, Inc. | 38.697 | 71,80 | 4.121 | 81,46 | ||||
| 2025-11-14 | 13F | SummitTX Capital, L.P. | 0 | -100,00 | 0 | |||||
| 2026-02-17 | 13F | Canada Pension Plan Investment Board | 108.500 | 330,56 | 11.555 | 354,92 | ||||
| 2026-02-17 | 13F | Ancora Advisors, LLC | 58 | 6 | ||||||
| 2025-11-04 | 13F | IMC-Chicago, LLC | 0 | -100,00 | 0 | |||||
| 2026-02-02 | 13F | Strs Ohio | 34.800 | 3.706 | ||||||
| 2026-02-17 | 13F | D. E. Shaw & Co., Inc. | 16.416 | -90,29 | 1.748 | -89,74 | ||||
| 2026-04-15 | 13F | DAVENPORT & Co LLC | 6.638 | 72,06 | 421 | 2,68 | ||||
| 2025-11-14 | 13F | Utah Retirement Systems | 0 | -100,00 | 0 | |||||
| 2026-02-09 | 13F | Blue Owl Capital Holdings LP | 2.266 | -54,26 | 241 | -51,70 | ||||
| 2026-02-05 | 13F | Cambridge Investment Research Advisors, Inc. | 16.395 | 20,03 | 2 | 0,00 | ||||
| 2026-02-17 | 13F | Diker Management Llc | 10.000 | -56,52 | 1.065 | -54,08 | ||||
| 2026-02-17 | 13F | MSD Partners, L.P. | 18.388 | 0,00 | 1.958 | 5,61 | ||||
| 2025-11-14 | 13F | Cubist Systematic Strategies, LLC | 49.372 | -49,23 | 4.978 | -52,24 | ||||
| 2025-11-14 | 13F | Notable Capital Management, L.l.c. | 0 | -100,00 | 0 | -100,00 | ||||
| 2025-11-14 | 13F | Cubist Systematic Strategies, LLC | Put | 2.600 | 262 | |||||
| 2026-02-03 | 13F | Washington Trust Advisors, Inc. | 0 | -100,00 | 0 | |||||
| 2026-02-12 | 13F | Generation Investment Management Llp | 1.751.224 | 0,00 | 186.505 | 5,62 | ||||
| 2026-02-04 | 13F | HighPoint Advisor Group LLC | 19.997 | 88,42 | 2.130 | 98,97 | ||||
| 2026-01-12 | 13F | CVA Family Office, LLC | 1 | -83,33 | 0 | |||||
| 2026-02-11 | 13F | LPL Financial LLC | 43.195 | 32,33 | 4.600 | 39,78 | ||||
| 2026-02-12 | 13F | Polen Capital Management Llc | 0 | -100,00 | 0 | |||||
| 2026-02-13 | 13F | Fifth Lane Capital, Lp | 0 | -100,00 | 0 | |||||
| 2026-02-02 | 13F | Oppenheimer & Co Inc | 220.173 | -69,58 | 23.448 | -67,87 | ||||
| 2026-02-13 | 13F | Baird Financial Group, Inc. | 24.391 | -16,59 | 2.598 | -11,91 | ||||
| 2026-02-13 | 13F | Bridgefront Capital, LLC | 2.513 | 268 | ||||||
| 2026-02-13 | 13F | Sei Investments Co | 157.452 | 40,84 | 16.769 | 48,76 | ||||
| 2026-02-11 | 13F | Motley Fool Asset Management LLC | 2.677 | 285 | ||||||
| 2026-01-23 | 13F | Penn Mutual Asset Management, LLC | 1.787 | 190 | ||||||
| 2026-01-23 | 13F | Bellevue Asset Management, Llc | 51 | 50,00 | 5 | 66,67 | ||||
| 2026-02-13 | 13F | Brookfield Asset Management Inc. | 263.000 | 0,00 | 28.010 | 5,62 | ||||
| 2026-02-17 | 13F | Schonfeld Strategic Advisors LLC | 0 | -100,00 | 0 | |||||
| 2026-02-17 | 13F | Summit Partners Public Asset Management, Llc | 53.000 | 5.644 | ||||||
| 2026-02-17 | 13F | Qube Research & Technologies Ltd | 261.241 | -34,94 | 27.822 | -31,28 | ||||
| 2026-04-14 | 13F | Zrc Wealth Management, Llc | 719 | 115,27 | 46 | 28,57 | ||||
| 2026-01-29 | 13F | Quent Capital, LLC | 11.000 | 1.172 | ||||||
| 2026-02-13 | 13F | Kayne Anderson Rudnick Investment Management Llc | 3.463.937 | 54,39 | 368.909 | 63,07 | ||||
| 2025-10-31 | 13F | Investment House Llc | 0 | -100,00 | 0 | |||||
| 2026-04-07 | 13F | Farther Finance Advisors, LLC | 355 | 33,46 | 22 | -21,43 | ||||
| 2026-02-06 | 13F | TimesSquare Capital Management, LLC | 864.582 | -4,54 | 92.078 | 0,83 | ||||
| 2026-04-17 | 13F | Stonebridge Financial Group, LLC / MO | 6.961 | 0,00 | 442 | -40,49 | ||||
| 2026-02-06 | 13F | Pnc Financial Services Group, Inc. | 1.042 | 21,45 | 111 | 27,91 | ||||
| 2026-02-17 | 13F | Citadel Advisors Llc | 191.202 | -43,74 | 20.363 | -40,57 | ||||
| 2025-11-14 | 13F | Hound Partners, LLC | 0 | -100,00 | 0 | |||||
| 2026-02-17 | 13F | Citadel Advisors Llc | Call | 175.500 | -7,68 | 18.691 | -2,49 | |||
| 2026-02-17 | 13F | Citadel Advisors Llc | Put | 69.100 | -7,50 | 7.359 | -2,30 | |||
| 2026-01-29 | 13F | Rakuten Securities, Inc. | 0 | -100,00 | 0 | |||||
| 2026-01-27 | 13F | WealthCollab, LLC | 130 | 0,00 | 14 | 0,00 | ||||
| 2025-10-31 | 13F | Cullen/frost Bankers, Inc. | 0 | -100,00 | 0 | |||||
| 2026-01-14 | 13F | EdgeRock Capital LLC | 0 | -100,00 | 0 | |||||
| 2026-02-13 | 13F | Brown Advisory Inc | 1.891 | 201 | ||||||
| 2026-02-17 | 13F | Voleon Capital Management Lp | 4.835 | -74,94 | 515 | -73,57 | ||||
| 2026-02-17 | 13F | Ghisallo Capital Management LLC | 200.000 | -41,44 | 21.300 | -38,15 | ||||
| 2026-02-13 | 13F | Ieq Capital, Llc | 58.268 | -3,38 | 6.206 | 2,06 | ||||
| 2026-02-12 | 13F | Northwest & Ethical Investments L.P. | 5.498 | -16,32 | 589 | -12,87 | ||||
| 2026-02-17 | 13F | Dark Forest Capital Management Lp | 0 | -100,00 | 0 | |||||
| 2026-04-14 | 13F | Perpetual Ltd | 0 | -100,00 | 0 | |||||
| 2026-02-12 | 13F | Steward Partners Investment Advisory, Llc | 450 | -2,39 | 48 | 2,17 | ||||
| 2026-01-22 | 13F | Financial Consulate, Inc | 180 | 0,00 | 19 | 5,56 | ||||
| 2026-04-10 | 13F | Impact Capital Partners LLC | 6.665 | 35,33 | 423 | -19,47 | ||||
| 2026-02-13 | 13F | Polymer Capital Management (HK) LTD | 5.127 | 61,02 | 546 | 70,09 | ||||
| 2026-04-06 | 13F | GAMMA Investing LLC | 15 | -44,44 | 1 | -100,00 | ||||
| 2026-04-10 | 13F | Jacobson & Schmitt Advisors, Llc | 94.481 | -28,65 | 5.996 | -57,49 | ||||
| 2025-11-14 | 13F | XTX Topco Ltd | 0 | -100,00 | 0 | -100,00 | ||||
| 2026-02-03 | 13F | NewEdge Wealth, LLC | 34.955 | 59,04 | 3.723 | 84,53 | ||||
| 2026-02-11 | 13F | Jpmorgan Chase & Co | 2.674.060 | -7,60 | 284.787 | -2,40 | ||||
| 2025-11-14 | 13F | Aperture Investors, LLC | 0 | -100,00 | 0 | |||||
| 2026-01-15 | 13F | Allspring Global Investments Holdings, LLC | 321.815 | 20,73 | 32.693 | 20,63 | ||||
| 2026-02-05 | 13F | Qsemble Capital Management, LP | 3.392 | 361 | ||||||
| 2026-02-10 | 13F | Thompson Siegel & Walmsley Llc | 0 | -100,00 | 0 | |||||
| 2026-02-12 | 13F | Principal Securities, Inc. | 0 | -100,00 | 0 | |||||
| 2025-11-14 | 13F | Occudo Quantitative Strategies Lp | 0 | -100,00 | 0 | |||||
| 2025-11-12 | 13F | Bellwether Advisors, LLC | 0 | -100,00 | 0 | |||||
| 2026-04-09 | 13F | DHJJ Financial Advisors, Ltd. | 24 | 2 | ||||||
| 2026-02-13 | 13F | Next Century Growth Investors Llc | 0 | -100,00 | 0 | |||||
| 2026-02-13 | 13F | Victory Capital Management Inc | 44.017 | -63,95 | 4.688 | -61,93 | ||||
| 2026-02-13 | 13F | Manufacturers Life Insurance Company, The | 0 | -100,00 | 0 | |||||
| 2025-11-07 | 13F | Zweig-DiMenna Associates LLC | 0 | -100,00 | 0 | |||||
| 2025-11-14 | 13F | Walleye Trading LLC | 0 | -100,00 | 0 | -100,00 | ||||
| 2026-02-09 | 13F | Malaga Cove Capital, LLC | 6.200 | -2,85 | 660 | 2,64 | ||||
| 2026-02-11 | 13F | Twin Tree Management, LP | Call | 45.100 | 4.803 | |||||
| 2025-11-13 | 13F | Epoch Investment Partners, Inc. | 0 | -100,00 | 0 | |||||
| 2026-02-06 | 13F | Sierra Summit Advisors Llc | 9.594 | 1.022 | ||||||
| 2026-02-06 | 13F | HighTower Advisors, LLC | 27.390 | 2.917 | ||||||
| 2025-11-14 | 13F | Hrt Financial Lp | 0 | -100,00 | 0 | |||||
| 2026-02-11 | 13F | Janney Montgomery Scott LLC | 51.456 | 68,80 | 5 | 66,67 | ||||
| 2026-02-17 | 13F | Turim 21 Investimentos Ltda. | 0 | -100,00 | 0 | |||||
| 2025-11-14 | 13F | Sonoma Private Wealth LLC | 0 | -100,00 | 0 | |||||
| 2026-02-17 | 13F | Trexquant Investment LP | 0 | -100,00 | 0 | |||||
| 2026-02-23 | 13F | Virtu Financial LLC | 0 | -100,00 | 0 | |||||
| 2026-01-26 | 13F | Cwm, Llc | 158 | 618,18 | 0 | |||||
| 2025-11-14 | 13F | Soros Fund Management Llc | 0 | -100,00 | 0 | -100,00 | ||||
| 2026-02-12 | 13F | Penserra Capital Management LLC | 7.139 | 1 | ||||||
| 2026-02-13 | 13F | Wells Fargo & Company/mn | 627.428 | 61,72 | 66.821 | 70,81 | ||||
| 2026-02-12 | 13F | Sandhill Capital Partners LLC | 343.650 | 28,04 | 36.599 | 35,24 | ||||
| 2026-02-17 | 13F | Cypress Point Investment Management Lp | 33.868 | 3.606 | ||||||
| 2026-02-17 | 13F | Russell Investments Group, Ltd. | 3.545 | -61,70 | 378 | -59,59 | ||||
| 2026-04-06 | 13F | Highline Wealth Partners Llc | 5.400 | 500,00 | 343 | 260,00 | ||||
| 2026-02-13 | 13F | Delos Wealth Advisors, LLC | 43 | 0,00 | 5 | 0,00 | ||||
| 2026-02-17 | 13F | Symmetry Peak Management Llc | Call | 2.400 | -89,09 | 256 | -88,50 | |||
| 2026-02-11 | 13F | Cerity Partners LLC | 107.704 | -4,30 | 11.470 | 1,08 | ||||
| 2026-01-22 | 13F | Massachusetts Financial Services Co /ma/ | 702.091 | -0,93 | 74.773 | 4,64 | ||||
| 2026-02-13 | 13F | Colony Group, LLC | 20.421 | 129,66 | 2.175 | 142,63 | ||||
| 2026-02-13 | 13F | Index Venture Growth Associates V Ltd | 256.110 | 27.276 | ||||||
| 2026-02-17 | 13F | Symmetry Peak Management Llc | 2.430 | 259 | ||||||
| 2026-02-18 | 13F | Beacon Pointe Advisors, LLC | 2.634 | 281 | ||||||
| 2026-02-17 | 13F | Burkehill Global Management, LP | 0 | -100,00 | 0 | |||||
| 2026-02-17 | 13F | Raymond James Financial Inc | 678.984 | 31,39 | 72.312 | 38,77 | ||||
| 2026-02-06 | 13F | EverSource Wealth Advisors, LLC | 906 | 29,99 | 96 | 37,14 | ||||
| 2026-02-13 | 13F | Barclays Plc | 415 | -98,95 | 44 | -98,90 | ||||
| 2026-02-10 | 13F | Baker Avenue Asset Management, LP | 49.020 | -7,28 | 5.221 | -2,06 | ||||
| 2026-02-11 | 13F | GW&K Investment Management, LLC | 355.159 | 38 | ||||||
| 2026-02-17 | 13F | Gilder Gagnon Howe & Co Llc | 597.669 | -2,32 | 63.652 | 3,17 | ||||
| 2025-11-13 | 13F | Capital World Investors | 0 | -100,00 | 0 | -100,00 | ||||
| 2026-02-05 | 13F | Stephens Inc /ar/ | 5.457 | -36,01 | 581 | -32,36 | ||||
| 2026-04-20 | 13F | Jfs Wealth Advisors, Llc | 0 | -100,00 | 0 | |||||
| 2026-01-29 | 13F | Renaissance Capital LLC | 41.223 | 222,84 | 4.390 | 241,10 | ||||
| 2026-02-13 | 13F | Barclays Plc | Call | 0 | -100,00 | 0 | -100,00 | |||
| 2026-02-17 | 13F | Lighthouse Investment Partners, LLC | 2.286 | 243 | ||||||
| 2026-01-29 | 13F | Comerica Bank | 26.513 | 372,27 | 2.824 | 398,76 | ||||
| 2025-11-21 | 13F | Nebula Research & Development LLC | 0 | -100,00 | 0 | |||||
| 2026-02-13 | 13F | Mosaic Family Wealth Partners, Llc | 0 | -100,00 | 0 | |||||
| 2026-04-07 | 13F | Park Avenue Securities Llc | 0 | -100,00 | 0 | |||||
| 2026-02-11 | 13F | Deutsche Bank Ag\ | 1.267 | 135 | ||||||
| 2026-02-11 | 13F | Simplex Trading, Llc | 2.159 | -44,50 | 230 | |||||
| 2026-01-29 | 13F | UBS Group AG | 114.028 | 6,79 | 12.144 | 12,79 | ||||
| 2026-02-17 | 13F | SageView Advisory Group, LLC | 136 | 14 | ||||||
| 2026-02-12 | 13F | CIBC Private Wealth Group, LLC | 23.674 | -0,83 | 2.521 | 4,78 | ||||
| 2026-02-18 | 13F/A | Empowered Funds, LLC | 2.415 | 257 | ||||||
| 2026-02-13 | 13F | Truvestments Capital Llc | 0 | -100,00 | 0 | |||||
| 2026-02-13 | 13F | Liberty Mutual Group Asset Management Inc. | 13.031 | 1.388 | ||||||
| 2026-02-17 | 13F | Advisory Services Network, LLC | 0 | -100,00 | 0 | |||||
| 2026-02-17 | 13F | Twinbeech Capital Lp | 0 | -100,00 | 0 | |||||
| 2026-02-13 | 13F | Charles Schwab Investment Management Inc | 506.115 | 3,00 | 53.901 | 8,79 | ||||
| 2026-04-20 | 13F | 25 Llc | 0 | -100,00 | 0 | |||||
| 2025-11-14 | 13F | Sculptor Capital LP | 0 | -100,00 | 0 | |||||
| 2026-02-13 | 13F | Index Venture Growth Associates IV Ltd | 1.711.862 | 0,00 | 182.313 | 5,62 | ||||
| 2026-02-17 | 13F | PharVision Advisers, LLC | 3.283 | 350 | ||||||
| 2026-02-12 | 13F | Marsico Capital Management Llc | 54.979 | 5.855 | ||||||
| 2026-01-26 | 13F | KBC Group NV | 858 | 0 | ||||||
| 2026-02-09 | 13F | Wcm Investment Management, Llc | 183.464 | -30,41 | 19.664 | -27,58 | ||||
| 2026-02-13 | 13F | Stifel Financial Corp | 146.550 | 102,49 | 15.608 | 113,90 | ||||
| 2025-11-12 | 13F | Monashee Investment Management LLC | Put | 0 | -100,00 | 0 | ||||
| 2026-04-02 | 13F | Aspect Partners, LLC | 110 | 1,85 | 7 | -45,45 | ||||
| 2026-01-30 | 13F | Sigma Planning Corp | 0 | -100,00 | 0 | |||||
| 2025-11-12 | 13F | Mach-1 Financial Group, Inc. | 0 | -100,00 | 0 | |||||
| 2026-02-03 | 13F | Wildcat Capital Management, LLC | 0 | -100,00 | 0 | |||||
| 2026-02-17 | 13F | Susquehanna International Group, Llp | 16.626 | -60,74 | 1.771 | -58,55 | ||||
| 2026-02-17 | 13F | Aureus Asset Management, LLC | 1.906 | 203 | ||||||
| 2026-02-13 | 13F | Y-Intercept (Hong Kong) Ltd | 0 | -100,00 | 0 | |||||
| 2026-02-17 | 13F | Susquehanna International Group, Llp | Put | 50.400 | -37,08 | 5.368 | -33,54 | |||
| 2026-02-17 | 13F | Susquehanna International Group, Llp | Call | 395.100 | 5,47 | 42.078 | 11,41 | |||
| 2026-02-17 | 13F | Advisor Group Holdings, Inc. | 1.375 | -39,13 | 146 | -37,61 | ||||
| 2026-04-16 | 13F | Toth Financial Advisory Corp | 360 | 44,00 | 23 | -15,38 | ||||
| 2026-02-03 | 13F | Robeco Schweiz AG | 83.200 | 35,28 | 8.861 | 42,88 | ||||
| 2026-01-28 | 13F | Klp Kapitalforvaltning As | 5.100 | 543 | ||||||
| 2026-02-10 | 13F | Park Avenue Institutional Advisers LLC | 2.757 | 294 | ||||||
| 2026-02-17 | 13F | Blair William & Co/il | 37.173 | 13,13 | 3.959 | 19,47 | ||||
| 2026-02-13 | 13F | Eventide Asset Management, Llc | 178.616 | 1.888,60 | 19.024 | 2.001,99 | ||||
| 2026-02-17 | 13F | Susquehanna Fundamental Investments, Llc | 17.483 | 1.862 | ||||||
| 2025-11-14 | 13F | Blackstone Group Inc | 0 | -100,00 | 0 | -100,00 | ||||
| 2026-02-13 | 13F | Arrowstreet Capital, Limited Partnership | 0 | -100,00 | 0 | |||||
| 2025-11-17 | 13F | LGT Financial Advisors LLC | 0 | -100,00 | 0 | -100,00 | ||||
| 2026-02-13 | 13F | Pathstone Holdings, LLC | 10.060 | 0,82 | 1.071 | 6,46 | ||||
| 2026-02-05 | 13F | Bessemer Group Inc | 2.660 | -1,00 | 0 | |||||
| 2026-02-17 | 13F | Woodline Partners LP | 285.691 | 0,00 | 30.426 | 5,62 | ||||
| 2026-02-11 | 13F | Parallel Advisors, LLC | 526 | 0,00 | 56 | 5,66 | ||||
| 2026-02-13 | 13F | Mariner, LLC | 8.409 | -35,22 | 896 | -31,57 | ||||
| 2026-01-16 | 13F | Marquette Asset Management, LLC | 33 | 120,00 | 4 | 200,00 | ||||
| 2026-02-13 | 13F | MAI Capital Management | 55 | 0,00 | 6 | 0,00 | ||||
| 2026-02-02 | 13F | Triasima Portfolio Management inc. | 0 | -100,00 | 0 | |||||
| 2026-02-17 | 13F | Graham Capital Management, L.P. | 9.487 | -3,40 | 1.010 | 2,02 | ||||
| 2025-11-14 | 13F | ExodusPoint Capital Management, LP | 0 | -100,00 | 0 | |||||
| 2026-02-03 | 13F | SBI Securities Co., Ltd. | 11 | -56,00 | 1 | -50,00 | ||||
| 2026-02-09 | 13F | Huntington National Bank | 160.762 | 0,00 | 17.121 | 5,63 | ||||
| 2026-01-30 | 13F | Jennison Associates Llc | 113.466 | -0,81 | 12.084 | 4,78 | ||||
| 2026-02-13 | 13F | Entropy Technologies, LP | 0 | -100,00 | 0 | |||||
| 2026-02-11 | 13F | MCF Advisors LLC | 0 | -100,00 | 0 | |||||
| 2026-04-13 | 13F | Hm Payson & Co | 418 | -20,53 | 27 | -53,57 | ||||
| 2026-02-13 | 13F | Citigroup Inc | 34.324 | 160,29 | 3.656 | 175,02 | ||||
| 2026-02-17 | 13F | Greenoaks Capital Partners Llc | 1.552.257 | 20,58 | 165.315 | 27,36 | ||||
| 2026-02-17 | 13F | Sig Brokerage, Lp | Call | 0 | -100,00 | 0 | ||||
| 2025-12-16 | 13F | Garde Capital, Inc. | 0 | -100,00 | 0 | |||||
| 2026-01-26 | 13F | Taylor Frigon Capital Management LLC | 26.768 | 18,53 | 2.851 | 25,16 | ||||
| 2026-02-17 | 13F | Gotham Asset Management, LLC | 25.144 | 2.678 | ||||||
| 2026-02-19 | 13F | Invesco Ltd. | 0 | -100,00 | 0 | |||||
| 2026-01-23 | 13F | Freestone Capital Holdings, LLC | 0 | -100,00 | 0 | |||||
| 2026-02-03 | 13F | Connable Office Inc | 2.529 | 23,61 | 269 | 30,58 | ||||
| 2026-01-30 | 13F | Keybank National Association/oh | 5.414 | 18,05 | 577 | 24,68 | ||||
| 2026-02-06 | 13F | Global Retirement Partners, LLC | 81 | 24,62 | 9 | 33,33 | ||||
| 2026-02-06 | 13F | Envestnet Portfolio Solutions, Inc. | 2.973 | 18,87 | 317 | 25,40 | ||||
| 2026-02-17 | 13F | Royal Bank Of Canada | 318.263 | 174,19 | 33.895 | 189,63 | ||||
| 2026-02-10 | 13F/A | Northwestern Mutual Wealth Management Co | 39 | -36,07 | 4 | -33,33 | ||||
| 2025-11-12 | 13F | Berbice Capital Management LLC | 0 | -100,00 | 0 | |||||
| 2026-02-05 | 13F | Td Private Client Wealth Llc | 12.022 | 37,71 | 1.280 | 45,45 | ||||
| 2025-11-14 | 13F | QVT Financial LP | 0 | -100,00 | 0 | |||||
| 2026-02-04 | 13F | Madison Asset Management, LLC | 638.075 | 67.955 | ||||||
| 2026-02-12 | 13F | Mount Yale Investment Advisors, LLC | 4.453 | 474 | ||||||
| 2026-02-05 | 13F | Phoenix Holdings Ltd. | 3.231 | -10,08 | 344 | -4,97 | ||||
| 2026-02-17 | 13F | Wiley Bros.-aintree Capital, Llc | 13.891 | 102,08 | 1.479 | 114,04 | ||||
| 2026-02-17 | 13F | Bank Of America Corp /de/ | 480.089 | 25,33 | 51.129 | 32,38 | ||||
| 2026-02-10 | 13F | Principia Wealth Advisory, LLC | 46 | 5 | ||||||
| 2026-02-13 | 13F | Walleye Trading LLC | Put | 11.700 | -50,00 | 1.246 | -47,18 | |||
| 2026-02-17 | 13F | Liontrust Investment Partners LLP | 641.923 | 114,08 | 68.365 | 126,12 | ||||
| 2025-11-14 | 13F | Point72 (DIFC) Ltd | 0 | -100,00 | 0 | -100,00 | ||||
| 2026-02-13 | 13F | Walleye Trading LLC | Call | 230.700 | -2,53 | 24.570 | 2,95 | |||
| 2026-02-17 | 13F | Deer Management Co. LLC | 5.796.012 | -7,81 | 617.275 | -2,63 | ||||
| 2026-02-11 | 13F | Picton Mahoney Asset Management | 123.993 | 10,96 | 13.205 | 119.945,45 | ||||
| 2026-02-13 | 13F | Thornburg Investment Management Inc | 124.159 | 50,15 | 13.223 | 58,59 | ||||
| 2026-03-12 | 13F/A | Peak6 Llc | Call | 55.900 | -27,59 | 5.953 | -23,52 | |||
| 2026-02-10 | 13F | Goldman Sachs Group Inc | 274.637 | -24,10 | 29.249 | -19,83 | ||||
| 2026-02-12 | 13F | New York State Common Retirement Fund | 160.693 | 41,77 | 17.114 | 49,75 | ||||
| 2026-01-27 | 13F | Zurcher Kantonalbank (Zurich Cantonalbank) | 7.300 | 777 | ||||||
| 2026-03-12 | 13F/A | Peak6 Llc | Put | 7.200 | 767 | |||||
| 2026-04-08 | 13F | Heritage Family Offices, LLP | 0 | -100,00 | 0 | |||||
| 2026-02-17 | 13F | Rakuten Investment Management, Inc. | 0 | -100,00 | 0 | |||||
| 2026-02-17 | 13F | Concentric Capital Strategies, LP | 13.683 | 8,39 | 1.457 | 14,54 | ||||
| 2026-02-20 | 13F | Sunbelt Securities, Inc. | 491 | 391,00 | 52 | 420,00 | ||||
| 2026-04-10 | 13F | Intellectus Partners, LLC | 8.215 | 23,72 | 521 | -26,31 | ||||
| 2026-01-28 | 13F | B. Metzler seel. Sohn & Co. AG | 19.376 | -48,36 | 2.064 | -45,45 | ||||
| 2026-02-12 | 13F | Swiss National Bank | 47.400 | 5.048 | ||||||
| 2026-02-12 | 13F | Counterpoint Mutual Funds LLC | 0 | -100,00 | 0 | |||||
| 2026-02-10 | 13F | Natixis Advisors, L.p. | 367.828 | 39 | ||||||
| 2026-03-26 | 13F/A | Peak6 Llc | 0 | -100,00 | 0 | -100,00 | ||||
| 2026-02-10 | 13F | Bnp Paribas Arbitrage, Sa | 277.937 | -31,96 | 29.600 | -28,14 | ||||
| 2026-02-17 | 13F | Battery Management Corp. | 3.299.941 | -18,79 | 351.444 | -14,23 | ||||
| 2026-02-17 | 13F | Wellington Management Group Llp | 286.609 | -1,72 | 30.524 | 3,81 | ||||
| 2026-01-30 | 13F | WoodTrust Financial Corp | 3.000 | 15,38 | 0 | |||||
| 2026-02-13 | 13F | Rhumbline Advisers | 1.648 | 0,00 | 176 | 5,42 | ||||
| 2025-11-10 | 13F | Napean Trading & Investment Co (Singapore) PTE Ltd | 0 | -100,00 | 0 | |||||
| 2025-11-14 | 13F | Mangrove Partners | 0 | -100,00 | 0 | |||||
| 2026-02-13 | 13F | Walleye Capital LLC | Put | 4.900 | 522 | |||||
| 2026-02-13 | 13F | Walleye Capital LLC | Call | 47.000 | 5.006 | |||||
| 2026-02-17 | 13F | Luxor Capital Group, LP | 4.000 | -55,56 | 426 | -53,03 | ||||
| 2026-04-15 | 13F | FNY Investment Advisers, LLC | 4.475 | 155,71 | 0 | |||||
| 2025-11-12 | 13F | CIBC Bancorp USA Inc. | 842.833 | 84.983 | ||||||
| 2026-01-26 | 13F | Whittier Trust Co Of Nevada Inc | 31.101 | 12.542,68 | 3.165 | 12.560,00 | ||||
| 2026-02-13 | 13F | Caitong International Asset Management Co., Ltd | 0 | -100,00 | 0 | |||||
| 2026-02-17 | 13F | Cambria Investment Management, L.P. | 1.940 | 207 | ||||||
| 2026-02-12 | 13F | BlackRock, Inc. | 1.718.517 | 0,76 | 183.022 | 6,42 | ||||
| 2026-02-13 | 13F | Morgan Stanley | 468.379 | -40,74 | 49.883 | -37,40 | ||||
| 2026-02-17 | 13F | Cetera Investment Advisers | 14.786 | 17,43 | 1.575 | 24,03 | ||||
| 2026-02-05 | 13F | Atria Investments Llc | 20.283 | 55,38 | 2.160 | 64,13 | ||||
| 2026-01-14 | 13F | ORG Partners LLC | 0 | -100,00 | 0 | |||||
| 2026-02-17 | 13F | Shay Capital LLC | 3.500 | 373 | ||||||
| 2026-02-17 | 13F | Sone Capital Management, LLC | 21.390 | -51,02 | 2.278 | -48,26 | ||||
| 2026-02-03 | 13F | International Assets Investment Management, Llc | 1.808 | 193 | ||||||
| 2026-02-10 | 13F | Connor, Clark & Lunn Investment Management Ltd. | 1.997 | 213 | ||||||
| 2026-02-06 | 13F | Copia Wealth Management | 17 | 2 | ||||||
| 2026-01-26 | 13F | Xcel Wealth Management, LLC | 2.675 | 285 | ||||||
| 2026-02-17 | 13F | Bamco Inc /ny/ | 1.096.931 | 13,95 | 116.823 | 20,36 | ||||
| 2026-02-13 | 13F | Bridgewater Associates, LP | 2.864 | 305 | ||||||
| 2026-02-13 | 13F | Mml Investors Services, Llc | 5.219 | 30,67 | 556 | 38,06 | ||||
| 2026-01-29 | 13F | Sanctuary Advisors, LLC | 18.771 | 61,19 | 1.999 | 70,27 | ||||
| 2025-10-28 | 13F | BRYN MAWR TRUST Co | 67 | -99,34 | 7 | -99,45 | ||||
| 2026-02-05 | 13F | Allworth Financial LP | 105 | 15,38 | 11 | 22,22 | ||||
| 2026-02-17 | 13F | Balyasny Asset Management Llc | 188.485 | 106,73 | 20.074 | 118,37 | ||||
| 2026-02-17 | 13F | RiverPark Advisors, LLC | 0 | -100,00 | 0 | |||||
| 2026-01-23 | 13F | Avion Wealth | 6 | 0,00 | 0 | |||||
| 2026-02-06 | 13F | Evoke Wealth, Llc | 3.499 | 0,14 | 373 | 5,68 | ||||
| 2026-02-17 | 13F | Temasek Holdings (Private) Ltd | 12.937 | 0,00 | 1.378 | 5,60 | ||||
| 2026-02-02 | 13F | Oppenheimer Asset Management Inc. | 7.138 | -2,18 | 760 | 3,40 | ||||
| 2026-02-17 | 13F | Fortress Investment Group LLC | 28 | 3 | ||||||
| 2026-02-17 | 13F | Atreides Management, LP | 792.433 | 26,54 | 84.394 | 33,66 | ||||
| 2026-02-10 | 13F | Seven Grand Managers, Llc | 150.000 | 0,00 | 15.975 | 5,63 | ||||
| 2026-02-12 | 13F | Cloud Capital Management, LLC | 0 | -100,00 | 0 | |||||
| 2025-11-06 | 13F | Mainsail Management Company, Llc | 0 | -100,00 | 0 | |||||
| 2026-04-14 | 13F | eCIO, Inc. | 0 | -100,00 | 0 | |||||
| 2026-02-13 | 13F | Walleye Capital LLC | 0 | -100,00 | 0 | -100,00 | ||||
| 2026-02-17 | 13F | Daventry Group, LP | 226.340 | 55,43 | 24.105 | 64,17 | ||||
| 2026-01-07 | 13F | Harbor Investment Advisory, Llc | 324 | 0,00 | 35 | 6,25 | ||||
| 2026-02-13 | 13F | Centiva Capital, LP | 0 | -100,00 | 0 | |||||
| 2026-01-14 | 13F | Spire Wealth Management | 0 | -100,00 | 0 | |||||
| 2026-02-12 | 13F | Circle Wealth Management, LLC | 8.585 | -1,51 | 914 | 4,10 | ||||
| 2026-02-12 | 13F | Ensign Peak Advisors, Inc | 65.000 | 0,00 | 6.922 | 5,63 | ||||
| 2026-02-13 | 13F | Sands Capital Ventures, LLC | 89.856 | 9.570 | ||||||
| 2026-02-09 | 13F | AIA Group Ltd | 9.336 | 0,00 | 994 | 5,63 | ||||
| 2026-04-10 | 13F | First Bank & Trust | 3.564 | 226 | ||||||
| 2026-02-10 | 13F | Daiwa Securities Group Inc. | 643 | 0 | ||||||
| 2026-02-17 | 13F | Private Advisor Group, LLC | 10.155 | 49,32 | 1.082 | 57,81 | ||||
| 2026-02-02 | 13F | Truist Financial Corp | 41.551 | -2,89 | 4.425 | 2,57 | ||||
| 2026-02-17 | 13F | Point72 Asset Management, L.P. | 122.591 | 106,03 | 13.056 | 117,62 | ||||
| 2026-02-17 | 13F | Engineers Gate Manager LP | 60.739 | -41,53 | 6.469 | -38,24 | ||||
| 2026-02-17 | 13F | California State Teachers Retirement System | 21.341 | 2.273 | ||||||
| 2026-02-04 | 13F | Advisor OS, LLC | 2.046 | 218 | ||||||
| 2025-11-10 | 13F | Hartland & Co., LLC | 0 | -100,00 | 0 | |||||
| 2026-02-12 | 13F | Commonwealth Equity Services, Llc | 3.736 | 44,14 | 398 | |||||
| 2025-11-14 | 13F | Goldman Sachs Group Inc | Call | 0 | -100,00 | 0 | -100,00 | |||
| 2026-02-17 | 13F | Lazard Asset Management Llc | 7.585 | -63,83 | 808 | -61,83 | ||||
| 2026-02-06 | 13F | Emergence Gp Partners, Llc | 116.500 | 0,00 | 12.407 | 5,63 | ||||
| 2026-04-13 | 13F | IFP Advisors, Inc | 90 | -45,12 | 6 | -70,59 | ||||
| 2026-02-13 | 13F | ICONIQ Capital, LLC | 11.527.632 | 0,00 | 1.227.693 | 5,62 | ||||
| 2026-02-11 | 13F | Franklin Resources Inc | 2.014.025 | 33,81 | 214.494 | 41,33 | ||||
| 2026-02-17 | 13F | PDT Partners, LLC | 6.071 | -5,48 | 647 | -0,15 | ||||
| 2025-11-21 | 13F/A | Alpine Global Management, LLC | 0 | -100,00 | 0 | -100,00 | ||||
| 2025-11-14 | 13F | Hbk Investments L P | 0 | -100,00 | 0 | -100,00 | ||||
| 2026-04-06 | 13F | IFS Advisors, LLC | 47 | 0,00 | 3 | -60,00 | ||||
| 2026-01-30 | 13F | Bogart Wealth, LLC | 192 | 120,69 | 20 | 150,00 | ||||
| 2026-02-02 | 13F | Principal Financial Group Inc | 402.365 | -1,49 | 42.852 | 4,05 | ||||
| 2026-04-14 | 13F | Baldwin Brothers Inc/ma | 0 | -100,00 | 0 | |||||
| 2026-02-17 | 13F | Greycroft LP | 30.000 | 200,00 | 3.195 | 216,96 | ||||
| 2026-02-17 | 13F | Price T Rowe Associates Inc /md/ | 928.620 | -9,31 | 99 | -4,85 | ||||
| 2026-04-20 | 13F | Vanderbilt University | 3.202 | 203 | ||||||
| 2026-02-10 | 13F | Norges Bank | 1.058.008 | 112.678 | ||||||
| 2026-02-17 | 13F | Holocene Advisors, LP | 144.863 | -39,65 | 15.428 | -36,26 | ||||
| 2026-04-09 | 13F | Zevenbergen Capital Investments Llc | 45.800 | 13,93 | 2.906 | -32,12 | ||||
| 2026-02-06 | 13F | Entrust Financial Llc | 149 | 16 | ||||||
| 2026-02-09 | 13F | Geode Capital Management, Llc | 670.270 | 4,08 | 71.417 | 9,94 | ||||
| 2025-11-14 | 13F | Integrated Wealth Concepts LLC | 0 | -100,00 | 0 | |||||
| 2025-11-14 | 13F | Harbourvest Partners Llc | 0 | -100,00 | 0 | |||||
| 2026-02-11 | 13F | CenterBook Partners LP | 6.206 | 661 | ||||||
| 2026-01-28 | 13F | Arizona State Retirement System | 6.613 | 704 | ||||||
| 2026-02-06 | 13F | Abn Amro Investment Solutions | 41.354 | 4.404 | ||||||
| 2026-02-11 | 13F | First Command Advisory Services, Inc. | 40 | 4 | ||||||
| 2026-01-23 | 13F | Robeco Institutional Asset Management B.V. | 9.336 | 0,00 | 994 | 5,63 | ||||
| 2025-12-09 | 13F/A | Tudor Investment Corp Et Al | 171.545 | 112,18 | 17.297 | 99,61 | ||||
| 2026-02-13 | 13F | Scge Management, L.p. | 1.229.285 | 0,00 | 130.919 | 5,62 | ||||
| 2026-02-13 | 13F | Quarry LP | 222 | -3,90 | 24 | 0,00 | ||||
| 2025-11-14 | 13F | Weiss Asset Management LP | 0 | -100,00 | 0 | -100,00 | ||||
| 2026-02-13 | 13F | Alyeska Investment Group, L.P. | 191.900 | -66,31 | 20.437 | -64,41 | ||||
| 2026-02-17 | 13F | Two Sigma Advisers, Lp | 68.900 | -76,38 | 7.338 | -75,05 | ||||
| 2025-11-14 | 13F | Ubs Oconnor Llc | 0 | -100,00 | 0 | -100,00 | ||||
| 2026-01-30 | 13F | Catalytic Wealth RIA, LLC | 0 | -100,00 | 0 | |||||
| 2026-01-23 | 13F | Assetmark, Inc | 93.778 | 1.087,36 | 9.987 | 1.154,65 | ||||
| 2026-02-17 | 13F | Janus Henderson Group Plc | 772.198 | 63,11 | 82.241 | 72,29 | ||||
| 2026-02-13 | 13F | Parkside Financial Bank & Trust | 0 | -100,00 | 0 | |||||
| 2026-02-10 | 13F | Quantbot Technologies LP | 3.447 | -97,17 | 367 | -97,01 | ||||
| 2026-02-13 | 13F | SRS Capital Advisors, Inc. | 206 | 66,13 | 22 | 75,00 | ||||
| 2026-02-13 | 13F | OMERS ADMINISTRATION Corp | 9.400 | 1.001 | ||||||
| 2025-11-12 | 13F | Sumitomo Mitsui Financial Group, Inc. | 0 | -100,00 | 0 | |||||
| 2026-02-13 | 13F | Kestra Advisory Services, LLC | 1.820 | 194 | ||||||
| 2026-02-13 | 13F | Landscape Capital Management, L.l.c. | 4.817 | 0,00 | 513 | 5,77 | ||||
| 2025-11-04 | 13F | Mission Wealth Management, Lp | 0 | -100,00 | 0 | -100,00 | ||||
| 2026-02-19 | 13F/A | Axxcess Wealth Management, Llc | 2.146 | 229 | ||||||
| 2026-01-23 | 13F | Steigerwald, Gordon & Koch Inc. | 36 | 4 | ||||||
| 2026-02-03 | 13F | Sequoia Financial Advisors, LLC | 0 | -100,00 | 0 | |||||
| 2026-02-05 | 13F | Gabelli Funds Llc | 3.500 | 0,00 | 373 | 5,68 | ||||
| 2026-02-12 | 13F | Jane Street Group, Llc | Call | 202.700 | -32,81 | 21.588 | -29,04 | |||
| 2026-02-13 | 13F | Verition Fund Management LLC | 39.385 | -52,93 | 4.195 | -50,28 | ||||
| 2026-02-12 | 13F | Jane Street Group, Llc | Put | 4.200 | -63,79 | 447 | -61,76 | |||
| 2026-02-17 | 13F | Cinctive Capital Management LP | 0 | -100,00 | 0 | |||||
| 2026-02-17 | 13F | Df Dent & Co Inc | 0 | -100,00 | 0 | |||||
| 2026-02-04 | 13F | LRI Investments, LLC | 839 | 78,89 | 89 | 89,36 | ||||
| 2026-02-12 | 13F | Voya Investment Management Llc | 219.614 | -0,06 | 23.389 | 5,56 | ||||
| 2026-02-13 | 13F | Segall Bryant & Hamill, Llc | 115.198 | 4,67 | 12.269 | 10,55 | ||||
| 2026-04-13 | 13F | True Wealth Design, LLC | 8 | 1 | ||||||
| 2026-02-17 | 13F | Symmetry Investments LP | 20.000 | 2.130 | ||||||
| 2025-10-27 | 13F | Clarity Asset Management, Inc. | 0 | -100,00 | 0 | -100,00 | ||||
| 2026-02-03 | 13F/A | Bank Of America Corp /de/ | Put | 0 | -100,00 | 0 | -100,00 | |||
| 2026-02-17 | 13F | Two Sigma Investments, Lp | 206.335 | -64,64 | 21.975 | -62,65 | ||||
| 2025-11-14 | 13F | Mane Global Capital Management Lp | 0 | -100,00 | 0 | |||||
| 2026-04-17 | 13F | IFC & Insurance Marketing, Inc. | 0 | -100,00 | 0 | |||||
| 2026-02-10 | 13F | Bank of New York Mellon Corp | 104.644 | 8,92 | 11.145 | 15,04 | ||||
| 2026-02-13 | 13F | Bullseye Asset Management LLC | 21.836 | 122,00 | 2 | |||||
| 2026-01-30 | 13F | Rachor Investment Advisory Services, LLC | 17 | 2 | ||||||
| 2026-02-11 | 13F | Winton Capital Group Ltd | 0 | -100,00 | 0 | -100,00 | ||||
| 2026-02-12 | 13F | Renaissance Technologies Llc | 200.600 | -61,24 | 21.364 | -59,06 | ||||
| 2026-02-17 | 13F | Aquatic Capital Management LLC | 0 | -100,00 | 0 | |||||
| 2026-02-17 | 13F | Ameriprise Financial Inc | 19.669 | -5,42 | 2.095 | -0,10 | ||||
| 2026-02-04 | 13F | Ameritas Advisory Services, LLC | 5.720 | 11,46 | 609 | 17,79 | ||||
| 2026-02-17 | 13F | Magnetar Financial LLC | 0 | -100,00 | 0 | |||||
| 2026-02-17 | 13F | State Of Wisconsin Investment Board | 16.350 | 1.741 | ||||||
| 2025-11-12 | 13F | Aster Capital Management (DIFC) Ltd | 0 | -100,00 | 0 | |||||
| 2026-01-28 | 13F | Thoma Bravo, Llc | 1.039.099 | 0,00 | 93.342 | -10,91 | ||||
| 2026-02-17 | 13F | Brevan Howard Capital Management LP | 2.910 | -58,16 | 310 | -55,92 | ||||
| 2026-02-17 | 13F | Tudor Investment Corp Et Al | Put | 6.400 | 682 | |||||
| 2026-02-12 | 13F | MetLife Investment Management, LLC | 1.276 | 80,99 | 136 | 90,14 | ||||
| 2026-02-17 | 13F | Tudor Investment Corp Et Al | Call | 15.100 | 104,05 | 1.608 | 115,55 |