Grundlæggende statistik
| Institutionelle ejere | 199 total, 198 long only, 0 short only, 1 long/short - change of -47,91% MRQ |
| Gennemsnitlig porteføljeallokering | 0.1010 % - change of -26,76% MRQ |
| Institutionelle aktier (lange) | 39.013.077 (ex 13D/G) - change of -12,46MM shares -24,21% MRQ |
| Institutionel værdi (lang) | $ 811.571 USD ($1000) |
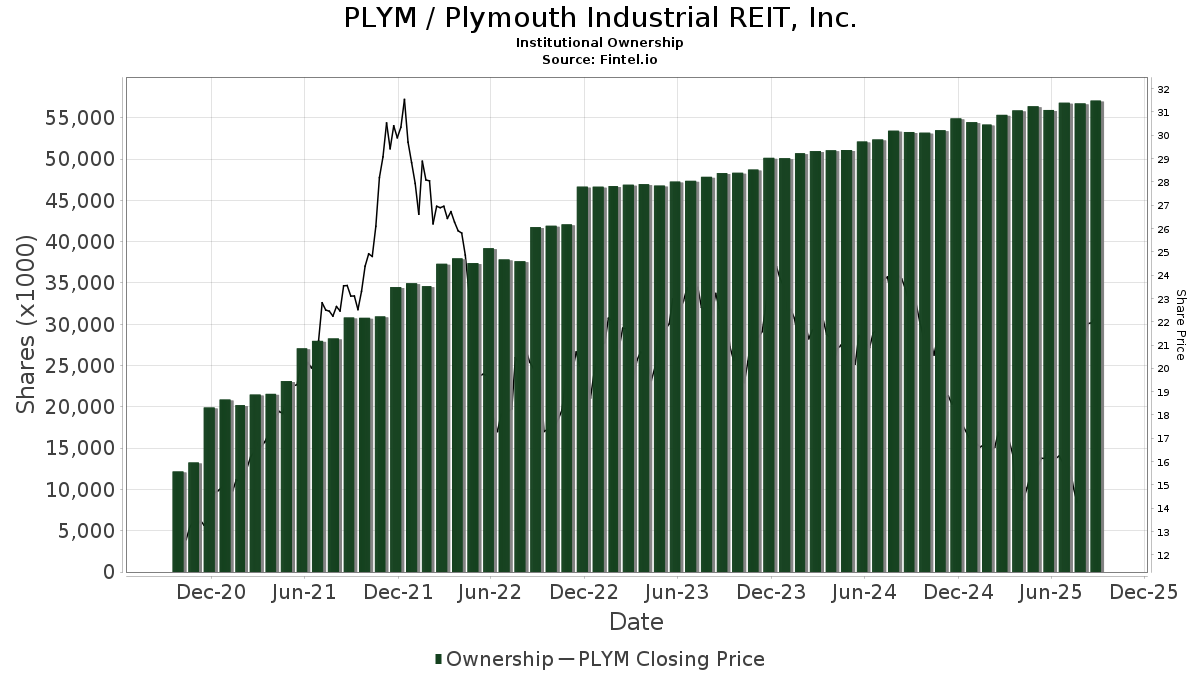
Institutionelt ejerskab og aktionærer
Plymouth Industrial REIT, Inc. (US:PLYM) har 199 institutionelle ejere og aktionærer, der har indsendt 13D/G- eller 13F-formularer til Securities Exchange Commission (SEC). Disse institutioner har i alt 39,013,077 aktier. Største aktionærer omfatter BlackRock, Inc., Vanguard Group Inc, D. E. Shaw & Co., Inc., Glazer Capital, Llc, Delaware Management Holdings, Inc., Jennison Associates Llc, Melqart Asset Management (uk) Ltd, State Street Corp, Geode Capital Management, Llc, and FIL Ltd .
Plymouth Industrial REIT, Inc. (NYSE:PLYM) institutionel ejerskabsstruktur viser aktuelle positioner i virksomheden efter institutioner og fonde, samt seneste ændringer i positionsstørrelse. Større aktionærer kan omfatte individuelle investorer, investeringsforeninger, hedgefonde eller institutioner. Skema 13D angiver, at investoren besidder (eller besidder) mere end 5 % af virksomheden og har til hensigt (eller har til hensigt at) aktivt at forfølge en ændring i forretningsstrategi. Skema 13G indikerer en passiv investering på over 5%.
The share price as of January 27, 2026 is 21,98 / share. Previously, on April 28, 2025, the share price was 14,88 / share. This represents an increase of 47,72% over that period.
Fondens stemningsscore
Fund Sentiment Score (fka Ownership Accumulation Score) finder de aktier, der bliver mest købt af fonde. Det er resultatet af en sofistikeret, multi-faktor kvantitativ model, der identificerer virksomheder med de højeste niveauer af institutionel akkumulering. Scoringsmodellen bruger en kombination af den samlede stigning i oplyste ejere, ændringerne i porteføljeallokeringer i disse ejere og andre målinger. Tallet går fra 0 til 100, hvor højere tal indikerer et højere niveau af akkumulering for sine jævnaldrende, og 50 er gennemsnittet.
Opdateringsfrekvens: Dagligt
Se Ownership Explorer, som giver en liste over højest rangerende virksomheder.
AI+ Ask Fintel’s AI assistant about Plymouth Industrial REIT, Inc..
Select a question to share a public post with an AI-crafted answer.
Thinking of good questions…
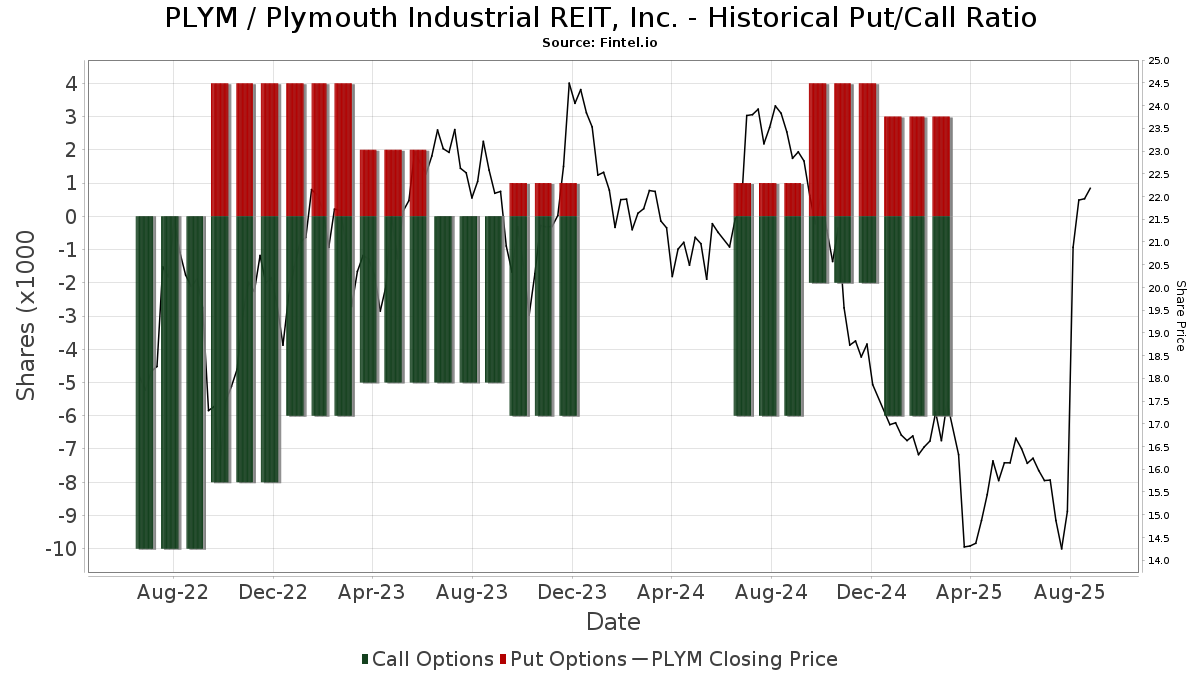
Institutionel Put/Call-forhold
Ud over at indberette standardaktie- og gældsudstedelser skal institutter med mere end 100 mill. aktiver under forvaltning også oplyse deres put- og call-optionsbeholdninger. Da salgsoptioner generelt indikerer negativ stemning, og købsoptioner indikerer positiv stemning, kan vi få en fornemmelse af den overordnede institutionelle stemning ved at plotte forholdet mellem put og kald. Diagrammet til højre viser det historiske put/call-forhold for dette instrument.
Brug af Put/Call Ratio som en indikator for investorernes stemning overvinder en af de vigtigste mangler ved at bruge totalt institutionelt ejerskab, som er, at en betydelig mængde af aktiver under forvaltning investeres passivt for at spore indekser. Passivt forvaltede fonde køber typisk ikke optioner, så indikatoren for put/call-forholdet følger mere nøje følelsen af aktivt forvaltede fonde.
13D/G-arkivering
Vi præsenterer 13D/G ansøgninger separat fra 13F ansøgninger på grund af den forskellige behandling af SEC. 13D/G-ansøgninger kan indgives af grupper af investorer (med én ledende), hvorimod 13F-ansøgninger ikke kan. Dette resulterer i situationer, hvor en investor kan indsende en 13D/G, der rapporterer én værdi for de samlede aktier (der repræsenterer alle de aktier, der ejes af investorgruppen), men derefter indsender en 13F, der rapporterer en anden værdi for de samlede aktier (der udelukkende repræsenterer deres egne) ejendomsret). Det betyder, at aktieejerskab af 13D/G-arkiver og 13F-arkiveringer ofte ikke er direkte sammenlignelige, så vi præsenterer dem separat.
Bemærk: Fra den 16. maj 2021 viser vi ikke længere ejere, der ikke har indsendt en 13D/G inden for det seneste år. Tidligere viste vi den fulde historie af 13D/G-arkiver. Generelt skal enheder, der er forpligtet til at indgive 13D/G-ansøgninger, indgive mindst årligt, før de indsender en afsluttende ansøgning. Dog forlader fonde nogle gange positioner uden at indsende en afsluttende ansøgning (dvs. de afvikler), så visning af den fulde historie resulterede nogle gange i forvirring om det nuværende ejerskab. For at undgå forvirring viser vi nu kun 'aktuelle' ejere - det vil sige - ejere, der har anmeldt inden for det seneste år.
Upgrade to unlock premium data.
| Fil dato | Form | Investor | Forrige Aktier |
Seneste Aktier |
Δ Aktier (Procent) |
Ejendomsret (Procent) |
Δ Ejerskab (Procent) |
|
|---|---|---|---|---|---|---|---|---|
| 2026-02-13 | PRUDENTIAL FINANCIAL INC | 3,565,294 | 1,535,432 | -56.93 | 3.40 | -56.41 | ||
| 2026-02-09 | Hudson Bay Capital Management LP | 2,525,651 | 302,468 | -88.02 | 0.68 | -88.01 | ||
| 2026-02-06 | TSSP Sub-Fund HoldCo LLC | 4,944,629 | 0 | -100.00 | 0.00 | -100.00 | ||
| 2026-01-30 | JENNISON ASSOCIATES LLC | 3,540,809 | 1,532,682 | -56.71 | 3.40 | -56.41 | ||
| 2026-01-13 | GLAZER CAPITAL, LLC | 2,151,500 | 4.83 | |||||
| 2025-08-13 | Madison International Realty Holdings, LLC | 4,121,393 | 2,217,491 | -46.20 | 4.86 | -46.00 | ||
| 2025-05-12 | FMR LLC | 2,569,530 | 1,731,329 | -32.62 | 3.80 | -32.35 | ||
| 2025-04-17 | BlackRock, Inc. | 4,214,841 | 3,453,403 | -18.07 | 7.60 | -18.28 |
13F og NPORT arkivering
Detaljer om 13F-arkivering er gratis. Detaljer om NP-ansøgninger kræver et premium-medlemskab. Grønne rækker angiver nye positioner. Røde rækker angiver lukkede positioner. Klik på linket ikon for at se den fulde transaktionshistorik.
Opgrader
for at låse premium-data op og eksportere til Excel ![]() .
.
| Fil dato | Kilde | Investor | Type | Gennemsnitlig pris (Øst) |
Aktier | Δ Aktier (%) |
Rapporteret Værdi ($1000) |
Δ Værdi (%) |
Port Alloc (%) |
|
|---|---|---|---|---|---|---|---|---|---|---|
| 2026-04-15 | 13F | Gf Fund Management Co. Ltd. | 0 | -100,00 | 0 | |||||
| 2025-11-13 | 13F | Arkhouse Management Co. LP | 20.530 | 13,36 | 458 | 57,93 | ||||
| 2026-02-17 | 13F | Graham Capital Management, L.P. | 34.017 | 744 | ||||||
| 2025-11-21 | 13F | Nebula Research & Development LLC | 0 | -100,00 | 0 | |||||
| 2026-04-06 | 13F | GAMMA Investing LLC | 0 | -100,00 | 0 | |||||
| 2026-02-11 | 13F | Group One Trading, L.p. | 17.408 | 60,41 | 381 | 57,02 | ||||
| 2026-02-13 | 13F | Glazer Capital, Llc | 1.662.651 | 36 | ||||||
| 2025-11-14 | 13F | Engineers Gate Manager LP | 0 | -100,00 | 0 | |||||
| 2026-02-05 | 13F | Bessemer Group Inc | 0 | -100,00 | 0 | |||||
| 2026-02-11 | 13F | Fox Run Management, L.l.c. | 15.263 | 334 | ||||||
| 2026-02-12 | 13F | Voya Investment Management Llc | 0 | -100,00 | 0 | |||||
| 2026-02-05 | 13F | Gabelli Funds Llc | 278.394 | 54,23 | 6.091 | 51,14 | ||||
| 2026-02-12 | 13F | Bank Of Montreal /can/ | 0 | -100,00 | 0 | |||||
| 2026-01-15 | 13F | Nisa Investment Advisors, Llc | 4.959 | -16,57 | 109 | -19,40 | ||||
| 2026-02-17 | 13F | Northern Trust Corp | 435.765 | -6,49 | 9.535 | -8,38 | ||||
| 2026-02-17 | 13F | XTX Topco Ltd | 0 | -100,00 | 0 | |||||
| 2026-02-10 | 13F | Norges Bank | 445.400 | 9.745 | ||||||
| 2026-02-13 | 13F | Morgan Stanley | 644.989 | 62,80 | 14.112 | 59,51 | ||||
| 2026-04-20 | 13F | Kestra Private Wealth Services, Llc | 0 | -100,00 | 0 | |||||
| 2026-01-29 | 13F | Vanguard Group Inc | 3.961.499 | -0,76 | 86.678 | -2,76 | ||||
| 2026-02-13 | 13F | Quarry LP | 1.280 | 28 | ||||||
| 2026-02-17 | 13F | Millennium Management Llc | 681.413 | 14.909 | ||||||
| 2025-11-07 | 13F | Alberta Investment Management Corp | 276.379 | 6.172 | ||||||
| 2026-01-07 | 13F | CWA Asset Management Group, LLC | 0 | -100,00 | 0 | -100,00 | ||||
| 2026-02-12 | 13F | State Board Of Administration Of Florida Retirement System | 12.264 | 0,00 | 268 | -1,83 | ||||
| 2026-02-09 | 13F | Huntington National Bank | 144 | 0,00 | 3 | 0,00 | ||||
| 2026-02-13 | 13F | Sei Investments Co | 28.897 | 632 | ||||||
| 2026-01-30 | 13F | New York State Teachers Retirement System | 3.667 | 0,00 | 0 | |||||
| 2026-02-17 | 13F | Governors Lane LP | 244.644 | 5.353 | ||||||
| 2026-02-02 | 13F | Principal Financial Group Inc | 68.456 | 22,65 | 1.498 | 20,14 | ||||
| 2026-02-13 | 13F | Great West Life Assurance Co /can/ | 72.904 | 5,80 | 2 | 0,00 | ||||
| 2026-02-12 | 13F | Barnett & Company, Inc. | 126.490 | -9,84 | 2.768 | -11,65 | ||||
| 2026-02-17 | 13F | Balyasny Asset Management Llc | 407.779 | -27,47 | 8.922 | -28,94 | ||||
| 2026-02-09 | 13F | Quest Partners LLC | 17.053 | 96,74 | 373 | 93,26 | ||||
| 2026-02-12 | 13F | Great Lakes Advisors, Llc | 23.434 | -85,86 | 513 | -86,17 | ||||
| 2026-02-17 | 13F | Advisor Group Holdings, Inc. | 118 | -72,56 | 3 | -77,78 | ||||
| 2026-02-10 | 13F | Intech Investment Management Llc | 21.651 | 24,45 | 474 | 21,91 | ||||
| 2026-02-13 | 13F | Cape Cod Five Cents Savings Bank | 70.426 | 0,00 | 1.592 | 0,00 | ||||
| 2026-02-04 | 13F | Pacer Advisors, Inc. | 21.626 | 473 | ||||||
| 2026-01-23 | 13F | Sumitomo Mitsui Trust Holdings, Inc. | 47.348 | -1,32 | 1.036 | -3,36 | ||||
| 2026-02-17 | 13F | Melqart Asset Management (uk) Ltd | 1.426.429 | 31.210 | ||||||
| 2026-01-21 | 13F | Sound Income Strategies, LLC | 425 | -5,97 | 9 | 0,00 | ||||
| 2026-02-17 | 13F | Boothbay Fund Management, Llc | 78.040 | 1.708 | ||||||
| 2026-01-28 | 13F | Arizona State Retirement System | 10.553 | -13,00 | 231 | -14,81 | ||||
| 2026-02-17 | 13F | Advisory Services Network, LLC | 0 | -100,00 | 0 | |||||
| 2026-02-17 | 13F | Rangeley Capital, LLC | Call | 6.500 | 142 | |||||
| 2025-11-13 | 13F | Renaissance Technologies Llc | 0 | -100,00 | 0 | -100,00 | ||||
| 2026-01-16 | 13F | FNY Investment Advisers, LLC | 0 | -100,00 | 0 | |||||
| 2026-02-17 | 13F | Voloridge Investment Management, Llc | 506.834 | 358,98 | 11.090 | 349,86 | ||||
| 2026-02-17 | 13F | Farringdon Capital, Ltd. | 22.846 | 500 | ||||||
| 2026-02-17 | 13F | Highland Capital Management Fund Advisors, L.p. | 390.301 | 8.540 | ||||||
| 2026-02-17 | 13F | Susquehanna International Group, Llp | Put | 0 | -100,00 | 0 | ||||
| 2026-04-07 | 13F | Farther Finance Advisors, LLC | 0 | -100,00 | 0 | |||||
| 2026-02-11 | 13F | Allianz Asset Management GmbH | 41.605 | -2,18 | 910 | -4,11 | ||||
| 2026-04-16 | 13F | SG Americas Securities, LLC | 0 | -100,00 | 0 | |||||
| 2026-02-17 | 13F | Susquehanna International Group, Llp | 0 | -100,00 | 0 | |||||
| 2026-01-30 | 13F | Jennison Associates Llc | 1.532.682 | -56,55 | 33.535 | -57,43 | ||||
| 2026-04-21 | 13F | Wedbush Securities Inc | 0 | -100,00 | 0 | |||||
| 2026-02-13 | 13F | Boston Partners | 0 | -100,00 | 0 | |||||
| 2026-02-17 | 13F | Dv Equities, Llc | 299 | 7 | ||||||
| 2026-02-13 | 13F | Rhumbline Advisers | 62.226 | -7,38 | 1.361 | -9,27 | ||||
| 2026-02-13 | 13F | Quinn Opportunity Partners LLC | 66.688 | 1.459 | ||||||
| 2026-02-23 | 13F | Virtu Financial LLC | 17.972 | 0 | ||||||
| 2026-02-17 | 13F | Two Sigma Investments, Lp | 63.874 | -48,55 | 1.398 | -49,60 | ||||
| 2026-02-17 | 13F | Susquehanna International Group, Llp | Call | 36.800 | 206,67 | 805 | 201,50 | |||
| 2026-02-11 | 13F | Parallel Advisors, LLC | 1.512 | 12,75 | 33 | 13,79 | ||||
| 2026-02-17 | 13F | Qube Research & Technologies Ltd | 530.892 | 11.616 | ||||||
| 2026-02-13 | 13F | Capula Management Ltd | 101.883 | 2.229 | ||||||
| 2026-01-29 | 13F | Dunhill Financial, LLC | 1 | 0 | ||||||
| 2026-02-17 | 13F | D. E. Shaw & Co., Inc. | 1.922.761 | 548,13 | 42.070 | 535,11 | ||||
| 2026-01-14 | 13F | Hennion & Walsh Asset Management, Inc. | 11.237 | -1,19 | 246 | -3,16 | ||||
| 2026-02-06 | 13F | EverSource Wealth Advisors, LLC | 88 | -47,62 | 2 | -66,67 | ||||
| 2026-02-17 | 13F | Clear Street Markets Llc | 2.000 | 44 | ||||||
| 2026-02-17 | 13F | Rangeley Capital, LLC | 114.000 | 2.494 | ||||||
| 2026-02-17 | 13F | Rangeley Capital, LLC | Put | 100 | 2 | |||||
| 2026-02-17 | 13F | Public Employees Retirement System Of Ohio | 60.121 | -52,79 | 1.315 | -53,75 | ||||
| 2026-02-11 | 13F | Rise Advisors, LLC | 0 | -100,00 | 0 | |||||
| 2026-02-11 | 13F | Ameritas Investment Partners, Inc. | 3.429 | 75 | ||||||
| 2026-02-12 | 13F | Jane Street Group, Llc | Put | 0 | -100,00 | 0 | -100,00 | |||
| 2026-02-05 | 13F | Gamco Investors, Inc. Et Al | 52.617 | -2,18 | 1.151 | -4,16 | ||||
| 2026-02-11 | 13F | Franklin Resources Inc | 70.745 | 80,65 | 1.548 | 77,00 | ||||
| 2026-04-13 | 13F | Massmutual Trust Co Fsb/adv | 0 | -100,00 | 0 | |||||
| 2025-11-12 | 13F | CIBC Bancorp USA Inc. | 15.176 | 339 | ||||||
| 2026-02-10 | 13F | Goldman Sachs Group Inc | 478.974 | 2,10 | 10.480 | 0,04 | ||||
| 2026-02-17 | 13F | Aqr Capital Management Llc | 24.090 | 6,67 | 527 | 4,56 | ||||
| 2026-02-17 | 13F | Janus Henderson Group Plc | 648.493 | 2.935,73 | 14.192 | 2.881,51 | ||||
| 2026-02-12 | 13F | Quadrant Capital Group Llc | 1.786 | 16,66 | 39 | 14,71 | ||||
| 2026-01-30 | 13F | American Capital Advisory, LLC | 2 | 0 | ||||||
| 2026-02-17 | 13F | Point72 Asset Management, L.P. | 60.607 | 1.326 | ||||||
| 2026-01-21 | 13F | Flagship Harbor Advisors, Llc | 500 | 11 | ||||||
| 2026-02-03 | 13F | Mitsubishi UFJ Kokusai Asset Management Co., Ltd. | 36.255 | 0,00 | 793 | -1,98 | ||||
| 2026-02-13 | 13F | Victory Capital Management Inc | 37.000 | 0,00 | 810 | -2,06 | ||||
| 2026-02-17 | 13F | TIG Advisors, LLC | Put | 0 | -100,00 | 0 | ||||
| 2026-02-17 | 13F | Caption Management, LLC | Call | 40.200 | 129,71 | 880 | 125,38 | |||
| 2026-04-07 | 13F | Signaturefd, Llc | 0 | -100,00 | 0 | |||||
| 2026-02-13 | 13F | Hudson Bay Capital Management LP | 302.468 | -88,02 | 6.618 | -88,27 | ||||
| 2026-02-17 | 13F | Polar Asset Management Partners Inc. | 132.564 | 2.900 | ||||||
| 2026-01-15 | 13F | Adams Asset Advisors, LLC | 0 | -100,00 | 0 | |||||
| 2026-02-13 | 13F | Colony Group, LLC | 52.090 | 43,04 | 1.140 | 40,10 | ||||
| 2026-02-13 | 13F | Vivaldi Asset Management, LLC | 856.618 | 18.743 | ||||||
| 2026-02-12 | 13F | BlackRock, Inc. | 4.221.385 | -21,80 | 92.364 | -23,37 | ||||
| 2026-02-05 | 13F | Amalgamated Bank | 1.322 | -3,99 | 0 | |||||
| 2026-02-17 | 13F | Creative Planning | 18.791 | -6,92 | 411 | -8,67 | ||||
| 2026-02-17 | 13F | Atom Investors LP | 101.266 | 2.216 | ||||||
| 2026-02-13 | 13F | Citigroup Inc | 162.567 | 291,56 | 3.557 | 283,60 | ||||
| 2025-11-10 | 13F | MAI Capital Management | 0 | -100,00 | 0 | |||||
| 2026-02-20 | 13F | Sunbelt Securities, Inc. | 18 | 0,00 | 0 | |||||
| 2026-02-17 | 13F | TIG Advisors, LLC | 897.937 | -38,33 | 19.647 | -39,58 | ||||
| 2025-11-13 | 13F | Madison International Realty Holdings, LLC | 0 | -100,00 | 0 | |||||
| 2026-01-26 | 13F | Mirae Asset Global Investments Co., Ltd. | 1.107 | 23,27 | 24 | 20,00 | ||||
| 2026-02-17 | 13F | Royal Bank Of Canada | 10.501 | -63,64 | 229 | -64,50 | ||||
| 2026-02-10 | 13F | Rothschild Investment Llc | 89 | 4,71 | 2 | 0,00 | ||||
| 2026-02-10 | 13F | Daiwa Securities Group Inc. | 16.535 | 2,56 | 0 | |||||
| 2026-04-23 | 13F | CWM Advisors, LLC | 0 | -100,00 | 0 | |||||
| 2026-02-13 | 13F | Manufacturers Life Insurance Company, The | 0 | -100,00 | 0 | -100,00 | ||||
| 2026-04-01 | 13F | Pensionfund Sabic | 0 | -100,00 | 0 | |||||
| 2026-01-28 | 13F | Klp Kapitalforvaltning As | 8.200 | 0,00 | 179 | -2,72 | ||||
| 2026-02-12 | 13F | CIBC Private Wealth Group, LLC | 2.701 | 0,00 | 59 | -1,67 | ||||
| 2026-02-13 | 13F | Meixler Investment Management, Ltd. | 0 | -100,00 | 0 | -100,00 | ||||
| 2026-02-17 | 13F | Bank Of America Corp /de/ | 84.246 | -83,40 | 1.843 | -83,74 | ||||
| 2026-02-17 | 13F | Prelude Capital Management, Llc | 11.565 | -80,76 | 253 | -81,15 | ||||
| 2026-02-17 | 13F | State Of Wisconsin Investment Board | 22.605 | 495 | ||||||
| 2026-02-13 | 13F | Kestra Advisory Services, LLC | 0 | -100,00 | 0 | |||||
| 2026-02-11 | 13F | Deutsche Bank Ag\ | 37.052 | 6,25 | 811 | 4,11 | ||||
| 2025-11-06 | 13F | Versor Investments LP | 0 | -100,00 | 0 | |||||
| 2025-11-13 | 13F | Heritage Wealth Advisors | 0 | -100,00 | 0 | |||||
| 2026-02-17 | 13F | Harvest Management Llc | 105.000 | -4,55 | 2.297 | -6,47 | ||||
| 2026-02-09 | 13F | Harbour Investments, Inc. | 303 | 1,00 | 7 | 0,00 | ||||
| 2026-02-13 | 13F | Crossingbridge Advisors, LLC | 0 | -100,00 | 0 | |||||
| 2025-11-14 | 13F | Two Sigma Advisers, Lp | 0 | -100,00 | 0 | |||||
| 2026-04-22 | 13F | Sterling Capital Management LLC | 0 | -100,00 | 0 | |||||
| 2026-02-05 | 13F | Allworth Financial LP | 720 | -4,64 | 16 | -6,25 | ||||
| 2026-02-11 | 13F | LPL Financial LLC | 12.562 | -25,10 | 275 | -26,74 | ||||
| 2026-02-13 | 13F | Verition Fund Management LLC | Call | 10.500 | 230 | |||||
| 2026-02-13 | 13F | Verition Fund Management LLC | 48.800 | -85,60 | 1.068 | -85,90 | ||||
| 2025-11-13 | 13F | Dynamic Technology Lab Private Ltd | 0 | -100,00 | 0 | |||||
| 2026-02-11 | 13F | Heartland Advisors Inc | 300.000 | -54,23 | 6.564 | -55,15 | ||||
| 2026-02-17 | 13F | Man Group plc | 437.836 | 9.580 | ||||||
| 2026-02-17 | 13F | Fort Baker Capital Management LP | 165.899 | 3.630 | ||||||
| 2026-02-12 | 13F | Alps Advisors Inc | 0 | -100,00 | 0 | |||||
| 2026-04-20 | 13F | State of Alaska, Department of Revenue | 0 | -100,00 | 0 | |||||
| 2026-02-12 | 13F | Colony Capital, Inc. | 0 | -100,00 | 0 | |||||
| 2026-02-10 | 13F | Bnp Paribas Arbitrage, Sa | 10.497 | 19,30 | 230 | 16,84 | ||||
| 2026-02-13 | 13F | Charles Schwab Investment Management Inc | 674.988 | 4,68 | 14.769 | 2,57 | ||||
| 2026-02-17 | 13F | Adage Capital Partners Gp, L.l.c. | 0 | -100,00 | 0 | |||||
| 2026-02-12 | 13F | MetLife Investment Management, LLC | 25.645 | -0,03 | 561 | -1,92 | ||||
| 2026-01-16 | 13F | Ronald Blue Trust, Inc. | 0 | -100,00 | 0 | |||||
| 2026-02-06 | 13F | Pnc Financial Services Group, Inc. | 6.294 | 3,81 | 138 | 1,48 | ||||
| 2026-02-11 | 13F | Picton Mahoney Asset Management | 250.000 | 5.470 | ||||||
| 2026-02-17 | 13F | Water Island Capital Llc | 559.215 | 12.236 | ||||||
| 2026-02-17 | 13F | Russell Investments Group, Ltd. | 12.233 | -91,52 | 268 | -91,71 | ||||
| 2026-02-13 | 13F | Arrowstreet Capital, Limited Partnership | 48.035 | -80,94 | 1.051 | -81,33 | ||||
| 2026-02-13 | 13F | Toroso Investments, LLC | 12.831 | -11,71 | 281 | -13,58 | ||||
| 2026-02-10 | 13F | Envestnet Asset Management Inc | 25.504 | -20,67 | 558 | -22,18 | ||||
| 2026-02-09 | 13F | Geode Capital Management, Llc | 1.242.942 | 3,07 | 27.199 | 1,00 | ||||
| 2026-04-21 | 13F | Alpine Associates Management Inc. | 0 | -100,00 | 0 | |||||
| 2026-02-03 | 13F | Garner Asset Management Corp | 3.199 | 70 | ||||||
| 2026-02-11 | 13F | Longfellow Investment Management Co Llc | 73 | 2 | ||||||
| 2026-02-17 | 13F | Tudor Investment Corp Et Al | 26.963 | -79,10 | 590 | -79,55 | ||||
| 2026-02-05 | 13F | Td Private Client Wealth Llc | 8 | 0 | ||||||
| 2026-02-17 | 13F | FIL Ltd | 953.000 | 20.852 | ||||||
| 2026-02-06 | 13F | Larson Financial Group LLC | 99 | 12,50 | 2 | 100,00 | ||||
| 2026-02-17 | 13F | Tower Research Capital LLC (TRC) | 5.113 | 20,73 | 112 | 18,09 | ||||
| 2026-04-13 | 13F | IFP Advisors, Inc | 18 | 0,00 | 0 | |||||
| 2026-04-15 | 13F | Spirit Of America Management Corp/ny | 0 | -100,00 | 0 | |||||
| 2026-02-13 | 13F | Police & Firemen's Retirement System of New Jersey | 11.459 | 0,00 | 251 | -1,96 | ||||
| 2026-02-17 | 13F | Meteora Capital, LLC | 160.219 | 3.506 | ||||||
| 2026-02-17 | 13F | CastleKnight Management LP | 0 | -100,00 | 0 | |||||
| 2026-02-05 | 13F | GABELLI & Co INVESTMENT ADVISERS, INC. | 66.628 | 1.458 | ||||||
| 2026-02-17 | 13F | Bayberry Capital Partners LP | 0 | -100,00 | 0 | |||||
| 2026-01-26 | 13F | Private Trust Co Na | 101 | 2 | ||||||
| 2026-04-21 | 13F | PharVision Advisers, LLC | 0 | -100,00 | 0 | |||||
| 2026-02-13 | 13F | Parkside Financial Bank & Trust | 30 | 0,00 | 1 | |||||
| 2026-02-11 | 13F | Metis Global Partners, LLC | 10.541 | 231 | ||||||
| 2026-02-13 | 13F | Pinnacle Wealth Planning Services, Inc. | 14 | 0 | ||||||
| 2026-04-07 | 13F | CoreCap Advisors, LLC | 0 | -100,00 | 0 | |||||
| 2026-02-13 | 13F | Marshall Wace, Llp | 77.500 | 1.696 | ||||||
| 2026-01-30 | 13F | State of New Jersey Common Pension Fund D | 96.937 | -41,56 | 2.121 | -42,76 | ||||
| 2026-02-17 | 13F | Silvercrest Asset Management Group Llc | 23.379 | -96,95 | 512 | -97,02 | ||||
| 2026-02-12 | 13F | Groupe la Francaise | 600 | 0,00 | 13 | 0,00 | ||||
| 2026-02-13 | 13F | P Schoenfeld Asset Management Lp | 123.000 | -18,00 | 2.691 | -19,65 | ||||
| 2026-02-13 | 13F | Ubs Oconnor Llc | 0 | -100,00 | 0 | |||||
| 2026-02-12 | 13F | Chilton Capital Management Llc | 688 | 0,00 | 15 | 0,00 | ||||
| 2026-02-12 | 13F | Dimensional Fund Advisors Lp | 560.392 | 0,49 | 12.261 | -1,53 | ||||
| 2025-11-12 | 13F | Stifel Financial Corp | 0 | -100,00 | 0 | |||||
| 2026-04-01 | 13F | Pensionfund DSM Netherlands | 0 | -100,00 | 0 | |||||
| 2026-02-12 | 13F | Swiss National Bank | 74.700 | -5,68 | 1.634 | -7,58 | ||||
| 2026-01-28 | 13F | Peregrine Capital Management Llc | 0 | -100,00 | 0 | |||||
| 2026-01-27 | 13F | Zurcher Kantonalbank (Zurich Cantonalbank) | 29.236 | 163,13 | 640 | 157,66 | ||||
| 2026-02-12 | 13F | Nuveen, LLC | 77.278 | -66,83 | 1.691 | -67,51 | ||||
| 2026-01-26 | 13F | Cwm, Llc | 2.349 | 6,29 | 0 | |||||
| 2026-02-17 | 13F | Westwood Holdings Group Inc | 0 | -100,00 | 0 | |||||
| 2026-02-11 | 13F | Zions Bancorporation, National Association /ut/ | 91 | 2 | ||||||
| 2025-11-14 | 13F | Brookfield Asset Management Inc. | 0 | -100,00 | 0 | |||||
| 2026-02-03 | 13F | Ethic Inc. | 14.248 | -11,50 | 312 | -13,37 | ||||
| 2026-02-13 | 13F | SRS Capital Advisors, Inc. | 107 | -89,09 | 2 | -90,48 | ||||
| 2026-02-13 | 13F | Diametric Capital, LP | 0 | -100,00 | 0 | |||||
| 2026-01-21 | 13F | Westfuller Advisors, LLC | 48 | 0,00 | 1 | 0,00 | ||||
| 2026-02-17 | 13F | PenderFund Capital Management Ltd. | 8.000 | 175 | ||||||
| 2026-02-17 | 13F | Millennium Management Llc | Call | 0 | -100,00 | 0 | ||||
| 2026-02-17 | 13F | Ameriprise Financial Inc | 15.566 | -96,34 | 341 | -96,42 | ||||
| 2026-02-12 | 13F/A | Pinebridge Investments Llc | 21.421 | 469 | ||||||
| 2026-02-13 | 13F | Long Pond Capital, LP | 0 | -100,00 | 0 | |||||
| 2026-02-17 | 13F | Quantinno Capital Management LP | 51.428 | 24,06 | 1.125 | 21,62 | ||||
| 2026-02-10 | 13F | Thompson Siegel & Walmsley Llc | 0 | -100,00 | 0 | |||||
| 2026-02-13 | 13F | Fifth Lane Capital, Lp | 0 | -100,00 | 0 | |||||
| 2026-02-17 | 13F | Dark Forest Capital Management Lp | 43.851 | -40,54 | 959 | -41,74 | ||||
| 2026-02-10 | 13F | Bank of New York Mellon Corp | 250.105 | 20,56 | 5.472 | 18,13 | ||||
| 2025-11-14 | 13F | State of Tennessee, Treasury Department | 0 | -100,00 | 0 | |||||
| 2026-02-05 | 13F | Thrivent Financial For Lutherans | 0 | -100,00 | 0 | |||||
| 2026-02-13 | 13F | Meros Investment Management, LP | 0 | -100,00 | 0 | -100,00 | ||||
| 2026-02-13 | 13F | Bard Associates Inc | 563 | -97,32 | 12 | -97,47 | ||||
| 2026-02-11 | 13F | GW&K Investment Management, LLC | 0 | -100,00 | 0 | |||||
| 2026-02-17 | 13F | Schonfeld Strategic Advisors LLC | 547.698 | 11.984 | ||||||
| 2026-02-10 | 13F | Nomura Asset Management Co Ltd | 66.000 | 0,00 | 1.444 | -1,97 | ||||
| 2026-02-04 | 13F | LRI Investments, LLC | 0 | -100,00 | 0 | |||||
| 2026-02-13 | 13F | BNP Paribas Asset Management Holding S.A. | 365 | 0 | ||||||
| 2026-02-06 | 13F | Global Retirement Partners, LLC | 548 | 0,00 | 12 | -8,33 | ||||
| 2026-02-13 | 13F | Macquarie Group Ltd | 77.319 | -95,33 | 1.692 | -95,43 | ||||
| 2026-02-06 | 13F | Covestor Ltd | 11 | -99,56 | 0 | |||||
| 2026-01-29 | 13F | UBS Group AG | 284.291 | 248,68 | 6.220 | 241,76 | ||||
| 2026-02-17 | 13F | Alliancebernstein L.p. | 46.948 | 0,00 | 1.027 | -2,00 | ||||
| 2025-11-14 | 13F | PineBridge Investments, L.P. | 23.157 | 0,00 | 517 | 39,35 | ||||
| 2025-11-12 | 13F | Globeflex Capital L P | 0 | -100,00 | 0 | |||||
| 2026-01-27 | 13F | Tokio Marine Asset Management Co Ltd | 483.100 | 310,80 | 10.570 | 302,51 | ||||
| 2026-02-17 | 13F | Delaware Management Holdings, Inc. | 1.576.614 | 34.496 | ||||||
| 2026-02-17 | 13F | Moore Capital Management, Lp | 0 | -100,00 | 0 | |||||
| 2026-02-13 | 13F | Barclays Plc | 106.527 | -22,09 | 2.331 | -23,68 | ||||
| 2026-02-12 | 13F | New York State Common Retirement Fund | 14.144 | 0,00 | 309 | -1,90 | ||||
| 2026-02-14 | 13F | Rockefeller Capital Management L.P. | 8.808 | 69,61 | 193 | 66,96 | ||||
| 2026-02-17 | 13F | Citadel Advisors Llc | 53.518 | -13,58 | 1.171 | -15,34 | ||||
| 2026-02-13 | 13F | K2 Principal Fund, L.p. | 24.204 | -24,36 | 530 | -25,91 | ||||
| 2026-02-13 | 13F | Centiva Capital, LP | Put | 0 | -100,00 | 0 | ||||
| 2026-02-17 | 13F | ADAR1 Capital Management, LLC | 41.065 | 899 | ||||||
| 2026-01-28 | 13F | Universal- Beteiligungs- und Servicegesellschaft mbH | 32.933 | -27,39 | 721 | -28,85 | ||||
| 2025-11-14 | 13F | Raymond James Financial Inc | 0 | -100,00 | 0 | |||||
| 2026-01-30 | 13F | Keybank National Association/oh | 0 | -100,00 | 0 | |||||
| 2026-03-06 | 13F | Hsbc Holdings Plc | 0 | -100,00 | 0 | |||||
| 2026-04-24 | 13F | Strs Ohio | 0 | -100,00 | 0 | |||||
| 2026-02-17 | 13F | Guggenheim Capital Llc | 15.963 | 349 | ||||||
| 2026-02-12 | 13F | Jane Street Group, Llc | 46.170 | 1.010 | ||||||
| 2025-11-14 | 13F | Skopos Labs, Inc. | 0 | -100,00 | 0 | |||||
| 2026-02-13 | 13F | Ubs Asset Management Americas Inc | 277 | -99,42 | 6 | -99,43 | ||||
| 2026-02-17 | 13F | Fmr Llc | 71.044 | 33,79 | 1.554 | 31,14 | ||||
| 2026-02-17 | 13F | California State Teachers Retirement System | 37.783 | 0,09 | 827 | -1,90 | ||||
| 2026-02-17 | 13F | Price T Rowe Associates Inc /md/ | 23.945 | 6,93 | 1 | |||||
| 2026-02-17 | 13F | Twin Securities, Inc. | 0 | -100,00 | 0 | |||||
| 2026-02-13 | 13F | Public Employees Retirement Association Of Colorado | 11.805 | 0,00 | 0 | |||||
| 2026-02-17 | 13F | LMR Partners LLP | 90.000 | -66,78 | 1.969 | -67,45 | ||||
| 2026-02-13 | 13F | First Trust Advisors Lp | 169.135 | 8,62 | 3.701 | 6,41 | ||||
| 2025-11-14 | 13F | Sapience Investments, LLC | 0 | -100,00 | 0 | |||||
| 2026-02-03 | 13F | F/M Investments LLC | 0 | -100,00 | 0 | |||||
| 2026-02-13 | 13F | Caitong International Asset Management Co., Ltd | 9 | -98,72 | 0 | -100,00 | ||||
| 2025-12-18 | 13F | Danske Bank A/s | 0 | -100,00 | 0 | |||||
| 2026-02-19 | 13F | Invesco Ltd. | 99.647 | 14,86 | 2.180 | 12,55 | ||||
| 2026-01-29 | 13F | D.a. Davidson & Co. | 31.282 | -1,63 | 684 | -3,66 | ||||
| 2026-02-11 | 13F | Jpmorgan Chase & Co | 364.698 | -15,55 | 7.980 | -17,26 | ||||
| 2026-04-13 | 13F | Wolff Wiese Magana Llc | 0 | -100,00 | 0 | |||||
| 2026-02-06 | 13F | Resona Asset Management Co.,Ltd. | 18.526 | -5,75 | 406 | -7,11 | ||||
| 2026-02-13 | 13F | Wells Fargo & Company/mn | 48.799 | 50,27 | 1.068 | 47,17 | ||||
| 2026-02-13 | 13F | Soros Fund Management Llc | 313.225 | 6.853 | ||||||
| 2026-02-13 | 13F | Prudential Financial Inc | 0 | -100,00 | 0 | |||||
| 2025-11-14 | 13F | Worth Venture Partners, LLC | 0 | -100,00 | 0 | |||||
| 2026-02-17 | 13F | Jones Financial Companies Lllp | 1.016 | 30,59 | 22 | 29,41 | ||||
| 2026-02-17 | 13F | GeoWealth Management, LLC | 11.382 | -6,72 | 249 | -8,46 | ||||
| 2026-04-06 | 13F | Versant Capital Management, Inc | 0 | -100,00 | 0 | |||||
| 2026-02-17 | 13F | MIRAE ASSET GLOBAL ETFS HOLDINGS Ltd. | 19.546 | 2,50 | 428 | 0,47 | ||||
| 2025-11-12 | 13F | Neuberger Berman Group LLC | 0 | -100,00 | 0 | |||||
| 2026-02-13 | 13F | State Street Corp | 1.259.485 | -1,50 | 27.558 | -4,48 | ||||
| 2025-11-17 | 13F | Jacobs Levy Equity Management, Inc | 0 | -100,00 | 0 | |||||
| 2026-01-27 | 13F | Asset Management One Co., Ltd. | 59.570 | -0,89 | 1.305 | -2,83 | ||||
| 2026-01-27 | 13F | WealthCollab, LLC | 446 | 0,00 | 10 | 0,00 | ||||
| 2026-01-30 | 13F | Us Bancorp \de\ | 296 | 0,00 | 6 | 0,00 | ||||
| 2026-02-03 | 13F | Credit Industriel Et Commercial | 120.400 | 30.000,00 | 2.634 | 32.825,00 | ||||
| 2026-02-13 | 13F | Squarepoint Ops LLC | 407.038 | 8.906 | ||||||
| 2026-02-18 | 13F | Plotkin Financial Advisors, LLC | 0 | -100,00 | 0 | |||||
| 2025-10-29 | 13F | Consolidated Investment Group LLC | 0 | -100,00 | 0 | -100,00 | ||||
| 2026-02-09 | 13F | Legal & General Group Plc | 37.332 | -22,57 | 817 | -24,09 | ||||
| 2026-02-17 | 13F | Optiver Holding B.V. | 260 | 0,00 | 6 | 0,00 | ||||
| 2026-02-17 | 13F/A | Uniplan Investment Counsel, Inc. | 101.759 | -0,40 | 2.226 | -2,41 | ||||
| 2026-02-17 | 13F | Mercer Global Advisors Inc /adv | 23.025 | 62,42 | 504 | 59,18 | ||||
| 2026-02-17 | 13F | Vazirani Asset Management LLC | 0 | -100,00 | 0 | |||||
| 2026-02-11 | 13F | Simplex Trading, Llc | 0 | -100,00 | 0 | |||||
| 2026-02-17 | 13F | Cnh Partners Llc | 279.525 | 6.116 | ||||||
| 2026-02-06 | 13F | Gsa Capital Partners Llp | 114.898 | 3 | ||||||
| 2026-02-13 | 13F | Kennedy Capital Management, Inc. | 215.867 | 0,19 | 4.723 | -1,83 | ||||
| 2025-11-14 | 13F | ExodusPoint Capital Management, LP | 0 | -100,00 | 0 |