Grundlæggende statistik
| Institutionelle aktier (lange) | 194.263.984 - 77,99% (ex 13D/G) - change of -4,13MM shares -2,08% MRQ |
| Institutionel værdi (lang) | $ 6.222.208 USD ($1000) |
Institutionelt ejerskab og aktionærer
Open Text Corporation (US:OTEX) har 302 institutionelle ejere og aktionærer, der har indsendt 13D/G- eller 13F-formularer til Securities Exchange Commission (SEC). Disse institutioner har i alt 194,263,984 aktier. Største aktionærer omfatter 1832 Asset Management L.P., Jarislowsky, Fraser Ltd, FIL Ltd, Vanguard Group Inc, First Trust Advisors Lp, Brandes Investment Partners, Lp, Royal Bank Of Canada, Letko, Brosseau & Associates Inc, Beutel, Goodman & Co Ltd., and Guardian Capital Lp .
Open Text Corporation (NasdaqGS:OTEX) institutionel ejerskabsstruktur viser aktuelle positioner i virksomheden efter institutioner og fonde, samt seneste ændringer i positionsstørrelse. Større aktionærer kan omfatte individuelle investorer, investeringsforeninger, hedgefonde eller institutioner. Skema 13D angiver, at investoren besidder (eller besidder) mere end 5 % af virksomheden og har til hensigt (eller har til hensigt at) aktivt at forfølge en ændring i forretningsstrategi. Skema 13G indikerer en passiv investering på over 5%.
The share price as of April 17, 2026 is 23,47 / share. Previously, on April 21, 2025, the share price was 24,89 / share. This represents a decline of 5,71% over that period.

Fondens stemningsscore
Fund Sentiment Score (fka Ownership Accumulation Score) finder de aktier, der bliver mest købt af fonde. Det er resultatet af en sofistikeret, multi-faktor kvantitativ model, der identificerer virksomheder med de højeste niveauer af institutionel akkumulering. Scoringsmodellen bruger en kombination af den samlede stigning i oplyste ejere, ændringerne i porteføljeallokeringer i disse ejere og andre målinger. Tallet går fra 0 til 100, hvor højere tal indikerer et højere niveau af akkumulering for sine jævnaldrende, og 50 er gennemsnittet.
Opdateringsfrekvens: Dagligt
Se Ownership Explorer, som giver en liste over højest rangerende virksomheder.
AI+ Ask Fintel’s AI assistant about Open Text Corporation.
Select a question to share a public post with an AI-crafted answer.
Thinking of good questions…
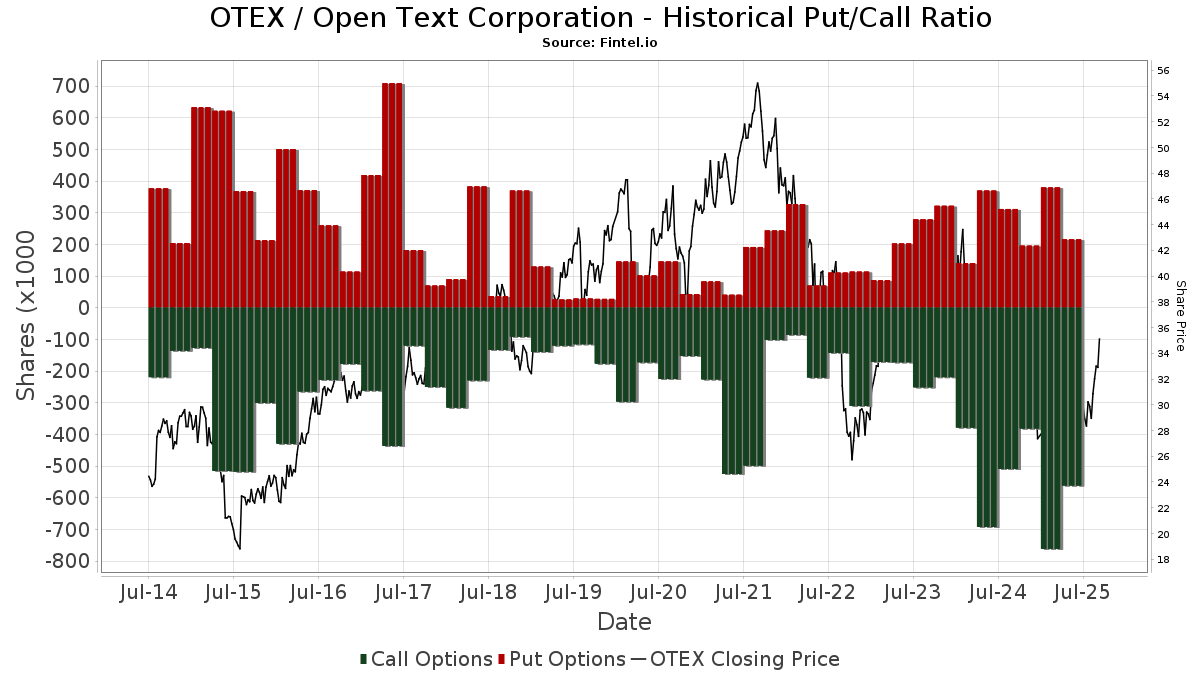
Institutionel Put/Call-forhold
Ud over at indberette standardaktie- og gældsudstedelser skal institutter med mere end 100 mill. aktiver under forvaltning også oplyse deres put- og call-optionsbeholdninger. Da salgsoptioner generelt indikerer negativ stemning, og købsoptioner indikerer positiv stemning, kan vi få en fornemmelse af den overordnede institutionelle stemning ved at plotte forholdet mellem put og kald. Diagrammet til højre viser det historiske put/call-forhold for dette instrument.
Brug af Put/Call Ratio som en indikator for investorernes stemning overvinder en af de vigtigste mangler ved at bruge totalt institutionelt ejerskab, som er, at en betydelig mængde af aktiver under forvaltning investeres passivt for at spore indekser. Passivt forvaltede fonde køber typisk ikke optioner, så indikatoren for put/call-forholdet følger mere nøje følelsen af aktivt forvaltede fonde.
13D/G-arkivering
Vi præsenterer 13D/G ansøgninger separat fra 13F ansøgninger på grund af den forskellige behandling af SEC. 13D/G-ansøgninger kan indgives af grupper af investorer (med én ledende), hvorimod 13F-ansøgninger ikke kan. Dette resulterer i situationer, hvor en investor kan indsende en 13D/G, der rapporterer én værdi for de samlede aktier (der repræsenterer alle de aktier, der ejes af investorgruppen), men derefter indsender en 13F, der rapporterer en anden værdi for de samlede aktier (der udelukkende repræsenterer deres egne) ejendomsret). Det betyder, at aktieejerskab af 13D/G-arkiver og 13F-arkiveringer ofte ikke er direkte sammenlignelige, så vi præsenterer dem separat.
Bemærk: Fra den 16. maj 2021 viser vi ikke længere ejere, der ikke har indsendt en 13D/G inden for det seneste år. Tidligere viste vi den fulde historie af 13D/G-arkiver. Generelt skal enheder, der er forpligtet til at indgive 13D/G-ansøgninger, indgive mindst årligt, før de indsender en afsluttende ansøgning. Dog forlader fonde nogle gange positioner uden at indsende en afsluttende ansøgning (dvs. de afvikler), så visning af den fulde historie resulterede nogle gange i forvirring om det nuværende ejerskab. For at undgå forvirring viser vi nu kun 'aktuelle' ejere - det vil sige - ejere, der har anmeldt inden for det seneste år.
Upgrade to unlock premium data.
| Fil dato | Form | Investor | Forrige Aktier |
Seneste Aktier |
Δ Aktier (Procent) |
Ejendomsret (Procent) |
Δ Ejerskab (Procent) |
|
|---|---|---|---|---|---|---|---|---|
| 2026-01-21 | BlackRock, Inc. | 16,705,085 | 18,146,281 | 8.63 | 7.20 | 16.13 | ||
| 2025-10-07 | 1832 Asset Management L.P. | 20,626,538 | 21,150,154 | 2.54 | 8.36 | 6.55 |
13F og NPORT arkivering
Detaljer om 13F-arkivering er gratis. Detaljer om NP-ansøgninger kræver et premium-medlemskab. Grønne rækker angiver nye positioner. Røde rækker angiver lukkede positioner. Klik på linket ikon for at se den fulde transaktionshistorik.
Opgrader
for at låse premium-data op og eksportere til Excel ![]() .
.
| Fil dato | Kilde | Investor | Type | Gennemsnitlig pris (Øst) |
Aktier | Δ Aktier (%) |
Rapporteret Værdi ($1000) |
Δ Værdi (%) |
Port Alloc (%) |
|
|---|---|---|---|---|---|---|---|---|---|---|
| 2026-02-17 | 13F | Susquehanna International Group, Llp | Put | 17.300 | 564 | |||||
| 2026-02-17 | 13F | Susquehanna International Group, Llp | Call | 45.700 | -17,36 | 1.489 | -28,01 | |||
| 2026-02-17 | 13F | Ameriprise Financial Inc | 5.416 | -95,10 | 239 | -94,32 | ||||
| 2026-02-17 | 13F | Susquehanna International Group, Llp | 14.032 | -72,45 | 457 | -75,99 | ||||
| 2026-02-24 | 13F/A | Pacer Advisors, Inc. | 165.017 | 17.817,16 | 5.374 | 15.705,88 | ||||
| 2026-01-28 | 13F | WPG Advisers, LLC | 806 | -0,25 | 26 | -13,33 | ||||
| 2026-02-13 | 13F | Kestra Advisory Services, LLC | 635 | 21 | ||||||
| 2026-02-10 | 13F | Easterly Investment Partners Llc | 461.667 | -0,18 | 15.041 | -13,00 | ||||
| 2025-11-12 | 13F | Transce3nd, LLC | 0 | -100,00 | 0 | |||||
| 2026-02-10 | 13F | Td Asset Management Inc | 2.559.128 | 19,14 | 83.453 | 3,92 | ||||
| 2026-02-13 | 13F | USS Investment Management Ltd | 46.440 | 1,66 | 1.517 | -11,29 | ||||
| 2026-02-17 | 13F | Lighthouse Investment Partners, LLC | 7.472 | 243 | ||||||
| 2025-11-13 | 13F | Twin Tree Management, LP | 0 | -100,00 | 0 | -100,00 | ||||
| 2026-02-09 | 13F | Mondrian Investment Partners LTD | 587 | 0,00 | 26 | -13,33 | ||||
| 2025-11-07 | 13F | M&G Plc | 0 | -100,00 | 0 | -100,00 | ||||
| 2026-02-18 | 13F | GWM Advisors LLC | 22.794 | -1,04 | 743 | -13,72 | ||||
| 2025-11-14 | 13F | Gluskin Sheff & Assoc Inc | 0 | -100,00 | 0 | -100,00 | ||||
| 2026-02-17 | 13F | State Of Wisconsin Investment Board | 149.649 | 4.880 | ||||||
| 2026-04-14 | 13F | Nbc Securities, Inc. | 10.924 | -5,07 | 243 | -35,29 | ||||
| 2026-01-14 | 13F | Jfs Wealth Advisors, Llc | 75 | 59,57 | 2 | 100,00 | ||||
| 2026-04-20 | 13F | Kestra Private Wealth Services, Llc | 0 | -100,00 | 0 | |||||
| 2026-02-17 | 13F | SIG North Trading, ULC | Call | 124.500 | -51,29 | 4.056 | -57,55 | |||
| 2026-02-11 | 13F | Permit Capital, LLC | 310.000 | 0,00 | 10.100 | -12,84 | ||||
| 2026-02-19 | 13F | Invesco Ltd. | 2.234.488 | -11,36 | 72.800 | -22,74 | ||||
| 2026-01-22 | 13F | Massachusetts Financial Services Co /ma/ | 25.106 | -1,92 | 818 | -14,54 | ||||
| 2026-02-11 | 13F | CLARET ASSET MANAGEMENT Corp | 35.369 | -0,18 | 1 | 0,00 | ||||
| 2026-02-13 | 13F | MAI Capital Management | 1.670 | 3,86 | 54 | -10,00 | ||||
| 2025-11-13 | 13F | Acadian Asset Management Llc | 0 | -100,00 | 0 | |||||
| 2026-02-06 | 13F | Bare Financial Services, Inc | 36 | 0,00 | 1 | 0,00 | ||||
| 2026-01-30 | 13F | CBOE Vest Financial, LLC | 27.547 | 56,38 | 897 | 36,32 | ||||
| 2026-02-09 | 13F | Cooke & Bieler Lp | 1.202.951 | -71,89 | 39.192 | -75,50 | ||||
| 2026-02-13 | 13F | Quartz Partners, LLC | 117.252 | 5,34 | 3.820 | -8,17 | ||||
| 2026-02-13 | 13F | Centiva Capital, LP | 15.788 | 514 | ||||||
| 2026-02-06 | 13F | Kimelman & Baird, LLC | 1.200 | 0,00 | 39 | -11,36 | ||||
| 2026-01-28 | 13F | DekaBank Deutsche Girozentrale | 91.783 | 0,00 | 4 | 0,00 | ||||
| 2026-01-30 | 13F | Mitsubishi UFJ Trust & Banking Corp | 93.300 | -60,30 | 3.002 | -65,82 | ||||
| 2025-10-22 | 13F | McIlrath & Eck, LLC | 0 | -100,00 | 0 | -100,00 | ||||
| 2026-01-29 | 13F | Montrusco Bolton Investments Inc. | 218.938 | 7.140 | ||||||
| 2026-02-12 | 13F | Alps Advisors Inc | 25.394 | 2,94 | 827 | -10,30 | ||||
| 2026-01-20 | 13F | Cromwell Holdings LLC | 1.635 | 0,00 | 53 | -13,11 | ||||
| 2026-02-17 | 13F | Public Employees Retirement System Of Ohio | 41.711 | -55,97 | 1.359 | -61,62 | ||||
| 2026-04-14 | 13F | Tradewinds Capital Management, LLC | 0 | -100,00 | 0 | |||||
| 2026-02-13 | 13F | Mariner, LLC | 23.873 | 8,49 | 778 | -5,35 | ||||
| 2026-02-18 | 13F | Beacon Pointe Advisors, LLC | 65.615 | 0,01 | 2.138 | -12,85 | ||||
| 2026-02-12 | 13F | Aristides Capital LLC | 7.031 | -17,85 | 229 | -28,21 | ||||
| 2026-02-17 | 13F | Advisory Services Network, LLC | 0 | -100,00 | 0 | |||||
| 2026-02-13 | 13F | Manufacturers Life Insurance Company, The | 0 | -100,00 | 0 | |||||
| 2026-02-13 | 13F | Walleye Trading LLC | Put | 8.400 | -22,94 | 274 | -32,92 | |||
| 2026-02-13 | 13F | Victory Capital Management Inc | 20.610 | 16,26 | 671 | 1,36 | ||||
| 2026-02-13 | 13F | Virtus ETF Advisers LLC | 0 | -100,00 | 0 | -100,00 | ||||
| 2026-02-13 | 13F | Walleye Trading LLC | Call | 7.300 | -48,23 | 238 | -55,03 | |||
| 2026-02-03 | 13F | Mitsubishi UFJ Kokusai Asset Management Co., Ltd. | 40.256 | 38,57 | 1.278 | 17,70 | ||||
| 2026-01-27 | 13F | Lorne Steinberg Wealth Management Inc. | 194.613 | 0,71 | 6.347 | -12,11 | ||||
| 2026-02-13 | 13F | 1832 Asset Management L.P. | 23.592.987 | 547,39 | 768.660 | 464,26 | ||||
| 2026-02-12 | 13F | Wealthspire Advisors, LLC | 0 | -100,00 | 0 | |||||
| 2026-02-13 | 13F | Transamerica Financial Advisors, Inc. | 430 | 14 | ||||||
| 2026-04-10 | 13F | Henry James International Management Inc. | 110.288 | 0,00 | 2.453 | -31,76 | ||||
| 2026-02-13 | 13F | Y-Intercept (Hong Kong) Ltd | 51.431 | 1.676 | ||||||
| 2025-11-14 | 13F | Axa S.a. | 0 | -100,00 | 0 | -100,00 | ||||
| 2026-04-13 | 13F | Salem Investment Counselors Inc | 13 | 0 | ||||||
| 2026-02-17 | 13F | Polar Capital Holdings Plc | 280.780 | -33,53 | 8.168 | -58,34 | ||||
| 2026-04-02 | 13F | Byrne Asset Management LLC | 4.337 | 19,41 | 96 | -18,64 | ||||
| 2026-01-22 | 13F | Pinnacle Bancorp, Inc. | 305 | 0,00 | 10 | -18,18 | ||||
| 2026-04-06 | 13F | Versant Capital Management, Inc | 977 | -49,87 | 22 | -66,67 | ||||
| 2026-02-13 | 13F | Royal London Asset Management Ltd | 10.806 | 0,00 | 352 | -12,66 | ||||
| 2026-02-17 | 13F | Susquehanna Advisors Group, Inc. | 0 | -100,00 | 0 | |||||
| 2026-02-12 | 13F | Campbell & CO Investment Adviser LLC | 151.665 | 4.941 | ||||||
| 2026-02-13 | 13F | Korea Investment CORP | 236.844 | 169,01 | 7.723 | 134,67 | ||||
| 2026-01-29 | 13F | UBS Group AG | 662.567 | 61,32 | 21.586 | 40,61 | ||||
| 2026-04-10 | 13F | RTD Financial Advisors, Inc. | 11.644 | -32,35 | 259 | -53,93 | ||||
| 2026-02-23 | 13F | Beaird Harris Wealth Management, LLC | 618 | 0,00 | 20 | -13,04 | ||||
| 2026-04-13 | 13F | Wedge Capital Management L L P/nc | 136.231 | 13,94 | 3.030 | -22,23 | ||||
| 2026-02-02 | 13F | Montag A & Associates Inc | 279 | 0,00 | 9 | -10,00 | ||||
| 2026-02-12 | 13F | CIBC Private Wealth Group, LLC | 0 | -100,00 | 0 | |||||
| 2026-02-13 | 13F | Rhumbline Advisers | 1.358 | -2,16 | 44 | -13,73 | ||||
| 2026-04-03 | 13F | Ridgewood Investments LLC | 46.791 | 150,92 | 1.041 | 49,21 | ||||
| 2026-02-09 | 13F | Huntington National Bank | 1 | 0,00 | 0 | |||||
| 2026-02-13 | 13F | SRS Capital Advisors, Inc. | 467 | 285,95 | 15 | 275,00 | ||||
| 2025-11-12 | 13F | Heron Bay Capital Management | 0 | -100,00 | 0 | -100,00 | ||||
| 2026-02-12 | 13F | Pembroke Management, LTD | 19.733 | 882 | ||||||
| 2026-02-11 | 13F | Allianz Asset Management GmbH | 106.343 | 12,64 | 3.468 | -1,76 | ||||
| 2026-02-13 | 13F | Natixis | 7.676 | -3,56 | 250 | -15,82 | ||||
| 2026-02-11 | 13F | Clearbridge Investments, LLC | 2.444.296 | -2,96 | 79.635 | -15,42 | ||||
| 2026-02-17 | 13F | Creative Planning | 48.890 | 6,00 | 1.593 | -7,66 | ||||
| 2026-02-10 | 13F | CIBC Asset Management Inc | 256.156 | -6,47 | 8.350 | -18,37 | ||||
| 2026-02-10 | 13F | Root Financial Partners, LLC | 14 | -17,65 | 0 | |||||
| 2025-11-12 | 13F | NewSquare Capital LLC | 0 | -100,00 | 0 | |||||
| 2026-02-11 | 13F | Simplex Trading, Llc | Put | 7.300 | -10,98 | 238 | ||||
| 2026-02-11 | 13F | Simplex Trading, Llc | Call | 3.900 | 8,33 | 127 | ||||
| 2026-02-13 | 13F | Beutel, Goodman & Co Ltd. | 5.567.797 | -7,43 | 182 | -19,20 | ||||
| 2026-02-17 | 13F | Toronto Dominion Bank | 782.461 | 50,38 | 25.484 | 30,84 | ||||
| 2026-02-17 | 13F | Toronto Dominion Bank | Call | 4.100 | -14,58 | 134 | -25,70 | |||
| 2026-02-17 | 13F | Toronto Dominion Bank | Put | 1.900 | -9,52 | 62 | -21,79 | |||
| 2025-11-04 | 13F | Oakworth Capital, Inc. | 0 | -100,00 | 0 | |||||
| 2026-02-11 | 13F | Metis Global Partners, LLC | 10.080 | -22,02 | 328 | -32,09 | ||||
| 2026-02-17 | 13F | Janus Henderson Group Plc | 24.062 | 37,01 | 787 | 19,63 | ||||
| 2026-02-06 | 13F | Bristol Gate Capital Partners Inc. | 0 | -100,00 | 0 | |||||
| 2026-04-09 | 13F | Pacifica Partners Inc. | 0 | -100,00 | 0 | |||||
| 2026-02-06 | 13F | Cullen/frost Bankers, Inc. | 121 | 0,00 | 4 | -25,00 | ||||
| 2026-02-17 | 13F | Aqr Capital Management Llc | 626.495 | 7.951,60 | 20.404 | 6.935,52 | ||||
| 2026-02-13 | 13F | Stifel Financial Corp | 103.244 | 10,00 | 3.364 | -4,13 | ||||
| 2026-02-11 | 13F | Picton Mahoney Asset Management | 35.243 | -88,71 | 1.149 | 10.345,45 | ||||
| 2026-02-03 | 13F | Crossmark Global Holdings, Inc. | 351.765 | -2,68 | 11.461 | -15,18 | ||||
| 2025-10-28 | 13F | Arlington Trust Co LLC | 0 | -100,00 | 0 | |||||
| 2026-02-17 | 13F | Millennium Management Llc | 8.952 | -85,30 | 292 | -87,21 | ||||
| 2026-02-13 | 13F | Charles Schwab Investment Management Inc | 764.010 | -0,08 | 24.914 | -12,85 | ||||
| 2026-01-12 | 13F | CVA Family Office, LLC | 0 | -100,00 | 0 | |||||
| 2026-02-13 | 13F/A | Ontario Teachers Pension Plan Board | 0 | -100,00 | 0 | -100,00 | ||||
| 2026-01-23 | 13F | Assetmark, Inc | 1 | 0,00 | 0 | |||||
| 2026-02-03 | 13F | Sequoia Financial Advisors, LLC | 14.131 | -2,13 | 460 | -14,66 | ||||
| 2026-02-17 | 13F | Susquehanna Fundamental Investments, Llc | 0 | -100,00 | 0 | |||||
| 2026-02-17 | 13F | DZ BANK AG Deutsche Zentral Genossenschafts Bank, Frankfurt am Main | 154.670 | -29,72 | 5.039 | -38,74 | ||||
| 2026-02-17 | 13F | Gotham Asset Management, LLC | 62.239 | 32,48 | 2.028 | 15,43 | ||||
| 2026-02-05 | 13F | Td Private Client Wealth Llc | 27 | 1 | ||||||
| 2026-04-13 | 13F | True Wealth Design, LLC | 55 | 14,58 | 1 | 0,00 | ||||
| 2026-02-04 | 13F | Plato Investment Management Ltd | 2.845 | 0,00 | 93 | -11,43 | ||||
| 2026-02-13 | 13F | Sei Investments Co | 173.552 | -27,17 | 5.654 | -36,52 | ||||
| 2026-01-29 | 13F | IMC-Chicago, LLC | Call | 0 | -100,00 | 0 | ||||
| 2026-02-10 | 13F | Savant Capital, LLC | 0 | -100,00 | 0 | |||||
| 2026-02-17 | 13F | Investment Management Corp of Ontario | 156.603 | 17,02 | 5.102 | 2,00 | ||||
| 2026-02-04 | 13F | Asahi Life Asset Management Co., Ltd. | 0 | -100,00 | 0 | |||||
| 2026-02-13 | 13F | Morgan Stanley | 2.884.381 | 76,85 | 93.973 | 54,14 | ||||
| 2026-02-12 | 13F | Callan Family Office, LLC | 22.990 | 749 | ||||||
| 2026-02-18 | 13F | Guardian Capital Lp | 3.715.835 | -9,83 | 121.071 | -21,42 | ||||
| 2026-02-02 | 13F | Cornerstone Planning Group LLC | 49 | 250,00 | 1 | |||||
| 2026-02-02 | 13F | Danske Bank A/s | 1.955 | 64 | ||||||
| 2026-02-04 | 13F | Swiss Life Asset Management Ltd | 136.381 | 2,26 | 4.443 | -10,94 | ||||
| 2026-02-12 | 13F | Federation des caisses Desjardins du Quebec | 1.490.593 | -14,37 | 48.521 | -25,12 | ||||
| 2026-02-05 | 13F | Bessemer Group Inc | 56.892 | 0,00 | 2 | -50,00 | ||||
| 2026-02-11 | 13F | Letko, Brosseau & Associates Inc | 5.681.093 | 0,49 | 185.260 | -12,35 | ||||
| 2026-02-13 | 13F | National Bank Of Canada /fi/ | Call | 178 | 20,27 | 580 | 4,70 | |||
| 2026-02-05 | 13F | AustralianSuper Pty Ltd | 527.346 | 13,26 | 17.174 | -1,30 | ||||
| 2026-02-10 | 13F | Jupiter Asset Management Ltd | 60.523 | 1.974 | ||||||
| 2025-11-14 | 13F | Strategic Wealth Partners, Ltd. | 465 | 0,00 | 17 | 30,77 | ||||
| 2026-03-04 | 13F | Leonteq Securities AG | 0 | -100,00 | 0 | |||||
| 2026-02-12 | 13F | Jane Street Group, Llc | 46.221 | 339,15 | 1.506 | 282,95 | ||||
| 2026-02-13 | 13F | National Bank Of Canada /fi/ | Put | 9 | -81,63 | 29 | -84,15 | |||
| 2026-01-29 | 13F | Vanguard Group Inc | 11.613.952 | -0,64 | 378.232 | -13,43 | ||||
| 2026-02-12 | 13F | Mark Sheptoff Financial Planning, Llc | 800 | 0,00 | 26 | -10,34 | ||||
| 2026-02-10 | 13F | Connor, Clark & Lunn Investment Management Ltd. | 2.332.948 | 0,87 | 75.979 | -12,09 | ||||
| 2026-04-16 | 13F | Evolve Private Wealth, Llc | 42.784 | 11,20 | 952 | -24,10 | ||||
| 2026-02-11 | 13F | Brandes Investment Partners, Lp | 9.106.157 | 1,19 | 296.679 | -11,81 | ||||
| 2026-02-13 | 13F | Bank Of Nova Scotia | 767.297 | -4,18 | 24.988 | -16,55 | ||||
| 2026-02-17 | 13F | Royal Bank Of Canada | 8.878.109 | -14,01 | 289.249 | -25,05 | ||||
| 2026-01-16 | 13F | Louisbourg Investments Inc. | 110 | 0,00 | 4 | -25,00 | ||||
| 2026-02-12 | 13F | Northwest & Ethical Investments L.P. | 252.358 | 1,87 | 8.219 | -11,30 | ||||
| 2026-02-05 | 13F | Baader Bank INC | 13.210 | 430 | ||||||
| 2026-02-10 | 13F | Godfrey Financial Associates, Inc. | 1 | 0 | ||||||
| 2026-02-12 | 13F | Aviva Plc | 215.394 | 4,54 | 7.020 | -8,76 | ||||
| 2026-02-13 | 13F | Kayne Anderson Rudnick Investment Management Llc | 39 | 0,00 | 1 | 0,00 | ||||
| 2026-02-11 | 13F | Winnow Wealth Llc | 480 | 0,00 | 16 | -16,67 | ||||
| 2026-02-17 | 13F | Advisor Group Holdings, Inc. | 2.758 | 56,79 | 90 | 43,55 | ||||
| 2026-02-17 | 13F | Tower Research Capital LLC (TRC) | 17.876 | 272,26 | 582 | 225,14 | ||||
| 2026-01-29 | 13F | IMC-Chicago, LLC | Put | 0 | -100,00 | 0 | ||||
| 2026-02-05 | 13F | Allworth Financial LP | 2.812 | 3,12 | 92 | -9,90 | ||||
| 2026-02-10 | 13F | Nomura Asset Management Co Ltd | 0 | 0 | ||||||
| 2026-04-13 | 13F | Massmutual Trust Co Fsb/adv | 1.126 | 45,29 | 25 | 0,00 | ||||
| 2026-02-17 | 13F | Armistice Capital, Llc | 7.335 | 239 | ||||||
| 2026-02-13 | 13F | Pinnacle Wealth Planning Services, Inc. | 444 | 14 | ||||||
| 2026-01-27 | 13F | Zurcher Kantonalbank (Zurich Cantonalbank) | 226.232 | 7.377 | ||||||
| 2026-02-13 | 13F | Prudential Financial Inc | 40.530 | 207,05 | 1.322 | 167,95 | ||||
| 2026-02-17 | 13F | SIG North Trading, ULC | Put | 0 | -100,00 | 0 | ||||
| 2026-04-02 | 13F | Ares Financial Consulting, LLC | 18 | 0,00 | 0 | |||||
| 2026-01-27 | 13F | WealthCollab, LLC | 1.640 | 0,00 | 53 | -13,11 | ||||
| 2026-02-11 | 13F | Simplex Trading, Llc | 0 | -100,00 | 0 | |||||
| 2026-01-26 | 13F | Cwm, Llc | 394 | -2,72 | 0 | |||||
| 2026-02-13 | 13F | Aviso Financial Inc. | 0 | -100,00 | 0 | |||||
| 2026-02-17 | 13F | Wellington Management Group Llp | 389.247 | 25,88 | 12.693 | 9,79 | ||||
| 2026-01-23 | 13F | Dara Capital Us, Inc. | 2.720 | 89 | ||||||
| 2026-02-13 | 13F | Police & Firemen's Retirement System of New Jersey | 33.807 | -10,04 | 1.102 | -21,57 | ||||
| 2026-02-10 | 13F | Bank of New York Mellon Corp | 504.551 | -2,68 | 16.438 | -15,17 | ||||
| 2026-01-21 | 13F | Nexus Investment Management ULC | 0 | -100,00 | 0 | |||||
| 2026-02-13 | 13F | Arkadios Wealth Advisors | 85.071 | 2,26 | 2.772 | -10,87 | ||||
| 2026-02-09 | 13F | Geode Capital Management, Llc | 2.680.546 | 5,68 | 88.929 | -7,37 | ||||
| 2026-02-06 | 13F | Covestor Ltd | 1.324 | 3,44 | 0 | |||||
| 2026-02-13 | 13F | Caitong International Asset Management Co., Ltd | 0 | -100,00 | 0 | |||||
| 2025-11-07 | 13F | Sierra Ocean, Llc | 0 | -100,00 | 0 | |||||
| 2026-02-10 | 13F | Bridges Investment Management Inc | 19.620 | -53,61 | 639 | -59,56 | ||||
| 2026-02-12 | 13F | Swiss National Bank | 670.500 | -9,15 | 21.881 | -20,72 | ||||
| 2026-02-05 | 13F | Atria Investments Llc | 9.651 | -0,20 | 314 | -13,02 | ||||
| 2026-04-13 | 13F | IFP Advisors, Inc | 14.089 | 265,19 | 313 | 150,40 | ||||
| 2026-02-12 | 13F | Skandinaviska Enskilda Banken AB (publ) | 36.557 | -14,38 | 1.191 | -25,33 | ||||
| 2026-02-10 | 13F | Scheer, Rowlett & Associates Investment Management Ltd. | 279.352 | -36,66 | 9.098 | -44,81 | ||||
| 2026-02-12 | 13F | Brown Brothers Harriman & Co | 0 | -100,00 | 0 | |||||
| 2026-02-17 | 13F | Guardian Partners Inc. | 0 | -100,00 | 0 | |||||
| 2026-04-09 | 13F | Nelson, Van Denburg & Campbell Wealth Management Group, LLC | 0 | -100,00 | 0 | |||||
| 2026-02-17 | 13F | Raymond James Financial Inc | 89.757 | -23,98 | 2.924 | -33,74 | ||||
| 2026-02-12 | 13F | Andra AP-fonden | 5.600 | 250 | ||||||
| 2026-02-11 | 13F | O'shaughnessy Asset Management, Llc | 65.495 | 2,76 | 2.133 | -10,42 | ||||
| 2026-02-17 | 13F | Canada Pension Plan Investment Board | 1.817.679 | 49,02 | 59.198 | 29,87 | ||||
| 2026-02-11 | 13F | Spark Investment Management LLC | 54.000 | 1.759 | ||||||
| 2026-02-13 | 13F | First Trust Advisors Lp | 11.493.714 | 27,32 | 374.394 | 10,95 | ||||
| 2026-02-17 | 13F | Ancora Advisors, LLC | 13 | 0 | ||||||
| 2026-01-16 | 13F | Empirical Financial Services, LLC d.b.a. Empirical Wealth Management | 6.403 | -56,01 | 209 | -61,76 | ||||
| 2025-11-14 | 13F | Squarepoint Ops LLC | 0 | -100,00 | 0 | |||||
| 2026-02-12 | 13F | Groupe la Francaise | 1.114 | 0,00 | 36 | -12,20 | ||||
| 2026-02-17 | 13F | Amundi | 1.053.722 | 7,99 | 34.330 | -8,14 | ||||
| 2026-02-05 | 13F | Arbejdsmarkedets Tillaegspension | 698.258 | 22.749 | ||||||
| 2026-02-13 | 13F | Ubs Asset Management Americas Inc | 246 | 8 | ||||||
| 2026-02-12 | 13F | Bank Of Nova Scotia Trust Co | 50.069 | 67,68 | 1.631 | 46,15 | ||||
| 2026-02-17 | 13F | AYAL Capital Advisors Ltd | Call | 0 | -100,00 | 0 | ||||
| 2026-02-12 | 13F | Nuveen, LLC | 176.935 | -1,16 | 5.770 | -13,79 | ||||
| 2026-02-11 | 13F | Vise Technologies, Inc. | 8.860 | 1,82 | 289 | -11,38 | ||||
| 2026-02-13 | 13F | Centaurus Financial, Inc. | 3.609 | 2,70 | 0 | |||||
| 2026-02-13 | 13F | National Bank Of Canada /fi/ | 2.804.072 | 10,45 | 90.977 | -3,52 | ||||
| 2026-01-28 | 13F | Geneos Wealth Management Inc. | 32 | 0,00 | 1 | 0,00 | ||||
| 2026-02-11 | 13F | Westerkirk Capital Inc. | 700 | -93,58 | 23 | -94,59 | ||||
| 2026-02-13 | 13F | Destination Wealth Management | 8.300 | 270 | ||||||
| 2026-02-17 | 13F | Parvin Asset Management, LLC | 26.840 | 577,78 | 874 | 490,54 | ||||
| 2025-11-14 | 13F/A | Skopos Labs, Inc. | 0 | -100,00 | 0 | -100,00 | ||||
| 2026-01-14 | 13F | Net Worth Advisory Group | 9.308 | -1,53 | 303 | -14,16 | ||||
| 2026-02-12 | 13F | UniSuper Management Pty Ltd | 4.500 | 0,00 | 201 | -14,10 | ||||
| 2026-02-17 | 13F | Lazard Asset Management Llc | 50.761 | 1.654 | ||||||
| 2026-02-17 | 13F | Engineers Gate Manager LP | 13.480 | 78,80 | 439 | 56,23 | ||||
| 2026-01-15 | 13F | Mn Services Vermogensbeheer B.V. | 99.268 | 2,93 | 3 | 0,00 | ||||
| 2026-02-12 | 13F | Jane Street Group, Llc | Call | 0 | -100,00 | 0 | -100,00 | |||
| 2026-02-13 | 13F | Turtle Creek Asset Management Inc. | 29.410 | -44,68 | 958 | -51,79 | ||||
| 2026-01-30 | 13F | Us Bancorp \de\ | 6.055 | -0,54 | 197 | -13,22 | ||||
| 2026-02-12 | 13F | Advisors Asset Management, Inc. | 15.868 | 19,33 | 517 | 3,82 | ||||
| 2026-02-13 | 13F | Walleye Capital LLC | Call | 0 | -100,00 | 0 | ||||
| 2026-02-13 | 13F | Healthcare Of Ontario Pension Plan Trust Fund | 0 | -100,00 | 0 | |||||
| 2026-02-18 | 13F | State of Tennessee, Treasury Department | 147.862 | 0,40 | 3.798 | -31,04 | ||||
| 2026-02-13 | 13F | Headlands Technologies LLC | 13.442 | -54,08 | 438 | -60,05 | ||||
| 2026-02-13 | 13F | JustInvest LLC | 23.338 | -5,10 | 760 | -17,30 | ||||
| 2026-02-12 | 13F | Quadrant Capital Group Llc | 161 | 0,00 | 5 | -16,67 | ||||
| 2026-04-08 | 13F | Birchbrook, Inc. | 81 | 0,00 | 2 | -50,00 | ||||
| 2026-02-10 | 13F | State of Wyoming | 1.739 | -71,07 | 57 | -75,00 | ||||
| 2026-02-10 | 13F | Norges Bank | 3.276.237 | 106.700 | ||||||
| 2026-01-09 | 13F | SG Americas Securities, LLC | 0 | -100,00 | 0 | |||||
| 2026-02-13 | 13F | Barclays Plc | 1.854 | 55,54 | 60 | 36,36 | ||||
| 2025-11-14 | 13F | SIG North Trading, ULC | 0 | -100,00 | 0 | -100,00 | ||||
| 2026-04-20 | 13F | Assenagon Asset Management S.A. | 21.116 | 31,89 | 469 | -10,15 | ||||
| 2026-02-13 | 13F | Umb Bank N A/mo | 161 | 21,97 | 5 | 25,00 | ||||
| 2026-02-17 | 13F | Private Advisor Group, LLC | 7.017 | -2,13 | 229 | -14,93 | ||||
| 2026-02-13 | 13F | Dixon Mitchell Investment Counsel Inc. | 260 | 79,31 | 8 | 60,00 | ||||
| 2026-02-03 | 13F | SBI Securities Co., Ltd. | 371 | 15,94 | 12 | 9,09 | ||||
| 2026-02-17 | 13F | Glenmede Trust Co Na | 6.578 | -25,58 | 214 | -4,04 | ||||
| 2026-02-10 | 13F | CIBC World Markets Inc. | Call | 0 | -100,00 | 0 | -100,00 | |||
| 2026-01-29 | 13F | Sanctuary Advisors, LLC | 27.811 | 3,76 | 906 | -9,49 | ||||
| 2026-02-09 | 13F | Legal & General Group Plc | 2.239.803 | 1,31 | 73.040 | -11,63 | ||||
| 2026-02-17 | 13F | Fmr Llc | 894.841 | -64,08 | 29.142 | -68,70 | ||||
| 2025-11-14 | 13F | Jain Global LLC | 0 | -100,00 | 0 | -100,00 | ||||
| 2026-02-12 | 13F | New South Capital Management Inc | 2.324.899 | -0,81 | 75.745 | -13,54 | ||||
| 2026-01-15 | 13F | Nisa Investment Advisors, Llc | 12 | 0 | ||||||
| 2026-02-10 | 13F | Bruce G. Allen Investments, LLC | 52 | 0,00 | 2 | 0,00 | ||||
| 2025-11-14 | 13F | Atom Investors LP | 0 | -100,00 | 0 | |||||
| 2026-02-17 | 13F | XTX Topco Ltd | 33.222 | -10,84 | 1.082 | -22,27 | ||||
| 2025-11-14 | 13F | Harris Associates L P | 0 | -100,00 | 0 | |||||
| 2026-02-17 | 13F | Jones Financial Companies Lllp | 689 | 310,12 | 22 | 266,67 | ||||
| 2026-02-18 | 13F | Mackenzie Financial Corp | 2.556.252 | -5,35 | 84.172 | -16,60 | ||||
| 2026-02-10 | 13F | Forsta Ap-fonden | 63.600 | 6,18 | 2.074 | -7,41 | ||||
| 2025-11-17 | 13F | FSA Wealth Management LLC | 67 | 0,00 | 3 | 100,00 | ||||
| 2026-02-13 | 13F | Great West Life Assurance Co /can/ | 185.859 | -7,43 | 6 | -14,29 | ||||
| 2026-02-10 | 13F | CIBC World Markets Inc. | 2.274.416 | 2,22 | 74.078 | -10,91 | ||||
| 2026-02-17 | 13F | Mangrove Partners | 993.199 | -5,60 | 32.352 | -17,75 | ||||
| 2026-02-12 | 13F | Principal Securities, Inc. | 0 | -100,00 | 0 | -100,00 | ||||
| 2026-02-24 | 13F | DGS Capital Management, LLC | 39.714 | 8,17 | 1.294 | -5,76 | ||||
| 2026-02-14 | 13F | Rockefeller Capital Management L.P. | 97 | 120,45 | 3 | 200,00 | ||||
| 2026-02-13 | 13F | Osmosis Investment Management UK Ltd | 7.616 | 248 | ||||||
| 2026-02-03 | 13F | ASR Vermogensbeheer N.V. | 6.142 | -97,16 | 200 | -97,53 | ||||
| 2026-02-05 | 13F | Cardinal Point Capital Management, ULC | 256.484 | -0,64 | 8.365 | -13,29 | ||||
| 2026-02-10 | 13F | Gulf International Bank (UK) Ltd | 15.765 | 0,00 | 1 | |||||
| 2026-01-27 | 13F | TD Waterhouse Canada Inc. | 822.291 | -14,41 | 26.751 | -24,97 | ||||
| 2026-02-10 | 13F | Natixis Advisors, L.p. | 0 | -100,00 | 0 | -100,00 | ||||
| 2026-01-15 | 13F | J. Safra Sarasin Holding AG | 40.818 | -6,25 | 1.331 | -18,19 | ||||
| 2026-02-13 | 13F | Thornburg Investment Management Inc | 168.449 | -1,48 | 5.486 | -14,13 | ||||
| 2026-01-29 | 13F | Munich Reinsurance Co Stock Corp in Munich | 427.564 | 59,02 | 14.121 | 40,48 | ||||
| 2026-02-17 | 13F | Northern Trust Corp | 179.119 | -2,55 | 5.836 | -15,07 | ||||
| 2026-02-06 | 13F | Global Retirement Partners, LLC | 1.919 | 573,33 | 63 | 520,00 | ||||
| 2026-02-05 | 13F | High Note Wealth, LLC | 112 | 0,00 | 4 | -25,00 | ||||
| 2026-02-17 | 13F | Caption Management, LLC | 7.000 | 0,00 | 228 | -12,64 | ||||
| 2026-04-13 | 13F | Creative Financial Designs Inc /adv | 0 | -100,00 | 0 | |||||
| 2025-11-14 | 13F | Wolverine Trading, Llc | Put | 0 | -100,00 | 0 | -100,00 | |||
| 2026-02-13 | 13F | Wells Fargo & Company/mn | 174.603 | 2,55 | 5.689 | -10,62 | ||||
| 2025-10-21 | 13F | Jarislowsky, Fraser Ltd | 21.150.154 | 0,56 | 790.736 | 28,92 | ||||
| 2026-02-11 | 13F | Hughes Financial Services, LLC | 40 | 0,00 | 1 | 0,00 | ||||
| 2026-02-11 | 13F | Jpmorgan Chase & Co | 1.052.214 | -8,19 | 34.281 | -19,98 | ||||
| 2026-02-17 | 13F | Captrust Financial Advisors | 6.737 | -0,09 | 220 | -13,10 | ||||
| 2026-04-08 | 13F | Legacy Wealth Asset Management, LLC | 20.840 | 3,27 | 463 | -29,53 | ||||
| 2026-02-11 | 13F | Franklin Resources Inc | 283.030 | 41,94 | 9.218 | 23,70 | ||||
| 2026-02-06 | 13F | EverSource Wealth Advisors, LLC | 2.164 | 11,49 | 71 | -2,78 | ||||
| 2026-02-12 | 13F | BRYN MAWR TRUST Co | 1.165 | -32,46 | 38 | -42,19 | ||||
| 2026-02-11 | 13F | IMA Wealth, Inc. | 31.717 | -2,37 | 1.033 | -14,91 | ||||
| 2025-11-14 | 13F | Sagard Holdings Management Inc. | 1.015 | 0,00 | 38 | 27,59 | ||||
| 2026-02-13 | 13F | Vontobel Holding Ltd. | 45.815 | 0,00 | 1.492 | -12,85 | ||||
| 2026-02-13 | 13F | Walleye Capital LLC | Put | 0 | -100,00 | 0 | ||||
| 2026-02-13 | 13F | Kilter Group LLC | 64 | 220,00 | 2 | |||||
| 2026-03-12 | 13F/A | Peak6 Llc | Call | 57.100 | -35,19 | 1.860 | -43,52 | |||
| 2026-02-13 | 13F | Colony Group, LLC | 11.458 | 373 | ||||||
| 2026-02-13 | 13F | Van Eck Associates Corp | 19.753 | -4,29 | 1 | |||||
| 2026-02-17 | 13F | Banco Bilbao Vizcaya Argentaria, S.a. | 0 | -100,00 | 0 | |||||
| 2026-02-17 | 13F | Utah Retirement Systems | 28.466 | 0,00 | 928 | -12,78 | ||||
| 2026-02-17 | 13F | Cetera Investment Advisers | 7.603 | 15,35 | 248 | 0,41 | ||||
| 2025-10-30 | 13F | Twin Peaks Wealth Advisors, LLC | 0 | -100,00 | 0 | |||||
| 2026-02-11 | 13F | Cerity Partners LLC | 54.800 | 7,20 | 1.785 | -6,54 | ||||
| 2026-02-17 | 13F | Qube Research & Technologies Ltd | 183.350 | 1.210,49 | 5.973 | 1.044,25 | ||||
| 2026-04-17 | 13F | Bell Investment Advisors, Inc | 232 | 5 | ||||||
| 2026-04-20 | 13F | Ronald Blue Trust, Inc. | 414 | 0,00 | 9 | -30,77 | ||||
| 2026-04-17 | 13F | Cidel Asset Management Inc | 16.812 | -96,98 | 374 | -97,95 | ||||
| 2026-04-15 | 13F | Avanza Fonder AB | 16.453 | 0,00 | 510 | -30,61 | ||||
| 2026-02-02 | 13F | Access Investment Management LLC | 199.835 | 0,00 | 7.470 | 0,00 | ||||
| 2026-04-13 | 13F | Loring Wolcott & Coolidge Fiduciary Advisors Llp/ma | 28.030 | 0,00 | 584 | -26,73 | ||||
| 2026-02-11 | 13F | Parallel Advisors, LLC | 1.035 | 5,61 | 34 | -8,33 | ||||
| 2026-02-17 | 13F | FIL Ltd | 12.155.000 | 5,70 | 395.853 | -7,91 | ||||
| 2026-02-13 | 13F | Walleye Capital LLC | 0 | -100,00 | 0 | |||||
| 2026-01-08 | 13F | Value Partners Investments Inc. | 1.857.455 | -16,54 | 60.578 | -27,16 | ||||
| 2026-04-15 | 13F | Merit Financial Group, LLC | 11.117 | 33,96 | 247 | -8,52 | ||||
| 2026-01-20 | 13F | American National Bank | 40 | 1 | ||||||
| 2025-11-14 | 13F | AXA Investment Managers S.A. | 258.358 | 9.657 | ||||||
| 2026-02-13 | 13F | Cornerstone Financial Management LLC | 111 | 4 | ||||||
| 2026-02-23 | 13F | Mv Capital Management, Inc. | 5 | 0 | ||||||
| 2026-02-12 | 13F | Steward Partners Investment Advisory, Llc | 46 | 0,00 | 1 | 0,00 | ||||
| 2026-02-13 | 13F | Neuberger Berman Group LLC | 407.811 | 18,76 | 13.299 | 3,58 | ||||
| 2026-04-20 | 13F | Naples Global Advisors, Llc | 30.349 | 6,33 | 675 | -27,45 | ||||
| 2026-02-17 | 13F | Credit Agricole S A | 56.280 | 106,96 | 1.834 | 80,41 | ||||
| 2026-02-13 | 13F | Boston Partners | 78.345 | -1,93 | 2.552 | -14,53 | ||||
| 2026-02-12 | 13F | Brinker Capital Investments, LLC | 6.616 | 216 | ||||||
| 2025-11-13 | 13F | Glenmede Investment Management, LP | 10.590 | 396 | ||||||
| 2026-02-18 | 13F | Vident Advisory, LLC | 15.715 | 3,66 | 512 | -9,54 | ||||
| 2026-02-17 | 13F | New Vernon Capital Holdings II LLC | 1.791 | 0,00 | 80 | 21,21 | ||||
| 2026-02-13 | 13F | Arrowstreet Capital, Limited Partnership | 3.681.347 | -16,76 | 119.914 | -27,46 | ||||
| 2026-02-13 | 13F | Toroso Investments, LLC | 14.710 | 23,15 | 479 | 7,40 | ||||
| 2026-02-06 | 13F | Cumberland Partners Ltd | 23.500 | 176,47 | 766 | 141,64 | ||||
| 2026-02-17 | 13F | Man Group plc | 90.248 | 2.943 | ||||||
| 2026-01-29 | 13F | Pictet Asset Management Holding SA | 351.863 | 43,60 | 11.477 | 25,27 | ||||
| 2026-02-13 | 13F | Public Sector Pension Investment Board | 0 | -100,00 | 0 | |||||
| 2026-02-17 | 13F | Grantham, Mayo, Van Otterloo & Co. LLC | 1.409.250 | 2,35 | 45.920 | -10,78 | ||||
| 2026-02-13 | 13F | Citigroup Inc | 165.722 | -31,85 | 5.404 | -40,56 | ||||
| 2026-02-11 | 13F | Zions Bancorporation, National Association /ut/ | 72 | 0,00 | 2 | 0,00 | ||||
| 2026-02-06 | 13F | Lsv Asset Management | 5.500 | 0,00 | 0 | |||||
| 2026-02-11 | 13F | Manchester Capital Management LLC | 536 | 17 | ||||||
| 2026-03-06 | 13F | Hsbc Holdings Plc | 0 | -100,00 | 0 | |||||
| 2026-02-10 | 13F | Goldman Sachs Group Inc | 1.414.406 | -43,55 | 46.081 | -50,80 | ||||
| 2026-02-11 | 13F | LPL Financial LLC | 32.518 | 21,91 | 1.059 | 6,22 | ||||
| 2025-11-10 | 13F | Optiver Holding B.V. | 0 | -100,00 | 0 | -100,00 | ||||
| 2026-02-17 | 13F | Citadel Advisors Llc | Call | 6.400 | -66,67 | 209 | -70,99 | |||
| 2026-02-17 | 13F | Citadel Advisors Llc | 6.545 | -63,61 | 213 | -68,30 | ||||
| 2026-02-03 | 13F | Generali Asset Management SPA SGR | 6.515 | 3,61 | 291 | -11,01 | ||||
| 2025-11-13 | 13F | Macquarie Group Ltd | 0 | -100,00 | 0 | -100,00 | ||||
| 2026-02-17 | 13F | Citadel Advisors Llc | Put | 22.400 | -52,54 | 730 | -58,67 | |||
| 2025-11-14 | 13F | Wolverine Trading, Llc | 7.480 | 282 | ||||||
| 2025-11-14 | 13F | Wolverine Trading, Llc | Call | 15.000 | 41,51 | 566 | 85,86 | |||
| 2026-01-12 | 13F | Rialto Wealth Management, LLC | 0 | -100,00 | 0 | |||||
| 2026-02-12 | 13F | Scotia Capital Inc. | 282.002 | -1,90 | 9.174 | -14,20 | ||||
| 2026-02-11 | 13F | Group One Trading, L.p. | Put | 300 | -86,96 | 10 | -89,41 | |||
| 2026-02-12 | 13F | Ankerstar Wealth, LLC | 4 | 0 | ||||||
| 2026-02-12 | 13F | BlackRock, Inc. | 1.060.426 | -10,47 | 34.549 | -21,97 | ||||
| 2026-02-11 | 13F | Group One Trading, L.p. | Call | 100 | -98,61 | 3 | -98,88 | |||
| 2026-04-07 | 13F | Signaturefd, Llc | 5.053 | 84,55 | 112 | 25,84 | ||||
| 2026-02-17 | 13F | Mork Capital Management, LLC | 35.300 | 0,00 | 1.150 | -12,81 | ||||
| 2026-02-13 | 13F | Smartleaf Asset Management LLC | 179 | 517,24 | 6 | 400,00 | ||||
| 2026-02-06 | 13F | Larson Financial Group LLC | 398 | 460,56 | 13 | 500,00 | ||||
| 2026-02-06 | 13F | Pnc Financial Services Group, Inc. | 3.348 | 56,38 | 109 | 36,25 | ||||
| 2026-02-13 | 13F | Mufg Securities (canada), Ltd. | 383.718 | -8,82 | 12.499 | -20,53 | ||||
| 2026-02-18 | 13F | Achmea Investment Management B.V. | 0 | -100,00 | 0 | |||||
| 2026-02-09 | 13F | Hantz Financial Services, Inc. | 39.183 | 2,07 | 1 | 0,00 | ||||
| 2026-01-27 | 13F | Meritage Portfolio Management | 154.162 | 17,32 | 5.023 | 2,26 | ||||
| 2026-04-07 | 13F | Farther Finance Advisors, LLC | 11.788 | 39,32 | 266 | -3,64 | ||||
| 2026-02-11 | 13F | Tacita Capital Inc | 33 | 1 | ||||||
| 2026-02-13 | 13F | American Century Companies Inc | 129.714 | 7,70 | 4.224 | -6,15 | ||||
| 2026-02-13 | 13F | Bridgewater Associates, LP | 497.045 | -2,64 | 16.209 | -15,08 | ||||
| 2026-02-13 | 13F | Marshall Wace, Llp | 29.800 | 971 | ||||||
| 2026-02-11 | 13F | Deutsche Bank Ag\ | 1.095.040 | 7,87 | 35.676 | -5,98 | ||||
| 2026-02-10 | 13F | Intech Investment Management Llc | 0 | -100,00 | 0 | |||||
| 2026-02-10 | 13F | Hillsdale Investment Management Inc. | 6.650 | 217 | ||||||
| 2026-02-13 | 13F | CDAM (UK) Ltd | 2.017.255 | 0,70 | 65.722 | -12,23 | ||||
| 2026-02-18 | 13F/A | Alberta Investment Management Corp | 317.200 | 49,91 | 10.331 | 30,64 | ||||
| 2026-02-12 | 13F | Bank Of Montreal /can/ | Call | 3.900 | 127 | |||||
| 2025-11-06 | 13F | Johnson Investment Counsel Inc | 0 | -100,00 | 0 | -100,00 | ||||
| 2026-02-12 | 13F | Bank Of Montreal /can/ | Put | 5.200 | 169 | |||||
| 2026-02-12 | 13F | Bank Of Montreal /can/ | 3.168.475 | -3,85 | 103.190 | -16,21 | ||||
| 2026-02-12 | 13F | APG Asset Management N.V. | 140.426 | -5,75 | 3.899 | -17,74 | ||||
| 2026-02-17 | 13F | Russell Investments Group, Ltd. | 258.932 | 15,07 | 8.453 | 0,38 | ||||
| 2026-02-13 | 13F | BRITISH COLUMBIA INVESTMENT MANAGEMENT Corp | 132.092 | -9,75 | 4.302 | -21,36 | ||||
| 2026-02-02 | 13F | Oppenheimer Asset Management Inc. | 13.173 | -0,86 | 429 | -13,51 | ||||
| 2026-02-11 | 13F | Twin Tree Management, LP | Call | 0 | -100,00 | 0 | -100,00 | |||
| 2026-02-12 | 13F | Dimensional Fund Advisors Lp | 3.340.334 | 28,84 | 108.833 | 12,30 | ||||
| 2026-02-17 | 13F | Alliancebernstein L.p. | 30.716 | -1,59 | 1.001 | -14,24 | ||||
| 2026-02-10 | 13F | Bnp Paribas Arbitrage, Sa | 118.019 | 305,59 | 3.845 | 253,73 | ||||
| 2026-02-10 | 13F | Envestnet Asset Management Inc | 112.919 | 2,45 | 3.679 | -10,71 | ||||
| 2026-02-02 | 13F | Intact Investment Management Inc. | 728.740 | -38,02 | 23.732 | -46,00 | ||||
| 2026-02-13 | 13F | BNP Paribas Asset Management Holding S.A. | 182.214 | 8 | ||||||
| 2026-02-17 | 13F | Bank Of America Corp /de/ | 677.973 | 387,43 | 22.088 | 324,85 | ||||
| 2026-02-17 | 13F | Quantinno Capital Management LP | 52.285 | 41,32 | 1.703 | 23,23 |