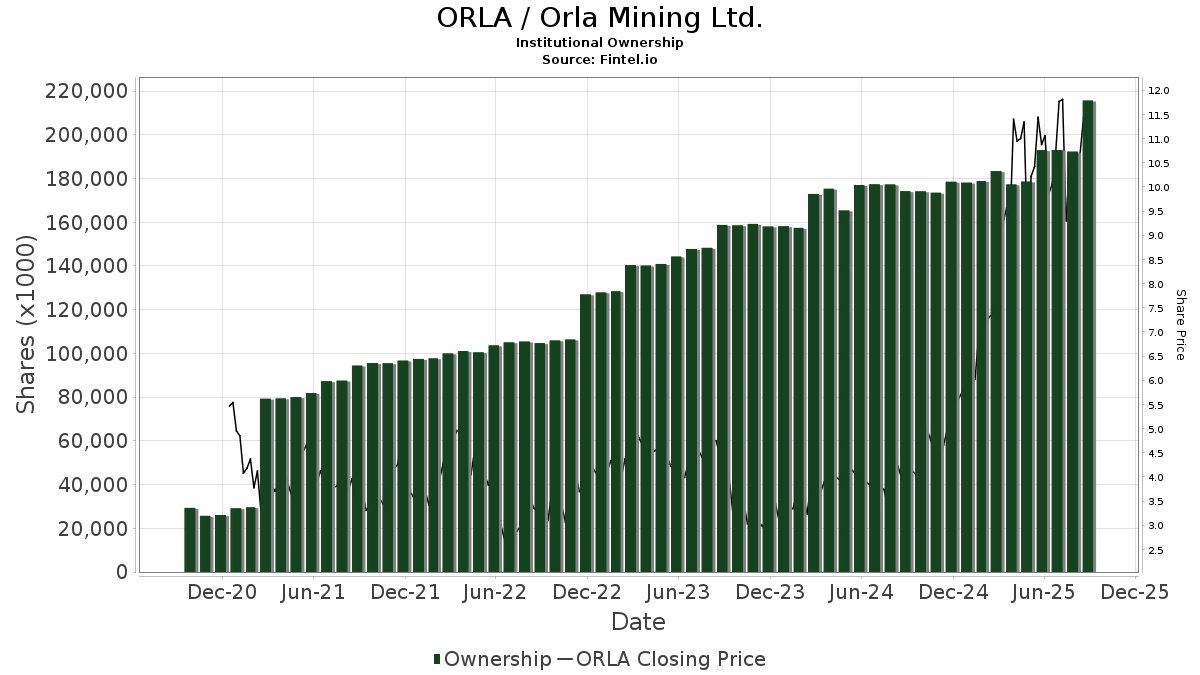
Grundlæggende statistik
| Institutionelle aktier (lange) | 222.971.309 - 65,60% (ex 13D/G) - change of -23,43MM shares -9,51% MRQ |
| Institutionel værdi (lang) | $ 2.660.061 USD ($1000) |
Institutionelt ejerskab og aktionærer
Orla Mining Ltd. (US:ORLA) har 225 institutionelle ejere og aktionærer, der har indsendt 13D/G- eller 13F-formularer til Securities Exchange Commission (SEC). Disse institutioner har i alt 223,023,337 aktier. Største aktionærer omfatter Fmr Llc, Fairfax Financial Holdings Ltd/ Can, Van Eck Associates Corp, Vanguard Group Inc, Connor, Clark & Lunn Investment Management Ltd., Franklin Resources Inc, SGGDX - First Eagle Gold Fund Class A, Royal Bank Of Canada, Merk Investments LLC, and ASA Gold & Precious Metals Ltd .
Orla Mining Ltd. (NYSEAM:ORLA) institutionel ejerskabsstruktur viser aktuelle positioner i virksomheden efter institutioner og fonde, samt seneste ændringer i positionsstørrelse. Større aktionærer kan omfatte individuelle investorer, investeringsforeninger, hedgefonde eller institutioner. Skema 13D angiver, at investoren besidder (eller besidder) mere end 5 % af virksomheden og har til hensigt (eller har til hensigt at) aktivt at forfølge en ændring i forretningsstrategi. Skema 13G indikerer en passiv investering på over 5%.
The share price as of March 19, 2026 is 13,37 / share. Previously, on March 20, 2025, the share price was 9,30 / share. This represents an increase of 43,76% over that period.
Fondens stemningsscore
Fund Sentiment Score (fka Ownership Accumulation Score) finder de aktier, der bliver mest købt af fonde. Det er resultatet af en sofistikeret, multi-faktor kvantitativ model, der identificerer virksomheder med de højeste niveauer af institutionel akkumulering. Scoringsmodellen bruger en kombination af den samlede stigning i oplyste ejere, ændringerne i porteføljeallokeringer i disse ejere og andre målinger. Tallet går fra 0 til 100, hvor højere tal indikerer et højere niveau af akkumulering for sine jævnaldrende, og 50 er gennemsnittet.
Opdateringsfrekvens: Dagligt
Se Ownership Explorer, som giver en liste over højest rangerende virksomheder.
AI+ Ask Fintel’s AI assistant about Orla Mining Ltd..
Select a question to share a public post with an AI-crafted answer.
Thinking of good questions…
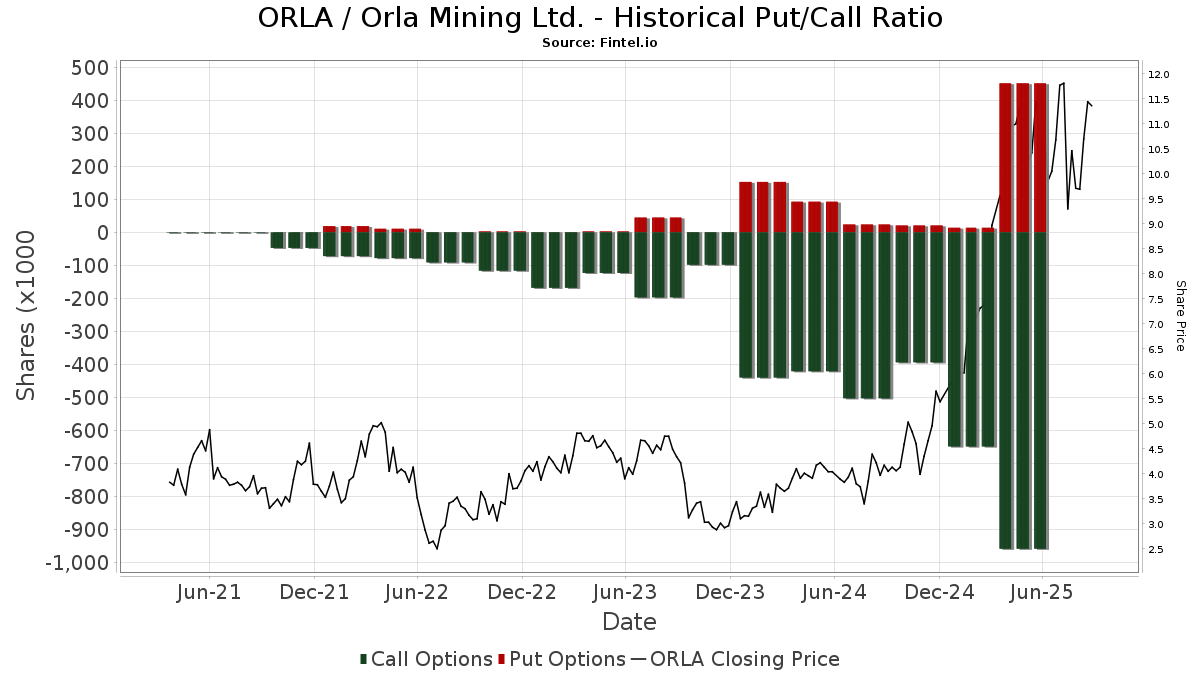
Institutionel Put/Call-forhold
Ud over at indberette standardaktie- og gældsudstedelser skal institutter med mere end 100 mill. aktiver under forvaltning også oplyse deres put- og call-optionsbeholdninger. Da salgsoptioner generelt indikerer negativ stemning, og købsoptioner indikerer positiv stemning, kan vi få en fornemmelse af den overordnede institutionelle stemning ved at plotte forholdet mellem put og kald. Diagrammet til højre viser det historiske put/call-forhold for dette instrument.
Brug af Put/Call Ratio som en indikator for investorernes stemning overvinder en af de vigtigste mangler ved at bruge totalt institutionelt ejerskab, som er, at en betydelig mængde af aktiver under forvaltning investeres passivt for at spore indekser. Passivt forvaltede fonde køber typisk ikke optioner, så indikatoren for put/call-forholdet følger mere nøje følelsen af aktivt forvaltede fonde.
13D/G-arkivering
Vi præsenterer 13D/G ansøgninger separat fra 13F ansøgninger på grund af den forskellige behandling af SEC. 13D/G-ansøgninger kan indgives af grupper af investorer (med én ledende), hvorimod 13F-ansøgninger ikke kan. Dette resulterer i situationer, hvor en investor kan indsende en 13D/G, der rapporterer én værdi for de samlede aktier (der repræsenterer alle de aktier, der ejes af investorgruppen), men derefter indsender en 13F, der rapporterer en anden værdi for de samlede aktier (der udelukkende repræsenterer deres egne) ejendomsret). Det betyder, at aktieejerskab af 13D/G-arkiver og 13F-arkiveringer ofte ikke er direkte sammenlignelige, så vi præsenterer dem separat.
Bemærk: Fra den 16. maj 2021 viser vi ikke længere ejere, der ikke har indsendt en 13D/G inden for det seneste år. Tidligere viste vi den fulde historie af 13D/G-arkiver. Generelt skal enheder, der er forpligtet til at indgive 13D/G-ansøgninger, indgive mindst årligt, før de indsender en afsluttende ansøgning. Dog forlader fonde nogle gange positioner uden at indsende en afsluttende ansøgning (dvs. de afvikler), så visning af den fulde historie resulterede nogle gange i forvirring om det nuværende ejerskab. For at undgå forvirring viser vi nu kun 'aktuelle' ejere - det vil sige - ejere, der har anmeldt inden for det seneste år.
Upgrade to unlock premium data.
| Fil dato | Form | Investor | Forrige Aktier |
Seneste Aktier |
Δ Aktier (Procent) |
Ejendomsret (Procent) |
Δ Ejerskab (Procent) |
|
|---|---|---|---|---|---|---|---|---|
| 2026-02-13 | VAN ECK ASSOCIATES CORP | 19,376,060 | 5.70 | |||||
| 2025-12-11 | FAIRFAX FINANCIAL HOLDINGS LTD/ CAN | 56,817,229 | 75,954,445 | 33.68 | 19.80 | 11.86 | ||
| 2025-12-08 | WATSA V PREM ET AL | 100,954,445 | 78,074,283 | -22.66 | 20.30 | -26.45 | ||
| 2025-09-30 | AGNICO EAGLE MINES LTD | 38,002,589 | 0 | -100.00 | 0.00 | -100.00 | ||
| 2025-08-06 | FMR LLC | 33,796,266 | 37,389,086 | 10.63 | 11.50 | 9.52 |
13F og NPORT arkivering
Detaljer om 13F-arkivering er gratis. Detaljer om NP-ansøgninger kræver et premium-medlemskab. Grønne rækker angiver nye positioner. Røde rækker angiver lukkede positioner. Klik på linket ikon for at se den fulde transaktionshistorik.
Opgrader
for at låse premium-data op og eksportere til Excel ![]() .
.
| Fil dato | Kilde | Investor | Type | Gennemsnitlig pris (Øst) |
Aktier | Δ Aktier (%) |
Rapporteret Værdi ($1000) |
Δ Værdi (%) |
Port Alloc (%) |
|
|---|---|---|---|---|---|---|---|---|---|---|
| 2026-02-12 | 13F | Sprott Inc. | 45.822 | 1,77 | 617 | 26,95 | ||||
| 2026-02-17 | 13F | Ancora Advisors, LLC | 3.180 | 0,00 | 43 | 23,53 | ||||
| 2025-09-25 | NP | DFA INVESTMENT DIMENSIONS GROUP INC - International Small Cap Growth Portfolio Institutional Class This fund is a listed as child fund of Dimensional Fund Advisors Lp and if that institution has disclosed ownership in this security, then these positions will not be double counted when calculating total shares and total value | 30.757 | 0,00 | 287 | -15,38 | ||||
| 2026-02-13 | 13F | Financial Sense Advisors, Inc. | 146.661 | 1.976 | ||||||
| 2025-09-26 | NP | OWSMX - Old Westbury Small & Mid Cap Strategies Fund | 81.500 | 0,00 | 759 | -15,50 | ||||
| 2026-02-13 | 13F | Marshall Wace, Llp | 0 | -100,00 | 0 | |||||
| 2026-01-07 | 13F | CWA Asset Management Group, LLC | 3.371.814 | 7,85 | 45.418 | 34,51 | ||||
| 2026-02-11 | 13F | Tacita Capital Inc | 66.483 | 0,00 | 895 | 24,69 | ||||
| 2026-02-17 | 13F | Guggenheim Capital Llc | 285.793 | -5,16 | 3.850 | 18,29 | ||||
| 2026-02-09 | 13F | Catalyst Funds Management Pty Ltd | 0 | -100,00 | 0 | |||||
| 2026-02-13 | 13F | Global Strategic Management Inc | 96.700 | 1 | ||||||
| 2026-02-17 | 13F | Amundi | 4.688.828 | -0,68 | 63.159 | 15,93 | ||||
| 2026-02-09 | 13F | Waratah Capital Advisors Ltd. | 0 | -100,00 | 0 | |||||
| 2025-09-25 | NP | DFIC - Dimensional International Core Equity 2 ETF | 27.278 | -79,13 | 254 | -79,16 | ||||
| 2025-11-14 | 13F | Cubist Systematic Strategies, LLC | 696.495 | 7.521 | ||||||
| 2026-02-12 | 13F | Groupe la Francaise | 700.000 | 4,48 | 9.412 | 30,13 | ||||
| 2026-02-13 | 13F | Morgan Stanley | 1.162.437 | -2,52 | 15.658 | 21,59 | ||||
| 2025-11-14 | 13F | Ubs Asset Management Americas Inc | 0 | -100,00 | 0 | |||||
| 2026-02-13 | 13F | Entropy Technologies, LP | 40.987 | 87,91 | 552 | 134,89 | ||||
| 2025-11-13 | 13F | Banque Cantonale Vaudoise | 0 | -100,00 | 0 | |||||
| 2026-02-12 | 13F | Skopos Labs, Inc. | 0 | -100,00 | 0 | |||||
| 2026-02-17 | 13F | Lighthouse Investment Partners, LLC | 99.866 | 1.344 | ||||||
| 2026-02-10 | 13F | Td Asset Management Inc | 3.930.398 | 11,01 | 52.931 | 38,57 | ||||
| 2026-02-17 | 13F | Graham Capital Management, L.P. | 13.752 | 185 | ||||||
| 2026-02-19 | 13F | Invesco Ltd. | 3.539.392 | 994,69 | 47.676 | 1.265,65 | ||||
| 2026-02-17 | 13F | SIG North Trading, ULC | 79.947 | 241,74 | 1.077 | 326,98 | ||||
| 2026-02-17 | 13F | MIRAE ASSET GLOBAL ETFS HOLDINGS Ltd. | 223.989 | 42,04 | 3.016 | 77,31 | ||||
| 2026-02-17 | 13F | SIG North Trading, ULC | Put | 90.000 | 107,37 | 1.212 | 158,97 | |||
| 2026-02-17 | 13F | Moore Capital Management, Lp | 0 | -100,00 | 0 | |||||
| 2026-02-17 | 13F | SIG North Trading, ULC | Call | 291.600 | 47,72 | 3.928 | 84,28 | |||
| 2025-09-26 | NP | SUNAMERICA SERIES TRUST - SA T. Rowe Price VCP Balanced Portfolio Class 3 | 6.512 | -75,19 | 61 | -25,00 | ||||
| 2026-02-13 | 13F | Public Sector Pension Investment Board | 0 | -100,00 | 0 | |||||
| 2025-10-23 | 13F | SG Americas Securities, LLC | 0 | -100,00 | 0 | |||||
| 2025-09-25 | NP | RPGAX - T. Rowe Price Global Allocation Fund, Inc. This fund is a listed as child fund of Price T Rowe Associates Inc /md/ and if that institution has disclosed ownership in this security, then these positions will not be double counted when calculating total shares and total value | 3.771 | -87,70 | 35 | -62,37 | ||||
| 2026-01-14 | 13F | Net Worth Advisory Group | 15.509 | 4,29 | 209 | 30,00 | ||||
| 2026-02-12 | 13F | Hollencrest Capital Management | 1.680 | -21,27 | 23 | -4,35 | ||||
| 2025-09-29 | NP | GOEX - Global X Gold Explorers ETF This fund is a listed as child fund of Mirae Asset Global Investments Co., Ltd. and if that institution has disclosed ownership in this security, then these positions will not be double counted when calculating total shares and total value | 139.849 | -2,88 | 1.305 | -17,57 | ||||
| 2026-02-17 | 13F | Brevan Howard Capital Management LP | 0 | -100,00 | 0 | |||||
| 2026-02-17 | 13F | Parvin Asset Management, LLC | 70.500 | 1,18 | 950 | 26,20 | ||||
| 2026-02-11 | 13F | O'shaughnessy Asset Management, Llc | 178.055 | -30,36 | 2.398 | -13,08 | ||||
| 2026-01-29 | 13F | Vanguard Group Inc | 8.202.861 | 152,08 | 110.320 | 214,36 | ||||
| 2026-01-07 | 13F | Covea Finance | 811.700 | -13,85 | 10.944 | 7,73 | ||||
| 2026-02-05 | 13F | Gabelli Funds Llc | 1.882.700 | 67,23 | 25.360 | 108,58 | ||||
| 2026-01-15 | 13F | Brookstone Capital Management | 19.350 | 261 | ||||||
| 2026-02-18 | 13F | State of Tennessee, Treasury Department | 19.208 | 290 | ||||||
| 2026-02-17 | 13F | Quantessence Capital LLC | 0 | -100,00 | 0 | |||||
| 2025-09-25 | NP | DFA INVESTMENT DIMENSIONS GROUP INC - International Social Core Equity Portfolio Institutional Class This fund is a listed as child fund of Dimensional Fund Advisors Lp and if that institution has disclosed ownership in this security, then these positions will not be double counted when calculating total shares and total value | 14.309 | 0,00 | 133 | -15,29 | ||||
| 2026-02-10 | 13F | Norges Bank | 2.584.183 | 34.756 | ||||||
| 2026-02-13 | 13F | Wexford Capital Lp | 29.988 | 96,12 | 403 | 145,73 | ||||
| 2026-02-13 | 13F | Barclays Plc | 596.005 | 127,11 | 8.028 | 183,27 | ||||
| 2025-09-25 | NP | VFSNX - Vanguard FTSE All-World ex-US Small-Cap Index Fund Institutional Shares | 42.119 | 392 | ||||||
| 2026-02-10 | 13F | State of Wyoming | 6.407 | -82,35 | 86 | -78,06 | ||||
| 2026-02-17 | 13F | Engineers Gate Manager LP | 18.761 | 32,16 | 253 | 64,71 | ||||
| 2026-02-17 | 13F | Angeles Wealth Management, Llc | 13.576 | 183 | ||||||
| 2026-02-13 | 13F | Victory Capital Management Inc | 316.166 | 0,00 | 4.259 | 24,72 | ||||
| 2026-02-13 | 13F | JustInvest LLC | 16.888 | 11,53 | 227 | 39,26 | ||||
| 2026-02-05 | 13F | Gamco Investors, Inc. Et Al | 82.945 | 27,32 | 1.117 | 58,89 | ||||
| 2026-02-13 | 13F | Mudita Advisors LLP | 1.440.000 | 2,86 | 19.395 | 28,28 | ||||
| 2026-02-03 | 13F | SBI Securities Co., Ltd. | 4.672 | 67,88 | 63 | 106,67 | ||||
| 2026-02-13 | 13F | Great West Life Assurance Co /can/ | 32.112 | -59,49 | 0 | |||||
| 2026-02-09 | 13F | Legal & General Group Plc | 327.610 | -35,50 | 4.412 | -19,49 | ||||
| 2026-02-17 | 13F | Jones Financial Companies Lllp | 136 | 2 | ||||||
| 2025-09-26 | NP | FOCSX - Fidelity Small Cap Growth K6 Fund This fund is a listed as child fund of Fmr Llc and if that institution has disclosed ownership in this security, then these positions will not be double counted when calculating total shares and total value | 480.263 | 0,92 | 4.471 | -14,68 | ||||
| 2026-02-17 | 13F | XTX Topco Ltd | 33.292 | -2,67 | 448 | 21,41 | ||||
| 2026-02-13 | 13F | Dynamic Technology Lab Private Ltd | 0 | -100,00 | 0 | |||||
| 2026-02-17 | 13F | Public Employees Retirement System Of Ohio | 81.007 | 9,65 | 1.091 | 36,76 | ||||
| 2026-02-17 | 13F | Fmr Llc | 38.466.102 | 2,73 | 517.347 | 28,10 | ||||
| 2026-01-15 | 13F | Allspring Global Investments Holdings, LLC | 1.562.500 | 29,29 | 21.015 | 61,27 | ||||
| 2026-01-29 | 13F | Sanctuary Advisors, LLC | 18.274 | -47,96 | 246 | -35,09 | ||||
| 2026-01-29 | 13F | IMC-Chicago, LLC | Put | 45.500 | 130,96 | 613 | 188,68 | |||
| 2026-01-29 | 13F | IMC-Chicago, LLC | Call | 76.200 | 290,77 | 1.026 | 388,57 | |||
| 2025-09-25 | NP | DFAI - Dimensional International Core Equity Market ETF | 87.413 | 322,18 | 816 | 324,48 | ||||
| 2026-02-17 | 13F | Numerai GP LLC | 0 | -100,00 | 0 | |||||
| 2026-02-17 | 13F | Longaeva Partners L.P. | 0 | -100,00 | 0 | |||||
| 2026-01-29 | 13F | Montrusco Bolton Investments Inc. | 1.071.537 | 14.430 | ||||||
| 2026-02-17 | 13F | Jump Financial, LLC | 0 | -100,00 | 0 | |||||
| 2026-01-22 | 13F | Vision Financial Markets Llc | 119 | 0,00 | 2 | 0,00 | ||||
| 2026-02-18 | 13F | Kitching Partners, Llc | 0 | -100,00 | 0 | |||||
| 2026-02-23 | 13F | Virtu Financial LLC | 11.893 | 0 | ||||||
| 2026-01-29 | 13F | UBS Group AG | 805.388 | 343,11 | 10.849 | 452,91 | ||||
| 2026-02-17 | 13F | Balyasny Asset Management Llc | 419.921 | -67,85 | 5.649 | -59,91 | ||||
| 2026-02-11 | 13F | Jpmorgan Chase & Co | 127.766 | 21.337,25 | 1.721 | 28.583,33 | ||||
| 2026-02-11 | 13F | Erste Asset Management GmbH | 60.850 | 832 | ||||||
| 2025-09-25 | NP | TLTD - FlexShares Morningstar Developed Markets ex-US Factor Tilt Index Fund | 8.000 | 3,23 | 75 | -12,94 | ||||
| 2026-02-17 | 13F | Royal Bank Of Canada | Call | 327.000 | 4.405 | |||||
| 2026-01-23 | 13F | Farther Finance Advisors, LLC | 0 | -100,00 | 0 | |||||
| 2026-02-10 | 13F | CIBC World Markets Inc. | 257.888 | 146,45 | 3.469 | 207,45 | ||||
| 2026-02-17 | 13F | Keebeck Alpha, LP | 15.742 | -63,27 | 212 | -54,11 | ||||
| 2026-02-17 | 13F | Royal Bank Of Canada | 6.292.197 | 54,58 | 84.756 | 92,79 | ||||
| 2026-02-18 | 13F | Mackenzie Financial Corp | 872.290 | 411,75 | 11.860 | 545,27 | ||||
| 2026-01-26 | 13F | La Banque Postale Asset Management SA | 17.758 | 239 | ||||||
| 2026-02-09 | 13F | Frazier Financial Advisors, LLC | 78 | 1 | ||||||
| 2026-02-09 | 13F | GeoSphere Capital Management | 0 | -100,00 | 0 | |||||
| 2026-01-29 | 13F | Anchyra Partners Llc | 14.000 | 189 | ||||||
| 2026-02-04 | 13F | BCJ Capital Management, LLC | 0 | -100,00 | 0 | |||||
| 2026-02-13 | 13F | Quarry LP | 539 | 7 | ||||||
| 2025-09-26 | NP | FCPGX - Fidelity Small Cap Growth Fund This fund is a listed as child fund of Fmr Llc and if that institution has disclosed ownership in this security, then these positions will not be double counted when calculating total shares and total value | 953.487 | -0,29 | 8.877 | -15,69 | ||||
| 2026-02-17 | 13F | Tower Research Capital LLC (TRC) | 32 | -99,48 | 0 | -100,00 | ||||
| 2026-02-17 | 13F | Two Sigma Advisers, Lp | 0 | -100,00 | 0 | |||||
| 2026-02-02 | 13F | Triasima Portfolio Management inc. | 213.736 | 0,12 | 2.878 | 24,97 | ||||
| 2026-02-09 | 13F | Themes Management Co LLC | 45.798 | 616 | ||||||
| 2026-02-12 | 13F | Hohimer Wealth Management, Llc | 0 | -100,00 | 0 | |||||
| 2026-02-27 | 13F | Groupama Asset Managment | 444.142 | 37,97 | 8.199 | 69,70 | ||||
| 2026-02-10 | 13F/A | Northwestern Mutual Wealth Management Co | 58 | 1 | ||||||
| 2025-09-26 | NP | FTIHX - Fidelity Total International Index Fund This fund is a listed as child fund of Fmr Llc and if that institution has disclosed ownership in this security, then these positions will not be double counted when calculating total shares and total value | 109.330 | 5,15 | 1.018 | -11,10 | ||||
| 2026-01-07 | 13F | Innova Wealth Partners | 18.177 | 245 | ||||||
| 2026-01-20 | 13F | Stratos Wealth Advisors, LLC | 81.185 | 0,00 | 1.094 | 24,77 | ||||
| 2025-09-25 | NP | VT - Vanguard Total World Stock Index Fund ETF Shares | 8.534 | 79 | ||||||
| 2026-02-17 | 13F | SummitTX Capital, L.P. | 0 | -100,00 | 0 | |||||
| 2026-02-02 | 13F | PKO Investment Management Joint-Stock Co | 112.800 | 0,00 | 1.520 | 24,82 | ||||
| 2026-02-06 | 13F/A | Rathbone Brothers plc | 21.950 | -38,94 | 296 | -23,97 | ||||
| 2025-09-25 | NP | DFIEX - International Core Equity Portfolio - Institutional Class This fund is a listed as child fund of Dimensional Fund Advisors Lp and if that institution has disclosed ownership in this security, then these positions will not be double counted when calculating total shares and total value | 81.263 | 0,00 | 757 | -15,23 | ||||
| 2026-02-10 | 13F | Acadian Asset Management Llc | 88.400 | 1 | ||||||
| 2026-02-17 | 13F | Scientech Research LLC | 14.512 | 195 | ||||||
| 2026-02-04 | 13F | Dogwood Wealth Management LLC | 0 | -100,00 | 0 | |||||
| 2025-11-17 | 13F | PDT Partners, LLC | 0 | -100,00 | 0 | |||||
| 2026-02-17 | 13F | Edmond De Rothschild Holding S.a. | 288.264 | 12,36 | 3.886 | 40,54 | ||||
| 2026-02-13 | 13F | Wells Fargo & Company/mn | 2.039 | 0,00 | 27 | 22,73 | ||||
| 2026-02-06 | 13F | EverSource Wealth Advisors, LLC | 79 | 1 | ||||||
| 2026-02-13 | 13F | Evelyn Partners Investment Management LLP | 2.029 | 0,00 | 27 | 28,57 | ||||
| 2026-02-13 | 13F | National Bank Of Canada /fi/ | 627.292 | 7,27 | 8.327 | 32,43 | ||||
| 2026-03-06 | 13F | Hsbc Holdings Plc | 0 | -100,00 | 0 | |||||
| 2026-01-27 | 13F | TD Waterhouse Canada Inc. | 5.313 | 196,98 | 71 | 288,89 | ||||
| 2025-11-14 | 13F | Aigen Investment Management, Lp | 0 | -100,00 | 0 | |||||
| 2026-02-17 | 13F | Weiss Asset Management LP | 0 | -100,00 | 0 | -100,00 | ||||
| 2026-02-17 | 13F | Janus Henderson Group Plc | 712.500 | 9.577 | ||||||
| 2026-01-29 | 13F | Nbc Securities, Inc. | 700 | 0,00 | 9 | 28,57 | ||||
| 2026-02-17 | 13F | Qube Research & Technologies Ltd | 108.270 | -74,77 | 1.458 | -68,54 | ||||
| 2026-01-26 | 13F | Quattro Financial Advisors Llc | 214.015 | 0,00 | 2.883 | 24,71 | ||||
| 2026-02-17 | 13F | Prelude Capital Management, Llc | 15.742 | -63,27 | 212 | -54,11 | ||||
| 2026-02-11 | 13F | Franklin Resources Inc | 7.686.849 | 0,98 | 103.386 | 25,96 | ||||
| 2026-02-12 | 13F | Amitell Capital Pte Ltd | 0 | -100,00 | 0 | |||||
| 2026-01-07 | 13F | Baldwin Brothers Inc/ma | 29.720 | 90,51 | 400 | 138,10 | ||||
| 2026-02-17 | 13F | Voloridge Investment Management, Llc | 0 | -100,00 | 0 | |||||
| 2026-02-12 | 13F | Campbell & CO Investment Adviser LLC | 57.172 | 770 | ||||||
| 2025-09-26 | NP | Voya Prime Rate Trust | Short | -52.028 | -484 | |||||
| 2026-02-17 | 13F | Susquehanna Advisors Group, Inc. | 119.100 | 1.604 | ||||||
| 2026-02-13 | 13F | Peak6 Llc | Call | 57.500 | 17,11 | 775 | 46,04 | |||
| 2026-02-06 | 13F | HighTower Advisors, LLC | 24.234 | -36,44 | 326 | -20,68 | ||||
| 2026-02-11 | 13F | Fiera Capital Corp | 539.966 | -16,11 | 7.265 | 4,68 | ||||
| 2026-02-17 | 13F | Toronto Dominion Bank | 141.389 | 100,28 | 1.902 | 149,80 | ||||
| 2025-09-25 | NP | DFA INVESTMENT DIMENSIONS GROUP INC - World ex U.S. Core Equity Portfolio Institutional Class Shares | 11.449 | 0,00 | 107 | -15,20 | ||||
| 2026-02-17 | 13F | Toronto Dominion Bank | Put | 6.000 | 81 | |||||
| 2026-01-28 | 13F | U S Global Investors Inc | 0 | -100,00 | 0 | |||||
| 2026-02-17 | 13F | Jain Global LLC | 34.930 | 12,16 | 470 | 40,30 | ||||
| 2026-02-17 | 13F | Millennium Management Llc | 3.873.626 | -57,28 | 52.119 | -46,72 | ||||
| 2026-02-11 | 13F | Cerity Partners LLC | 12.750 | 0,00 | 172 | 24,82 | ||||
| 2026-02-12 | 13F | Counterpoint Mutual Funds LLC | 37.941 | -28,13 | 355 | 21,23 | ||||
| 2026-02-13 | 13F | Van Eck Associates Corp | 19.391.604 | 279,92 | 261 | 374,55 | ||||
| 2025-09-25 | NP | DFA INVESTMENT TRUST CO - The Canadian Small Company Series This fund is a listed as child fund of Dimensional Fund Advisors Lp and if that institution has disclosed ownership in this security, then these positions will not be double counted when calculating total shares and total value | 627.078 | 0,00 | 5.844 | -15,27 | ||||
| 2026-02-11 | 13F | XML Financial, LLC | 36.300 | 30,58 | 489 | 62,67 | ||||
| 2026-02-13 | 13F | Walleye Capital LLC | 997.235 | 77,96 | 13.433 | 121,98 | ||||
| 2026-02-17 | 13F | ExodusPoint Capital Management, LP | 0 | -100,00 | 0 | -100,00 | ||||
| 2025-11-12 | 13F | HAP Trading, LLC | Put | 18.800 | 0 | |||||
| 2025-09-25 | NP | DFIS - Dimensional International Small Cap ETF | 205.556 | 99,56 | 1.918 | 99,69 | ||||
| 2025-09-25 | NP | Dfa Investment Dimensions Group Inc - Va International Small Portfolio This fund is a listed as child fund of Dimensional Fund Advisors Lp and if that institution has disclosed ownership in this security, then these positions will not be double counted when calculating total shares and total value | 17.153 | 0,00 | 160 | -15,43 | ||||
| 2026-01-29 | 13F | Concurrent Investment Advisors, LLC | 88.828 | 1.197 | ||||||
| 2026-02-06 | 13F | Leonteq Securities AG | 90.259 | 143,94 | 1.214 | 204,01 | ||||
| 2026-02-13 | 13F | Merk Investments LLC | 6.200.000 | 0,00 | 83.514 | 24,72 | ||||
| 2026-02-17 | 13F | D. E. Shaw & Co., Inc. | Call | 150.000 | 0,00 | 2.018 | 24,74 | |||
| 2026-02-11 | 13F | Picton Mahoney Asset Management | 37.884 | 510 | ||||||
| 2025-11-12 | 13F | Forge First Asset Management Inc. | 100.000 | 1.079 | ||||||
| 2026-02-12 | 13F | Jane Street Group, Llc | Call | 55.200 | 363,87 | 744 | 480,47 | |||
| 2026-02-17 | 13F | D. E. Shaw & Co., Inc. | 3.329.213 | 130,79 | 44.791 | 187,98 | ||||
| 2025-11-14 | 13F | Point72 (DIFC) Ltd | 31.317 | 338 | ||||||
| 2025-09-24 | NP | IXUS - iShares Core MSCI Total International Stock ETF | 490.176 | 26,44 | 4.564 | 6,91 | ||||
| 2026-02-12 | 13F | Jane Street Group, Llc | 2.521.486 | -55,13 | 33.964 | -44,04 | ||||
| 2026-02-17 | 13F | D. E. Shaw & Co., Inc. | Put | 300.000 | 0,00 | 4.035 | 24,77 | |||
| 2026-02-17 | 13F | Quadrature Capital Ltd | 160.100 | 2.156 | ||||||
| 2026-02-13 | 13F | Verition Fund Management LLC | 0 | -100,00 | 0 | |||||
| 2026-02-17 | 13F | Citadel Advisors Llc | Put | 358.700 | -40,29 | 4.832 | -25,53 | |||
| 2026-02-12 | 13F | Jane Street Group, Llc | Put | 64.500 | 145,25 | 869 | 205,63 | |||
| 2026-02-17 | 13F | Citadel Advisors Llc | Call | 92.800 | 77,78 | 1.250 | 122,02 | |||
| 2026-02-13 | 13F | Clear Street Group Inc. | 0 | -100,00 | 0 | |||||
| 2026-01-27 | 13F | WealthCollab, LLC | 0 | -100,00 | 0 | |||||
| 2026-02-17 | 13F | Aquatic Capital Management LLC | 174.973 | 189,64 | 2.357 | 261,35 | ||||
| 2026-02-10 | 13F | CIBC Asset Management Inc | 327.826 | 17,45 | 4.412 | 46,74 | ||||
| 2026-02-17 | 13F | Merrion Investment Management Co, LLC | 55.400 | 0,00 | 746 | 24,75 | ||||
| 2026-02-13 | 13F | Alberta Investment Management Corp | 0 | -100,00 | 0 | |||||
| 2026-02-17 | 13F | Point72 Asset Management, L.P. | 299.027 | 4.025 | ||||||
| 2026-02-17 | 13F | DZ BANK AG Deutsche Zentral Genossenschafts Bank, Frankfurt am Main | 1.016.354 | -16,44 | 13.690 | 4,38 | ||||
| 2025-09-25 | NP | DFAX - Dimensional World ex U.S. Core Equity 2 ETF | 128.194 | 0,00 | 1.196 | -15,06 | ||||
| 2026-02-17 | 13F | FIL Ltd | 3.750.000 | 87,50 | 50.435 | 133,82 | ||||
| 2026-02-17 | 13F | Man Group plc | 183.400 | -2,52 | 2.470 | 21,69 | ||||
| 2026-02-12 | 13F | CIBC Private Wealth Group, LLC | 2.500 | 0,00 | 34 | 22,22 | ||||
| 2026-02-12 | 13F | StoneX Group Inc. | 0 | -100,00 | 0 | |||||
| 2026-02-13 | 13F | Carmignac Gestion | 0 | -100,00 | 0 | |||||
| 2026-02-04 | 13F | Swiss Life Asset Management Ltd | 27.859 | 111,58 | 375 | 163,38 | ||||
| 2026-02-17 | 13F | Susquehanna International Group, Llp | 0 | -100,00 | 0 | |||||
| 2025-11-12 | 13F | 111 Capital | 0 | -100,00 | 0 | |||||
| 2025-11-07 | 13F | Cumberland Partners Ltd | 0 | -100,00 | 0 | |||||
| 2025-11-14 | 13F | Capula Management Ltd | 0 | -100,00 | 0 | |||||
| 2026-02-17 | 13F | Investment Management Corp of Ontario | 32.488 | 438 | ||||||
| 2026-02-17 | 13F | Citadel Advisors Llc | 592.548 | -42,21 | 7.982 | -27,92 | ||||
| 2026-02-05 | 13F | Allworth Financial LP | 20 | -96,75 | 0 | -100,00 | ||||
| 2026-02-13 | 13F | Neuberger Berman Group LLC | 94.435 | 606,11 | 1.272 | 782,64 | ||||
| 2026-02-06 | 13F | Pnc Financial Services Group, Inc. | 287 | 4 | ||||||
| 2026-02-12 | 13F | Scotia Capital Inc. | 23.121 | 11,30 | 307 | 37,67 | ||||
| 2026-02-13 | 13F | Mariner, LLC | 14.929 | 15,26 | 201 | 44,60 | ||||
| 2026-02-17 | 13F | Gotham Asset Management, LLC | 23.998 | 0,52 | 323 | 25,68 | ||||
| 2026-01-12 | 13F | Salem Investment Counselors Inc | 0 | -100,00 | 0 | |||||
| 2026-02-13 | 13F | Citigroup Inc | 4.960 | -59,45 | 67 | -49,62 | ||||
| 2026-02-13 | 13F | Charles Schwab Investment Management Inc | 416.003 | 160,08 | 5.602 | 224,75 | ||||
| 2026-02-06 | 13F | Profund Advisors Llc | 27.234 | -12,95 | 367 | 8,61 | ||||
| 2026-02-12 | 13F | Renaissance Technologies Llc | 1.042.199 | 44,79 | 14.038 | 80,60 | ||||
| 2026-02-13 | 13F | Flow Traders U.s. Llc | 12.319 | 0 | ||||||
| 2026-02-06 | 13F | FourThought Financial Partners, LLC | 0 | -100,00 | 0 | |||||
| 2026-02-12 | 13F | Federation des caisses Desjardins du Quebec | 256.885 | -6,53 | 3.425 | 15,87 | ||||
| 2026-02-10 | 13F | Jupiter Asset Management Ltd | 2.770.161 | -0,76 | 37.306 | 23,89 | ||||
| 2026-02-11 | 13F | Simplex Trading, Llc | Put | 49.800 | 6,87 | 671 | ||||
| 2026-02-11 | 13F | Simplex Trading, Llc | Call | 62.300 | 291,82 | 839 | ||||
| 2026-02-17 | 13F | Tudor Investment Corp Et Al | 92.911 | 29,28 | 1.252 | 61,21 | ||||
| 2026-02-05 | 13F | Bessemer Group Inc | 81.500 | 0,00 | 1 | |||||
| 2026-01-29 | 13F | Pictet Asset Management Holding SA | 55.956 | 17,84 | 754 | 47,07 | ||||
| 2026-01-28 | 13F | Nvest Wealth Strategies, Inc. | 1.431 | 19 | ||||||
| 2026-02-11 | 13F | Group One Trading, L.p. | Put | 27.700 | 3,75 | 373 | 29,51 | |||
| 2026-02-12 | 13F | Brogan Financial, Inc. | 12.626 | 0,00 | 170 | 25,00 | ||||
| 2026-02-11 | 13F | BLI - Banque de Luxembourg Investments | 2.130.000 | 57,78 | 28.608 | 96,36 | ||||
| 2026-02-11 | 13F | Group One Trading, L.p. | Call | 98.300 | 686,40 | 1.324 | 880,74 | |||
| 2026-02-17 | 13F | Schonfeld Strategic Advisors LLC | 0 | -100,00 | 0 | |||||
| 2026-02-09 | 13F | Harbour Investments, Inc. | 4 | 0 | ||||||
| 2026-02-12 | 13F | BlackRock, Inc. | 54.745 | 3,41 | 737 | 29,07 | ||||
| 2026-02-13 | 13F | Arrowstreet Capital, Limited Partnership | 1.194.066 | 40,54 | 16.068 | 75,20 | ||||
| 2026-02-18 | 13F | Vident Advisory, LLC | 34.398 | 463 | ||||||
| 2026-02-13 | 13F | Y-Intercept (Hong Kong) Ltd | 0 | -100,00 | 0 | |||||
| 2026-02-11 | 13F | Prudential Plc | 25.692 | 346 | ||||||
| 2026-02-13 | 13F | Parkside Financial Bank & Trust | 87 | 0,00 | 1 | |||||
| 2026-02-10 | 13F | PCJ Investment Counsel Ltd. | 517.480 | 108,19 | 6.960 | 159,66 | ||||
| 2025-09-26 | NP | PMPIX - Precious Metals Ultrasector Profund Investor Class | 15.881 | 148 | ||||||
| 2026-02-14 | 13F | Rockefeller Capital Management L.P. | 500 | 66,67 | 7 | 100,00 | ||||
| 2025-09-24 | NP | IDEV - iShares Core MSCI International Developed Markets ETF | 173.112 | 40,86 | 1.612 | 19,07 | ||||
| 2026-02-13 | 13F | American Century Companies Inc | 1.493.208 | 66,86 | 20.083 | 108,08 | ||||
| 2026-02-17 | 13F | Advisor Group Holdings, Inc. | 47.399 | 428,53 | 638 | 551,02 | ||||
| 2026-01-28 | 13F | CAPROCK Group, Inc. | 28.513 | 1,61 | 384 | 23,87 | ||||
| 2026-02-10 | 13F | Avestar Capital, LLC | 42.600 | 0,00 | 574 | 24,57 | ||||
| 2026-02-10 | 13F | Bnp Paribas Arbitrage, Sa | 459.365 | -4,09 | 6.188 | 19,62 | ||||
| 2026-02-17 | 13F | Ewing Morris & Co. Investment Partners Ltd. | 71.000 | 0,00 | 968 | 26,41 | ||||
| 2026-02-12 | 13F | Northwest & Ethical Investments L.P. | 13.690 | 23,11 | 184 | 54,62 | ||||
| 2025-11-13 | 13F | Spark Investment Management LLC | 0 | -100,00 | 0 | -100,00 | ||||
| 2026-01-29 | 13F | IMC-Chicago, LLC | 0 | -100,00 | 0 | -100,00 | ||||
| 2026-01-14 | 13F | Baron Wealth Management LLC | 17.552 | 0,79 | 236 | 25,53 | ||||
| 2026-02-11 | 13F | Deutsche Bank Ag\ | 1.580.696 | 23,69 | 21.292 | 54,26 | ||||
| 2026-02-13 | 13F | Stifel Financial Corp | 0 | -100,00 | 0 | |||||
| 2026-02-13 | 13F | BRITISH COLUMBIA INVESTMENT MANAGEMENT Corp | 140.774 | -4,66 | 1.893 | 18,91 | ||||
| 2025-09-25 | NP | VGTSX - Vanguard Total International Stock Index Fund Investor Shares | 184.098 | 1.714 | ||||||
| 2026-02-17 | 13F | Bank Of America Corp /de/ | 1.626.130 | 74,88 | 21.904 | 118,11 | ||||
| 2026-02-10 | 13F | Goldman Sachs Group Inc | 274.656 | -86,63 | 3.700 | -83,32 | ||||
| 2026-02-12 | 13F | Hrt Financial Lp | 0 | -100,00 | 0 | |||||
| 2026-02-05 | 13F | Everstar Asset Management, LLC | 15.000 | -53,06 | 202 | -41,45 | ||||
| 2025-10-09 | 13F | Louisbourg Investments Inc. | 0 | -100,00 | 0 | |||||
| 2026-02-10 | 13F | Connor, Clark & Lunn Investment Management Ltd. | 7.692.670 | 6,08 | 103.473 | 32,33 | ||||
| 2026-02-11 | 13F | LPL Financial LLC | 60.549 | 816 | ||||||
| 2026-02-10 | 13F | Quantbot Technologies LP | 0 | -100,00 | 0 | |||||
| 2025-09-29 | NP | AIM SECTOR FUNDS (INVESCO SECTOR FUNDS) - Invesco Oppenheimer Gold & Special Minerals Fund Class C | 315.506 | 21.947,94 | 2.937 | 19.480,00 | ||||
| 2025-09-25 | NP | WELLS FARGO MASTER TRUST - Wells Fargo Real Return Portfolio Real Return Portfolio | 7.000 | 0,00 | 65 | -15,58 | ||||
| 2025-09-30 | NP | ASA Gold & Precious Metals Ltd | 6.200.000 | 0,00 | 68.572 | 4,64 | ||||
| 2025-11-07 | 13F | Shell Asset Management Co | 3.356 | -73,83 | 0 | |||||
| 2026-02-17 | 13F | Cantor Fitzgerald, L. P. | 0 | -100,00 | 0 | -100,00 | ||||
| 2026-02-17 | 13F | Russell Investments Group, Ltd. | 61.912 | 252,51 | 834 | 340,74 | ||||
| 2025-09-23 | NP | FKRCX - Franklin Gold & Precious Metals Fund Class A | 2.371.364 | -12,86 | 22.078 | -26,32 | ||||
| 2026-02-12 | 13F | Dimensional Fund Advisors Lp | 118.066 | -89,11 | 1.590 | -86,42 | ||||
| 2025-11-14 | 13F | Northern Trust Corp | 0 | -100,00 | 0 | -100,00 | ||||
| 2026-02-17 | 13F | Ninepoint Partners LP | 222.500 | 27,14 | 2.997 | 58,57 | ||||
| 2026-02-17 | 13F | Susquehanna International Group, Llp | Put | 223.600 | 29,92 | 3.012 | 62,06 | |||
| 2026-02-17 | 13F | Susquehanna International Group, Llp | Call | 916.700 | 1.988,15 | 12.348 | 2.504,85 | |||
| 2025-11-14 | 13F | Wolverine Trading, Llc | Call | 66.400 | 46,26 | 720 | 65,90 | |||
| 2025-11-14 | 13F | Wolverine Trading, Llc | Put | 11.700 | 127 | |||||
| 2025-10-21 | 13F | Global Retirement Partners, LLC | 0 | -100,00 | 0 | |||||
| 2026-01-27 | 13F | Zurcher Kantonalbank (Zurich Cantonalbank) | 93.333 | 38,69 | 1.257 | 73,24 | ||||
| 2026-02-17 | 13F | Two Sigma Investments, Lp | 296.591 | -31,58 | 3.995 | -14,65 | ||||
| 2026-01-23 | 13F | Ritholtz Wealth Management | 51.234 | 9,97 | 690 | 37,18 | ||||
| 2026-02-17 | 13F | Fairfax Financial Holdings Ltd/ Can | 31.817.229 | -44,00 | 423.611 | -30,61 | ||||
| 2026-02-11 | 13F | Group One Trading, L.p. | 0 | -100,00 | 0 | -100,00 | ||||
| 2026-02-12 | 13F | Nuveen, LLC | 226.059 | 0,00 | 3.044 | 24,86 | ||||
| 2026-02-11 | 13F | Simplex Trading, Llc | 0 | -100,00 | 0 | |||||
| 2025-11-14 | 13F | Wolverine Trading, Llc | 20.787 | 93,62 | 226 | 120,59 | ||||
| 2026-02-06 | 13F | IFP Advisors, Inc | 3.695 | -9,46 | 50 | 11,36 | ||||
| 2025-10-27 | 13F | Kiker Wealth Management, LLC | 0 | -100,00 | 0 | |||||
| 2026-02-13 | 13F | Manufacturers Life Insurance Company, The | 0 | -100,00 | 0 | |||||
| 2026-02-12 | 13F | Robotti Robert | 15.000 | 0,00 | 162 | 0,00 | ||||
| 2025-09-25 | NP | DFSI - Dimensional International Sustainability Core 1 ETF | 6.636 | 0,00 | 62 | -15,28 | ||||
| 2025-09-25 | NP | DFA INVESTMENT DIMENSIONS GROUP INC - International Sustainability Core 1 Portfolio Shares | 16.751 | 0,00 | 156 | -15,22 | ||||
| 2026-02-04 | 13F | First Eagle Investment Management, LLC | 4.769.471 | -29,02 | 64.148 | -11,47 | ||||
| 2026-02-12 | 13F | Swiss National Bank | 601.700 | 1,02 | 8.109 | 26,19 | ||||
| 2026-02-13 | 13F | Goehring & Rozencwajg Associates, LLC | 777.949 | -34,22 | 10.464 | -17,95 | ||||
| 2025-11-10 | 13F | Hillsdale Investment Management Inc. | 0 | -100,00 | 0 | -100,00 | ||||
| 2026-02-05 | 13F | Phoenix Holdings Ltd. | 0 | -100,00 | 0 | |||||
| 2025-09-26 | NP | SGGDX - First Eagle Gold Fund Class A | 6.549.227 | -16,47 | 60.974 | -29,38 | ||||
| 2026-02-17 | 13F | Raymond James Financial Inc | 24.746 | 121,24 | 333 | 177,50 | ||||
| 2026-01-21 | 13F/A | Euro Pacific Asset Management, LLC | 867.495 | 159,44 | 11 | 266,67 | ||||
| 2026-02-17 | 13F | Alliancebernstein L.p. | 240.238 | -14,50 | 3.236 | 6,66 | ||||
| 2026-01-14 | 13F | ORG Partners LLC | 110 | 1 | ||||||
| 2026-02-13 | 13F | Formula Growth Ltd | 182.000 | 2.452 | ||||||
| 2026-02-09 | 13F | Geode Capital Management, Llc | 205.626 | 54,59 | 2.817 | 95,28 | ||||
| 2026-01-16 | 13F | Ronald Blue Trust, Inc. | 661 | 0,00 | 9 | 14,29 | ||||
| 2026-02-12 | 13F | Bank Of Montreal /can/ | 1.587.968 | -19,56 | 21.358 | 0,34 | ||||
| 2026-02-02 | 13F | Intact Investment Management Inc. | 470.029 | -13,59 | 6.321 | 7,74 | ||||
| 2026-02-13 | 13F | Centiva Capital, LP | 0 | -100,00 | 0 | |||||
| 2026-02-13 | 13F | Wells Fargo & Company/mn | Call | 0 | -100,00 | 0 | -100,00 | |||
| 2026-02-13 | 13F | Caitong International Asset Management Co., Ltd | 2.162 | 29 | ||||||
| 2025-11-14 | 13F | Point72 Asia (Singapore) Pte. Ltd. | 36.660 | 396 |