Grundlæggende statistik
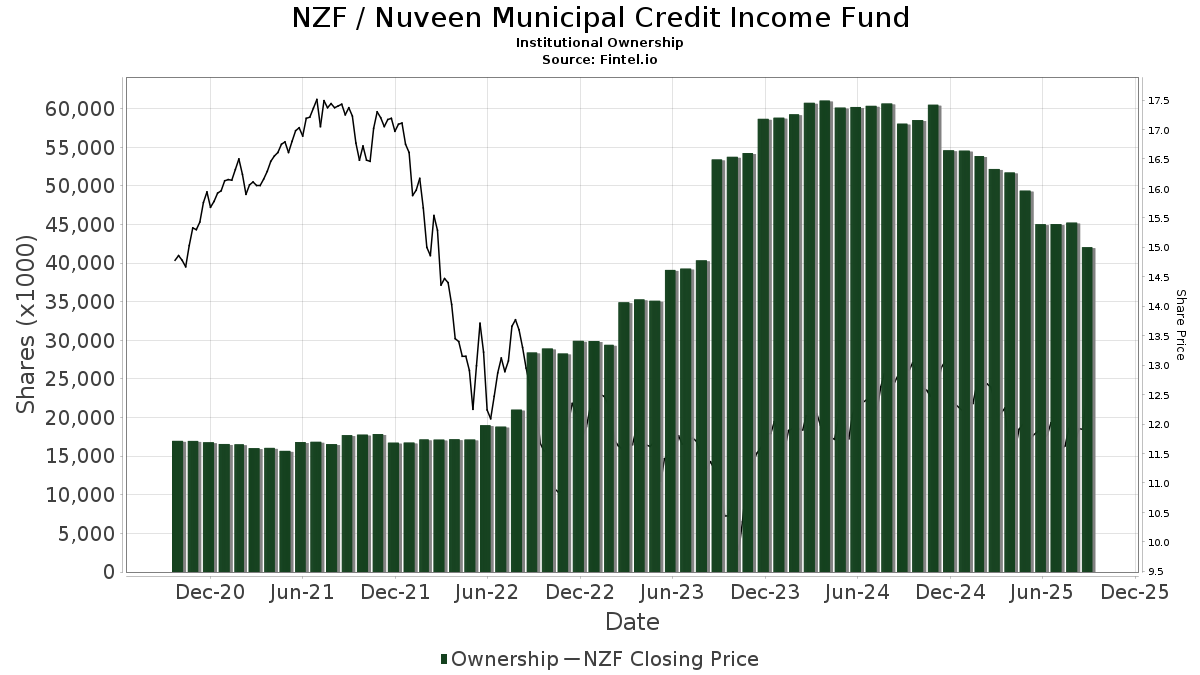
| Institutionelle ejere | 235 total, 235 long only, 0 short only, 0 long/short - change of -5,22% MRQ |
| Gennemsnitlig porteføljeallokering | 0.1438 % - change of -11,29% MRQ |
| Institutionelle aktier (lange) | 35.200.734 (ex 13D/G) - change of -5,86MM shares -14,28% MRQ |
| Institutionel værdi (lang) | $ 418.701 USD ($1000) |
Institutionelt ejerskab og aktionærer
Nuveen Municipal Credit Income Fund (US:NZF) har 235 institutionelle ejere og aktionærer, der har indsendt 13D/G- eller 13F-formularer til Securities Exchange Commission (SEC). Disse institutioner har i alt 35,200,734 aktier. Største aktionærer omfatter Morgan Stanley, Bank Of America Corp /de/, UBS Group AG, Wells Fargo & Company/mn, Guggenheim Capital Llc, Hennion & Walsh Asset Management, Inc., Raymond James Financial Inc, Van Eck Associates Corp, Royal Bank Of Canada, and XMPT - VanEck Vectors CEF Municipal Income ETF .
Nuveen Municipal Credit Income Fund (NYSE:NZF) institutionel ejerskabsstruktur viser aktuelle positioner i virksomheden efter institutioner og fonde, samt seneste ændringer i positionsstørrelse. Større aktionærer kan omfatte individuelle investorer, investeringsforeninger, hedgefonde eller institutioner. Skema 13D angiver, at investoren besidder (eller besidder) mere end 5 % af virksomheden og har til hensigt (eller har til hensigt at) aktivt at forfølge en ændring i forretningsstrategi. Skema 13G indikerer en passiv investering på over 5%.
The share price as of March 10, 2026 is 12,76 / share. Previously, on March 11, 2025, the share price was 12,44 / share. This represents an increase of 2,57% over that period.
Fondens stemningsscore
Fund Sentiment Score (fka Ownership Accumulation Score) finder de aktier, der bliver mest købt af fonde. Det er resultatet af en sofistikeret, multi-faktor kvantitativ model, der identificerer virksomheder med de højeste niveauer af institutionel akkumulering. Scoringsmodellen bruger en kombination af den samlede stigning i oplyste ejere, ændringerne i porteføljeallokeringer i disse ejere og andre målinger. Tallet går fra 0 til 100, hvor højere tal indikerer et højere niveau af akkumulering for sine jævnaldrende, og 50 er gennemsnittet.
Opdateringsfrekvens: Dagligt
Se Ownership Explorer, som giver en liste over højest rangerende virksomheder.
AI+ Ask Fintel’s AI assistant about Nuveen Municipal Credit Income Fund.
Select a question to share a public post with an AI-crafted answer.
Thinking of good questions…
Institutionel Put/Call-forhold
Ud over at indberette standardaktie- og gældsudstedelser skal institutter med mere end 100 mill. aktiver under forvaltning også oplyse deres put- og call-optionsbeholdninger. Da salgsoptioner generelt indikerer negativ stemning, og købsoptioner indikerer positiv stemning, kan vi få en fornemmelse af den overordnede institutionelle stemning ved at plotte forholdet mellem put og kald. Diagrammet til højre viser det historiske put/call-forhold for dette instrument.
Brug af Put/Call Ratio som en indikator for investorernes stemning overvinder en af de vigtigste mangler ved at bruge totalt institutionelt ejerskab, som er, at en betydelig mængde af aktiver under forvaltning investeres passivt for at spore indekser. Passivt forvaltede fonde køber typisk ikke optioner, så indikatoren for put/call-forholdet følger mere nøje følelsen af aktivt forvaltede fonde.
13F og NPORT arkivering
Detaljer om 13F-arkivering er gratis. Detaljer om NP-ansøgninger kræver et premium-medlemskab. Grønne rækker angiver nye positioner. Røde rækker angiver lukkede positioner. Klik på linket ikon for at se den fulde transaktionshistorik.
Opgrader
for at låse premium-data op og eksportere til Excel ![]() .
.
| Fil dato | Kilde | Investor | Type | Gennemsnitlig pris (Øst) |
Aktier | Δ Aktier (%) |
Rapporteret Værdi ($1000) |
Δ Værdi (%) |
Port Alloc (%) |
|
|---|---|---|---|---|---|---|---|---|---|---|
| 2026-02-12 | 13F | Wealthspire Advisors, LLC | 0 | -100,00 | 0 | |||||
| 2025-11-12 | 13F | Advisor OS, LLC | 0 | -100,00 | 0 | |||||
| 2026-01-23 | 13F | Atala Financial Inc | 20.080 | -22,70 | 253 | -22,70 | ||||
| 2026-02-10 | 13F | Sfmg, Llc | 12.680 | 0,00 | 160 | 0,00 | ||||
| 2026-01-08 | 13F | Wealth Enhancement Advisory Services, Llc | 59.964 | 3,88 | 763 | 7,02 | ||||
| 2026-02-11 | 13F | Parallel Advisors, LLC | 0 | -100,00 | 0 | |||||
| 2026-02-02 | 13F | Fifth Third Bancorp | 4.241 | 33,87 | 53 | 35,90 | ||||
| 2026-02-17 | 13F | Quantinno Capital Management LP | 13.072 | 2,54 | 164 | 2,50 | ||||
| 2026-01-23 | 13F | Sunpointe, LLC | 50.441 | -2,97 | 635 | -3,50 | ||||
| 2026-01-28 | 13F | WPG Advisers, LLC | 734 | -30,29 | 9 | -30,77 | ||||
| 2026-02-02 | 13F | Eq Wealth Advisors, Llc | 17.697 | 0,00 | 223 | 0,00 | ||||
| 2026-01-26 | 13F | PFG Investments, LLC | 29.237 | -8,92 | 368 | -8,93 | ||||
| 2026-02-09 | 13F | Cary Street Partners Financial Llc | 31.590 | 12,06 | 397 | 12,15 | ||||
| 2026-01-07 | 13F | Lake Street Financial Llc | 314.150 | 27,39 | 3.952 | 27,61 | ||||
| 2026-02-12 | 13F | StoneX Group Inc. | 409.195 | 5,71 | 5.148 | 5,56 | ||||
| 2025-11-14 | 13F | Brass Tax Wealth Management, Inc | 30.830 | 0,00 | 387 | 5,45 | ||||
| 2025-11-04 | 13F | United Community Bank | 0 | -100,00 | 0 | |||||
| 2025-11-12 | 13F | Creekmur Asset Management LLC | 463 | 0,00 | 6 | 0,00 | ||||
| 2026-02-12 | 13F | Marex Group plc | 13.200 | 166 | ||||||
| 2026-02-06 | 13F | Larson Financial Group LLC | 5.256 | 5,12 | 66 | 6,45 | ||||
| 2026-01-27 | 13F | Greatmark Investment Partners, Inc. | 331.096 | 1,24 | 4.165 | 1,41 | ||||
| 2026-02-13 | 13F | Glen Eagle Advisors, LLC | 12.059 | 152 | ||||||
| 2025-10-08 | 13F/A | Simon Quick Advisors, Llc | 0 | -100,00 | 0 | |||||
| 2026-02-10 | 13F | Envestnet Asset Management Inc | 180.448 | 19,18 | 2.270 | 19,41 | ||||
| 2026-02-17 | 13F | Guggenheim Capital Llc | 1.770.141 | 11,66 | 22.268 | 11,84 | ||||
| 2025-11-14 | 13F | Elequin Capital Lp | 0 | -100,00 | 0 | -100,00 | ||||
| 2026-02-10 | 13F | Rothschild Investment Llc | 11.279 | 0,00 | 142 | 0,00 | ||||
| 2026-02-10 | 13F | Goldman Sachs Group Inc | 93.101 | 4,37 | 1.171 | 4,55 | ||||
| 2026-02-11 | 13F | Horizon Kinetics Asset Management Llc | 25.965 | -6,25 | 327 | -6,05 | ||||
| 2026-01-12 | 13F | Foster Group, Inc. | 10.599 | 133 | ||||||
| 2026-02-02 | 13F | Kim, Llc | 250.000 | 0,00 | 3.145 | 0,16 | ||||
| 2026-01-29 | 13F | James Investment Research Inc | 0 | -100,00 | 0 | |||||
| 2026-01-14 | 13F | Tradewinds Capital Management, LLC | 11.508 | 0,00 | 145 | 0,00 | ||||
| 2026-02-17 | 13F | Ancora Advisors, LLC | 3.199 | 0,00 | 40 | 0,00 | ||||
| 2026-01-07 | 13F | Harbor Investment Advisory, Llc | 1.465 | 0,00 | 18 | 0,00 | ||||
| 2026-01-16 | 13F | Piscataqua Savings Bank | 4.760 | 0,00 | 60 | 0,00 | ||||
| 2026-02-11 | 13F | Closed-End Fund Advisors, Inc. | 69.887 | 879 | ||||||
| 2026-02-13 | 13F | Archetype Wealth Partners | 22.258 | -13,02 | 0 | |||||
| 2026-02-09 | 13F | Prospera Financial Services Inc | 195.094 | 15,81 | 2.454 | 16,03 | ||||
| 2025-11-06 | 13F | Stratos Wealth Advisors, LLC | 0 | -100,00 | 0 | -100,00 | ||||
| 2026-01-29 | 13F | Wealth Alliance Advisory Group, LLC | 79.985 | 18,81 | 1.006 | 19,05 | ||||
| 2026-01-14 | 13F | Hennion & Walsh Asset Management, Inc. | 1.327.751 | -15,78 | 16.703 | -15,65 | ||||
| 2026-02-13 | 13F | Venture Visionary Partners LLC | 53.192 | -9,02 | 669 | -8,86 | ||||
| 2026-02-17 | 13F | Alpine Global Management, LLC | 108.218 | -19,84 | 1.361 | -19,71 | ||||
| 2026-02-17 | 13F | Bank Of America Corp /de/ | 3.154.922 | 0,83 | 39.689 | 0,99 | ||||
| 2025-10-20 | 13F | Allspring Global Investments Holdings, LLC | 0 | -100,00 | 0 | |||||
| 2026-02-02 | 13F | Oppenheimer & Co Inc | 18.222 | -14,04 | 229 | -13,91 | ||||
| 2026-02-17 | 13F | Dv Equities, Llc | 700 | 9 | ||||||
| 2026-03-04 | 13F | Hayek Kallen Investment Management | 0 | -100,00 | 0 | |||||
| 2026-02-11 | 13F | J.w. Cole Advisors, Inc. | 27.745 | -7,21 | 349 | -6,93 | ||||
| 2026-02-17 | 13F | Raymond James Financial Inc | 1.094.266 | 5,15 | 13.766 | 5,31 | ||||
| 2026-01-22 | 13F | Bfsg, Llc | 1.663 | 0,00 | 21 | 0,00 | ||||
| 2026-01-29 | 13F | Camelot Portfolios, LLC | 15.400 | -10,45 | 194 | -10,23 | ||||
| 2026-02-17 | 13F | Scarborough Advisors, LLC | 547 | 0,00 | 7 | 0,00 | ||||
| 2026-02-09 | 13F | Powell Investment Advisors, LLC | 13.096 | 2,29 | 165 | 1,86 | ||||
| 2026-02-12 | 13F | Hollencrest Capital Management | 33.383 | 90,87 | 420 | 91,32 | ||||
| 2026-01-20 | 13F | Savvy Advisors, Inc. | 33.058 | 15,23 | 416 | 15,28 | ||||
| 2026-02-17 | 13F | Equitable Holdings, Inc. | 23.467 | 44,79 | 295 | 45,32 | ||||
| 2026-01-29 | 13F | Sanctuary Advisors, LLC | 59.324 | -0,94 | 746 | -0,80 | ||||
| 2026-01-26 | 13F | River Street Advisors LLC | 34.431 | 60,66 | 433 | 60,97 | ||||
| 2026-02-03 | 13F | Koshinski Asset Management, Inc. | 32.668 | 6,91 | 411 | 7,05 | ||||
| 2026-02-10 | 13F | Lido Advisors, LLC | 132.003 | 0,00 | 1.668 | 0,00 | ||||
| 2026-02-13 | 13F | Kestra Advisory Services, LLC | 366.463 | -0,38 | 4.610 | -0,22 | ||||
| 2026-02-13 | 13F | Morgan Stanley | 3.608.808 | -14,10 | 45.399 | -13,97 | ||||
| 2026-01-20 | 13F | Trust Co Of Toledo Na /oh/ | 1.791 | 0,00 | 23 | 0,00 | ||||
| 2025-11-14 | 13F | Rareview Capital LLC | 0 | -100,00 | 0 | -100,00 | ||||
| 2026-02-13 | 13F | First Trust Advisors Lp | 13.108 | 5,94 | 165 | 5,81 | ||||
| 2026-01-07 | 13F | Permanent Capital Management, LP | 0 | -100,00 | 0 | |||||
| 2026-02-12 | 13F | Bank Of Montreal /can/ | 0 | -100,00 | 0 | |||||
| 2026-02-12 | 13F | Wedbush Securities Inc | 69.380 | -4,00 | 1 | |||||
| 2026-02-06 | 13F | Commonwealth Financial Services, LLC | 11.164 | 0,00 | 140 | 0,00 | ||||
| 2026-02-06 | 13F | IFP Advisors, Inc | 2.660 | 0,00 | 33 | 0,00 | ||||
| 2026-01-08 | 13F | Sound View Wealth Advisors Group, LLC | 12.478 | 0,00 | 157 | 0,00 | ||||
| 2026-01-28 | 13F | Chicago Partners Investment Group LLC | 27.715 | 1,90 | 338 | -0,59 | ||||
| 2026-02-03 | 13F | Primoris Wealth Advisors, Llc | 60.755 | 0,00 | 764 | 0,13 | ||||
| 2026-02-17 | 13F | Captrust Financial Advisors | 54.595 | 4,53 | 687 | 4,57 | ||||
| 2026-02-09 | 13F | Investors Portfolio Services LLC | 3.463 | 44 | ||||||
| 2026-02-18 | 13F | Garton & Associates Financial Advisors LLC | 2.680 | 34 | ||||||
| 2026-01-27 | 13F | Busey Wealth Management | 11.118 | -34,86 | 140 | -35,05 | ||||
| 2025-10-22 | 13F | Kercheville Advisors, LLC | 0 | -100,00 | 0 | |||||
| 2026-01-05 | 13F | Coastline Trust Co | 6.975 | 0,00 | 88 | 0,00 | ||||
| 2026-01-14 | 13F | Shulman DeMeo Asset Management LLC | 16.386 | -0,39 | 206 | 0,00 | ||||
| 2026-01-27 | 13F | Compass Financial Group, INC/SD | 162.989 | 1,27 | 2.050 | 1,43 | ||||
| 2026-02-17 | 13F | Ameriprise Financial Inc | 162.733 | -11,54 | 2.011 | -12,99 | ||||
| 2026-02-17 | 13F | Vista Investment Management | 16.067 | 0,00 | 202 | 0,50 | ||||
| 2026-02-03 | 13F | International Assets Investment Management, Llc | 1.578 | 20 | ||||||
| 2026-01-20 | 13F | Coastal Investment Advisors, Inc. | 20.502 | 0,00 | 258 | 0,00 | ||||
| 2026-02-17 | 13F | Advisory Services Network, LLC | 41.648 | 5,10 | 524 | 5,23 | ||||
| 2026-02-12 | 13F | Gould Capital, LLC | 73.165 | -2,23 | 920 | -2,02 | ||||
| 2026-02-13 | 13F | Wealth Dimensions Group, Ltd. | 17.900 | 0,00 | 225 | 0,45 | ||||
| 2026-01-30 | 13F | Us Bancorp \de\ | 19.991 | -42,94 | 251 | -42,95 | ||||
| 2026-01-29 | 13F | Ashton Thomas Private Wealth, LLC | 28.400 | 5,58 | 357 | 5,31 | ||||
| 2026-02-11 | 13F | Mitchell Mcleod Pugh & Williams Inc | 11.000 | 140 | ||||||
| 2025-11-12 | 13F | Park Square Financial Group, LLC | 0 | -100,00 | 0 | |||||
| 2026-02-17 | 13F | Private Advisor Group, LLC | 49.368 | -16,17 | 621 | -15,97 | ||||
| 2025-10-01 | 13F | Caldwell Trust Co | 0 | -100,00 | 0 | -100,00 | ||||
| 2026-02-05 | 13F | Pacitti Group Inc. | 23.856 | 3,08 | 300 | 3,45 | ||||
| 2025-09-24 | NP | XMPT - VanEck Vectors CEF Municipal Income ETF | 973.333 | 1,09 | 11.388 | -0,70 | ||||
| 2026-02-13 | 13F | MAI Capital Management | 22.674 | 0,05 | 285 | 0,35 | ||||
| 2026-02-11 | 13F | Curio Wealth, Llc | 0 | -100,00 | 0 | |||||
| 2026-01-27 | 13F | GHP Investment Advisors, Inc. | 917 | 0,00 | 12 | 0,00 | ||||
| 2026-01-30 | 13F | Kohmann Bosshard Financial Services, LLC | 1.500 | 19 | ||||||
| 2026-02-04 | 13F | Rinkey Investments | 40.925 | 0,00 | 515 | 0,00 | ||||
| 2026-02-19 | 13F | Invesco Ltd. | 206.516 | 2,78 | 2.598 | 2,93 | ||||
| 2026-02-18 | 13F | Beacon Pointe Advisors, LLC | 10.550 | 2,89 | 133 | 3,13 | ||||
| 2026-01-23 | 13F | Summit Financial Consulting LLC | 28.757 | 13,35 | 362 | 13,52 | ||||
| 2026-02-11 | 13F | Fiera Capital Corp | 0 | -100,00 | 0 | |||||
| 2026-02-04 | 13F | Pensionmark Financial Group, Llc | 77.379 | 20,95 | 810 | 0,87 | ||||
| 2026-01-15 | 13F | Bernard Wealth Management Corp. | 4.600 | 0,00 | 58 | 0,00 | ||||
| 2026-02-17 | 13F | Tower Research Capital LLC (TRC) | 1.648 | 21 | ||||||
| 2026-01-26 | 13F | Old Point Trust & Financial Services N A | 1.351 | 17 | ||||||
| 2025-11-05 | 13F | Plante Moran Financial Advisors, LLC | 0 | -100,00 | 0 | |||||
| 2026-02-17 | 13F | North Capital, Inc. | 0 | -100,00 | 0 | |||||
| 2026-01-14 | 13F | Jfs Wealth Advisors, Llc | 4.330 | 2,53 | 54 | 1,89 | ||||
| 2026-02-13 | 13F | Cohen & Steers, Inc. | 305.295 | 0,00 | 4 | 0,00 | ||||
| 2026-02-03 | 13F | We Are One Seven, LLC | 14.815 | -4,47 | 186 | -4,12 | ||||
| 2026-01-23 | 13F | Farther Finance Advisors, LLC | 860 | 497,22 | 11 | 900,00 | ||||
| 2026-02-23 | 13F | Virtu Financial LLC | 18.843 | 0 | ||||||
| 2026-01-29 | 13F | ProVise Management Group, LLC | 15.922 | 13,23 | 200 | 13,64 | ||||
| 2025-11-13 | 13F | Newbridge Financial Services Group, Inc. | 0 | -100,00 | 0 | -100,00 | ||||
| 2025-10-30 | 13F | Traub Capital Management LLC | 0 | -100,00 | 0 | |||||
| 2026-01-21 | 13F | Petra Financial Advisors Inc | 108.521 | -8,40 | 1.365 | -8,27 | ||||
| 2026-02-10 | 13F/A | Northwestern Mutual Wealth Management Co | 309.591 | -0,45 | 3.895 | -0,28 | ||||
| 2025-11-06 | 13F | Linden Thomas Advisory Services, LLC | 0 | -100,00 | 0 | |||||
| 2026-02-13 | 13F | SRS Capital Advisors, Inc. | 9.463 | 1,97 | 119 | 2,59 | ||||
| 2026-01-13 | 13F | Capital Investment Advisors, LLC | 151.423 | -15,04 | 1.905 | -14,92 | ||||
| 2026-02-11 | 13F | Allianz Asset Management GmbH | 462.380 | 0,00 | 5.817 | 0,15 | ||||
| 2026-01-23 | 13F | Tyche Wealth Partners LLC | 75.328 | -2,54 | 948 | -2,37 | ||||
| 2026-02-17 | 13F | Colter Lewis Investment Partners LLC | 110.104 | 1.385 | ||||||
| 2026-01-08 | 13F | GSG Advisors LLC | 25.843 | -46,19 | 325 | -46,55 | ||||
| 2026-02-05 | 13F | Thrivent Financial For Lutherans | 11.001 | 0,00 | 0 | |||||
| 2026-02-13 | 13F | Arete Wealth Advisors, LLC | 16.381 | -17,91 | 0 | |||||
| 2026-02-13 | 13F | Van Eck Associates Corp | 986.350 | -1,29 | 12 | 0,00 | ||||
| 2026-02-03 | 13F | Indivisible Partners | 39.361 | 495 | ||||||
| 2026-01-21 | 13F | SJS Investment Consulting Inc. | 2.581 | 0,00 | 32 | 0,00 | ||||
| 2026-02-13 | 13F | Williams Jones Wealth Management, LLC. | 0 | -100,00 | 0 | |||||
| 2026-02-06 | 13F | Aviance Capital Partners, LLC | 25.878 | 0,54 | 326 | 0,62 | ||||
| 2026-01-27 | 13F | Duncker Streett & Co Inc | 40.409 | 0,00 | 508 | 0,20 | ||||
| 2026-01-14 | 13F | Lantz Financial LLC | 10.495 | -3,90 | 132 | -3,65 | ||||
| 2026-02-03 | 13F | Plan Group Financial, LLC | 38.665 | 1,05 | 486 | 1,25 | ||||
| 2026-02-17 | 13F | Perennial Investment Advisors, LLC | 33.960 | 48,24 | 427 | 48,78 | ||||
| 2026-02-13 | 13F | Aptus Capital Advisors, LLC | 17.243 | 0,00 | 217 | 0,00 | ||||
| 2026-02-02 | 13F | Montag A & Associates Inc | 873 | 0,00 | 11 | -9,09 | ||||
| 2025-10-28 | 13F | Csenge Advisory Group | 0 | -100,00 | 0 | |||||
| 2026-01-26 | 13F | Sightline Wealth Advisors, LLC | 13.575 | 171 | ||||||
| 2026-01-13 | 13F | CoreCap Advisors, LLC | 3.423 | 0,00 | 43 | 2,38 | ||||
| 2026-02-17 | 13F | Modern Wealth Management, LLC | 0 | -100,00 | 0 | |||||
| 2026-02-17 | 13F | Family Management Corp | 14.889 | 0,00 | 187 | 0,00 | ||||
| 2025-11-07 | 13F | Jpmorgan Chase & Co | 0 | -100,00 | 0 | |||||
| 2026-02-12 | 13F | Principal Securities, Inc. | 0 | -100,00 | 0 | |||||
| 2025-11-03 | 13F | Bank of New York Mellon Corp | 0 | -100,00 | 0 | -100,00 | ||||
| 2025-10-21 | 13F | Optimum Investment Advisors | 6.686 | 0,00 | 84 | 5,06 | ||||
| 2026-01-23 | 13F | Assetmark, Inc | 1.932 | 0,00 | 24 | 0,00 | ||||
| 2026-02-17 | 13F | Northern Trust Corp | 23.810 | 0,00 | 300 | 0,00 | ||||
| 2026-02-06 | 13F | Axxcess Wealth Management, Llc | 29.604 | 0,00 | 372 | 0,27 | ||||
| 2026-01-27 | 13F | Financial Management Professionals, Inc. | 2.044 | 2,56 | 26 | 0,00 | ||||
| 2026-02-06 | 13F | Pathway Financial Advisers, LLC | 0 | -100,00 | 0 | |||||
| 2026-02-05 | 13F | Burford Brothers, Inc. | 22.850 | 0,00 | 287 | 0,35 | ||||
| 2026-01-05 | 13F | Noble Wealth Management PBC | 2.601 | 0,00 | 33 | 0,00 | ||||
| 2026-02-04 | 13F | Mascoma Wealth Management LLC | 1.069 | 0,00 | 13 | 0,00 | ||||
| 2026-02-11 | 13F | M Holdings Securities, Inc. | 34.567 | 0 | ||||||
| 2026-01-29 | 13F | McGowan Group Asset Management, Inc. | 452.589 | 8,70 | 5.694 | 8,87 | ||||
| 2026-02-18 | 13F | GWM Advisors LLC | 0 | -100,00 | 0 | |||||
| 2025-09-23 | NP | MMHVX - MainStay MacKay High Yield Municipal Bond Fund Investor Class | 721.308 | 0,00 | 8.439 | -1,76 | ||||
| 2026-01-09 | 13F | Westview Management dba Westview Investment Advisors | 118.124 | 1.486 | ||||||
| 2026-02-13 | 13F | Mariner, LLC | 53.072 | 8,10 | 668 | 8,28 | ||||
| 2026-02-11 | 13F | Walter & Keenan Financial Consulting Co /mi/ /adv | 37.009 | -9,16 | 466 | -9,00 | ||||
| 2026-01-27 | 13F | Novem Group | 12.500 | 0,00 | 157 | 0,00 | ||||
| 2026-02-05 | 13F | Cambridge Investment Research Advisors, Inc. | 219.510 | -32,52 | 3 | -50,00 | ||||
| 2026-02-12 | 13F | Carson Advisory Inc. | 134.060 | -0,34 | 1.686 | -0,18 | ||||
| 2026-02-13 | 13F | Colony Group, LLC | 25.495 | 321 | ||||||
| 2026-02-17 | 13F | Cetera Investment Advisers | 532.929 | -5,30 | 6.704 | -5,14 | ||||
| 2026-02-10 | 13F | Edgemoor Investment Advisors, Inc. | 245.944 | 10,61 | 3.094 | 10,78 | ||||
| 2026-02-11 | 13F | Janney Montgomery Scott LLC | 70.197 | 5,25 | 1 | |||||
| 2026-02-04 | 13F | Fourth Dimension Wealth, LLC | 2.134 | -49,99 | 27 | -50,94 | ||||
| 2026-02-06 | 13F | Motco | 286 | 0,00 | 4 | 0,00 | ||||
| 2026-01-26 | 13F | Cwm, Llc | 805 | 1,13 | 0 | |||||
| 2026-01-21 | 13F | Prime Capital Investment Advisors, LLC | 0 | -100,00 | 0 | -100,00 | ||||
| 2026-02-02 | 13F | Truist Financial Corp | 251.123 | 22,52 | 3.159 | 22,73 | ||||
| 2026-01-20 | 13F | Stratos Wealth Partners, LTD. | 28.772 | -8,62 | 362 | -8,61 | ||||
| 2026-01-12 | 13F | Daymark Wealth Partners, Llc | 29.794 | 2,31 | 375 | 2,47 | ||||
| 2025-11-14 | 13F | Hrt Financial Lp | 0 | -100,00 | 0 | |||||
| 2026-01-29 | 13F | UBS Group AG | 2.169.085 | -9,64 | 27.287 | -9,50 | ||||
| 2026-02-06 | 13F | EverSource Wealth Advisors, LLC | 3.300 | 0,00 | 42 | 0,00 | ||||
| 2025-11-14 | 13F | Integrated Wealth Concepts LLC | 0 | -100,00 | 0 | |||||
| 2026-02-05 | 13F | Bessemer Group Inc | 5.643 | 0 | ||||||
| 2026-02-11 | 13F | Cerity Partners LLC | 21.289 | 268 | ||||||
| 2026-02-13 | 13F | Stifel Financial Corp | 651.477 | 4,85 | 8.196 | 5,01 | ||||
| 2026-02-17 | 13F | Regal Investment Advisors LLC | 19.617 | -41,31 | 247 | -41,29 | ||||
| 2026-02-03 | 13F | Wesbanco Bank Inc | 11.100 | -4,33 | 140 | -4,14 | ||||
| 2026-02-06 | 13F | HighTower Advisors, LLC | 460.769 | 1,37 | 5.796 | 1,52 | ||||
| 2026-01-09 | 13F | Park Place Capital Corp | 24.000 | -30,94 | 302 | -30,96 | ||||
| 2026-02-17 | 13F | Summit Trail Advisors, Llc | 0 | -100,00 | 0 | |||||
| 2026-01-16 | 13F | Catalina Capital Group, LLC | 23.221 | -25,55 | 292 | -25,32 | ||||
| 2026-02-17 | 13F | MGB Wealth Management, LLC | 53.019 | 15,26 | 667 | 15,42 | ||||
| 2026-01-07 | 13F | Precedent Wealth Partners, Llc | 10.951 | 0,00 | 138 | 0,00 | ||||
| 2026-03-03 | 13F | NWF Advisory Services Inc. | 19.800 | 0,00 | 249 | 0,40 | ||||
| 2026-02-12 | 13F | Chilton Capital Management Llc | 2.633 | 0,00 | 33 | 0,00 | ||||
| 2026-02-14 | 13F | Rockefeller Capital Management L.P. | 360.918 | -2,48 | 4.540 | -2,32 | ||||
| 2025-11-07 | 13F | Beacon Capital Management, LLC | 0 | -100,00 | 0 | |||||
| 2026-01-15 | 13F | Highline Wealth Partners Llc | 650 | 0,00 | 8 | 0,00 | ||||
| 2026-02-09 | 13F | Huntington National Bank | 0 | -100,00 | 0 | |||||
| 2026-02-13 | 13F | Truvestments Capital Llc | 1.000 | 0,00 | 13 | 0,00 | ||||
| 2026-01-29 | 13F | St. Johns Investment Management Company, LLC | 1.058 | 0,00 | 13 | 0,00 | ||||
| 2026-02-12 | 13F | CF Capital LLC | 223.536 | -12,85 | 2.812 | -12,70 | ||||
| 2026-02-17 | 13F | Mercer Global Advisors Inc /adv | 13.262 | -1,85 | 167 | -1,78 | ||||
| 2026-01-16 | 13F | Melfa Wealth Management, Llc | 16.990 | -42,39 | 214 | -42,43 | ||||
| 2026-01-29 | 13F | Nbc Securities, Inc. | 2.730 | 0,66 | 34 | 0,00 | ||||
| 2026-01-14 | 13F | Congress Park Capital LLC | 425.000 | -19,05 | 5.346 | -18,93 | ||||
| 2026-02-17 | 13F | Ibex Wealth Advisors | 30.039 | 0,00 | 378 | 0,00 | ||||
| 2026-01-29 | 13F | Concurrent Investment Advisors, LLC | 11.667 | 0,44 | 147 | 0,69 | ||||
| 2026-02-06 | 13F | Signature Estate & Investment Advisors Llc | 23.912 | 2,68 | 301 | 2,74 | ||||
| 2026-02-13 | 13F | Commerce Bank | 11.580 | -14,73 | 146 | -14,71 | ||||
| 2026-02-12 | 13F | Hm Payson & Co | 2.517 | 0,00 | 32 | 0,00 | ||||
| 2026-02-13 | 13F | PCM Encore, LLC | 11.220 | 141 | ||||||
| 2026-02-13 | 13F | Wells Fargo & Company/mn | 1.825.921 | 5,55 | 22.970 | 5,73 | ||||
| 2026-02-05 | 13F | Presper Financial Architects, LLC | 22.126 | -11,38 | 278 | -11,18 | ||||
| 2026-02-13 | 13F | Uniting Wealth Partners, LLC | 0 | -100,00 | 0 | |||||
| 2026-02-10 | 13F | Moors & Cabot, Inc. | 16.383 | 0,84 | 206 | 0,98 | ||||
| 2026-02-14 | 13F | Whipplewood Advisors, LLC | 46.022 | -0,26 | 579 | -0,17 | ||||
| 2026-02-06 | 13F | GPS Wealth Strategies Group, LLC | 316 | 1,94 | 4 | 0,00 | ||||
| 2026-02-09 | 13F | Harbour Investments, Inc. | 31.004 | 0,00 | 390 | 0,26 | ||||
| 2026-01-16 | 13F | Formidable Asset Management, LLC | 0 | -100,00 | 0 | |||||
| 2026-01-23 | 13F | Rsm Us Wealth Management Llc | 18.006 | -32,19 | 229 | -31,64 | ||||
| 2026-02-06 | 13F | Global Retirement Partners, LLC | 26.585 | 426,33 | 334 | 430,16 | ||||
| 2026-02-06 | 13F | Intellus Advisors LLC | 69.025 | -1,26 | 868 | -1,03 | ||||
| 2026-02-12 | 13F | Brinker Capital Investments, LLC | 42.128 | 34,32 | 530 | 34,61 | ||||
| 2026-02-17 | 13F | Creative Planning | 66.030 | 25,01 | 831 | 25,19 | ||||
| 2025-10-17 | 13F | Sowell Financial Services LLC | 0 | -100,00 | 0 | |||||
| 2026-02-12 | 13F | Steward Partners Investment Advisory, Llc | 159.936 | 2,53 | 2.012 | 2,65 | ||||
| 2026-01-05 | 13F | Park Avenue Securities Llc | 0 | -100,00 | 0 | |||||
| 2026-01-14 | 13F | Spire Wealth Management | 0 | -100,00 | 0 | |||||
| 2026-02-05 | 13F | Wakefield Asset Management LLLP | 150.728 | 0,58 | 1.896 | 0,69 | ||||
| 2026-02-12 | 13F | Commonwealth Equity Services, Llc | 240.728 | -2,18 | 3.028 | 100.833,33 | ||||
| 2026-02-17 | 13F | Evolve Private Wealth, Llc | 32.633 | 411 | ||||||
| 2026-01-14 | 13F | Eastern Bank | 738 | 0,00 | 9 | 0,00 | ||||
| 2026-02-17 | 13F | Wiley Bros.-aintree Capital, Llc | 132.667 | 62,49 | 1.669 | 62,73 | ||||
| 2026-01-26 | 13F | Private Trust Co Na | 4.495 | 0,00 | 57 | 0,00 | ||||
| 2026-02-06 | 13F | Hudson Valley Investment Advisors Inc /adv | 0 | -100,00 | 0 | |||||
| 2026-02-17 | 13F | National Asset Management, Inc. | 10.165 | 128 | ||||||
| 2026-02-09 | 13F | Kingsview Wealth Management, LLC | 10.508 | 0,79 | 132 | 1,54 | ||||
| 2026-02-02 | 13F | Cornerstone Planning Group LLC | 3.445 | 42.962,50 | 43 | |||||
| 2026-01-07 | 13F | Melone Private Wealth, LLC | 865.452 | 6,90 | 10.887 | 7,07 | ||||
| 2026-02-12 | 13F | Sit Investment Associates Inc | 0 | -100,00 | 0 | |||||
| 2026-02-17 | 13F | Advisor Group Holdings, Inc. | 236.418 | -7,18 | 2.974 | -4,16 | ||||
| 2026-02-12 | 13F | BRYN MAWR TRUST Co | 10.000 | 0,00 | 126 | 0,00 | ||||
| 2026-02-13 | 13F | Islay Capital Management, Llc | 8.000 | 0,00 | 101 | 0,00 | ||||
| 2026-02-09 | 13F | Hartland & Co., LLC | 693 | 0,00 | 9 | 0,00 | ||||
| 2026-02-12 | 13F | Kovack Advisors, Inc. | 22.753 | 83 | ||||||
| 2026-01-08 | 13F | Gridiron Partners, LLC | 273.681 | -90,50 | 3.443 | 0,15 | ||||
| 2026-02-13 | 13F | Fortitude Advisory Group L.L.C. | 52.734 | 0,00 | 663 | 0,15 | ||||
| 2026-01-16 | 13F | FNY Investment Advisers, LLC | 0 | -100,00 | 0 | |||||
| 2026-01-28 | 13F | Trademark Financial Management, LLC | 0 | -100,00 | 0 | |||||
| 2026-02-10 | 13F | Virtue Asset Management Llc | 16.512 | 0,00 | 208 | 0,00 | ||||
| 2026-02-17 | 13F | Royal Bank Of Canada | 984.756 | 5,87 | 12.388 | 6,04 | ||||
| 2026-01-26 | 13F | Mountain Hill Investment Partners Corp. | 11.319 | 0,00 | 142 | 0,00 | ||||
| 2026-01-30 | 13F | Renasant Bank | 28.300 | -27,53 | 356 | -27,35 | ||||
| 2025-11-14 | 13F | Karpus Management, Inc. | 0 | -100,00 | 0 | |||||
| 2025-11-13 | 13F | Tortoise Investment Management, LLC | 0 | -100,00 | 0 | |||||
| 2026-02-05 | 13F | Allworth Financial LP | 38.342 | 1,62 | 482 | 1,90 | ||||
| 2026-02-17 | 13F | Palogic Value Management, L.P. | 41.710 | 0,00 | 525 | 0,19 | ||||
| 2025-10-23 | 13F | CX Institutional | 0 | -100,00 | 0 | |||||
| 2025-11-14 | 13F | Rivernorth Capital Management, Llc | 0 | -100,00 | 0 | -100,00 | ||||
| 2026-02-13 | 13F | Pinnacle Wealth Planning Services, Inc. | 2.644 | 33 | ||||||
| 2026-02-17 | 13F | Warren Averett Asset Management, LLC | 18.215 | 229 | ||||||
| 2026-01-12 | 13F | VisionPoint Advisory Group, LLC | 27.841 | 19,80 | 350 | 20,27 | ||||
| 2026-01-29 | 13F | Kestra Private Wealth Services, Llc | 35.753 | -0,85 | 450 | -0,66 | ||||
| 2026-02-11 | 13F | LPL Financial LLC | 786.784 | 32,71 | 9.898 | 32,92 | ||||
| 2026-02-13 | 13F | Robinson Capital Management, Llc | 173.434 | 2.182 | ||||||
| 2026-01-28 | 13F | Edge Financial Advisors LLC | 11.296 | 5,98 | 142 | 6,77 | ||||
| 2025-10-02 | 13F | Ahl Investment Management, Inc. | 0 | -100,00 | 0 | -100,00 | ||||
| 2026-02-12 | 13F | Advisors Asset Management, Inc. | 627.285 | 8,80 | 7.891 | 8,98 | ||||
| 2025-10-22 | 13F | Geneos Wealth Management Inc. | 0 | -100,00 | 0 | -100,00 | ||||
| 2026-02-06 | 13F | Pnc Financial Services Group, Inc. | 45.053 | 1,51 | 567 | 1,62 | ||||
| 2026-01-20 | 13F | C2P Capital Advisory Group, LLC d.b.a. Prosperity Capital Advisors | 18.674 | 2,37 | 235 | 2,18 | ||||
| 2026-02-09 | 13F | King Luther Capital Management Corp | 181 | 0,00 | ||||||
| 2026-01-29 | 13F | Mackay Shields Llc | 324.502 | -76,93 | 4.082 | -76,89 | ||||
| 2025-11-17 | 13F | Hancock Whitney Corp | 0 | -100,00 | 0 | |||||
| 2026-01-22 | 13F | Bartlett & Co. Wealth Management Llc | 1.643 | 54,13 | 21 | 53,85 | ||||
| 2026-01-29 | 13F | D.a. Davidson & Co. | 27.799 | 0,08 | 350 | 0,29 | ||||
| 2026-02-12 | 13F | Jane Street Group, Llc | 254.005 | 415,09 | 3.195 | 416,16 | ||||
| 2026-01-26 | 13F | Merit Financial Group, LLC | 17.357 | -12,67 | 218 | -12,45 | ||||
| 2026-02-13 | 13F | FF Advisors,LLC | 0 | -100,00 | 0 | |||||
| 2026-02-05 | 13F | AlphaCore Capital LLC | 32.434 | 4,02 | 408 | 3,55 | ||||
| 2026-02-11 | 13F | Tiaa Trust, National Association | 11.030 | -63,96 | 139 | -64,06 | ||||
| 2026-01-09 | 13F | Silverlake Wealth Management Llc | 63.044 | 5,37 | 793 | 5,59 | ||||
| 2026-02-13 | 13F | Baird Financial Group, Inc. | 93.960 | 35,94 | 1.182 | 36,18 | ||||
| 2026-02-09 | 13F | Accredited Investor Services, Llc | 0 | -100,00 | 0 | -100,00 | ||||
| 2026-02-19 | 13F | CI Private Wealth, LLC | 28.105 | -14,15 | 354 | -14,11 | ||||
| 2026-01-28 | 13F | Meadow Creek Wealth Advisors Llc | 16.589 | -4,80 | 209 | -3,70 | ||||
| 2026-01-29 | 13F | Comerica Bank | 23.813 | -3,07 | 300 | -2,92 |