Grundlæggende statistik
| Institutionelle aktier (lange) | 120.945.126 - 64,13% (ex 13D/G) - change of -1,76MM shares -1,43% MRQ |
| Institutionel værdi (lang) | $ 10.516.291 USD ($1000) |
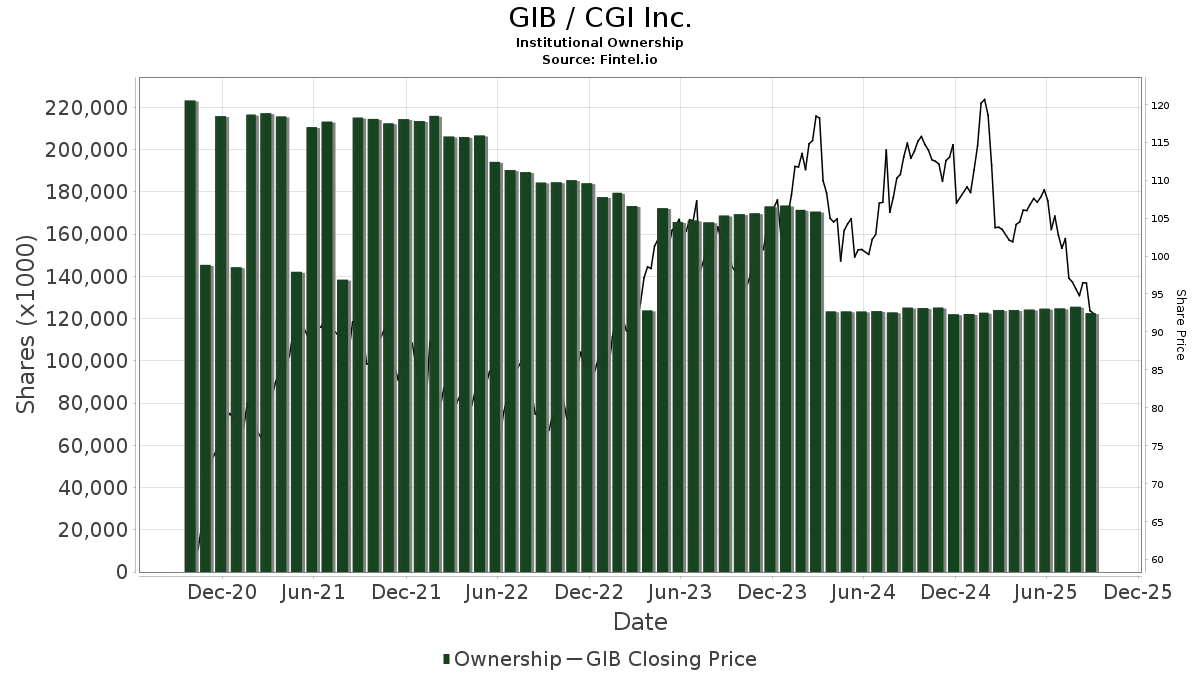
Institutionelt ejerskab og aktionærer
CGI Inc. (US:GIB) har 356 institutionelle ejere og aktionærer, der har indsendt 13D/G- eller 13F-formularer til Securities Exchange Commission (SEC). Disse institutioner har i alt 120,945,126 aktier. Største aktionærer omfatter Caisse De Depot Et Placement Du Quebec, Vanguard Group Inc, Mackenzie Financial Corp, Royal Bank Of Canada, Fiera Capital Corp, 1832 Asset Management L.P., FIL Ltd, Bank Of Montreal /can/, Jarislowsky, Fraser Ltd, and Beutel, Goodman & Co Ltd. .
CGI Inc. (NYSE:GIB) institutionel ejerskabsstruktur viser aktuelle positioner i virksomheden efter institutioner og fonde, samt seneste ændringer i positionsstørrelse. Større aktionærer kan omfatte individuelle investorer, investeringsforeninger, hedgefonde eller institutioner. Skema 13D angiver, at investoren besidder (eller besidder) mere end 5 % af virksomheden og har til hensigt (eller har til hensigt at) aktivt at forfølge en ændring i forretningsstrategi. Skema 13G indikerer en passiv investering på over 5%.
The share price as of April 15, 2026 is 74,07 / share. Previously, on April 16, 2025, the share price was 104,16 / share. This represents a decline of 28,89% over that period.
Fondens stemningsscore
Fund Sentiment Score (fka Ownership Accumulation Score) finder de aktier, der bliver mest købt af fonde. Det er resultatet af en sofistikeret, multi-faktor kvantitativ model, der identificerer virksomheder med de højeste niveauer af institutionel akkumulering. Scoringsmodellen bruger en kombination af den samlede stigning i oplyste ejere, ændringerne i porteføljeallokeringer i disse ejere og andre målinger. Tallet går fra 0 til 100, hvor højere tal indikerer et højere niveau af akkumulering for sine jævnaldrende, og 50 er gennemsnittet.
Opdateringsfrekvens: Dagligt
Se Ownership Explorer, som giver en liste over højest rangerende virksomheder.
AI+ Ask Fintel’s AI assistant about CGI Inc..
Select a question to share a public post with an AI-crafted answer.
Thinking of good questions…
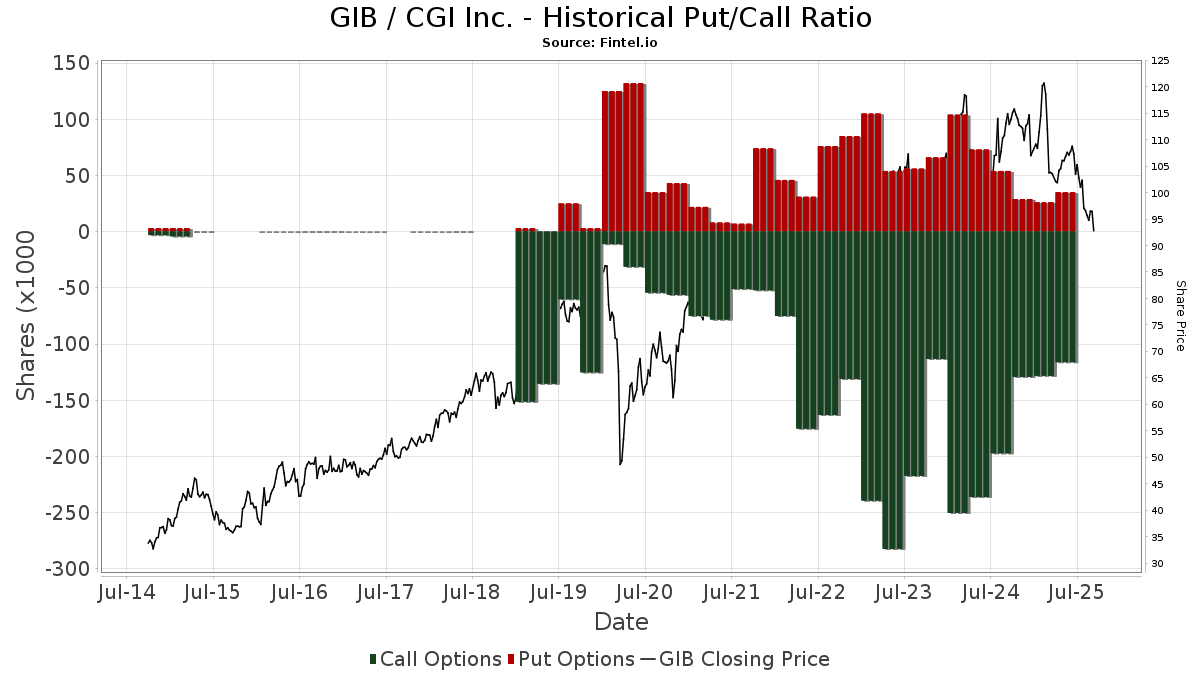
Institutionel Put/Call-forhold
Ud over at indberette standardaktie- og gældsudstedelser skal institutter med mere end 100 mill. aktiver under forvaltning også oplyse deres put- og call-optionsbeholdninger. Da salgsoptioner generelt indikerer negativ stemning, og købsoptioner indikerer positiv stemning, kan vi få en fornemmelse af den overordnede institutionelle stemning ved at plotte forholdet mellem put og kald. Diagrammet til højre viser det historiske put/call-forhold for dette instrument.
Brug af Put/Call Ratio som en indikator for investorernes stemning overvinder en af de vigtigste mangler ved at bruge totalt institutionelt ejerskab, som er, at en betydelig mængde af aktiver under forvaltning investeres passivt for at spore indekser. Passivt forvaltede fonde køber typisk ikke optioner, så indikatoren for put/call-forholdet følger mere nøje følelsen af aktivt forvaltede fonde.
13D/G-arkivering
Vi præsenterer 13D/G ansøgninger separat fra 13F ansøgninger på grund af den forskellige behandling af SEC. 13D/G-ansøgninger kan indgives af grupper af investorer (med én ledende), hvorimod 13F-ansøgninger ikke kan. Dette resulterer i situationer, hvor en investor kan indsende en 13D/G, der rapporterer én værdi for de samlede aktier (der repræsenterer alle de aktier, der ejes af investorgruppen), men derefter indsender en 13F, der rapporterer en anden værdi for de samlede aktier (der udelukkende repræsenterer deres egne) ejendomsret). Det betyder, at aktieejerskab af 13D/G-arkiver og 13F-arkiveringer ofte ikke er direkte sammenlignelige, så vi præsenterer dem separat.
Bemærk: Fra den 16. maj 2021 viser vi ikke længere ejere, der ikke har indsendt en 13D/G inden for det seneste år. Tidligere viste vi den fulde historie af 13D/G-arkiver. Generelt skal enheder, der er forpligtet til at indgive 13D/G-ansøgninger, indgive mindst årligt, før de indsender en afsluttende ansøgning. Dog forlader fonde nogle gange positioner uden at indsende en afsluttende ansøgning (dvs. de afvikler), så visning af den fulde historie resulterede nogle gange i forvirring om det nuværende ejerskab. For at undgå forvirring viser vi nu kun 'aktuelle' ejere - det vil sige - ejere, der har anmeldt inden for det seneste år.
Upgrade to unlock premium data.
| Fil dato | Form | Investor | Forrige Aktier |
Seneste Aktier |
Δ Aktier (Procent) |
Ejendomsret (Procent) |
Δ Ejerskab (Procent) |
|
|---|---|---|---|---|---|---|---|---|
| 2025-04-23 | BlackRock, Inc. | 14,354,057 | 11,717,348 | -18.37 | 5.80 | -18.31 |
13F og NPORT arkivering
Detaljer om 13F-arkivering er gratis. Detaljer om NP-ansøgninger kræver et premium-medlemskab. Grønne rækker angiver nye positioner. Røde rækker angiver lukkede positioner. Klik på linket ikon for at se den fulde transaktionshistorik.
Opgrader
for at låse premium-data op og eksportere til Excel ![]() .
.
| Fil dato | Kilde | Investor | Type | Gennemsnitlig pris (Øst) |
Aktier | Δ Aktier (%) |
Rapporteret Værdi ($1000) |
Δ Værdi (%) |
Port Alloc (%) |
|
|---|---|---|---|---|---|---|---|---|---|---|
| 2025-11-14 | 13F | Qtron Investments LLC | 0 | -100,00 | 0 | |||||
| 2026-01-23 | 13F | Steigerwald, Gordon & Koch Inc. | 1.612 | 0,00 | 149 | 3,50 | ||||
| 2026-02-04 | 13F | Versor Investments LP | 5.626 | -67,71 | 520 | -66,54 | ||||
| 2026-02-02 | 13F | Manhattan West Asset Management, LLC | 24.939 | -9,35 | 2.302 | -6,16 | ||||
| 2026-02-05 | 13F | Bessemer Group Inc | 1.627 | -99,35 | 0 | -100,00 | ||||
| 2026-02-12 | 13F | Nuveen, LLC | 137.074 | -1,49 | 12.678 | 2,26 | ||||
| 2026-02-13 | 13F | OMERS ADMINISTRATION Corp | 21.287 | 28,79 | 1.969 | 33,70 | ||||
| 2026-02-12 | 13F | CIBC Private Wealth Group, LLC | 149 | 0,00 | 14 | 0,00 | ||||
| 2026-02-17 | 13F | Balyasny Asset Management Llc | 3.427 | -83,54 | 316 | -82,96 | ||||
| 2025-11-04 | 13F | Ativo Capital Management LLC | 0 | -100,00 | 0 | |||||
| 2026-02-11 | 13F | Simplex Trading, Llc | Put | 0 | -100,00 | 0 | ||||
| 2026-02-11 | 13F | Simplex Trading, Llc | 0 | -100,00 | 0 | |||||
| 2026-04-07 | 13F | Park Avenue Securities Llc | 0 | -100,00 | 0 | |||||
| 2026-02-13 | 13F | Parkside Financial Bank & Trust | 32 | 0,00 | 3 | 0,00 | ||||
| 2025-11-14 | 13F | Susquehanna International Group, Llp | 0 | -100,00 | 0 | -100,00 | ||||
| 2025-10-24 | 13F | MorganRosel Wealth Management, LLC | 0 | -100,00 | 0 | |||||
| 2026-02-06 | 13F | EverSource Wealth Advisors, LLC | 1.097 | -3,18 | 101 | 1,00 | ||||
| 2026-01-16 | 13F | Louisbourg Investments Inc. | 61.824 | 10,45 | 5.719 | 14,73 | ||||
| 2026-01-14 | 13F | Spire Wealth Management | 110 | 0,00 | 10 | 11,11 | ||||
| 2026-02-17 | 13F | State Of Wisconsin Investment Board | 91.416 | 8.455 | ||||||
| 2026-02-05 | 13F | Pinnacle Associates Ltd | 10.500 | 0,00 | 969 | 3,64 | ||||
| 2026-02-11 | 13F | CLARET ASSET MANAGEMENT Corp | 464.003 | 3,25 | 43 | 5,00 | ||||
| 2026-02-05 | 13F | Atria Investments Llc | 4.081 | 4,67 | 377 | 8,36 | ||||
| 2026-02-03 | 13F | Encompass More Asset Management | 0 | -100,00 | 0 | |||||
| 2026-02-10 | 13F | Bank of New York Mellon Corp | 249.292 | -3,74 | 23.010 | -0,32 | ||||
| 2026-02-12 | 13F | Swiss National Bank | 519.400 | -9,46 | 48.074 | -5,96 | ||||
| 2026-03-06 | 13F | Hsbc Holdings Plc | 0 | -100,00 | 0 | |||||
| 2026-02-09 | 13F | Geode Capital Management, Llc | 1.996.023 | 5,07 | 187.369 | 9,42 | ||||
| 2025-10-31 | 13F | Whittier Trust Co | 0 | -100,00 | 0 | |||||
| 2026-02-12 | 13F | BlackRock, Inc. | 449.994 | -2,55 | 41.534 | 0,92 | ||||
| 2026-02-17 | 13F | Tower Research Capital LLC (TRC) | 2.051 | -78,60 | 189 | -77,87 | ||||
| 2026-04-13 | 13F | True Wealth Design, LLC | 122 | 148,98 | 9 | 100,00 | ||||
| 2026-01-14 | 13F | Jfs Wealth Advisors, Llc | 113 | 0,00 | 10 | 0,00 | ||||
| 2026-02-12 | 13F | Northwest & Ethical Investments L.P. | 337.056 | -9,29 | 31.135 | -5,94 | ||||
| 2026-02-10 | 13F | Bnp Paribas Arbitrage, Sa | 91.757 | 1,88 | 8.469 | 5,51 | ||||
| 2026-02-11 | 13F | Simplex Trading, Llc | Call | 900 | 350,00 | 83 | ||||
| 2026-02-09 | 13F | MQS Management LLC | 0 | -100,00 | 0 | |||||
| 2025-11-07 | 13F | Ontario Teachers Pension Plan Board | 0 | -100,00 | 0 | -100,00 | ||||
| 2026-02-12 | 13F | APG Asset Management US Inc. | 0 | -100,00 | 0 | |||||
| 2026-02-09 | 13F | Key FInancial Inc | 50 | 0,00 | 5 | 0,00 | ||||
| 2026-02-13 | 13F | Barclays Plc | 458.629 | 103,05 | 42.331 | 110,28 | ||||
| 2026-02-11 | 13F | Picton Mahoney Asset Management | 0 | -100,00 | 0 | |||||
| 2026-02-17 | 13F | Guardian Partners Inc. | 0 | -100,00 | 0 | |||||
| 2025-11-13 | 13F | Glenmede Investment Management, LP | 2.540 | -6,79 | 226 | -20,70 | ||||
| 2026-01-27 | 13F | Legacy Advisors, LLC | 2.433 | 225 | ||||||
| 2026-04-13 | 13F | Massmutual Trust Co Fsb/adv | 79 | -83,54 | 6 | -88,64 | ||||
| 2026-02-12 | 13F | Commonwealth Equity Services, Llc | 12.561 | -10,69 | 1.159 | 115.800,00 | ||||
| 2026-02-12 | 13F | Dimensional Fund Advisors Lp | 699.527 | -2,36 | 64.569 | 1,12 | ||||
| 2026-01-21 | 13F | Cidel Asset Management Inc | 148.332 | -64,41 | 13.719 | -63,05 | ||||
| 2026-02-05 | 13F | Baader Bank INC | 5.806 | 37,71 | 535 | 42,40 | ||||
| 2026-04-07 | 13F | Signaturefd, Llc | 3.090 | -56,87 | 226 | -65,96 | ||||
| 2026-02-09 | 13F | Employees Retirement System of Texas | 2.107 | 10,37 | 0 | |||||
| 2026-02-05 | 13F | Bank Julius Baer & Co. Ltd, Zurich | 1.262 | 0,32 | 116 | 3,57 | ||||
| 2025-10-23 | 13F | Evolution Wealth Management Inc. | 0 | -100,00 | 0 | |||||
| 2026-04-15 | 13F | Addenda Capital Inc. | 100.959 | -66,23 | 10.268 | -72,91 | ||||
| 2026-02-11 | 13F | Manchester Capital Management LLC | 360 | 33 | ||||||
| 2026-02-02 | 13F | Cornerstone Planning Group LLC | 0 | -100,00 | 0 | |||||
| 2026-02-13 | 13F | Ubs Asset Management Americas Inc | 105 | 10 | ||||||
| 2026-02-17 | 13F | Graham Capital Management, L.P. | 10.173 | -59,78 | 939 | -58,39 | ||||
| 2026-02-13 | 13F | Dynamic Technology Lab Private Ltd | 0 | -100,00 | 0 | |||||
| 2026-03-20 | 13F | Purpose Unlimited Inc. | 18.829 | 1.739 | ||||||
| 2026-02-11 | 13F | West Family Investments, Inc. | 0 | -100,00 | 0 | -100,00 | ||||
| 2026-02-17 | 13F | SIG North Trading, ULC | 21.981 | 34,84 | 2.029 | 39,67 | ||||
| 2026-02-17 | 13F | SIG North Trading, ULC | Put | 18.800 | 80,77 | 1.735 | 87,37 | |||
| 2026-02-11 | 13F | Metis Global Partners, LLC | 8.984 | -17,68 | 830 | -14,71 | ||||
| 2025-10-21 | 13F | Penobscot Investment Management Company, Inc. | 0 | -100,00 | 0 | |||||
| 2026-02-05 | 13F | AlphaCore Capital LLC | 2.447 | 226 | ||||||
| 2026-02-17 | 13F | SIG North Trading, ULC | Call | 27.000 | 76,47 | 2.492 | 82,83 | |||
| 2026-02-09 | 13F | Legal & General Group Plc | 1.279.112 | -1,87 | 118.304 | 1,88 | ||||
| 2026-02-13 | 13F | Smartleaf Asset Management LLC | 281 | 5,64 | 26 | 13,04 | ||||
| 2025-11-04 | 13F | Gitterman Wealth Management, LLC | 0 | -100,00 | 0 | -100,00 | ||||
| 2026-03-02 | 13F | Tobam | 0 | -100,00 | 0 | |||||
| 2026-02-13 | 13F | Sienna Gestion | 50.000 | 0,00 | 4.632 | 14,04 | ||||
| 2026-02-17 | 13F | Investment Management Corp of Ontario | 66.579 | 45,50 | 6.145 | 50,69 | ||||
| 2025-10-21 | 13F | Galibier Capital Management Ltd. | 155.232 | -9,92 | 13.830 | -23,43 | ||||
| 2026-04-13 | 13F | Mather Group, Llc. | 1.399 | 102 | ||||||
| 2026-02-18 | 13F | Vident Advisory, LLC | 7.491 | 48,16 | 692 | 53,78 | ||||
| 2026-02-12 | 13F | Principal Securities, Inc. | 0 | -100,00 | 0 | |||||
| 2026-02-13 | 13F | Morgan Stanley | 1.453.829 | -19,53 | 134.189 | -16,67 | ||||
| 2026-02-04 | 13F | Plato Investment Management Ltd | 13.406 | -3,65 | 1.246 | 1,22 | ||||
| 2026-02-11 | 13F | Parallel Advisors, LLC | 1.719 | -22,60 | 159 | -19,80 | ||||
| 2026-02-13 | 13F | Fairman Group, LLC | 31 | 0,00 | 3 | 0,00 | ||||
| 2026-02-11 | 13F | Allianz Asset Management GmbH | 36.147 | -9,53 | 3.343 | -6,07 | ||||
| 2026-02-17 | 13F | Magnetar Financial LLC | 29.508 | -67,39 | 2.724 | -66,22 | ||||
| 2026-02-10 | 13F | State of Wyoming | 0 | -100,00 | 0 | |||||
| 2026-02-13 | 13F | Aviso Financial Inc. | 0 | -100,00 | 0 | |||||
| 2026-01-27 | 13F | Zurcher Kantonalbank (Zurich Cantonalbank) | 117.938 | 10.908 | ||||||
| 2025-11-10 | 13F | Cary Street Partner Investment Advisory Llc | 0 | -100,00 | 0 | -100,00 | ||||
| 2025-11-14 | 13F | ExodusPoint Capital Management, LP | 9.500 | 847 | ||||||
| 2025-11-20 | 13F | Asset Dedication, LLC | 0 | -100,00 | 0 | |||||
| 2026-01-29 | 13F | Montrusco Bolton Investments Inc. | 518.394 | 10,82 | 47.946 | 15,05 | ||||
| 2026-02-04 | 13F | Asahi Life Asset Management Co., Ltd. | 2.411 | 223 | ||||||
| 2026-02-09 | 13F | Nicola Wealth Management Ltd. | 122.000 | 0,00 | 11.271 | 3,71 | ||||
| 2026-02-11 | 13F | Deutsche Bank Ag\ | 665.706 | 32,64 | 61.445 | 37,36 | ||||
| 2026-02-04 | 13F | Atlantic Union Bankshares Corp | 407 | 0,00 | 38 | 2,78 | ||||
| 2025-11-10 | 13F | D'Orazio & Associates, Inc. | 0 | -100,00 | 0 | |||||
| 2025-11-14 | 13F | ICONIQ Capital, LLC | 0 | -100,00 | 0 | |||||
| 2026-02-17 | 13F | DZ BANK AG Deutsche Zentral Genossenschafts Bank, Frankfurt am Main | 0 | -100,00 | 0 | |||||
| 2026-02-13 | 13F | Mml Investors Services, Llc | 5.054 | -14,24 | 467 | -11,24 | ||||
| 2025-11-14 | 13F | Cubist Systematic Strategies, LLC | 102.311 | 9.117 | ||||||
| 2026-02-17 | 13F | Royal Bank Of Canada | 5.838.952 | -19,65 | 538.934 | -16,79 | ||||
| 2025-11-14 | 13F | Eqis Capital Management, Inc. | 0 | -100,00 | 0 | |||||
| 2026-02-17 | 13F | Numerai GP LLC | 27.669 | -29,98 | 2.554 | -27,51 | ||||
| 2026-02-12 | 13F | Bank Of Montreal /can/ | 4.082.829 | 0,90 | 377.131 | 4,66 | ||||
| 2026-02-13 | 13F | Kestra Advisory Services, LLC | 0 | -100,00 | 0 | |||||
| 2026-02-17 | 13F | Raymond James Financial Inc | 4.563 | -42,91 | 421 | -40,87 | ||||
| 2026-02-05 | 13F | Cambridge Investment Research Advisors, Inc. | 0 | -100,00 | 0 | |||||
| 2026-02-06 | 13F | Harvest Portfolios Group Inc. | 9.293 | 18,58 | 858 | 22,92 | ||||
| 2026-02-13 | 13F | Y-Intercept (Hong Kong) Ltd | 0 | -100,00 | 0 | |||||
| 2026-02-12 | 13F | Quadrant Capital Group Llc | 8.080 | -15,10 | 746 | -12,15 | ||||
| 2026-02-17 | 13F | Bank Of America Corp /de/ | 1.025.554 | -33,44 | 94.659 | -31,07 | ||||
| 2026-01-27 | 13F | First Horizon Corp | 324 | 0,00 | 30 | 3,57 | ||||
| 2026-01-20 | 13F | Cromwell Holdings LLC | 565 | -15,42 | 52 | -11,86 | ||||
| 2026-02-13 | 13F | MAI Capital Management | 541 | 8,20 | 50 | 11,36 | ||||
| 2026-02-11 | 13F | Franklin Resources Inc | 127.785 | -0,08 | 11.803 | 3,64 | ||||
| 2026-02-04 | 13F | HighPoint Advisor Group LLC | 3.248 | -1,13 | 300 | 2,40 | ||||
| 2026-01-09 | 13F | Assenagon Asset Management S.A. | 6.215 | -22,50 | 575 | -19,61 | ||||
| 2026-04-10 | 13F | Henry James International Management Inc. | 13.133 | -70,69 | 960 | -76,78 | ||||
| 2026-02-09 | 13F | Keating Financial Advisory Services, Inc. | 987 | 91 | ||||||
| 2026-02-11 | 13F | Group One Trading, L.p. | Call | 600 | 20,00 | 55 | 25,00 | |||
| 2026-02-13 | 13F | Citigroup Inc | 178.147 | 20,86 | 16.477 | 25,47 | ||||
| 2026-02-06 | 13F | HighTower Advisors, LLC | 3.491 | -1,13 | 322 | 2,55 | ||||
| 2026-04-10 | 13F | Pure Financial Advisors, Inc. | 0 | -100,00 | 0 | -100,00 | ||||
| 2026-01-21 | 13F | Woodmont Investment Counsel Llc | 17.234 | 0,00 | 1.591 | 3,52 | ||||
| 2026-02-13 | 13F | Timelo Investment Management Inc. | 40.000 | 166,67 | 3.692 | 176,35 | ||||
| 2026-02-12 | 13F | Skandinaviska Enskilda Banken AB (publ) | 29.712 | -3,01 | 2.742 | 0,44 | ||||
| 2026-02-13 | 13F | Arrowstreet Capital, Limited Partnership | 1.625.492 | -1,20 | 150.123 | 2,44 | ||||
| 2026-02-17 | 13F | Agf Management Ltd | 60.556 | -46,58 | 7.677 | -45,37 | ||||
| 2026-01-26 | 13F | Haven Global Partners, LLC | 186.604 | 54,09 | 17.259 | 59,96 | ||||
| 2026-02-13 | 13F | Gen-Wealth Partners Inc | 1.098 | -50,81 | 101 | -48,99 | ||||
| 2026-02-13 | 13F | Pinnacle Wealth Planning Services, Inc. | 36 | 3 | ||||||
| 2026-02-13 | 13F | First Trust Advisors Lp | 123.163 | -1,83 | 11.378 | 1,82 | ||||
| 2026-02-17 | 13F | FIL Ltd | 5.200.016 | 109,02 | 480.316 | 116,76 | ||||
| 2026-02-20 | 13F | Kovitz Investment Group Partners, LLC | 9.000 | -6,56 | 831 | -3,26 | ||||
| 2026-02-17 | 13F | Two Sigma Investments, Lp | 493.551 | -18,76 | 45.555 | -15,88 | ||||
| 2026-02-11 | 13F | Hughes Financial Services, LLC | 2.026 | 0,00 | 187 | 8,09 | ||||
| 2025-11-14 | 13F | Principal Street Partners, LLC | 0 | -100,00 | 0 | |||||
| 2026-02-13 | 13F | Marshall Wace, Llp | 68.727 | 6.344 | ||||||
| 2026-02-10 | 13F | Private Wealth Asset Management, LLC | 0 | -100,00 | 0 | |||||
| 2026-02-12 | 13F | Scotia Capital Inc. | 686.752 | -6,68 | 63.377 | -2,99 | ||||
| 2026-02-17 | 13F | Quadrature Capital Ltd | 0 | -100,00 | 0 | |||||
| 2026-02-13 | 13F | American Century Companies Inc | 78.823 | 3,38 | 7.281 | 7,20 | ||||
| 2025-11-14 | 13F | Verition Fund Management LLC | 0 | -100,00 | 0 | |||||
| 2026-02-04 | 13F | C WorldWide Group Holding A/S | 20.349 | -13,38 | 2 | -50,00 | ||||
| 2026-02-11 | 13F | Syon Capital Llc | 4.336 | 400 | ||||||
| 2026-02-17 | 13F | Ancora Advisors, LLC | 1.000 | 0,00 | 92 | 3,37 | ||||
| 2026-02-02 | 13F | Varma Mutual Pension Insurance Co | 128.000 | 11.839 | ||||||
| 2026-02-17 | 13F | Two Sigma Advisers, Lp | 60.900 | 122,36 | 5.621 | 130,27 | ||||
| 2026-02-11 | 13F | EULAV Asset Management | 397.110 | 0,00 | 36.653 | 3,56 | ||||
| 2026-02-13 | 13F | National Bank Of Canada /fi/ | Put | 2 | -91,67 | 18 | -91,55 | |||
| 2026-04-02 | 13F | Aspect Partners, LLC | 6.799 | 0,28 | 497 | -20,48 | ||||
| 2026-01-21 | 13F | Prime Capital Investment Advisors, LLC | 0 | -100,00 | 0 | |||||
| 2026-02-17 | 13F | Northern Trust Corp | 213.269 | 4,09 | 19.685 | 7,79 | ||||
| 2026-02-13 | 13F | SRS Capital Advisors, Inc. | 477 | -31,66 | 44 | -29,03 | ||||
| 2026-02-10 | 13F | Hillsdale Investment Management Inc. | 1.295 | -52,20 | 120 | -50,62 | ||||
| 2026-02-13 | 13F | Aigen Investment Management, Lp | 0 | -100,00 | 0 | |||||
| 2026-02-19 | 13F | CI Private Wealth, LLC | 39.018 | -3,34 | 3.601 | 0,11 | ||||
| 2026-02-09 | 13F | Wcm Investment Management, Llc | 42.176 | 93,58 | 3.922 | 102,43 | ||||
| 2026-02-10 | 13F | Envestnet Asset Management Inc | 13.104 | -31,92 | 1.210 | -29,50 | ||||
| 2026-01-20 | 13F | Princeton Global Asset Management LLC | 97 | 0,00 | 9 | 0,00 | ||||
| 2026-02-17 | 13F | Jones Financial Companies Lllp | 19.834 | -12,68 | 1.831 | -8,59 | ||||
| 2026-01-21 | 13F | Flagship Harbor Advisors, Llc | 1.320 | 122 | ||||||
| 2025-11-07 | 13F | Sierra Ocean, Llc | 0 | -100,00 | 0 | |||||
| 2026-02-13 | 13F | Pathstone Holdings, LLC | 5.721 | 3,87 | 528 | 7,76 | ||||
| 2026-02-12 | 13F | Hollencrest Capital Management | 857 | 0,00 | 79 | 3,95 | ||||
| 2026-04-08 | 13F | Lynch & Associates/in | 4.526 | -15,32 | 331 | -33,06 | ||||
| 2026-02-19 | 13F | Invesco Ltd. | 288.524 | -65,23 | 26.631 | -63,99 | ||||
| 2026-02-06 | 13F | Global Retirement Partners, LLC | 5.064 | 19.376,92 | 467 | 23.250,00 | ||||
| 2026-01-30 | 13F | R Squared Ltd | 0 | -100,00 | 0 | |||||
| 2026-02-17 | 13F | Wellington Management Group Llp | 131.836 | 26,24 | 12.193 | 31,07 | ||||
| 2026-02-10 | 13F | Godfrey Financial Associates, Inc. | 7 | 1 | ||||||
| 2026-02-17 | 13F | Janus Henderson Group Plc | 17.879 | 0,00 | 1.667 | 4,84 | ||||
| 2026-01-21 | 13F | Yousif Capital Management, Llc | 2.541 | -1,93 | 222 | -3,91 | ||||
| 2026-01-15 | 13F | Mn Services Vermogensbeheer B.V. | 76.252 | 2,17 | 7 | 16,67 | ||||
| 2026-02-13 | 13F | Bridgewater Associates, LP | 0 | -100,00 | 0 | |||||
| 2026-02-17 | 13F | Susquehanna Fundamental Investments, Llc | 155.300 | 145,73 | 14.334 | 154,46 | ||||
| 2026-02-17 | 13F | Susquehanna International Group, Llp | Call | 6.900 | -51,41 | 637 | -49,72 | |||
| 2026-02-13 | 13F | National Bank Of Canada /fi/ | Call | 134 | -35,89 | 1.238 | -33,53 | |||
| 2025-11-14 | 13F | AXA Investment Managers S.A. | 127.980 | 11.407 | ||||||
| 2026-02-09 | 13F | Harbour Investments, Inc. | 0 | -100,00 | 0 | |||||
| 2025-10-31 | 13F | Cullen/frost Bankers, Inc. | 0 | -100,00 | 0 | |||||
| 2026-02-03 | 13F | Ethic Inc. | 9.804 | 13,39 | 905 | 17,40 | ||||
| 2026-02-18 | 13F | Guardian Capital Lp | 1.292.690 | 50,28 | 119.460 | 55,88 | ||||
| 2026-02-13 | 13F | Caitong International Asset Management Co., Ltd | 0 | -100,00 | 0 | |||||
| 2026-02-23 | 13F | Mv Capital Management, Inc. | 3 | 0 | ||||||
| 2026-02-06 | 13F | Lloyd Advisory Services, LLC. | 2.841 | 0,11 | 262 | 3,97 | ||||
| 2026-02-17 | 13F | Credit Agricole S A | 4.468 | -9,06 | 412 | -5,72 | ||||
| 2026-02-10 | 13F | PCJ Investment Counsel Ltd. | 75.930 | 7.014 | ||||||
| 2026-02-13 | 13F | BRITISH COLUMBIA INVESTMENT MANAGEMENT Corp | 102.220 | -32,93 | 9.442 | -30,43 | ||||
| 2026-01-30 | 13F | North Star Investment Management Corp. | 50 | 5 | ||||||
| 2025-11-20 | 13F | First Affirmative Financial Network | 2.811 | -0,07 | 251 | -14,97 | ||||
| 2026-02-11 | 13F | O'shaughnessy Asset Management, Llc | 54.042 | -13,60 | 4.989 | -10,48 | ||||
| 2026-02-13 | 13F | Healthcare Of Ontario Pension Plan Trust Fund | 73.889 | 6.820 | ||||||
| 2026-02-10 | 13F | Gulf International Bank (UK) Ltd | 9.812 | 0,99 | 1 | -100,00 | ||||
| 2026-01-28 | 13F | Hoey Investments, Inc | 1.317 | 0,00 | 122 | 3,42 | ||||
| 2026-02-13 | 13F | Beutel, Goodman & Co Ltd. | 4.009.805 | 7,02 | 371 | 11,11 | ||||
| 2025-11-14 | 13F | Point72 (DIFC) Ltd | 600 | 53 | ||||||
| 2026-02-05 | 13F | Cardinal Point Capital Management, ULC | 112.078 | 4,37 | 10.367 | 8,43 | ||||
| 2025-11-03 | 13F | Truist Financial Corp | 0 | -100,00 | 0 | -100,00 | ||||
| 2026-01-28 | 13F | Davis-rea Ltd. | 42.200 | 15,87 | 3.900 | 20,15 | ||||
| 2026-02-03 | 13F | Crestwood Advisors Group LLC | 4.606 | 14,18 | 425 | 18,38 | ||||
| 2026-02-13 | 13F | Ieq Capital, Llc | 7.967 | 735 | ||||||
| 2026-02-17 | 13F | Strive Financial Group ,LLC | 400 | 37 | ||||||
| 2026-02-02 | 13F | Danske Bank A/s | 10.834 | 24,09 | 1.002 | 30,47 | ||||
| 2026-02-14 | 13F | Rockefeller Capital Management L.P. | 59 | 156,52 | 5 | 150,00 | ||||
| 2026-01-15 | 13F | Frank, Rimerman Advisors LLC | 4.059 | 375 | ||||||
| 2025-11-06 | 13F | Ameritas Advisory Services, LLC | 0 | -100,00 | 0 | |||||
| 2026-02-13 | 13F | Bridgefront Capital, LLC | 0 | -100,00 | 0 | -100,00 | ||||
| 2026-01-29 | 13F | UBS Group AG | Call | 0 | -100,00 | 0 | -100,00 | |||
| 2026-02-17 | 13F | Advisor Group Holdings, Inc. | 1.285 | -14,45 | 119 | -13,24 | ||||
| 2026-02-13 | 13F | Vontobel Holding Ltd. | 3.035 | 0,00 | 280 | 3,70 | ||||
| 2026-02-10 | 13F | Scheer, Rowlett & Associates Investment Management Ltd. | 395.129 | -13,47 | 36.498 | -10,25 | ||||
| 2026-02-06 | 13F | Larson Financial Group LLC | 154 | 1.825,00 | 14 | |||||
| 2026-04-13 | 13F | Gill Capital Partners, Llc | 600 | 44 | ||||||
| 2026-02-11 | 13F | Fiera Capital Corp | 5.394.446 | 2,28 | 498.439 | 6,14 | ||||
| 2025-11-10 | 13F | Cary Street Partners Financial Llc | 0 | -100,00 | 0 | |||||
| 2026-02-05 | 13F | Thrivent Financial For Lutherans | 2.899 | 0 | ||||||
| 2026-01-28 | 13F | CAPROCK Group, Inc. | 5.756 | 37,74 | 531 | 30,79 | ||||
| 2026-02-12 | 13F | Lansforsakringar Fondforvaltning AB (publ) | 50.761 | 4.695 | ||||||
| 2026-02-11 | 13F | Zions Bancorporation, National Association /ut/ | 112 | 0,00 | 10 | 11,11 | ||||
| 2026-02-12 | 13F | UniSuper Management Pty Ltd | 3.500 | 0,00 | 444 | 2,31 | ||||
| 2026-02-13 | 13F | Stifel Financial Corp | 3.347 | -53,03 | 310 | -51,34 | ||||
| 2026-02-12 | 13F | Wealthspire Advisors, LLC | 0 | -100,00 | 0 | |||||
| 2026-01-15 | 13F | J. Safra Sarasin Holding AG | 16.355 | 5,08 | 1.513 | 9,09 | ||||
| 2026-02-04 | 13F | Kepler Cheuvreux (Suisse) SA | 78.358 | 7,49 | 9.934 | 9,94 | ||||
| 2026-02-17 | 13F | Brevan Howard Capital Management LP | 0 | -100,00 | 0 | -100,00 | ||||
| 2026-04-15 | 13F | WESPAC Advisors SoCal, LLC | 4.300 | 0,00 | 314 | -20,71 | ||||
| 2026-02-13 | 13F | Ossiam | 10.605 | -51,30 | 981 | -49,48 | ||||
| 2026-02-13 | 13F | Quarry LP | 0 | -100,00 | 0 | |||||
| 2026-02-17 | 13F | Qube Research & Technologies Ltd | 70.829 | -83,58 | 6.539 | -82,99 | ||||
| 2026-02-12 | 13F | Jane Street Group, Llc | Call | 2.700 | 249 | |||||
| 2025-10-21 | 13F | PDS Planning, Inc | 0 | -100,00 | 0 | |||||
| 2026-02-12 | 13F | Jane Street Group, Llc | 11.832 | -84,90 | 1.092 | -84,36 | ||||
| 2026-02-12 | 13F | Burkett Asset Management Ltd | 48.326 | 4.470 | ||||||
| 2026-02-13 | 13F | Prudential Financial Inc | 35.979 | 3,75 | 3.328 | 7,70 | ||||
| 2026-02-13 | 13F | Osmosis Investment Management UK Ltd | 6.972 | 645 | ||||||
| 2026-02-17 | 13F | United Capital Financial Advisers, Llc | 5.131 | -3,41 | 474 | 0,00 | ||||
| 2026-02-13 | 13F | Golden State Wealth Management, LLC | 20 | 0,00 | 2 | 0,00 | ||||
| 2026-02-17 | 13F | Quantinno Capital Management LP | 72.177 | 244,03 | 6.665 | 256,55 | ||||
| 2026-01-27 | 13F | GHP Investment Advisors, Inc. | 39.292 | -10,60 | 3.627 | -7,43 | ||||
| 2026-02-17 | 13F | Worldquant Millennium Advisors Llc | 14.522 | -50,59 | 1.342 | -48,76 | ||||
| 2026-04-13 | 13F | JCIC Asset Management Inc. | 0 | -100,00 | 0 | |||||
| 2026-02-10 | 13F | Forsta Ap-fonden | 33.300 | -69,11 | 3.080 | -67,94 | ||||
| 2026-02-17 | 13F | Alliancebernstein L.p. | 28.910 | 18,40 | 2.668 | 22,61 | ||||
| 2026-02-13 | 13F | Korea Investment CORP | 101.235 | 48,80 | 9.363 | 54,48 | ||||
| 2026-01-30 | 13F | Sigma Planning Corp | 3.358 | -4,95 | 310 | -1,59 | ||||
| 2026-02-11 | 13F | Clearbridge Investments, LLC | 684.133 | 11,33 | 63.145 | 15,29 | ||||
| 2026-02-13 | 13F | Mariner, LLC | 11.328 | -6,95 | 1.046 | -3,59 | ||||
| 2026-01-23 | 13F | Ritholtz Wealth Management | 16.378 | -23,12 | 1.512 | -20,39 | ||||
| 2026-02-17 | 13F | Engineers Gate Manager LP | 11.816 | -35,27 | 1.091 | -32,96 | ||||
| 2026-02-11 | 13F | Tacita Capital Inc | 710 | 0,00 | 66 | 3,17 | ||||
| 2026-02-17 | 13F | Millennium Management Llc | 176.212 | -60,44 | 16.275 | -58,98 | ||||
| 2026-02-12 | 13F | Robotti Robert | 22.000 | 10,00 | 2.031 | 13,92 | ||||
| 2025-11-12 | 13F | CIBC Bancorp USA Inc. | 1.989 | 241 | ||||||
| 2026-02-13 | 13F | Cornerstone Financial Management LLC | 62 | 6 | ||||||
| 2025-10-20 | 13F | Ascent Group, LLC | 0 | -100,00 | 0 | |||||
| 2026-02-12 | 13F | Bank Of Nova Scotia Trust Co | 132.319 | 7,10 | 12.213 | 10,91 | ||||
| 2025-11-04 | 13F | Callan Family Office, LLC | 0 | -100,00 | 0 | |||||
| 2026-01-20 | 13F | Cigna Investments Inc /new | 3.721 | 0,00 | 0 | |||||
| 2026-01-13 | 13F | Kathmere Capital Management, LLC | 9.432 | 31,53 | 871 | 36,15 | ||||
| 2026-01-22 | 13F | Massachusetts Financial Services Co /ma/ | 1.859.522 | -1,34 | 171.634 | 2,17 | ||||
| 2026-02-06 | 13F | Pnc Financial Services Group, Inc. | 4.372 | -7,00 | 404 | -3,82 | ||||
| 2026-04-15 | 13F | Rempart Asset Management Inc. | 187.593 | -3,96 | 13.671 | -24,27 | ||||
| 2026-02-10 | 13F | Goldman Sachs Group Inc | 1.201.736 | 4,28 | 110.920 | 7,99 | ||||
| 2025-11-12 | 13F | NewSquare Capital LLC | 0 | -100,00 | 0 | |||||
| 2026-02-13 | 13F | JustInvest LLC | 12.707 | -5,86 | 1.173 | -2,58 | ||||
| 2026-02-04 | 13F | Swiss Life Asset Management Ltd | 53.545 | 10,35 | 4.946 | 14,28 | ||||
| 2026-02-12 | 13F | Brown Brothers Harriman & Co | 118 | 11 | ||||||
| 2026-02-13 | 13F | Royal London Asset Management Ltd | 13.968 | 6,47 | 1.289 | 10,27 | ||||
| 2025-11-12 | 13F | 111 Capital | 8.250 | -58,74 | 734 | -65,06 | ||||
| 2025-11-05 | 13F | Savant Capital, LLC | 0 | -100,00 | 0 | |||||
| 2026-02-17 | 13F | Aqr Capital Management Llc | 106.315 | 784,78 | 9.820 | 817,66 | ||||
| 2026-02-17 | 13F | Minichmacgregor Wealth Management, Llc | 7.834 | -12,80 | 723 | -9,62 | ||||
| 2026-02-17 | 13F | SageView Advisory Group, LLC | 7 | 1 | ||||||
| 2026-04-14 | 13F | Clean Yield Group | 0 | -100,00 | 0 | |||||
| 2026-02-10 | 13F | Connor, Clark & Lunn Investment Management Ltd. | 928.958 | 26,14 | 85.783 | 30,75 | ||||
| 2026-04-13 | 13F | IFP Advisors, Inc | 1.633 | -6,15 | 119 | -25,62 | ||||
| 2026-01-30 | 13F | Us Bancorp \de\ | 3.381 | 17,72 | 312 | 21,88 | ||||
| 2026-02-05 | 13F | Td Private Client Wealth Llc | 9 | 1 | ||||||
| 2025-11-12 | 13F | Bare Financial Services, Inc | 0 | -100,00 | 0 | |||||
| 2026-02-05 | 13F | Mission Wealth Management, Lp | 3.973 | 0,10 | 367 | 3,68 | ||||
| 2026-02-12 | 13F | Chilton Capital Management Llc | 1.250 | 0,00 | 115 | 3,60 | ||||
| 2025-11-07 | 13F | Shell Asset Management Co | 10.455 | -19,30 | 1 | -100,00 | ||||
| 2026-02-13 | 13F | Colony Group, LLC | 5.724 | 36,35 | 528 | 41,55 | ||||
| 2026-02-17 | 13F | Public Employees Retirement System Of Ohio | 35.614 | -19,09 | 3.291 | -16,09 | ||||
| 2025-10-30 | 13F | Twin Peaks Wealth Advisors, LLC | 0 | -100,00 | 0 | |||||
| 2026-02-13 | 13F | Manufacturers Life Insurance Company, The | 2.634.843 | 78,38 | 243.885 | 85,33 | ||||
| 2026-02-02 | 13F | Qrg Capital Management, Inc. | 4.408 | -1,96 | 408 | 1,75 | ||||
| 2026-02-11 | 13F | Vise Technologies, Inc. | 10.135 | 86,65 | 935 | 93,58 | ||||
| 2026-01-30 | 13F | Lincluden Management Ltd | 49.716 | -1,30 | 6 | 50,00 | ||||
| 2026-02-11 | 13F | Westerkirk Capital Inc. | 2.033 | -78,45 | 188 | -77,74 | ||||
| 2026-02-10 | 13F | Td Asset Management Inc | 1.920.130 | -6,79 | 177.592 | -3,23 | ||||
| 2026-01-05 | 13F | Union Bancaire Privee, UBP SA | 9.356 | 68,97 | 880 | 80,49 | ||||
| 2026-04-08 | 13F | Legacy Wealth Asset Management, LLC | 0 | -100,00 | 0 | |||||
| 2025-11-03 | 13F | Summit Global Investments | 0 | -100,00 | 0 | |||||
| 2026-02-17 | 13F | Caisse De Depot Et Placement Du Quebec | 16.290.487 | 0,00 | 1.506.699 | 3,82 | ||||
| 2026-02-12 | 13F | Groupe la Francaise | 1.710.845 | 2,23 | 157.825 | 5,72 | ||||
| 2026-02-03 | 13F | Generali Asset Management SPA SGR | 15.439 | 2,73 | 1.957 | 5,10 | ||||
| 2026-02-17 | 13F | Schonfeld Strategic Advisors LLC | 0 | -100,00 | 0 | |||||
| 2026-02-10 | 13F | Natixis Advisors, L.p. | 10.982 | -4,84 | 1 | 0,00 | ||||
| 2026-02-17 | 13F | Voloridge Investment Management, Llc | 164.322 | -8,36 | 15.167 | -5,11 | ||||
| 2026-01-26 | 13F | Private Trust Co Na | 14 | -12,50 | 1 | 0,00 | ||||
| 2026-02-11 | 13F | Erste Asset Management GmbH | 23.693 | 2.216 | ||||||
| 2026-02-13 | 13F | Sei Investments Co | 17.125 | 1.581 | ||||||
| 2026-02-17 | 13F | D. E. Shaw & Co., Inc. | 279.262 | -55,29 | 25.790 | -53,65 | ||||
| 2026-02-12 | 13F | Renaissance Technologies Llc | 0 | -100,00 | 0 | |||||
| 2026-02-12 | 13F | Campbell & CO Investment Adviser LLC | 0 | -100,00 | 0 | |||||
| 2026-02-17 | 13F | Gotham Asset Management, LLC | 15.239 | -27,09 | 1.407 | -24,49 | ||||
| 2026-02-13 | 13F | Centiva Capital, LP | 2.530 | -37,14 | 234 | -34,92 | ||||
| 2026-02-17 | 13F | NorthRock Partners, LLC | 4.127 | 0,00 | 381 | 3,54 | ||||
| 2026-01-07 | 13F | Sagespring Wealth Partners, Llc | 2.174 | 201 | ||||||
| 2026-02-13 | 13F | Squarepoint Ops LLC | 9.841 | 44,76 | 908 | 50,08 | ||||
| 2026-02-17 | 13F | Point72 Asset Management, L.P. | 0 | -100,00 | 0 | |||||
| 2026-02-24 | 13F | Bell Investment Advisors, Inc | 15 | -81,93 | 1 | -85,71 | ||||
| 2026-02-17 | 13F | Aquatic Capital Management LLC | 3.825 | 137,73 | 353 | 146,85 | ||||
| 2026-02-13 | 13F | BNP Paribas Asset Management Holding S.A. | 476.337 | 15,76 | 60 | 20,00 | ||||
| 2026-02-17 | 13F | Grantham, Mayo, Van Otterloo & Co. LLC | 357.455 | 125,73 | 33.061 | 134,35 | ||||
| 2026-02-02 | 13F | Principal Financial Group Inc | 50.351 | -3,27 | 4.657 | 0,41 | ||||
| 2026-02-18 | 13F | Achmea Investment Management B.V. | 30.683 | 3,30 | 3 | 0,00 | ||||
| 2026-02-18 | 13F | Mackenzie Financial Corp | 5.857.537 | 2,02 | 543.670 | 6,33 | ||||
| 2026-02-12 | 13F | Empower Advisory Group, LLC | 10.613 | 29,76 | 982 | 34,75 | ||||
| 2026-02-03 | 13F | SBI Securities Co., Ltd. | 10 | 1 | ||||||
| 2026-02-12 | 13F | New South Capital Management Inc | 500.397 | 3,77 | 46.187 | 7,46 | ||||
| 2025-10-21 | 13F | Jarislowsky, Fraser Ltd | 4.033.813 | -4,37 | 359.373 | -18,71 | ||||
| 2026-02-13 | 13F | Dixon Mitchell Investment Counsel Inc. | 1.843 | 170 | ||||||
| 2026-04-06 | 13F | GAMMA Investing LLC | 27 | 0,00 | 2 | -50,00 | ||||
| 2026-02-13 | 13F | Macquarie Group Ltd | 0 | -100,00 | 0 | |||||
| 2026-02-13 | 13F | Entropy Technologies, LP | 0 | -100,00 | 0 | |||||
| 2026-01-09 | 13F | SG Americas Securities, LLC | 0 | -100,00 | 0 | -100,00 | ||||
| 2026-02-17 | 13F | PDT Partners, LLC | 31.554 | 188,32 | 2.912 | 198,67 | ||||
| 2026-02-11 | 13F | Cerity Partners LLC | 13.420 | -37,33 | 1.239 | -35,12 | ||||
| 2026-02-13 | 13F | Van Eck Associates Corp | 40.051 | 16,87 | 4 | 0,00 | ||||
| 2026-02-24 | 13F | DGS Capital Management, LLC | 13.623 | -35,21 | 1.257 | -32,92 | ||||
| 2026-02-17 | 13F | Laird Norton Trust Company, Llc | 8.051 | 743 | ||||||
| 2026-02-13 | 13F | Umb Bank N A/mo | 204 | 10,27 | 19 | 12,50 | ||||
| 2026-02-17 | 13F | Cetera Investment Advisers | 2.465 | -26,72 | 228 | -24,08 | ||||
| 2025-11-07 | 13F | Turn8 Private Wealth Inc. | 0 | -100,00 | 0 | |||||
| 2026-01-27 | 13F | TD Waterhouse Canada Inc. | 683.532 | 1,16 | 63.084 | 4,28 | ||||
| 2026-02-17 | 13F | Mercer Global Advisors Inc /adv | 2.565 | -21,75 | 237 | -19,18 | ||||
| 2026-02-12 | 13F | APG Asset Management N.V. | 153.986 | -2,97 | 12.126 | 0,77 | ||||
| 2026-02-12 | 13F | Skopos Labs, Inc. | 2.159 | 202 | ||||||
| 2026-02-03 | 13F | Sequoia Financial Advisors, LLC | 36.449 | 1,81 | 3.364 | 5,45 | ||||
| 2026-01-20 | 13F | QV Investors Inc. | 707.210 | -7,18 | 65 | -2,99 | ||||
| 2026-01-28 | 13F | DekaBank Deutsche Girozentrale | 924.054 | 0,00 | 103 | 27,16 | ||||
| 2026-02-13 | 13F | Natixis | 59.032 | 352,49 | 5.449 | 368,85 | ||||
| 2026-01-14 | 13F | Net Worth Advisory Group | 3.901 | 4,70 | 360 | 8,43 | ||||
| 2026-01-29 | 13F | Vanguard Group Inc | 8.269.665 | -0,17 | 763.852 | 3,52 | ||||
| 2026-02-17 | 13F | Utah Retirement Systems | 22.522 | 0,00 | 2.083 | 3,84 | ||||
| 2026-02-10 | 13F | Nomura Asset Management Co Ltd | 0 | 0 | ||||||
| 2026-02-12 | 13F | Federation des caisses Desjardins du Quebec | 3.347.377 | -42,45 | 309.114 | -40,16 | ||||
| 2026-02-09 | 13F | Hartland & Co., LLC | 151 | 0,67 | 14 | 0,00 | ||||
| 2026-02-13 | 13F | Alberta Investment Management Corp | 700.500 | 64.705 | ||||||
| 2026-01-07 | 13F | KFA Private Wealth Group, LLC | 12.055 | -7,58 | 1.113 | -4,30 | ||||
| 2026-01-30 | 13F | Bogart Wealth, LLC | 107 | 0,00 | 10 | 0,00 | ||||
| 2026-02-13 | 13F | Rhumbline Advisers | 1.175 | -1,59 | 108 | 1,89 | ||||
| 2026-02-02 | 13F | Fifth Third Bancorp | 438 | 186,27 | 40 | 207,69 | ||||
| 2026-01-30 | 13F | Mitsubishi UFJ Trust & Banking Corp | 0 | -100,00 | 0 | |||||
| 2026-02-17 | 13F | Voleon Capital Management Lp | 5.023 | 464 | ||||||
| 2026-01-23 | 13F | Lester Murray Antman dba SimplyRich | 29.462 | 1,90 | 3 | 0,00 | ||||
| 2026-02-12 | 13F | Aviva Plc | 164.187 | 5,46 | 15.177 | 9,55 | ||||
| 2025-11-13 | 13F | FORA Capital, LLC | 0 | -100,00 | 0 | |||||
| 2026-04-13 | 13F | Creative Financial Designs Inc /adv | 6 | -33,33 | 0 | |||||
| 2026-02-17 | 13F | Banco Bilbao Vizcaya Argentaria, S.a. | 0 | -100,00 | 0 | |||||
| 2026-01-29 | 13F | UMA Financial Services, Inc. | 18 | 260,00 | 2 | |||||
| 2026-02-13 | 13F | Public Sector Pension Investment Board | 0 | -100,00 | 0 | |||||
| 2026-02-11 | 13F | Caldwell Investment Management Ltd. | 12.910 | 0,00 | 1.200 | 4,53 | ||||
| 2026-02-17 | 13F | Glenmede Trust Co Na | 2.465 | 0,74 | 228 | -6,97 | ||||
| 2026-01-29 | 13F | Pictet Asset Management Holding SA | 202.035 | 14,08 | 18.686 | 18,44 | ||||
| 2026-02-17 | 13F | XTX Topco Ltd | 0 | -100,00 | 0 | |||||
| 2026-02-17 | 13F | Susquehanna International Group, Llp | Put | 0 | -100,00 | 0 | ||||
| 2026-01-07 | 13F | Northside Capital Management, LLC | 0 | -100,00 | 0 | |||||
| 2025-10-24 | 13F | Hemington Wealth Management | 47 | 0,00 | 0 | |||||
| 2026-02-13 | 13F | Wells Fargo & Company/mn | 7.860 | -5,04 | 725 | -1,63 | ||||
| 2026-04-10 | 13F | Harbor Group, Inc. | 6.275 | 0,00 | 459 | -20,90 | ||||
| 2026-02-12 | 13F | Pembroke Management, LTD | 14.220 | -34,83 | 1.313 | -32,51 | ||||
| 2026-02-12 | 13F | Ensign Peak Advisors, Inc | 11.100 | 0,00 | 1.027 | 3,85 | ||||
| 2026-02-13 | 13F | Towarzystwo Funduszy Inwestycyjnych Pzu Sa | 0 | -100,00 | 0 | |||||
| 2026-02-10 | 13F/A | Northwestern Mutual Wealth Management Co | 1.662 | 72,05 | 153 | 77,91 | ||||
| 2026-02-13 | 13F | National Bank Of Canada /fi/ | 2.872.610 | 7,00 | 264.763 | 11,22 | ||||
| 2026-02-13 | 13F | USS Investment Management Ltd | 35.823 | 14,64 | 3.316 | 19,37 | ||||
| 2026-02-17 | 13F | Fmr Llc | 21.954 | -6,46 | 2.027 | -3,06 | ||||
| 2026-04-07 | 13F | Farther Finance Advisors, LLC | 2.639 | -43,38 | 191 | -55,81 | ||||
| 2026-02-10 | 13F | Quantbot Technologies LP | 37.157 | -45,44 | 3.430 | -43,50 | ||||
| 2026-02-10 | 13F | CIBC World Markets Inc. | 1.990.663 | -4,88 | 183.897 | -1,33 | ||||
| 2026-02-13 | 13F | Neuberger Berman Group LLC | 80.751 | 3,67 | 7.469 | 7,62 | ||||
| 2026-02-13 | 13F | Toroso Investments, LLC | 7.533 | 3,52 | 695 | 7,25 | ||||
| 2026-04-08 | 13F | Wealth Enhancement Advisory Services, Llc | 0 | -100,00 | 0 | |||||
| 2026-01-20 | 13F | Moseley Investment Management Inc | 2.790 | 0,00 | 258 | 3,63 | ||||
| 2026-02-03 | 13F | Cassaday & Co Wealth Management LLC | 5.478 | 0,00 | 507 | 3,69 | ||||
| 2026-02-13 | 13F | Charles Schwab Investment Management Inc | 594.456 | 5,17 | 54.981 | 9,18 | ||||
| 2026-02-17 | 13F | Toronto Dominion Bank | Put | 3.800 | -25,49 | 351 | -22,69 | |||
| 2026-02-11 | 13F | Jpmorgan Chase & Co | 831.987 | -27,92 | 76.792 | -25,35 | ||||
| 2026-02-17 | 13F | Toronto Dominion Bank | Call | 4.100 | 32,26 | 379 | 36,96 | |||
| 2026-02-17 | 13F | Sciencast Management LP | 3.134 | -75,06 | 289 | -74,20 | ||||
| 2026-03-18 | 13F | Employees Provident Fund Board | 0 | -100,00 | 0 | |||||
| 2026-02-17 | 13F | Citadel Advisors Llc | Call | 15.100 | -1,31 | 1.394 | 2,20 | |||
| 2026-02-17 | 13F | Citadel Advisors Llc | 113.446 | -48,90 | 10.471 | -47,09 | ||||
| 2025-11-12 | 13F | Creekmur Asset Management LLC | 1.450 | -39,68 | 129 | -48,61 | ||||
| 2026-04-15 | 13F | Avanza Fonder AB | 13.289 | 0,00 | 1.351 | -19,77 | ||||
| 2026-01-29 | 13F | Nbc Securities, Inc. | 0 | -100,00 | 0 | |||||
| 2026-02-17 | 13F | Citadel Advisors Llc | Put | 2.400 | -4,00 | 222 | -0,45 | |||
| 2026-02-17 | 13F | Toronto Dominion Bank | 964.562 | 13,67 | 89.100 | 17,92 | ||||
| 2026-02-02 | 13F | CENTRAL TRUST Co | 84 | 0,00 | 8 | 0,00 | ||||
| 2026-02-12 | 13F | Pitcairn Co | 0 | -100,00 | 0 | |||||
| 2026-01-14 | 13F | Canoe Financial LP | 66.272 | -1,01 | 6.122 | 2,68 | ||||
| 2026-01-29 | 13F | UBS Group AG | 445.586 | 1,61 | 41.128 | 5,22 | ||||
| 2026-02-10 | 13F | Norges Bank | 2.629.343 | 242.873 | ||||||
| 2026-02-03 | 13F | Crossmark Global Holdings, Inc. | 9.964 | -37,06 | 920 | -34,87 | ||||
| 2026-02-10 | 13F | Walter Public Investments Inc. | 115.959 | -19,31 | 10.708 | -16,28 | ||||
| 2026-02-12 | 13F | Penserra Capital Management LLC | 12 | -33,33 | 0 | |||||
| 2026-02-13 | 13F | Bank Of Nova Scotia | 609.264 | -18,03 | 56.275 | -15,01 | ||||
| 2026-02-13 | 13F | Transamerica Financial Advisors, Inc. | 0 | -100,00 | 0 | |||||
| 2026-02-05 | 13F | Allworth Financial LP | 639 | 7,39 | 59 | 9,43 | ||||
| 2026-02-17 | 13F | Amundi | 423.431 | 39,28 | 39.083 | 41,12 | ||||
| 2026-02-02 | 13F | Intact Investment Management Inc. | 0 | -100,00 | 0 | |||||
| 2026-02-18 | 13F | State of Tennessee, Treasury Department | 115.012 | -1,54 | 9.912 | -4,77 | ||||
| 2026-01-27 | 13F | Evergreen Capital Management Llc | 2.319 | -20,17 | 214 | -17,05 | ||||
| 2026-02-10 | 13F | CIBC Asset Management Inc | 241.052 | -5,09 | 22.282 | -1,41 | ||||
| 2026-02-09 | 13F | Mediolanum International Funds Ltd | 129.367 | 92,54 | 12.044 | 101,66 | ||||
| 2026-02-17 | 13F | Man Group plc | 112.497 | -33,23 | 10.401 | -30,72 | ||||
| 2026-02-17 | 13F | Canada Pension Plan Investment Board | 1.234.854 | 33,52 | 114.064 | 38,49 | ||||
| 2026-02-17 | 13F | Creative Planning | 58.697 | 171,42 | 5.418 | 181,11 | ||||
| 2026-02-11 | 13F | LPL Financial LLC | 13.082 | 21,50 | 1.207 | 25,86 | ||||
| 2025-11-06 | 13F | Western Wealth Management, LLC | 0 | -100,00 | 0 | |||||
| 2025-11-12 | 13F | Burgundy Asset Management Ltd. | 799.246 | 27,27 | 77.564 | 17,82 | ||||
| 2026-04-06 | 13F | Versant Capital Management, Inc | 2.168 | -34,40 | 158 | -48,20 | ||||
| 2026-02-12 | 13F | Hrt Financial Lp | 0 | -100,00 | 0 | |||||
| 2026-02-12 | 13F | Hm Payson & Co | 0 | -100,00 | 0 | -100,00 | ||||
| 2025-11-06 | 13F | Candriam Luxembourg S.C.A. | 0 | -100,00 | 0 | |||||
| 2026-02-12 | 13F | BRYN MAWR TRUST Co | 33 | 0,00 | 3 | 50,00 | ||||
| 2026-02-17 | 13F | Ameriprise Financial Inc | 8.191 | 3,63 | 914 | 6,28 | ||||
| 2026-02-12 | 13F | Rossby Financial, LCC | 4.433 | -11,23 | 409 | -8,91 | ||||
| 2026-02-13 | 13F | Mufg Securities (canada), Ltd. | 296.956 | -9,73 | 27.435 | -6,35 | ||||
| 2025-11-14 | 13F | Axa S.a. | 0 | -100,00 | 0 | |||||
| 2026-02-17 | 13F | New Vernon Capital Holdings II LLC | 473 | 60 | ||||||
| 2025-11-14 | 13F | Wolverine Trading, Llc | Put | 0 | -100,00 | 0 | ||||
| 2026-02-13 | 13F | Police & Firemen's Retirement System of New Jersey | 26.799 | -7,97 | 2.479 | -4,47 | ||||
| 2026-02-09 | 13F | Morningstar Investment Management LLC | 9.933 | -0,09 | 1 | |||||
| 2026-02-13 | 13F | 1832 Asset Management L.P. | 5.352.267 | 351,27 | 494.014 | 367,32 | ||||
| 2026-04-14 | 13F | Zrc Wealth Management, Llc | 212 | 0,00 | 15 | -21,05 | ||||
| 2026-02-12 | 13F | Brinker Capital Investments, LLC | 4.016 | -51,91 | 371 | -50,27 | ||||
| 2026-01-26 | 13F | Cwm, Llc | 1.172 | -9,22 | 0 | |||||
| 2026-02-17 | 13F | Modern Wealth Management, LLC | 3.032 | -21,63 | 280 | -18,90 | ||||
| 2026-02-06 | 13F | Addison Advisors LLC | 77 | 1.440,00 | 7 | |||||
| 2026-01-07 | 13F | Harbour Capital Advisors, LLC | 3.873 | -6,29 | 353 | -5,61 | ||||
| 2025-11-14 | 13F | Point72 Asia (Singapore) Pte. Ltd. | 3.699 | 330 | ||||||
| 2026-01-27 | 13F | WealthCollab, LLC | 526 | -20,06 | 49 | -17,24 | ||||
| 2026-01-28 | 13F | Gold Investment Management Ltd. | 16 | 0,00 | 1 | 0,00 | ||||
| 2026-02-17 | 13F | Russell Investments Group, Ltd. | 215.185 | 41,62 | 19.943 | 47,38 | ||||
| 2026-02-10 | 13F | One Capital Management, LLC | 3.327 | 308 | ||||||
| 2026-02-13 | 13F | Kilter Group LLC | 8 | -20,00 | 1 | |||||
| 2026-02-10 | 13F | Intech Investment Management Llc | 3.528 | -63,20 | 326 | -61,83 | ||||
| 2026-01-23 | 13F | Assetmark, Inc | 1.449 | -33,07 | 134 | -30,73 | ||||
| 2026-02-06 | 13F | Leonteq Securities AG | 1.095 | 139 | ||||||
| 2026-02-17 | 13F | Lazard Asset Management Llc | 32.702 | -68,48 | 3.021 | -67,32 | ||||
| 2026-02-13 | 13F | Promethos Capital, LLC | 0 | -100,00 | 0 | |||||
| 2026-02-03 | 13F | ASR Vermogensbeheer N.V. | 70.537 | 16,52 | 6.524 | 20,95 | ||||
| 2026-02-13 | 13F | Great West Life Assurance Co /can/ | 176.745 | -1,56 | 16 | 6,67 | ||||
| 2025-11-06 | 13F | Johnson Investment Counsel Inc | 0 | -100,00 | 0 | |||||
| 2026-02-12 | 13F | Andra AP-fonden | 22.800 | -77,38 | 2.891 | -76,87 | ||||
| 2025-11-14 | 13F | Wetherby Asset Management Inc | 5.213 | -12,55 | 465 | -25,64 | ||||
| 2026-02-24 | 13F/A | Pacer Advisors, Inc. | 4 | 0,00 | 0 | -100,00 |