Grundlæggende statistik
| Institutionelle aktier (lange) | 419.090.510 - 87,74% (ex 13D/G) - change of -106,59MM shares -20,28% MRQ |
| Institutionel værdi (lang) | $ 9.534.131 USD ($1000) |
Institutionelt ejerskab og aktionærer
First Horizon Corporation (US:FHN) har 628 institutionelle ejere og aktionærer, der har indsendt 13D/G- eller 13F-formularer til Securities Exchange Commission (SEC). Disse institutioner har i alt 419,090,510 aktier. Største aktionærer omfatter BlackRock, Inc., Vanguard Group Inc, Bank of New York Mellon Corp, State Street Corp, Dimensional Fund Advisors Lp, Ubs Asset Management Americas Inc, Fmr Llc, Lsv Asset Management, North Reef Capital Management LP, and Millennium Management Llc .
First Horizon Corporation (NYSE:FHN) institutionel ejerskabsstruktur viser aktuelle positioner i virksomheden efter institutioner og fonde, samt seneste ændringer i positionsstørrelse. Større aktionærer kan omfatte individuelle investorer, investeringsforeninger, hedgefonde eller institutioner. Skema 13D angiver, at investoren besidder (eller besidder) mere end 5 % af virksomheden og har til hensigt (eller har til hensigt at) aktivt at forfølge en ændring i forretningsstrategi. Skema 13G indikerer en passiv investering på over 5%.
The share price as of March 31, 2026 is 22,76 / share. Previously, on April 1, 2025, the share price was 19,14 / share. This represents an increase of 18,91% over that period.

Fondens stemningsscore
Fund Sentiment Score (fka Ownership Accumulation Score) finder de aktier, der bliver mest købt af fonde. Det er resultatet af en sofistikeret, multi-faktor kvantitativ model, der identificerer virksomheder med de højeste niveauer af institutionel akkumulering. Scoringsmodellen bruger en kombination af den samlede stigning i oplyste ejere, ændringerne i porteføljeallokeringer i disse ejere og andre målinger. Tallet går fra 0 til 100, hvor højere tal indikerer et højere niveau af akkumulering for sine jævnaldrende, og 50 er gennemsnittet.
Opdateringsfrekvens: Dagligt
Se Ownership Explorer, som giver en liste over højest rangerende virksomheder.
AI+ Ask Fintel’s AI assistant about First Horizon Corporation.
Select a question to share a public post with an AI-crafted answer.
Thinking of good questions…
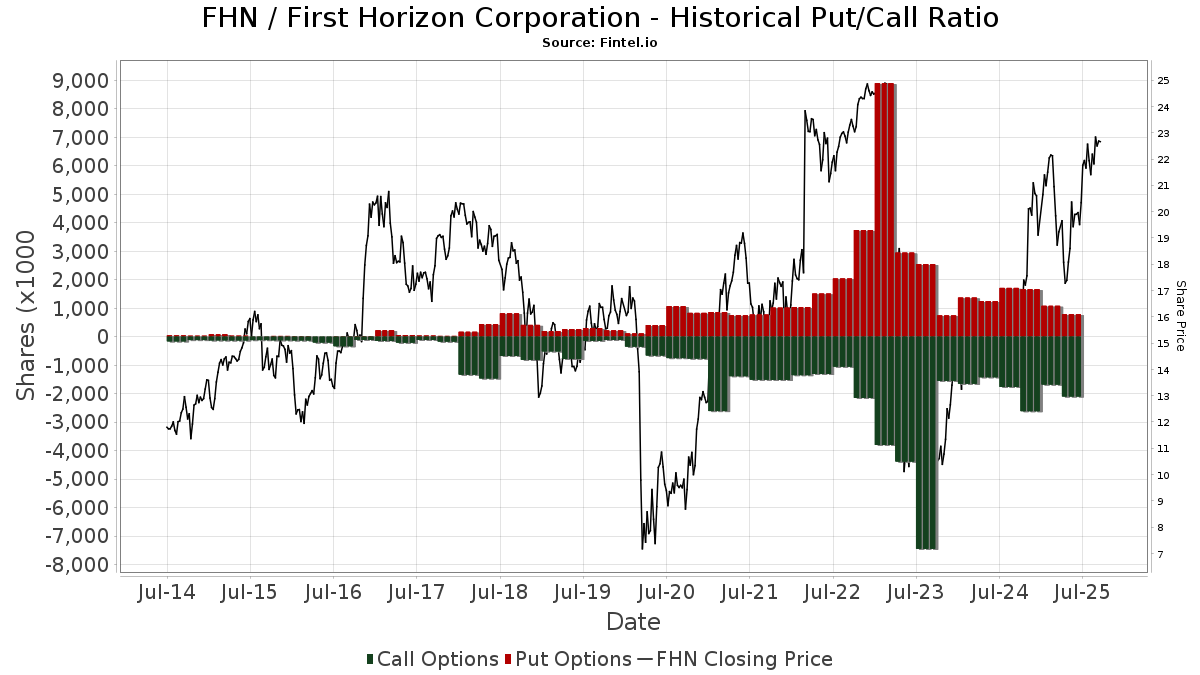
Institutionel Put/Call-forhold
Ud over at indberette standardaktie- og gældsudstedelser skal institutter med mere end 100 mill. aktiver under forvaltning også oplyse deres put- og call-optionsbeholdninger. Da salgsoptioner generelt indikerer negativ stemning, og købsoptioner indikerer positiv stemning, kan vi få en fornemmelse af den overordnede institutionelle stemning ved at plotte forholdet mellem put og kald. Diagrammet til højre viser det historiske put/call-forhold for dette instrument.
Brug af Put/Call Ratio som en indikator for investorernes stemning overvinder en af de vigtigste mangler ved at bruge totalt institutionelt ejerskab, som er, at en betydelig mængde af aktiver under forvaltning investeres passivt for at spore indekser. Passivt forvaltede fonde køber typisk ikke optioner, så indikatoren for put/call-forholdet følger mere nøje følelsen af aktivt forvaltede fonde.
13D/G-arkivering
Vi præsenterer 13D/G ansøgninger separat fra 13F ansøgninger på grund af den forskellige behandling af SEC. 13D/G-ansøgninger kan indgives af grupper af investorer (med én ledende), hvorimod 13F-ansøgninger ikke kan. Dette resulterer i situationer, hvor en investor kan indsende en 13D/G, der rapporterer én værdi for de samlede aktier (der repræsenterer alle de aktier, der ejes af investorgruppen), men derefter indsender en 13F, der rapporterer en anden værdi for de samlede aktier (der udelukkende repræsenterer deres egne) ejendomsret). Det betyder, at aktieejerskab af 13D/G-arkiver og 13F-arkiveringer ofte ikke er direkte sammenlignelige, så vi præsenterer dem separat.
Bemærk: Fra den 16. maj 2021 viser vi ikke længere ejere, der ikke har indsendt en 13D/G inden for det seneste år. Tidligere viste vi den fulde historie af 13D/G-arkiver. Generelt skal enheder, der er forpligtet til at indgive 13D/G-ansøgninger, indgive mindst årligt, før de indsender en afsluttende ansøgning. Dog forlader fonde nogle gange positioner uden at indsende en afsluttende ansøgning (dvs. de afvikler), så visning af den fulde historie resulterede nogle gange i forvirring om det nuværende ejerskab. For at undgå forvirring viser vi nu kun 'aktuelle' ejere - det vil sige - ejere, der har anmeldt inden for det seneste år.
Upgrade to unlock premium data.
| Fil dato | Form | Investor | Forrige Aktier |
Seneste Aktier |
Δ Aktier (Procent) |
Ejendomsret (Procent) |
Δ Ejerskab (Procent) |
|
|---|---|---|---|---|---|---|---|---|
| 2026-01-29 | INTEGRATED CORE STRATEGIES (US) LLC | 25,405,699 | 18,817,089 | -25.93 | 3.80 | -24.00 | ||
| 2025-05-13 | STATE STREET CORP | 27,702,979 | 23,024,322 | -16.89 | 4.50 | -13.46 |
13F og NPORT arkivering
Detaljer om 13F-arkivering er gratis. Detaljer om NP-ansøgninger kræver et premium-medlemskab. Grønne rækker angiver nye positioner. Røde rækker angiver lukkede positioner. Klik på linket ikon for at se den fulde transaktionshistorik.
Opgrader
for at låse premium-data op og eksportere til Excel ![]() .
.
Important Note
In an effort to reduce load times for our mobile users, we are testing some ways to deliver lighter pages.
In this first test, we will deliver only the most recent 750 transactions (out of 766 for this stock). If you are interested in loading *all* the transactions for this company, click the "load all" button below. This is just a test and if you don't like it, please let us know by submitting some gentle feedback via the link at the bottom of this page.
Load All| Fil dato | Kilde | Investor | Type | Gennemsnitlig pris (Øst) |
Aktier | Δ Aktier (%) |
Rapporteret Værdi ($1000) |
Δ Værdi (%) |
Port Alloc (%) |
|
|---|---|---|---|---|---|---|---|---|---|---|
| 2025-11-14 | 13F | Texas Permanent School Fund | 0 | -100,00 | 0 | |||||
| 2026-01-29 | 13F | Vanguard Group Inc | 48.473.416 | -3,99 | 1.158.515 | 1,49 | ||||
| 2026-02-04 | 13F | Virginia Retirement Systems Et Al | 170.014 | -4,60 | 4.063 | 0,84 | ||||
| 2026-02-12 | 13F | Chilton Capital Management Llc | 0 | -100,00 | 0 | |||||
| 2026-02-05 | 13F | Baader Bank INC | 23.640 | 565 | ||||||
| 2026-01-05 | 13F | Park Avenue Securities Llc | 12.598 | 0 | ||||||
| 2026-02-12 | 13F | New York State Common Retirement Fund | 251.312 | -19,85 | 6.006 | -15,27 | ||||
| 2026-02-17 | 13F | Css Llc/il | 0 | -100,00 | 0 | |||||
| 2026-02-17 | 13F | SummitTX Capital, L.P. | 73.899 | -4,17 | 1.766 | 1,32 | ||||
| 2026-02-10 | 13F | Jupiter Asset Management Ltd | 3.653.460 | 67,96 | 87.318 | 77,55 | ||||
| 2025-11-13 | 13F | Fuller & Thaler Asset Management, Inc. | 0 | -100,00 | 0 | -100,00 | ||||
| 2026-02-17 | 13F | Greenland Capital Management LP | Call | 13.200 | 315 | |||||
| 2025-11-07 | 13F | Beacon Capital Management, LLC | 0 | -100,00 | 0 | |||||
| 2026-02-05 | 13F | Qsemble Capital Management, LP | 451.446 | 303,30 | 10.790 | 326,44 | ||||
| 2026-02-17 | 13F | Guggenheim Capital Llc | 12.745 | -14,58 | 305 | -9,79 | ||||
| 2026-02-11 | 13F | Picton Mahoney Asset Management | 15.381 | -95,34 | 368 | 5.142,86 | ||||
| 2026-02-17 | 13F | Cambria Investment Management, L.P. | 27.837 | -1,28 | 665 | 4,40 | ||||
| 2026-01-27 | 13F | Summit Financial Wealth Advisors, LLC | 116.581 | 10,03 | 2.786 | 17,60 | ||||
| 2026-02-09 | 13F | Knights of Columbus Asset Advisors LLC | 406.711 | 43,49 | 9.720 | 51,69 | ||||
| 2026-02-03 | 13F | Mitsubishi UFJ Kokusai Asset Management Co., Ltd. | 470.620 | 4,97 | 11.356 | 12,03 | ||||
| 2026-03-09 | 13F | EMC Capital Management | 10.600 | -15,00 | 0 | |||||
| 2026-01-26 | 13F | JNBA Financial Advisors | 218 | 21,11 | 5 | 25,00 | ||||
| 2026-02-06 | 13F | Lsv Asset Management | 12.169.682 | -4,39 | 291 | 1,05 | ||||
| 2026-01-30 | 13F | New York State Teachers Retirement System | 492.860 | -3,70 | 12 | 0,00 | ||||
| 2026-02-09 | 13F | Jefferies Financial Group Inc. | 79.614 | 218,46 | 1.903 | 236,64 | ||||
| 2025-10-21 | 13F | Vishria Bird Financial Group, LLC | 19.223 | 0,33 | 435 | 6,90 | ||||
| 2026-01-20 | 13F | Stratos Wealth Partners, LTD. | 9.901 | -45,88 | 237 | -42,86 | ||||
| 2026-02-12 | 13F | Ensign Peak Advisors, Inc | 29.567 | -74,68 | 707 | -73,26 | ||||
| 2026-01-20 | 13F | Signaturefd, Llc | 12.705 | 14,09 | 304 | 20,72 | ||||
| 2025-11-07 | 13F | Atticus Wealth Management, Llc | 0 | -100,00 | 0 | -100,00 | ||||
| 2026-02-17 | 13F | Polar Capital Holdings Plc | 0 | -100,00 | 0 | |||||
| 2026-01-08 | 13F | NorthCrest Asset Manangement, LLC | 9.194 | 1,52 | 226 | 8,17 | ||||
| 2026-02-05 | 13F | Gabelli Funds Llc | 39.000 | 0,00 | 932 | 5,79 | ||||
| 2026-02-17 | 13F | Aqr Capital Management Llc | 1.993.919 | -1,10 | 47.655 | 4,55 | ||||
| 2026-01-15 | 13F | Highline Wealth Partners Llc | 1 | 0,00 | 0 | |||||
| 2026-02-13 | 13F | Sterling Capital Management LLC | 33.429 | -3,75 | 799 | 1,66 | ||||
| 2026-01-16 | 13F | FNY Investment Advisers, LLC | 2.540 | -0,55 | 0 | |||||
| 2026-02-09 | 13F | Jefferies Financial Group Inc. | Call | 165.000 | 3.944 | |||||
| 2026-02-02 | 13F | Broussard Financial Group LLC | 19.583 | 468 | ||||||
| 2026-02-09 | 13F | William Blair Investment Management, Llc | 5.336.021 | 2,23 | 127.531 | 8,06 | ||||
| 2026-02-17 | 13F | Man Group plc | 269.118 | -4,42 | 6.432 | 1,02 | ||||
| 2026-02-17 | 13F | Maryland State Retirement & Pension System | 24.902 | 0,00 | 595 | 5,68 | ||||
| 2026-01-23 | 13F | Tectonic Advisors Llc | 185.068 | 4.423 | ||||||
| 2026-02-13 | 13F | Ossiam | 0 | -100,00 | 0 | |||||
| 2026-02-13 | 13F | Maltese Capital Management Llc | 192.500 | -58,15 | 4.601 | -55,77 | ||||
| 2026-02-17 | 13F | Point72 Asset Management, L.P. | 2.884.852 | 163,94 | 68.948 | 179,00 | ||||
| 2026-02-13 | 13F | Squarepoint Ops LLC | Call | 0 | -100,00 | 0 | -100,00 | |||
| 2026-02-13 | 13F | Brown Advisory Inc | 49.863 | -16,07 | 1.192 | -11,32 | ||||
| 2026-01-23 | 13F | Assetmark, Inc | 10.094 | 28,68 | 241 | 36,16 | ||||
| 2026-01-16 | 13F | Crew Capital Management, Ltd. | 8.883 | 0,00 | 212 | 6,00 | ||||
| 2026-02-10 | 13F | Bnp Paribas Arbitrage, Sa | 147.883 | -61,84 | 3.534 | -59,66 | ||||
| 2026-02-10 | 13F | Bnp Paribas Arbitrage, Sa | Put | 6.866 | 292,34 | 16.410 | 314,79 | |||
| 2026-02-06 | 13F | GPS Wealth Strategies Group, LLC | 0 | -100,00 | 0 | |||||
| 2026-02-10 | 13F | Bnp Paribas Arbitrage, Sa | Call | 50.516 | 1.834,00 | 120.733 | 1.944,59 | |||
| 2026-01-06 | 13F | Davis Investment Partners, LLC | 17.769 | -31,05 | 429 | -25,69 | ||||
| 2026-02-09 | 13F | Annis Gardner Whiting Capital Advisors, LLC | 38 | 1 | ||||||
| 2026-02-13 | 13F | HFG Advisors, Inc. | 15.755 | 377 | ||||||
| 2026-02-17 | 13F | Amundi | 503.613 | 52,06 | 12.036 | 57,66 | ||||
| 2026-02-12 | 13F | Pitcairn Co | 0 | -100,00 | 0 | |||||
| 2026-02-17 | 13F | Glenmede Trust Co Na | 14.518 | 347 | ||||||
| 2026-01-14 | 13F | Exchange Traded Concepts, Llc | 4.635 | 111 | ||||||
| 2026-02-11 | 13F | Illinois Municipal Retirement Fund | 68.661 | 0,72 | 1.641 | 6,42 | ||||
| 2026-02-11 | 13F | Ameritas Investment Partners, Inc. | 144.625 | 3.457 | ||||||
| 2026-02-12 | 13F | Azimuth Capital Investment Management LLC | 15.200 | 17,37 | 363 | 24,32 | ||||
| 2026-02-10 | 13F | Principia Wealth Advisory, LLC | 28 | 100,00 | 1 | |||||
| 2025-10-24 | 13F | Hemington Wealth Management | 645 | 10,45 | 0 | |||||
| 2026-02-06 | 13F | Global Retirement Partners, LLC | 21.033 | 1.880,51 | 503 | 1.991,67 | ||||
| 2026-02-17 | 13F | Northern Trust Corp | 4.329.019 | -5,29 | 103.464 | 0,12 | ||||
| 2026-02-13 | 13F | Level Four Advisory Services, Llc | 21.372 | 0,02 | 511 | 5,59 | ||||
| 2026-03-09 | 13F/A | CI Private Wealth, LLC | 126.862 | 4,54 | 3.032 | 10,54 | ||||
| 2026-01-16 | 13F | Longboard Asset Management, LP | 0 | -100,00 | 0 | |||||
| 2026-02-10 | 13F | Coyle Financial Counsel LLC | 32.143 | 768 | ||||||
| 2026-02-13 | 13F | Public Employees Retirement Association Of Colorado | 53.916 | 0,00 | 1 | 0,00 | ||||
| 2025-11-10 | 13F | Garda Capital Partners Lp | Put | 0 | -100,00 | 0 | -100,00 | |||
| 2025-11-10 | 13F | Garda Capital Partners Lp | Call | 0 | -100,00 | 0 | -100,00 | |||
| 2026-01-21 | 13F | Kentucky Trust Co | 1.587 | 0,00 | 38 | 5,71 | ||||
| 2026-01-30 | 13F | Bogart Wealth, LLC | 28 | 0,00 | 1 | |||||
| 2026-02-17 | 13F | Strive Financial Group ,LLC | 37 | 1 | ||||||
| 2026-02-06 | 13F/A | CapWealth Advisors, LLC | 18.803 | 0,00 | 449 | 5,65 | ||||
| 2026-02-18 | 13F | State of Tennessee, Treasury Department | 207.562 | -4,11 | 5.083 | 3,88 | ||||
| 2026-02-09 | 13F | Prospera Financial Services Inc | 25.903 | -4,57 | 619 | 0,98 | ||||
| 2026-03-16 | 13F/A | Rockefeller Capital Management L.P. | 85.534 | -17,45 | 2.044 | -12,72 | ||||
| 2026-02-06 | 13F | Handelsbanken Fonder AB | 150.719 | 4,80 | 4 | 0,00 | ||||
| 2026-02-12 | 13F | SWAN Capital LLC | 41 | 0,00 | 1 | |||||
| 2026-01-23 | 13F | State of Alaska, Department of Revenue | 49.048 | -10,55 | 1 | 0,00 | ||||
| 2026-02-10 | 13F | Norges Bank | 6.441.083 | 153.942 | ||||||
| 2026-02-04 | 13F | Independent Advisor Alliance | 61.021 | 0,16 | 1.458 | 5,88 | ||||
| 2026-02-13 | 13F | Stifel Financial Corp | 91.125 | -18,06 | 2.178 | -13,40 | ||||
| 2026-02-05 | 13F | Leeward Investments, LLC - MA | 1.672.242 | -3,22 | 39.967 | 2,30 | ||||
| 2026-02-17 | 13F | Susquehanna International Group, Llp | Put | 655.500 | 77,16 | 15.666 | 87,28 | |||
| 2026-02-04 | 13F | Naples Global Advisors, Llc | 18.472 | -5,14 | 444 | 0,23 | ||||
| 2026-02-17 | 13F | Susquehanna International Group, Llp | Call | 3.299.900 | 331,25 | 78.868 | 355,85 | |||
| 2026-02-17 | 13F | Interval Partners, LP | 1.185.340 | 3,42 | 28.330 | 9,32 | ||||
| 2026-01-29 | 13F | Ashton Thomas Private Wealth, LLC | 18.973 | 456 | ||||||
| 2026-02-17 | 13F | Susquehanna International Group, Llp | 84.747 | -83,20 | 2.025 | -82,24 | ||||
| 2026-01-26 | 13F | Foster Victor Wealth Advisors, LLC | 13.826 | 1,43 | 333 | 8,47 | ||||
| 2026-02-11 | 13F | Winton Capital Group Ltd | 302.249 | 649,61 | 7.224 | 692,86 | ||||
| 2025-10-28 | 13F | Rakuten Securities, Inc. | 0 | -100,00 | 0 | -100,00 | ||||
| 2026-01-22 | 13F | Red Tortoise LLC | 621 | 0,00 | 15 | 0,00 | ||||
| 2026-01-12 | 13F | Chickasaw Capital Management Llc | 12.319 | 0,00 | 0 | |||||
| 2026-01-28 | 13F | Teacher Retirement System Of Texas | 84.183 | -45,06 | 2.012 | -41,95 | ||||
| 2026-02-12 | 13F | Bahl & Gaynor Inc | 0 | -100,00 | 0 | |||||
| 2026-02-17 | 13F | one8zero8, LLC | 13.000 | 0,00 | 311 | 5,80 | ||||
| 2026-02-09 | 13F | Poinciana Advisors Group, Llc | 13.025 | 0,00 | 311 | 5,78 | ||||
| 2026-02-13 | 13F | Peak6 Llc | 276.560 | 73,44 | 6.610 | 83,33 | ||||
| 2025-10-07 | 13F | GFG Capital, LLC | 0 | -100,00 | 0 | |||||
| 2026-02-17 | 13F | Sig Brokerage, Lp | Call | 34.000 | 813 | |||||
| 2026-01-20 | 13F | Red Door Wealth Management, LLC | 37.872 | -0,17 | 905 | 5,60 | ||||
| 2026-01-30 | 13F | Sage Rhino Capital Llc | 10.135 | 2,37 | 242 | 8,52 | ||||
| 2026-02-17 | 13F | Caption Management, LLC | Call | 872.000 | 3.253,85 | 20.841 | 3.450,26 | |||
| 2026-03-06 | 13F | Hsbc Holdings Plc | 52.198 | -79,60 | 1.249 | -78,02 | ||||
| 2026-02-17 | 13F | Caption Management, LLC | 205.820 | -12,27 | 4.919 | -7,26 | ||||
| 2026-02-17 | 13F | Caption Management, LLC | Put | 100.000 | 400,00 | 2.390 | 428,76 | |||
| 2026-02-13 | 13F | Manufacturers Life Insurance Company, The | 1.067.548 | -2,87 | 25.514 | 2,67 | ||||
| 2026-02-13 | 13F | Kennedy Capital Management, Inc. | 11.194 | 0,00 | 268 | 5,53 | ||||
| 2026-02-17 | 13F | Two Sigma Investments, Lp | Put | 20.100 | 480 | |||||
| 2025-11-12 | 13F | Siena Capital Partners GP, LLC | 0 | -100,00 | 0 | -100,00 | ||||
| 2026-01-26 | 13F | Merit Financial Group, LLC | 26.637 | 10,75 | 637 | 17,13 | ||||
| 2026-02-17 | 13F | Two Sigma Investments, Lp | Call | 19.400 | 464 | |||||
| 2026-02-13 | 13F/A | Alberta Investment Management Corp | 0 | -100,00 | 0 | |||||
| 2026-02-17 | 13F | Two Sigma Investments, Lp | 258.624 | 1.277,93 | 6.181 | 1.357,78 | ||||
| 2026-01-21 | 13F | Woodmont Investment Counsel Llc | 9.586 | -9,93 | 229 | -4,58 | ||||
| 2026-02-13 | 13F | Change Path, LLC | 15.621 | 14,41 | 373 | 21,10 | ||||
| 2026-02-09 | 13F | 12th Street Asset Management Company, LLC | 739.938 | 17.685 | ||||||
| 2026-02-12 | 13F | Quadrant Capital Group Llc | 28.060 | 15,48 | 671 | 22,04 | ||||
| 2026-01-22 | 13F | HHM Wealth Advisors, LLC | 21.239 | -7,01 | 508 | -1,74 | ||||
| 2026-02-17 | 13F | Pinnacle Financial Partners, Inc. | 38.598 | 922 | ||||||
| 2026-02-17 | 13F | Shelton Capital Management | 16.940 | -5,84 | 405 | -0,49 | ||||
| 2026-01-26 | 13F | KBC Group NV | 14.261 | 0,00 | 0 | |||||
| 2026-02-11 | 13F | Invst, LLC | 34.180 | -4,48 | 817 | 0,87 | ||||
| 2025-11-12 | 13F | Operose Advisors LLC | 0 | -100,00 | 0 | |||||
| 2026-02-02 | 13F | CX Institutional | 9.243 | 0,00 | 0 | |||||
| 2026-02-13 | 13F | FORA Capital, LLC | 107.913 | 184,23 | 2.579 | 200,58 | ||||
| 2026-02-13 | 13F | Landscape Capital Management, L.l.c. | 0 | -100,00 | 0 | -100,00 | ||||
| 2026-02-06 | 13F | Twin Capital Management Inc | 44.255 | 0,05 | 1.058 | 5,70 | ||||
| 2026-02-12 | 13F | FineMark National Bank & Trust | 15.927 | 0,00 | 381 | 5,56 | ||||
| 2026-02-18 | 13F | First Citizens Bank & Trust Co | 13.461 | -10,93 | 322 | -5,87 | ||||
| 2026-02-02 | 13F | CENTRAL TRUST Co | 726 | 25,17 | 17 | 30,77 | ||||
| 2026-01-22 | 13F | Apollon Wealth Management, LLC | 81.451 | -16,79 | 1.947 | -12,07 | ||||
| 2026-02-03 | 13F | Crossmark Global Holdings, Inc. | 36.046 | -12,11 | 861 | -7,12 | ||||
| 2026-02-12 | 13F | Brinker Capital Investments, LLC | 61.035 | 2,95 | 1.459 | 8,81 | ||||
| 2026-02-17 | 13F | Jones Financial Companies Lllp | 9.801 | 7,66 | 234 | 13,04 | ||||
| 2026-02-11 | 13F | Nemes Rush Group LLC | 468 | 0,65 | 11 | 10,00 | ||||
| 2026-01-29 | 13F | State Of Michigan Retirement System | 116.356 | -3,72 | 2.781 | 1,76 | ||||
| 2026-02-10 | 13F | Root Financial Partners, LLC | 1.563 | 15,44 | 37 | 23,33 | ||||
| 2026-02-12 | 13F | Callan Family Office, LLC | 59.680 | 51,70 | 1.426 | 60,40 | ||||
| 2026-01-27 | 13F | Krilogy Financial LLC | 17.499 | 3,94 | 424 | 17,13 | ||||
| 2026-01-30 | 13F | United Community Bank | 2.017 | 0,00 | 48 | 6,67 | ||||
| 2026-01-30 | 13F/A | M&t Bank Corp | 29.281 | 64,29 | 699 | 73,45 | ||||
| 2025-11-14 | 13F | Point72 Hong Kong Ltd | 0 | -100,00 | 0 | -100,00 | ||||
| 2026-01-28 | 13F | Universal- Beteiligungs- und Servicegesellschaft mbH | 565.870 | 25,79 | 13.525 | 32,97 | ||||
| 2025-10-30 | 13F | Twin Peaks Wealth Advisors, LLC | 0 | -100,00 | 0 | -100,00 | ||||
| 2026-01-28 | 13F | Peregrine Capital Management Llc | 940 | 0,00 | 22 | 4,76 | ||||
| 2026-02-04 | 13F | LRI Investments, LLC | 3.900 | 0,00 | 93 | 5,68 | ||||
| 2026-02-13 | 13F | Peak6 Llc | Put | 412.000 | 9.847 | |||||
| 2026-02-10 | 13F | Meramec Financial Planners, LLC | 46 | 1 | ||||||
| 2025-11-14 | 13F | Point72 Asia (Singapore) Pte. Ltd. | 44.152 | -28,21 | 998 | -23,41 | ||||
| 2026-02-23 | 13F | Wealth Preservation Advisors, LLC | 50.633 | 0,00 | 1.210 | 5,77 | ||||
| 2026-02-17 | 13F | Cetera Investment Advisers | 82.758 | 35,84 | 1.978 | 43,57 | ||||
| 2025-11-14 | 13F | Wolverine Trading, Llc | 29.828 | 676 | ||||||
| 2026-01-09 | 13F | Clear Trail Advisors, LLC | 21.232 | 507 | ||||||
| 2025-11-14 | 13F | Wolverine Trading, Llc | Call | 73.900 | 58,58 | 1.675 | 70,82 | |||
| 2026-01-30 | 13F | Keybank National Association/oh | 47.639 | -6,40 | 1.139 | -1,04 | ||||
| 2025-11-14 | 13F | Wolverine Trading, Llc | Put | 44.600 | 223,19 | 1.011 | 248,28 | |||
| 2025-11-13 | 13F | Scharf Investments, Llc | 0 | -100,00 | 0 | |||||
| 2026-02-10 | 13F | Envestnet Asset Management Inc | 216.879 | 66,41 | 5.183 | 75,93 | ||||
| 2025-11-04 | 13F | Raleigh Capital Management Inc. | 0 | -100,00 | 0 | |||||
| 2026-02-02 | 13F | Equitable Trust Co | 21.983 | 0,00 | 525 | 5,63 | ||||
| 2026-02-11 | 13F | Parallel Advisors, LLC | 2.890 | 2,16 | 69 | 9,52 | ||||
| 2026-02-09 | 13F | Hantz Financial Services, Inc. | 11.369 | 148,61 | 0 | |||||
| 2026-01-30 | 13F | BancorpSouth Bank | 19.600 | 468 | ||||||
| 2026-02-11 | 13F | Vise Technologies, Inc. | 117.328 | 506,28 | 2.804 | 541,65 | ||||
| 2026-02-19 | 13F | Invesco Ltd. | 8.033.759 | 5,61 | 192.007 | 11,64 | ||||
| 2026-01-21 | 13F | DMG Group, LLC | 9.005 | -37,23 | 215 | -33,64 | ||||
| 2026-02-12 | 13F | Greenfield Seitz Capital Management, LLC | 57.941 | 2,41 | 1.385 | 8,21 | ||||
| 2026-02-17 | 13F | Bank Of America Corp /de/ | 2.651.924 | 3,19 | 63.381 | 9,08 | ||||
| 2026-02-17 | 13F | Longaeva Partners L.P. | 163.336 | 3.904 | ||||||
| 2026-02-09 | 13F | Allen Capital Group, LLC | 59.750 | -1,79 | 1.428 | 3,85 | ||||
| 2026-02-17 | 13F | Twinbeech Capital Lp | 12.949 | 309 | ||||||
| 2026-02-05 | 13F | Tucker Asset Management Llc | 452 | 11 | ||||||
| 2025-11-06 | 13F | Abich Financial Wealth Management LLC | 0 | -100,00 | 0 | |||||
| 2026-02-05 | 13F | JCSD Capital, LLC | 0 | -100,00 | 0 | |||||
| 2026-02-13 | 13F | Great West Life Assurance Co /can/ | 285.819 | -25,96 | 7 | -25,00 | ||||
| 2026-02-13 | 13F | Johnson Investment Counsel Inc | 2.424.295 | -22,28 | 57.941 | -17,85 | ||||
| 2026-02-13 | 13F | Rafferty Asset Management, LLC | 355.284 | -25,74 | 8.491 | -21,50 | ||||
| 2026-02-05 | 13F | Amalgamated Bank | 226.214 | -2,31 | 5 | 0,00 | ||||
| 2026-01-30 | 13F | Mitsubishi UFJ Trust & Banking Corp | 129.752 | 108,73 | 3.101 | 120,71 | ||||
| 2026-01-15 | 13F | Retirement Systems of Alabama | 1.390.837 | -3,85 | 33.241 | 1,64 | ||||
| 2026-01-16 | 13F | First Community Trust Na | 385 | 0,00 | 9 | 12,50 | ||||
| 2026-02-13 | 13F | Basswood Capital Management, L.l.c. | 179.018 | 4.279 | ||||||
| 2026-02-13 | 13F | Acumen Wealth Advisors, LLC | 11.260 | 271 | ||||||
| 2026-02-13 | 13F | Venture Visionary Partners LLC | 206.198 | 2,29 | 4.928 | 8,14 | ||||
| 2026-02-05 | 13F | Isthmus Partners, Llc | 23.503 | -1,62 | 562 | |||||
| 2026-02-12 | 13F | BRYN MAWR TRUST Co | 7.950 | 0,00 | 190 | 6,15 | ||||
| 2026-01-27 | 13F | Lecap Asset Management Ltd | 20.494 | -64,91 | 490 | -62,95 | ||||
| 2026-01-27 | 13F | Evergreen Capital Management Llc | 15.561 | -10,70 | 374 | -5,56 | ||||
| 2026-02-10 | 13F | CIBC World Markets Inc. | 20.756 | 42,89 | 496 | 51,22 | ||||
| 2026-02-10 | 13F | CIBC Asset Management Inc | 17.602 | 0,00 | 421 | 5,79 | ||||
| 2026-02-13 | 13F | JustInvest LLC | 93.009 | 2,87 | 2.223 | 8,66 | ||||
| 2025-11-13 | 13F | FreeGulliver LLC | 0 | -100,00 | 0 | |||||
| 2026-02-17 | 13F | Royal Bank Of Canada | 1.073.306 | -58,04 | 25.652 | -55,65 | ||||
| 2026-02-12 | 13F | South Dakota Investment Council | 66.828 | -54,93 | 2 | -66,67 | ||||
| 2026-01-06 | 13F | Investors Research Corp | 32.555 | -45,81 | 778 | -42,71 | ||||
| 2026-02-10 | 13F | Rothschild Investment Llc | 290 | 205,26 | 7 | 200,00 | ||||
| 2026-02-17 | 13F | Engineers Gate Manager LP | 865.616 | 266,63 | 20.688 | 287,56 | ||||
| 2026-02-18 | 13F | EP Wealth Advisors, Inc. | 11.592 | -27,62 | 277 | -18,29 | ||||
| 2025-10-24 | 13F | Bay Colony Advisory Group, Inc d/b/a Bay Colony Advisors | 0 | -100,00 | 0 | |||||
| 2026-02-05 | 13F | Cambridge Investment Research Advisors, Inc. | 76.389 | 2,96 | 2 | 0,00 | ||||
| 2026-02-12 | 13F | State Board Of Administration Of Florida Retirement System | 386.578 | -3,94 | 9.239 | 1,55 | ||||
| 2026-02-17 | 13F | D. E. Shaw & Co., Inc. | 197.443 | 28,15 | 4.719 | 35,46 | ||||
| 2026-02-17 | 13F | D. E. Shaw & Co., Inc. | Call | 250.000 | -16,67 | 5.975 | -11,91 | |||
| 2026-02-17 | 13F | Brevan Howard Capital Management LP | 206.637 | -19,00 | 4.939 | -14,39 | ||||
| 2026-02-10 | 13F | IFG Advisory, LLC | 8.839 | 211 | ||||||
| 2026-02-12 | 13F | Hm Payson & Co | 142 | 0,00 | 3 | 0,00 | ||||
| 2026-02-17 | 13F | SageView Advisory Group, LLC | 5.206 | 124 | ||||||
| 2026-02-17 | 13F | Polymer Capital Management (US) LLC | 45.703 | 175,83 | 1.092 | 191,98 | ||||
| 2026-02-17 | 13F | Captrust Financial Advisors | 105.567 | 0,56 | 2.523 | 6,32 | ||||
| 2026-01-07 | 13F | Massmutual Trust Co Fsb/adv | 2.595 | -0,69 | 62 | 5,08 | ||||
| 2026-02-02 | 13F | Artemis Investment Management LLP | 3.779.026 | 90.319 | ||||||
| 2026-02-17 | 13F | Zacks Investment Management | 190.634 | 0,96 | 4.556 | 6,72 | ||||
| 2026-01-30 | 13F | State of New Jersey Common Pension Fund D | 131.777 | -7,17 | 3.149 | -1,87 | ||||
| 2026-01-29 | 13F | First Interstate Bank | 35.500 | 0,00 | 848 | 5,74 | ||||
| 2026-01-30 | 13F | Harbor Advisors LLC | 21.732 | 0,00 | 519 | 5,70 | ||||
| 2026-02-06 | 13F | Van Hulzen Asset Management, LLC | 29.760 | -4,03 | 711 | 1,43 | ||||
| 2026-02-11 | 13F | Private Management Group Inc | 514.704 | -25,08 | 12.301 | -20,80 | ||||
| 2026-02-12 | 13F | Counterpoint Mutual Funds LLC | 12.150 | -22,76 | 290 | -18,31 | ||||
| 2026-02-09 | 13F | Quest Partners LLC | 126.749 | -7,08 | 3.029 | -1,78 | ||||
| 2026-01-29 | 13F | UBS Group AG | Put | 3.900 | 0,00 | 93 | 5,68 | |||
| 2026-01-29 | 13F | UBS Group AG | 3.290.924 | -39,33 | 78.653 | -35,87 | ||||
| 2026-01-08 | 13F | Wedmont Private Capital | 47.843 | -1,06 | 1.176 | 5,85 | ||||
| 2026-02-03 | 13F | SBI Securities Co., Ltd. | 233 | -3,72 | 6 | 0,00 | ||||
| 2026-01-28 | 13F | HB Wealth Management, LLC | 39.887 | 2,98 | 953 | 8,91 | ||||
| 2026-02-12 | 13F | Ci Investments Inc. | 0 | -100,00 | 0 | |||||
| 2026-02-02 | 13F | Highland Capital Management, Llc | 375.291 | 1,84 | 8.969 | 7,65 | ||||
| 2026-01-30 | 13F | R Squared Ltd | 0 | -100,00 | 0 | |||||
| 2026-02-12 | 13F | Bank Of Montreal /can/ | 1.124.877 | -10,35 | 26.885 | -5,23 | ||||
| 2026-02-10 | 13F/A | Northwestern Mutual Wealth Management Co | 40.296 | 1,27 | 963 | 7,12 | ||||
| 2026-02-11 | 13F | Franklin Resources Inc | 314.638 | 6,26 | 7.520 | 12,32 | ||||
| 2026-02-17 | 13F | Creative Planning | 133.828 | 9,34 | 3.198 | 15,58 | ||||
| 2026-02-11 | 13F | Harvest Fund Management Co., Ltd | 2.379 | 0,00 | 0 | |||||
| 2026-02-11 | 13F | Allianz Asset Management GmbH | 312.662 | 10,18 | 7.473 | 16,48 | ||||
| 2026-02-13 | 13F | Schroder Investment Management Group | 104.667 | -77,84 | 2.504 | -76,61 | ||||
| 2025-11-13 | 13F | Perbak Capital Partners LLP | 0 | -100,00 | 0 | |||||
| 2026-02-06 | 13F | Vestmark Advisory Solutions, Inc. | 48.384 | -0,17 | 1.156 | 5,57 | ||||
| 2026-01-20 | 13F | Global Trust Asset Management, LLC | 152 | 4 | ||||||
| 2026-01-27 | 13F | Zurcher Kantonalbank (Zurich Cantonalbank) | 102.617 | -36,08 | 2.453 | -32,43 | ||||
| 2026-02-13 | 13F | Golden State Wealth Management, LLC | 2.195 | 0,00 | 52 | 6,12 | ||||
| 2026-02-09 | 13F | Huntington National Bank | 1 | 0,00 | 0 | |||||
| 2026-02-17 | 13F | NorthRock Partners, LLC | 0 | -100,00 | 0 | |||||
| 2026-02-11 | 13F | Buckingham Strategic Partners | 130.025 | 3,81 | 3.108 | 9,71 | ||||
| 2026-02-17 | 13F | Advisory Services Network, LLC | 13.759 | -11,31 | 329 | -6,29 | ||||
| 2026-01-15 | 13F | Fifth Third Wealth Advisors LLC | 19.929 | -2,39 | 476 | 3,25 | ||||
| 2026-02-13 | 13F | BNP Paribas Asset Management Holding S.A. | 7.157 | 41,50 | 0 | |||||
| 2026-02-05 | 13F | Elyxium Wealth, LLC | 748 | 18 | ||||||
| 2026-02-02 | 13F | Fifth Third Bancorp | 12.747 | 80,12 | 305 | 90,00 | ||||
| 2026-02-17 | 13F | BTG Pactual Asset Management US LLC | 8.544 | 204 | ||||||
| 2026-02-17 | 13F | Russell Investments Group, Ltd. | 278.016 | -8,45 | 6.645 | -3,23 | ||||
| 2026-01-12 | 13F | Kozak & Associates, Inc. | 146 | 0,69 | 4 | 50,00 | ||||
| 2026-02-13 | 13F | Aigen Investment Management, Lp | 40.861 | -9,00 | 977 | -3,84 | ||||
| 2026-02-13 | 13F | Pinnacle Wealth Planning Services, Inc. | 10.287 | 0,16 | 246 | 5,60 | ||||
| 2026-01-30 | 13F | AMG National Trust Bank | 98.204 | -4,05 | 2.347 | 1,43 | ||||
| 2026-02-12 | 13F | Mount Yale Investment Advisors, LLC | 48.384 | -0,17 | 1.164 | 5,44 | ||||
| 2026-02-13 | 13F | Wilkerson Advisory Group LLC | 3.590 | 86 | ||||||
| 2026-02-13 | 13F | Kempen Capital Management N.v. | 994.735 | -45,16 | 23.774 | -42,03 | ||||
| 2026-02-13 | 13F | Ausdal Financial Partners, Inc. | 27.456 | -0,75 | 656 | 4,96 | ||||
| 2026-02-11 | 13F | Fox Run Management, L.l.c. | 17.481 | -77,88 | 418 | -76,66 | ||||
| 2026-02-02 | 13F | Danske Bank A/s | 5.500 | 0,00 | 131 | 5,65 | ||||
| 2025-11-14 | 13F | Resources Management Corp /ct/ /adv | 0 | -100,00 | 0 | |||||
| 2026-02-17 | 13F | United Capital Financial Advisers, Llc | 23.192 | 1,55 | 554 | 7,36 | ||||
| 2026-02-17 | 13F | Cinctive Capital Management LP | 477.149 | 18,42 | 11.404 | 25,17 | ||||
| 2026-02-13 | 13F | Bridgewater Associates, LP | 928.572 | 22.193 | ||||||
| 2026-02-12 | 13F | First Financial Bankshares Inc | 39.789 | -7,25 | 951 | -1,96 | ||||
| 2026-02-11 | 13F | Manchester Capital Management LLC | 1.312 | 31 | ||||||
| 2026-02-12 | 13F | Waters Parkerson & Co., Llc | 160.656 | -0,41 | 3.840 | 5,26 | ||||
| 2026-01-23 | 13F | Webster Bank, N. A. | 315 | 0,00 | 8 | 0,00 | ||||
| 2026-02-13 | 13F | Mml Investors Services, Llc | 23.282 | 4,06 | 556 | 10,10 | ||||
| 2026-02-17 | 13F | Evolve Private Wealth, Llc | 14.426 | 347 | ||||||
| 2026-02-02 | 13F | Oppenheimer Asset Management Inc. | 423.719 | 10.127 | ||||||
| 2026-02-17 | 13F | CWM Advisors, LLC | 6.735 | 161 | ||||||
| 2026-02-13 | 13F | Cullen Capital Management, LLC | 2.030.457 | 3.401,03 | 48.528 | 3.601,53 | ||||
| 2026-02-18 | 13F | Vident Advisory, LLC | 28.121 | -1,77 | 672 | 3,86 | ||||
| 2026-02-06 | 13F | Pnc Financial Services Group, Inc. | 49.270 | 1,66 | 1.178 | 7,49 | ||||
| 2026-02-11 | 13F | Group One Trading, L.p. | Put | 126.700 | 39,23 | 3.028 | 47,20 | |||
| 2026-01-12 | 13F | Rialto Wealth Management, LLC | 76 | 15,15 | 2 | 0,00 | ||||
| 2026-01-16 | 13F | Sentry LLC | 27.089 | 0,00 | 647 | 5,72 | ||||
| 2026-02-11 | 13F | Group One Trading, L.p. | Call | 1.777.300 | 1.863,87 | 42.477 | 1.976,10 | |||
| 2026-02-13 | 13F | Transamerica Financial Advisors, Inc. | 307 | 7 | ||||||
| 2026-02-11 | 13F | Group One Trading, L.p. | 94.923 | -68,57 | 2.269 | -66,78 | ||||
| 2026-02-10 | 13F | Bruce G. Allen Investments, LLC | 74 | 0,00 | 2 | 0,00 | ||||
| 2026-01-29 | 13F | Comerica Bank | 208.760 | -6,98 | 4.989 | -1,68 | ||||
| 2026-02-17 | 13F | Capital Fund Management S.a. | 497.836 | 11.898 | ||||||
| 2026-02-17 | 13F | Aster Capital Management (DIFC) Ltd | 0 | -100,00 | 0 | |||||
| 2026-02-02 | 13F | Truist Financial Corp | 41.904 | 5,65 | 1.002 | 11,72 | ||||
| 2026-02-03 | 13F | Navigoe, LLC | 1.128 | 0,00 | 0 | |||||
| 2026-02-03 | 13F | Hemenway Trust Co LLC | 187.721 | 0,00 | 0 | |||||
| 2026-01-21 | 13F | SJS Investment Consulting Inc. | 47 | 0,00 | 1 | 0,00 | ||||
| 2026-01-13 | 13F | CoreCap Advisors, LLC | 489 | 2.228,57 | 12 | |||||
| 2026-01-28 | 13F | CAPROCK Group, Inc. | 8.531 | 205 | ||||||
| 2026-02-06 | 13F | Covestor Ltd | 1.091 | 4,70 | 0 | |||||
| 2026-02-11 | 13F | Havemeyer Place LP | 61.785 | 1.477 | ||||||
| 2026-02-17 | 13F | Jump Financial, LLC | 173.645 | 4.150 | ||||||
| 2026-02-17 | 13F | Prana Capital Management, LP | 0 | -100,00 | 0 | |||||
| 2026-02-13 | 13F | Macquarie Group Ltd | 0 | -100,00 | 0 | |||||
| 2026-01-12 | 13F | Salem Investment Counselors Inc | 8.635 | -5,47 | 208 | 0,00 | ||||
| 2026-01-20 | 13F | Cromwell Holdings LLC | 63 | 0,00 | 2 | 0,00 | ||||
| 2026-02-13 | 13F | Police & Firemen's Retirement System of New Jersey | 191.227 | -3,12 | 4.570 | 2,40 | ||||
| 2026-01-30 | 13F | Torren Management, LLC | 7.394 | 177 | ||||||
| 2026-02-11 | 13F | SOUTH STATE Corp | 100 | -28,57 | 2 | -33,33 | ||||
| 2026-02-06 | 13F | Diamond Hill Capital Management Inc | 490.196 | -0,61 | 11.716 | 5,06 | ||||
| 2026-02-17 | 13F | Freestone Grove Partners LP | 4.727.267 | -1,28 | 112.982 | 4,36 | ||||
| 2026-01-28 | 13F | B. Metzler seel. Sohn & Co. AG | 40.189 | 0,00 | 961 | 5,73 | ||||
| 2026-02-06 | 13F | Cullen/frost Bankers, Inc. | 3.234 | 4,09 | 77 | 10,00 | ||||
| 2026-02-17 | 13F | Bridgeway Capital Management Inc | 66.600 | -0,60 | 1.592 | 5,09 | ||||
| 2026-01-27 | 13F | Belpointe Asset Management LLC | 16.661 | 4,06 | 398 | 9,94 | ||||
| 2026-02-18 | 13F | Mendon Capital Advisors Corp | 465.000 | 1,58 | 11.114 | 7,37 | ||||
| 2026-02-06 | 13F | Curat Global, LLC | 1.194 | 0,00 | 29 | 7,69 | ||||
| 2026-01-16 | 13F | Marquette Asset Management, LLC | 71 | 2 | ||||||
| 2025-11-13 | 13F | SCS Capital Management LLC | 0 | -100,00 | 0 | |||||
| 2026-02-09 | 13F | Summit Asset Management, LLC | 17.328 | -6,15 | 414 | -0,72 | ||||
| 2026-02-11 | 13F | Meeder Advisory Services, Inc. | 16.160 | 386 | ||||||
| 2026-01-15 | 13F | Nisa Investment Advisors, Llc | 66.688 | 0,00 | 1.604 | 5,67 | ||||
| 2026-02-11 | 13F | NFC Investments, LLC | 9.498 | 0 | ||||||
| 2026-02-04 | 13F | Atlantic Union Bankshares Corp | 1.119 | 0,00 | 27 | 4,00 | ||||
| 2026-02-11 | 13F | Hughes Financial Services, LLC | 30 | 0,00 | 1 | |||||
| 2026-01-27 | 13F | First Horizon Corp | 101.964 | -2,34 | 2.437 | 3,22 | ||||
| 2026-02-09 | 13F | Keating Financial Advisory Services, Inc. | 751 | 18 | ||||||
| 2026-02-09 | 13F | Harbour Investments, Inc. | 148 | 8,82 | 4 | 0,00 | ||||
| 2026-01-14 | 13F | Pallas Capital Advisors LLC | 29.397 | -0,45 | 703 | 5,25 | ||||
| 2026-01-29 | 13F | Teachers Retirement System Of The State Of Kentucky | 1.057.666 | 0,00 | 25 | 8,70 | ||||
| 2026-02-05 | 13F | High Note Wealth, LLC | 236 | 0,00 | 6 | 0,00 | ||||
| 2026-02-17 | 13F | EJF Capital LLC | 148.886 | -19,87 | 3.558 | -15,29 | ||||
| 2026-02-13 | 13F | Fiduciary Trust Co | 16.523 | 22,18 | 395 | 29,18 | ||||
| 2026-02-17 | 13F | Trexquant Investment LP | 301.016 | -36,66 | 7.194 | -33,05 | ||||
| 2026-01-16 | 13F | DiNuzzo Private Wealth, Inc. | 66 | 0,00 | 2 | 0,00 | ||||
| 2026-02-13 | 13F | Arrowstreet Capital, Limited Partnership | 110.418 | 2.639 | ||||||
| 2026-02-12 | 13F | Hollencrest Capital Management | 107 | 0,94 | 3 | 0,00 | ||||
| 2026-02-02 | 13F | Oppenheimer & Co Inc | 39.511 | 0,22 | 944 | 5,95 | ||||
| 2025-11-12 | 13F | Cresset Asset Management, LLC | 93.773 | 0,01 | 2.134 | 6,65 | ||||
| 2026-02-17 | 13F | Nomura Holdings Inc | 0 | -100,00 | 0 | |||||
| 2026-02-13 | 13F | Aptus Capital Advisors, LLC | 14.562 | 28,90 | 348 | 36,47 | ||||
| 2026-02-03 | 13F | Everence Capital Management Inc | 14.190 | 0,00 | 0 | |||||
| 2026-01-29 | 13F | DecisionPoint Financial, LLC | 21 | 0,00 | 1 | |||||
| 2026-02-17 | 13F | Adage Capital Partners Gp, L.l.c. | 449.893 | 109,36 | 10.752 | 121,33 | ||||
| 2025-11-07 | 13F | Levin Capital Strategies, L.p. | 0 | -100,00 | 0 | |||||
| 2026-01-21 | 13F | Oak Thistle LLC | 0 | -100,00 | 0 | |||||
| 2026-02-17 | 13F | Tudor Investment Corp Et Al | Put | 113.600 | 121,44 | 2.715 | 134,25 | |||
| 2026-02-17 | 13F | Tudor Investment Corp Et Al | Call | 195.300 | 4.668 | |||||
| 2026-02-10 | 13F | Moors & Cabot, Inc. | 40.350 | 10,85 | 964 | 17,13 | ||||
| 2026-01-23 | 13F | Avion Wealth | 2.493 | 0,00 | 0 | |||||
| 2025-11-07 | 13F | Ontario Teachers Pension Plan Board | 0 | -100,00 | 0 | -100,00 | ||||
| 2026-02-17 | 13F | Tudor Investment Corp Et Al | 124.498 | 269,25 | 2.976 | 290,42 | ||||
| 2026-01-20 | 13F | AdvisorNet Financial, Inc | 35 | 0,00 | 1 | |||||
| 2026-02-12 | 13F | Renaissance Technologies Llc | 209.411 | -75,20 | 5.005 | -73,79 | ||||
| 2026-02-12 | 13F | Steward Partners Investment Advisory, Llc | 13.478 | 1,97 | 322 | 8,05 | ||||
| 2026-02-13 | 13F | Bridgefront Capital, LLC | 0 | -100,00 | 0 | |||||
| 2026-01-30 | 13F | Simplicity Wealth,LLC | 0 | -100,00 | 0 | |||||
| 2026-01-29 | 13F | Cherokee Insurance Co | 170.000 | 0,00 | 4.063 | 5,72 | ||||
| 2026-02-13 | 13F | Squarepoint Ops LLC | 245.588 | 5.870 | ||||||
| 2026-01-07 | 13F | TruWealth Advisors, LLC | 11.726 | -10,91 | 280 | -5,72 | ||||
| 2026-01-16 | 13F | Perigon Wealth Management, LLC | 13.373 | 0,29 | 320 | 5,98 | ||||
| 2026-01-29 | 13F | UMA Financial Services, Inc. | 89 | -35,51 | 2 | -33,33 | ||||
| 2026-01-08 | 13F | Versant Capital Management, Inc | 3.543 | 0,62 | 85 | 6,33 | ||||
| 2026-02-02 | 13F | Horizon Investments, LLC | 4.635 | 6.163,51 | 111 | 10.900,00 | ||||
| 2026-01-30 | 13F | Us Bancorp \de\ | 21.264 | -72,68 | 508 | -71,14 | ||||
| 2026-02-13 | 13F | Verition Fund Management LLC | 2.411.629 | 53,82 | 57.638 | 62,60 | ||||
| 2026-02-13 | 13F | State Street Corp | 19.000.964 | -3,76 | 457.056 | 1,70 | ||||
| 2026-02-09 | 13F | Wellington Shields Capital Management, LLC | 28.050 | 0,04 | 670 | 5,85 | ||||
| 2026-02-06 | 13F | Motco | 56 | 0,00 | 1 | 0,00 | ||||
| 2026-02-12 | 13F | Brown Brothers Harriman & Co | 4.401 | -5,42 | 105 | 0,00 | ||||
| 2026-02-10 | 13F | Argent Trust Co | 46.585 | 27,23 | 1.113 | 34,58 | ||||
| 2026-02-13 | 13F | Toroso Investments, LLC | 42.848 | 5,45 | 1.024 | 11,55 | ||||
| 2026-01-29 | 13F | Concurrent Investment Advisors, LLC | 40.294 | 68,41 | 963 | 78,33 | ||||
| 2026-01-21 | 13F | Sound Income Strategies, LLC | 473 | 23,82 | 11 | 37,50 | ||||
| 2026-02-10 | 13F | Savant Capital, LLC | 49.777 | 7,01 | 1.190 | 13,13 | ||||
| 2026-02-17 | 13F | Occudo Quantitative Strategies Lp | 0 | -100,00 | 0 | -100,00 | ||||
| 2026-02-05 | 13F | Northwestern Mutual Investment Management Company, Llc | 110.167 | -2,66 | 2.633 | 2,89 | ||||
| 2026-02-09 | 13F | Investors Portfolio Services LLC | 46 | 1 | ||||||
| 2026-02-17 | 13F | Boothbay Fund Management, Llc | 0 | -100,00 | 0 | |||||
| 2026-02-18 | 13F/A | Empowered Funds, LLC | 0 | -100,00 | 0 | -100,00 | ||||
| 2026-02-17 | 13F | Advisor Group Holdings, Inc. | 41.207 | -18,02 | 985 | -13,38 | ||||
| 2026-01-29 | 13F | Pictet Asset Management Holding SA | 76.739 | 6,25 | 1.834 | 12,38 | ||||
| 2026-02-10 | 13F | Gifford Fong Associates | 180.082 | 0,00 | 4 | 0,00 | ||||
| 2026-02-13 | 13F | Neuberger Berman Group LLC | 184.780 | 48,35 | 4.416 | 56,82 | ||||
| 2026-01-27 | 13F | Forum Financial Management, LP | 15.493 | 0,04 | 370 | 5,71 | ||||
| 2026-01-07 | 13F | Sagespring Wealth Partners, Llc | 12.170 | 291 | ||||||
| 2026-02-17 | 13F | Quantinno Capital Management LP | 204.642 | 35,72 | 4.891 | 43,44 | ||||
| 2026-02-13 | 13F | Hudson Bay Capital Management LP | 1.029.675 | 68,80 | 24.609 | 78,44 | ||||
| 2026-02-06 | 13F | Meiji Yasuda Asset Management Co Ltd. | 11.299 | -4,23 | 270 | 1,50 | ||||
| 2026-02-12 | 13F | Federation des caisses Desjardins du Quebec | 39.573 | 17,08 | 946 | 23,69 | ||||
| 2025-11-12 | 13F | Headlands Technologies LLC | 0 | -100,00 | 0 | |||||
| 2026-01-30 | 13F | American Capital Advisory, LLC | 4 | 0 | ||||||
| 2026-02-06 | 13F | Tortoise Investment Management, LLC | 0 | -100,00 | 0 | |||||
| 2026-02-11 | 13F | O'shaughnessy Asset Management, Llc | 148.476 | -1,71 | 3.549 | 3,89 | ||||
| 2026-02-17 | 13F | XTX Topco Ltd | 72.708 | -45,27 | 1.738 | -42,16 | ||||
| 2026-02-26 | 13F | TD Capital Management LLC | 1.152 | 0,26 | 28 | 8,00 | ||||
| 2026-02-17 | 13F | Schonfeld Strategic Advisors LLC | 548.111 | -12,83 | 13.100 | -7,86 | ||||
| 2026-02-10 | 13F | PL Capital Advisors, LLC | 100.000 | 2.390 | ||||||
| 2026-02-11 | 13F | Rise Advisors, LLC | 0 | -100,00 | 0 | |||||
| 2025-11-12 | 13F | Catalyst Funds Management Pty Ltd | 0 | -100,00 | 0 | |||||
| 2026-02-09 | 13F | Cary Street Partner Investment Advisory Llc | 2.013 | 1.348,20 | 48 | 1.500,00 | ||||
| 2026-02-17 | 13F | Boreal Capital Management LLC | 9.414 | 226 | ||||||
| 2026-01-28 | 13F | Chicago Partners Investment Group LLC | 9.617 | 230 | ||||||
| 2026-02-13 | 13F | Sculptor Capital LP | 3.145.000 | -17,69 | 75.166 | -13,00 | ||||
| 2025-10-14 | 13F | Bridge Creek Capital Management LLC | 162.032 | -4,50 | 3.664 | 1,83 | ||||
| 2026-02-12 | 13F | CIBC Private Wealth Group, LLC | 3.706 | -31,65 | 89 | -27,87 | ||||
| 2026-01-29 | 13F | IMC-Chicago, LLC | Put | 94.300 | -11,29 | 2.254 | -6,24 | |||
| 2026-02-17 | 13F | Public Employees Retirement System Of Ohio | 163.095 | -3,38 | 3.898 | 2,12 | ||||
| 2026-01-29 | 13F | IMC-Chicago, LLC | Call | 1.547.600 | 714,10 | 36.988 | 760,56 | |||
| 2026-02-04 | 13F | Pacer Advisors, Inc. | 0 | -100,00 | 0 | -100,00 | ||||
| 2026-02-12 | 13F | Campbell & CO Investment Adviser LLC | 134.946 | 151,92 | 3.225 | 166,31 | ||||
| 2026-02-12 | 13F | Commonwealth Equity Services, Llc | 50.457 | 5,64 | 1.206 | 120.400,00 | ||||
| 2026-02-12 | 13F | Rossby Financial, LCC | 378 | 112,36 | 9 | 200,00 | ||||
| 2026-01-05 | 13F | GAMMA Investing LLC | 17.587 | 8,77 | 420 | 15,07 | ||||
| 2026-02-10 | 13F | Axq Capital, Lp | 0 | -100,00 | 0 | -100,00 | ||||
| 2026-02-17 | 13F | Balyasny Asset Management Llc | 1.702.716 | -76,90 | 40.695 | -75,58 | ||||
| 2026-02-13 | 13F | Treasurer of the State of North Carolina | 210.636 | -6,81 | 5 | 0,00 | ||||
| 2025-11-13 | 13F | Riggs Asset Managment Co. Inc. | 0 | -100,00 | 0 | |||||
| 2026-02-17 | 13F | Utah Retirement Systems | 82.965 | 0,00 | 1.983 | 5,71 | ||||
| 2026-03-12 | 13F | Nalls Sherbakoff Group, Llc | 15.024 | 5,07 | 359 | 77,72 | ||||
| 2026-02-19 | 13F | Atomi Financial Group, Inc. | 18.824 | 1,83 | 450 | 7,67 | ||||
| 2026-02-17 | 13F | Laird Norton Trust Company, Llc | 13.283 | 319 | ||||||
| 2026-02-13 | 13F | Victory Capital Management Inc | 1.837.136 | -43,18 | 43.908 | -39,93 | ||||
| 2026-02-17 | 13F | Balyasny Asset Management Llc | Call | 400.000 | 9.560 | |||||
| 2026-02-17 | 13F | MIRAE ASSET GLOBAL ETFS HOLDINGS Ltd. | 0 | -100,00 | 0 | -100,00 | ||||
| 2026-01-16 | 13F | Ronald Blue Trust, Inc. | 4.229 | -19,74 | 101 | -15,13 | ||||
| 2025-11-14 | 13F | Cubist Systematic Strategies, LLC | 562.895 | 12.727 | ||||||
| 2026-02-02 | 13F | Montag A & Associates Inc | 780 | 19 | ||||||
| 2026-02-17 | 13F | Citadel Advisors Llc | Put | 499.100 | 50,02 | 11.928 | 58,57 | |||
| 2026-02-17 | 13F | State Of Wisconsin Investment Board | 145.729 | -33,23 | 3.483 | -29,43 | ||||
| 2026-02-17 | 13F | Citadel Advisors Llc | Call | 1.167.300 | 506,39 | 27.898 | 541,04 | |||
| 2026-02-12 | 13F | Northwest & Ethical Investments L.P. | 0 | -100,00 | 0 | |||||
| 2026-02-12 | 13F | Nuveen, LLC | 1.556.565 | -13,66 | 37.202 | -8,73 | ||||
| 2026-02-17 | 13F | Raymond James Financial Inc | 3.716.540 | -3,16 | 88.825 | 2,37 | ||||
| 2026-02-17 | 13F | Citadel Advisors Llc | 6.338.457 | -42,61 | 151.489 | -39,34 | ||||
| 2026-02-13 | 13F | Prudential Financial Inc | 398.844 | -67,72 | 9.540 | -65,86 | ||||
| 2026-01-14 | 13F | Kmg Fiduciary Partners, Llc | 23.502 | -1,36 | 562 | 4,28 | ||||
| 2026-01-09 | 13F | SG Americas Securities, LLC | Call | 107.100 | 0 | |||||
| 2026-02-13 | 13F | Smartleaf Asset Management LLC | 5.765 | 4,76 | 138 | 10,48 | ||||
| 2026-01-28 | 13F | Papp L Roy & Associates | 23.341 | 0,00 | 558 | 5,69 | ||||
| 2026-02-12 | 13F | Colonial Trust Co / SC | 247 | 0,00 | 6 | 0,00 | ||||
| 2026-02-05 | 13F | Thrivent Financial For Lutherans | 167.029 | -5,16 | 4 | 0,00 | ||||
| 2026-02-13 | 13F | Walleye Capital LLC | Put | 100 | -99,66 | 2 | -99,70 | |||
| 2026-02-13 | 13F | Walleye Capital LLC | 132.414 | 3.194,70 | 3.165 | 3.415,56 | ||||
| 2026-02-17 | 13F | Mpwm Advisory Solutions, Llc | 0 | -100,00 | 0 | |||||
| 2026-02-17 | 13F | Blackstone Group Inc | 134.596 | 3.217 | ||||||
| 2026-02-17 | 13F | Algert Global Llc | 484.978 | 0,00 | 12 | 10,00 | ||||
| 2026-01-08 | 13F | True Wealth Design, LLC | 2.444 | -0,33 | 58 | 5,45 | ||||
| 2026-02-09 | 13F | Green Square Capital Advisors Llc | 11.430 | -2,16 | 273 | 10,53 | ||||
| 2026-02-17 | 13F | Fmr Llc | 12.685.967 | -12,09 | 303.195 | -7,07 | ||||
| 2026-02-12 | 13F | denkapparat Operations GmbH | 34.292 | 148,49 | 820 | 162,50 | ||||
| 2026-01-23 | 13F | Farther Finance Advisors, LLC | 13.630 | 157,56 | 326 | 173,11 | ||||
| 2026-02-11 | 13F | Prestige Wealth Management Group LLC | 183 | 0,00 | 4 | 0,00 | ||||
| 2026-02-13 | 13F | Boston Partners | 332.842 | -9,17 | 7.955 | -3,98 | ||||
| 2026-02-17 | 13F | Voleon Capital Management Lp | 0 | -100,00 | 0 | |||||
| 2026-02-13 | 13F | Rhumbline Advisers | 1.315.486 | -4,97 | 31.440 | 0,46 | ||||
| 2026-02-13 | 13F | Sei Investments Co | 493.738 | -2,63 | 11.801 | 2,93 | ||||
| 2026-01-23 | 13F | Aspect Partners, LLC | 220 | 0,00 | 5 | 25,00 | ||||
| 2026-01-29 | 13F | Quent Capital, LLC | 493 | 0,00 | 12 | 0,00 | ||||
| 2026-02-10 | 13F | Mutual Of America Capital Management Llc | 204.921 | -12,61 | 4.898 | -7,62 | ||||
| 2026-01-21 | 13F | Flagship Harbor Advisors, Llc | 989 | 24 | ||||||
| 2026-02-10 | 13F | Goldman Sachs Group Inc | Call | 747.000 | 17.853 | |||||
| 2026-01-21 | 13F | Yousif Capital Management, Llc | 156.676 | -5,01 | 3.746 | 0,46 | ||||
| 2026-02-10 | 13F | Goldman Sachs Group Inc | Put | 20.000 | 478 | |||||
| 2025-11-12 | 13F | Laurel Wealth Advisors LLC | 0 | -100,00 | 0 | |||||
| 2026-02-10 | 13F | Goldman Sachs Group Inc | 2.305.514 | 28,63 | 55.102 | 35,97 | ||||
| 2026-02-12 | 13F | Wealthspire Advisors, LLC | 0 | -100,00 | 0 | |||||
| 2026-01-15 | 13F | Affinity Wealth Management Llc | 10.979 | -0,44 | 262 | 5,22 | ||||
| 2026-01-29 | 13F | Sanctuary Advisors, LLC | 15.803 | 3,52 | 378 | 9,28 | ||||
| 2026-02-17 | 13F | Silvercrest Asset Management Group Llc | 8.491 | 203 | ||||||
| 2026-02-18 | 13F | GWM Advisors LLC | 237.453 | 1,82 | 5.675 | 7,64 | ||||
| 2026-01-26 | 13F | Cwm, Llc | 98.170 | 4,59 | 2 | 0,00 | ||||
| 2026-02-17 | 13F | FIL Ltd | 4.871.946 | -2,98 | 116.440 | 2,55 | ||||
| 2026-01-07 | 13F | CWA Asset Management Group, LLC | 0 | -100,00 | 0 | -100,00 | ||||
| 2026-02-12 | 13F | Cloud Capital Management, LLC | 0 | -100,00 | 0 | |||||
| 2025-11-14 | 13F | Hotchkis & Wiley Capital Management Llc | 0 | -100,00 | 0 | -100,00 | ||||
| 2026-01-21 | 13F | Phocas Financial Corp. | 0 | -100,00 | 0 | |||||
| 2026-02-11 | 13F | Deutsche Bank Ag\ | 185.797 | 370,77 | 4.441 | 397,76 | ||||
| 2026-02-17 | 13F | Millennium Management Llc | 9.817.089 | 54,65 | 234.628 | 63,47 | ||||
| 2026-02-17 | 13F | Millennium Management Llc | Call | 9.000.000 | 25,73 | 215.100 | 32,90 | |||
| 2026-01-21 | 13F | Capital Investment Advisory Services, LLC | 9.025 | 0,01 | 216 | 5,39 | ||||
| 2026-02-05 | 13F | Bessemer Group Inc | 138.495 | 4.170,58 | 3 | |||||
| 2026-01-15 | 13F | Nilsine Partners, LLC | 11.030 | 0,00 | 264 | 5,62 | ||||
| 2026-01-22 | 13F | Ransom Advisory, Ltd | 0 | -100,00 | 0 | -100,00 | ||||
| 2026-02-10 | 13F | New Mexico Educational Retirement Board | 100.849 | -8,03 | 2 | 0,00 | ||||
| 2026-02-05 | 13F | Am Investment Strategies Llc | 90.085 | -2,37 | 2 | 0,00 | ||||
| 2026-02-17 | 13F | Capital Fund Management S.a. | Put | 60.600 | -10,36 | 1.448 | -5,24 | |||
| 2026-02-17 | 13F | Capital Fund Management S.a. | Call | 13.900 | -72,69 | 332 | -71,13 | |||
| 2026-02-17 | 13F | Optiver Holding B.V. | 0 | -100,00 | 0 | |||||
| 2026-02-05 | 13F | HFM Investment Advisors, LLC | 31 | 0,00 | 1 | |||||
| 2026-02-02 | 13F | Strs Ohio | 262.042 | 0,01 | 6.263 | 5,71 | ||||
| 2026-02-13 | 13F | Kestra Advisory Services, LLC | 0 | -100,00 | 0 | |||||
| 2026-02-13 | 13F | Dixon Mitchell Investment Counsel Inc. | 13.410 | 323 | ||||||
| 2026-02-13 | 13F | Ubs Asset Management Americas Inc | 14.062.728 | -2,55 | 336.099 | 3,01 | ||||
| 2026-01-23 | 13F | Aldebaran Financial Inc. | 27.341 | 0,07 | 654 | 5,83 | ||||
| 2026-02-05 | 13F | Stephens Inc /ar/ | 252.082 | 1,20 | 6.025 | 6,96 | ||||
| 2026-01-28 | 13F | Geneos Wealth Management Inc. | 150 | 0,00 | 4 | 0,00 | ||||
| 2026-02-10 | 13F | Thoroughbred Financial Services, Llc | 14.055 | 3,36 | 0 | |||||
| 2026-02-12 | 13F | Principal Securities, Inc. | 0 | -100,00 | 0 | |||||
| 2025-11-13 | 13F | Dynamic Technology Lab Private Ltd | 0 | -100,00 | 0 | -100,00 | ||||
| 2026-02-13 | 13F | MAI Capital Management | 5.697 | 1,48 | 136 | 7,94 | ||||
| 2026-02-05 | 13F | Allworth Financial LP | 2.361 | 7,51 | 56 | 14,29 | ||||
| 2026-01-23 | 13F | Zwj Investment Counsel Inc | 20.601 | 0,00 | 492 | 5,81 | ||||
| 2026-02-11 | 13F | LPL Financial LLC | 239.781 | 0,25 | 5.731 | 5,97 | ||||
| 2026-02-17 | 13F | Quantitative Investment Management, LLC | 115.668 | 3 | ||||||
| 2026-02-12 | 13F | Xponance, Inc. | 46.217 | -18,34 | 1.105 | -13,68 | ||||
| 2026-02-06 | 13F | Harmony Asset Management Llc | 97.739 | -2,38 | 2.336 | 3,18 | ||||
| 2026-02-06 | 13F | Profund Advisors Llc | 15.065 | -6,94 | 360 | -1,64 | ||||
| 2026-02-13 | 13F | Y-Intercept (Hong Kong) Ltd | 121.661 | 70,85 | 2.908 | 80,56 | ||||
| 2026-02-17 | 13F | Ameriprise Financial Inc | 506.949 | -3,54 | 12.129 | 1,96 | ||||
| 2026-01-30 | 13F | Ares Financial Consulting, LLC | 400 | 10 | ||||||
| 2026-02-10 | 13F | Commonwealth Of Pennsylvania Public School Empls Retrmt Sys | 123.217 | -5,44 | 2.945 | -0,07 | ||||
| 2026-02-09 | 13F | Legal & General Group Plc | 760.110 | -14,50 | 18.167 | -9,62 | ||||
| 2026-02-10 | 13F | Bbr Partners, Llc | 26.727 | 0,00 | 639 | 5,63 | ||||
| 2026-02-13 | 13F | Alyeska Investment Group, L.P. | 1.633.952 | -53,08 | 39.051 | -50,40 | ||||
| 2026-02-12 | 13F | Triumph Capital Management | 3.400 | 0,00 | 81 | 6,58 | ||||
| 2026-02-13 | 13F | Eventide Asset Management, Llc | 9.023 | -75,09 | 216 | -73,78 | ||||
| 2026-01-26 | 13F | Greenwood Capital Associates Llc | 123.393 | -1,25 | 2.949 | 4,39 | ||||
| 2026-01-21 | 13F | Stone House Investment Management, LLC | 289 | 31,36 | 7 | 50,00 | ||||
| 2026-02-12 | 13F | New South Capital Management Inc | 10.117 | 0,00 | 242 | 5,70 | ||||
| 2026-02-17 | 13F | Triveni Capital Investments LP | 284.813 | 6.807 | ||||||
| 2026-02-03 | 13F | Ethic Inc. | 20.508 | -12,11 | 490 | -7,02 | ||||
| 2026-02-05 | 13F | bLong Financial, LLC | 10.255 | 0,00 | 245 | 6,06 | ||||
| 2026-01-26 | 13F | AE Wealth Management LLC | 28.613 | 25,24 | 684 | 32,36 | ||||
| 2026-02-13 | 13F | Caxton Associates Llp | 36.384 | -17,43 | 870 | -12,75 | ||||
| 2026-02-12 | 13F | Swiss National Bank | 1.001.100 | 1,78 | 23.926 | 7,59 | ||||
| 2026-02-17 | 13F | Quadrature Capital Ltd | 23.729 | 567 | ||||||
| 2026-02-05 | 13F | Millennium Capital Advisors, LLC | 14.789 | 0,10 | 353 | 5,69 | ||||
| 2026-01-29 | 13F | Nbc Securities, Inc. | 300 | 0,00 | 7 | 16,67 | ||||
| 2025-11-14 | 13F | Natixis | 0 | -100,00 | 0 | |||||
| 2026-02-12 | 13F | DRW Securities, LLC | 335.930 | 25,20 | 8.029 | 31,74 | ||||
| 2026-02-09 | 13F | Delta Asset Management Llc/tn | 107.599 | 0,00 | 2.572 | 5,72 | ||||
| 2026-02-23 | 13F | Mv Capital Management, Inc. | 5 | 0,00 | 0 | |||||
| 2026-01-09 | 13F | SG Americas Securities, LLC | 58.658 | 1 | ||||||
| 2026-01-26 | 13F | Whittier Trust Co | 7.000 | -0,26 | 173 | 8,86 | ||||
| 2026-01-09 | 13F | SG Americas Securities, LLC | Put | 18.700 | 0 | |||||
| 2026-02-17 | 13F | Holocene Advisors, LP | 2.215.612 | 66,07 | 52.953 | 75,54 | ||||
| 2026-02-18 | 13F | Beacon Pointe Advisors, LLC | 11.440 | 16,41 | 273 | 22,97 | ||||
| 2026-01-15 | 13F | Fortitude Family Office, LLC | 215 | -21,53 | 5 | -16,67 | ||||
| 2026-01-28 | 13F | Rather & Kittrell, Inc. | 76.104 | 0,03 | 1.819 | 5,70 | ||||
| 2026-02-13 | 13F | Healthcare Of Ontario Pension Plan Trust Fund | 0 | -100,00 | 0 | -100,00 | ||||
| 2026-02-06 | 13F | HighTower Advisors, LLC | 55.381 | -16,62 | 1.324 | -11,86 | ||||
| 2026-02-12 | 13F | MetLife Investment Management, LLC | 240.768 | -7,71 | 5.754 | -2,44 | ||||
| 2026-01-16 | 13F | Linden Thomas Advisory Services, LLC | 46.341 | -0,24 | 1.108 | 5,43 | ||||
| 2026-02-11 | 13F | Longfellow Investment Management Co Llc | 68 | 0,00 | 2 | 0,00 | ||||
| 2026-01-21 | 13F | Unison Advisors LLC | 0 | -100,00 | 0 | |||||
| 2026-02-17 | 13F | Summit Trail Advisors, Llc | 25.067 | 1,22 | 603 | 6,93 | ||||
| 2025-11-05 | 13F | BI Asset Management Fondsmaeglerselskab A/S | 3.772 | 0,00 | 0 | |||||
| 2026-01-22 | 13F | Financial Consulate, Inc | 21 | -41,67 | 1 | |||||
| 2026-02-02 | 13F | Wolverine Asset Management Llc | 83.942 | 0,00 | 2.006 | 5,75 | ||||
| 2026-01-27 | 13F | MASTERINVEST Kapitalanlage GmbH | 103.067 | -3,05 | 2.465 | 2,58 | ||||
| 2026-02-10 | 13F | Quantbot Technologies LP | 202.224 | -36,24 | 4.833 | -32,59 | ||||
| 2026-02-17 | 13F | Credit Agricole S A | 9.432 | -9,26 | 225 | -4,26 | ||||
| 2026-02-17 | 13F | Forest Hill Capital, LLC | 28.000 | 0,00 | 669 | 5,69 | ||||
| 2026-01-30 | 13F | North Star Investment Management Corp. | 400 | 0,00 | 10 | 0,00 | ||||
| 2026-02-04 | 13F | Nwam Llc | 0 | -100,00 | 0 | -100,00 | ||||
| 2026-02-11 | 13F | Inceptionr Llc | 22.947 | 548 | ||||||
| 2026-01-30 | 13F | NJ State Employees Deferred Compensation Plan | 0 | -100,00 | 0 | |||||
| 2026-01-14 | 13F | Jfs Wealth Advisors, Llc | 177 | 190,16 | 4 | 300,00 | ||||
| 2026-02-13 | 13F | Commerce Bank | 15.937 | -0,39 | 381 | 5,26 | ||||
| 2026-02-12 | 13F | Alps Advisors Inc | 40.287 | 0,00 | 963 | 5,71 | ||||
| 2026-02-10 | 13F | Intech Investment Management Llc | 187.388 | -27,85 | 4.479 | -23,74 | ||||
| 2026-02-05 | 13F | Atria Investments Llc | 97.708 | 514,55 | 2.335 | 550,42 | ||||
| 2026-02-17 | 13F | Canada Pension Plan Investment Board | 332.600 | 3,58 | 7.949 | 9,49 | ||||
| 2026-02-17 | 13F | ISAM Funds (UK) Ltd | 23.595 | -61,69 | 564 | -59,55 | ||||
| 2026-02-13 | 13F | PYA Waltman Capital, LLC | 9.630 | 0,00 | 230 | 5,99 | ||||
| 2026-02-13 | 13F | Capital Square, LLC | 111.042 | -2,20 | 2.654 | 3,35 | ||||
| 2026-02-17 | 13F | Wiley Bros.-aintree Capital, Llc | 210.600 | 7,84 | 5.023 | 13,77 | ||||
| 2026-01-23 | 13F | Andrew Hill Investment Advisors, Inc. | 295.374 | 7.059 | ||||||
| 2026-02-13 | 13F | Citigroup Inc | 354.335 | -23,63 | 8.469 | -19,28 | ||||
| 2026-02-12 | 13F | Great Lakes Advisors, Llc | 241.616 | -29,58 | 5.775 | -25,57 | ||||
| 2026-02-13 | 13F | Citigroup Inc | Call | 30.000 | 0,00 | 717 | 5,75 | |||
| 2026-02-06 | 13F | ProShare Advisors LLC | 19.746 | -54,28 | 472 | -51,74 | ||||
| 2026-02-06 | 13F | IFP Advisors, Inc | 6.368 | 0,78 | 152 | 7,04 | ||||
| 2026-02-09 | 13F | Fisher Asset Management, LLC | 1.357.989 | 24,87 | 32.456 | 32,00 | ||||
| 2026-02-12 | 13F | Colonial Trust Advisors | 536 | 0,00 | 13 | 0,00 | ||||
| 2026-02-13 | 13F | National Bank Of Canada /fi/ | 98.468 | -22,29 | 2.353 | -17,84 | ||||
| 2026-02-17 | 13F | Stokes Family Office, LLC | 96.410 | 0,00 | 2.304 | 5,74 | ||||
| 2026-01-26 | 13F | Private Trust Co Na | 97 | -37,01 | 2 | -33,33 | ||||
| 2026-01-23 | 13F | Private Wealth Management Group, LLC | 1.164 | 0,00 | 28 | 3,85 | ||||
| 2026-02-26 | 13F | Anchor Investment Management, LLC | 1.214 | 0,00 | 29 | 7,41 | ||||
| 2026-02-05 | 13F | North Dakota State Investment Board | 17.700 | 423 | ||||||
| 2026-02-06 | 13F | EverSource Wealth Advisors, LLC | 74.262 | 796,45 | 1.775 | 848,66 | ||||
| 2026-02-13 | 13F | Colony Group, LLC | 50.479 | 50,66 | 1.207 | 57,37 | ||||
| 2025-11-14 | 13F | Maverick Capital Ltd | 0 | -100,00 | 0 | |||||
| 2026-02-13 | 13F | SYM FINANCIAL Corp | 9.447 | 0,61 | 226 | 6,13 | ||||
| 2026-01-14 | 13F | Eastern Bank | 23 | 1 | ||||||
| 2026-02-13 | 13F | Entropy Technologies, LP | 41.690 | 996 | ||||||
| 2026-02-02 | 13F | Principal Financial Group Inc | 3.849.088 | 28,43 | 91.993 | 35,76 | ||||
| 2026-02-09 | 13F | Bleakley Financial Group, LLC | 43.522 | 21,03 | 1.040 | 27,92 | ||||
| 2026-02-17 | 13F | EFG International AG | 73.774 | 1.763 | ||||||
| 2026-02-03 | 13F | Carlson Capital L P | 29.100 | 695 | ||||||
| 2026-02-17 | 13F | Parallax Volatility Advisers, L.P. | Put | 295.000 | 195,00 | 7.050 | 211,81 | |||
| 2026-02-17 | 13F | Lighthouse Investment Partners, LLC | 183.062 | -31,77 | 4.375 | -27,86 | ||||
| 2026-02-04 | 13F | Swiss Life Asset Management Ltd | 23.229 | 1,23 | 555 | 7,14 | ||||
| 2026-02-11 | 13F | Jpmorgan Chase & Co | 2.366.444 | -57,56 | 56.558 | -55,14 | ||||
| 2026-02-11 | 13F | Vaughan David Investments Inc/il | 20.142 | 0,00 | 0 | |||||
| 2026-02-13 | 13F | American Century Companies Inc | 245.848 | 1,85 | 5.876 | 7,66 | ||||
| 2026-02-17 | 13F | Parallax Volatility Advisers, L.P. | 54.718 | 18,46 | 1.308 | 25,19 | ||||
| 2025-11-14 | 13F | Symmetry Investments LP | 0 | -100,00 | 0 | |||||
| 2026-02-17 | 13F | Parallax Volatility Advisers, L.P. | Call | 34.000 | 16.900,00 | 813 | 20.200,00 | |||
| 2026-02-13 | 13F | Mariner, LLC | 201.037 | 112,86 | 4.805 | 125,01 | ||||
| 2026-02-12 | 13F | BlackRock, Inc. | 57.697.691 | -3,34 | 1.378.975 | 2,18 | ||||
| 2026-02-03 | 13F | Gateway Investment Advisers Llc | 134.671 | 111,27 | 3.219 | 123,32 | ||||
| 2026-02-17 | 13F | Tower Research Capital LLC (TRC) | 9.881 | -43,49 | 236 | -40,25 | ||||
| 2026-02-13 | 13F | Wells Fargo & Company/mn | 681.958 | 2,77 | 16.299 | 8,63 | ||||
| 2026-02-17 | 13F | Mercer Global Advisors Inc /adv | 83.680 | 72,64 | 2.000 | 82,56 | ||||
| 2026-01-29 | 13F | TBH Global Asset Management, LLC | 102.161 | -0,46 | 2.442 | 5,22 | ||||
| 2026-01-12 | 13F | Cullen Investment Group, Ltd. | 19.438 | 0,48 | 476 | 8,94 | ||||
| 2026-02-09 | 13F | New Age Alpha Advisors, LLC | 280.330 | -13,96 | 6.700 | -9,06 | ||||
| 2026-02-17 | 13F | Graham Capital Management, L.P. | 0 | -100,00 | 0 | |||||
| 2026-02-13 | 13F | Walleye Capital LLC | Call | 0 | -100,00 | 0 | -100,00 | |||
| 2026-02-10 | 13F | Smith Group Asset Management, LLC | 90.000 | 0,00 | 2.151 | 5,75 | ||||
| 2026-02-13 | 13F | Cito Capital Group, LLC | 20.000 | 0 | ||||||
| 2026-02-09 | 13F | Coldstream Capital Management Inc | 23.239 | -3,41 | 555 | 2,21 | ||||
| 2025-11-14 | 13F | WealthTrak Capital Management LLC | 0 | -100,00 | 0 | |||||
| 2026-01-23 | 13F | Ritholtz Wealth Management | 20.915 | -0,86 | 500 | 4,83 | ||||
| 2026-01-21 | 13F | Greenleaf Trust | 19.401 | -0,98 | 464 | 4,75 | ||||
| 2026-02-09 | 13F | Geode Capital Management, Llc | 9.081.283 | -0,50 | 217.088 | 5,18 | ||||
| 2026-02-09 | 13F | Mediolanum International Funds Ltd | 933.834 | 22.337 | ||||||
| 2026-02-19 | 13F | TMB Capital Partners, LLC | 23.132 | 553 | ||||||
| 2026-02-06 | 13F | Larson Financial Group LLC | 610 | 1,16 | 15 | 7,69 | ||||
| 2026-01-08 | 13F | Grove Bank & Trust | 900 | 22 | ||||||
| 2025-11-14 | 13F | Point72 (DIFC) Ltd | 0 | -100,00 | 0 | |||||
| 2026-02-17 | 13F | Jain Global LLC | 0 | -100,00 | 0 | |||||
| 2026-02-12 | 13F | California Public Employees Retirement System | 968.827 | -0,32 | 23.155 | 5,37 | ||||
| 2026-02-13 | 13F | Marshall Wace, Llp | 388.460 | 9.284 | ||||||
| 2026-02-02 | 13F | Bay Harbor Wealth Management, LLC | 30 | 30,43 | 1 | |||||
| 2026-02-12 | 13F | ROSS\JOHNSON & Associates LLC | 8 | 0 | ||||||
| 2026-02-11 | 13F | Janney Montgomery Scott LLC | 30.424 | -17,63 | 1 | |||||
| 2026-02-02 | 13F | Benjamin Edwards Inc | 33.207 | 794 | ||||||
| 2026-02-11 | 13F | Brandywine Global Investment Management, LLC | 562.604 | 52,80 | 13.446 | 61,53 | ||||
| 2026-02-13 | 13F | Barclays Plc | Call | 1.600.000 | 38.240 | |||||
| 2026-02-17 | 13F | Delaware Management Holdings, Inc. | 135.800 | 3.246 | ||||||
| 2026-02-13 | 13F | Barclays Plc | Put | 500.000 | 11.950 | |||||
| 2026-02-13 | 13F | Barclays Plc | 761.147 | -59,66 | 18.191 | -37,92 | ||||
| 2026-02-13 | 13F | Umb Bank N A/mo | 6.019 | 14,36 | 144 | 21,19 | ||||
| 2025-11-12 | 13F | CIBC Bancorp USA Inc. | 35.978 | 813 | ||||||
| 2026-01-26 | 13F | Whittier Trust Co Of Nevada Inc | 1.108 | -36,43 | 27 | -30,77 | ||||
| 2026-02-06 | 13F | Bare Financial Services, Inc | 48 | 50,00 | 1 | |||||
| 2026-01-22 | 13F | Bfsg, Llc | 8.040 | -2,55 | 192 | 3,23 | ||||
| 2026-02-17 | 13F | California State Teachers Retirement System | 482.030 | 1,02 | 11.521 | 6,79 | ||||
| 2025-11-07 | 13F | Synovus Financial Corp | 37.740 | -2,31 | 853 | 4,15 | ||||
| 2026-01-23 | 13F | Lester Murray Antman dba SimplyRich | 13.198 | 0,12 | 0 | |||||
| 2026-01-23 | 13F | Optima Capital Llc | 30 | 1 | ||||||
| 2026-02-13 | 13F | SRS Capital Advisors, Inc. | 7.106 | -61,70 | 170 | -59,67 | ||||
| 2025-10-22 | 13F | Gries Financial Llc | 14.554 | 1,13 | 329 | 7,87 | ||||
| 2026-02-17 | 13F | North Reef Capital Management LP | 11.516.840 | -6,90 | 275.252 | -1,58 | ||||
| 2026-02-06 | 13F | Radnor Capital Management, LLC | 21.425 | -16,39 | 512 | -11,57 | ||||
| 2026-01-22 | 13F | Richardson Financial Services Inc. | 545 | -39,11 | 13 | -35,00 | ||||
| 2026-02-09 | 13F | Hartland & Co., LLC | 1.840 | -49,66 | 44 | -47,56 | ||||
| 2026-01-28 | 13F | Arizona State Retirement System | 140.610 | -6,32 | 3.361 | -0,97 | ||||
| 2026-02-11 | 13F | Cerity Partners LLC | 164.586 | 13,16 | 3.934 | 19,62 | ||||
| 2026-02-12 | 13F | Voya Investment Management Llc | 200.648 | -12,71 | 4.795 | -7,74 | ||||
| 2026-02-13 | 13F | First Trust Advisors Lp | 966.651 | -0,42 | 23.103 | 5,26 | ||||
| 2026-02-02 | 13F | Access Investment Management LLC | 90.350 | 0,00 | 2.043 | 0,00 | ||||
| 2026-02-10 | 13F | Eurizon Capital SGR S.p.A. | 20.334 | 486 | ||||||
| 2026-01-28 | 13F | Atwood & Palmer Inc | 786 | 0,00 | 19 | 5,88 | ||||
| 2026-02-04 | 13F | Securian Asset Management, Inc | 35.884 | -5,64 | 858 | -0,23 | ||||
| 2026-02-11 | 13F | Los Angeles Capital Management Llc | 2.151 | 45 | ||||||
| 2026-01-14 | 13F | Moisand Fitzgerald Tamayo, LLC | 1.058 | 0,00 | 25 | 8,70 | ||||
| 2026-02-24 | 13F | Bell Investment Advisors, Inc | 780 | 0,00 | 19 | 5,88 | ||||
| 2026-02-17 | 13F | Hancock Whitney Corp | 46.777 | 1,48 | 1.118 | 7,20 | ||||
| 2026-01-21 | 13F | Capital Advisors, Ltd. LLC | 200 | 0,00 | 0 | |||||
| 2026-02-10 | 13F/A | Algebris (uk) Ltd | 0 | -100,00 | 0 | -100,00 | ||||
| 2026-02-10 | 13F | Calton & Associates, Inc. | 9.117 | 0,00 | 218 | 5,34 | ||||
| 2025-10-28 | 13F | Leavell Investment Management, Inc. | 0 | -100,00 | 0 | -100,00 | ||||
| 2026-02-13 | 13F | Parkside Financial Bank & Trust | 1.328 | 2,23 | 32 | 6,90 | ||||
| 2026-01-12 | 13F | Contravisory Investment Management, Inc. | 1.149 | 0,00 | 27 | 8,00 | ||||
| 2026-02-11 | 13F | Clearbridge Investments, LLC | 5.200.621 | -2,04 | 124.295 | 3,55 | ||||
| 2026-01-27 | 13F | Bayforest Capital Ltd | 139 | 3 | ||||||
| 2026-02-02 | 13F | Salzhauer Michael | Call | 150.000 | -51,61 | 195 | -57,33 | |||
| 2026-02-11 | 13F | Vestcor Inc | 152.200 | 48,92 | 4 | 50,00 | ||||
| 2026-02-12 | 13F | Jane Street Group, Llc | 1.476.700 | 365,65 | 35.293 | 392,23 | ||||
| 2026-02-02 | 13F | Salzhauer Michael | 125.773 | 179,52 | 3.006 | 195,48 | ||||
| 2026-02-12 | 13F | Jane Street Group, Llc | Call | 3.361.400 | 1.005,36 | 80.337 | 1.068,54 | |||
| 2026-01-20 | 13F | Cigna Investments Inc /new | 346.266 | 0,00 | 0 | |||||
| 2026-02-10 | 13F | Natixis Advisors, L.p. | 418.695 | -3,18 | 10 | 11,11 | ||||
| 2026-02-12 | 13F | Jane Street Group, Llc | Put | 105.800 | -69,08 | 2.529 | -67,33 | |||
| 2026-01-07 | 13F | Hilltop National Bank | 5.017 | 120 | ||||||
| 2026-01-28 | 13F | Salomon & Ludwin, LLC | 666 | 0,00 | 16 | 6,67 | ||||
| 2026-02-09 | 13F | Cary Street Partners Financial Llc | 244.914 | 9,04 | 5.853 | 15,26 | ||||
| 2026-02-12 | 13F | Great Lakes Retirement, Inc. | 9.377 | 0,78 | 226 | 7,14 | ||||
| 2026-02-10 | 13F | Bank of New York Mellon Corp | 31.464.036 | -3,01 | 751.990 | 2,52 | ||||
| 2026-02-17 | 13F | ExodusPoint Capital Management, LP | 0 | -100,00 | 0 | -100,00 | ||||
| 2026-02-11 | 13F | Simplex Trading, Llc | Put | 167.600 | -2,16 | 4.006 | 133.400,00 | |||
| 2025-11-12 | 13F | NewSquare Capital LLC | 0 | -100,00 | 0 | |||||
| 2026-02-11 | 13F | Simplex Trading, Llc | 140.744 | 41,36 | 3.364 | 168.050,00 | ||||
| 2026-02-11 | 13F | Erste Asset Management GmbH | 0 | 0 | ||||||
| 2026-02-03 | 13F | Farmers & Merchants Investments Inc | 465 | 6,90 | 11 | 22,22 | ||||
| 2026-02-13 | 13F | Charles Schwab Investment Management Inc | 3.419.903 | -1,49 | 81.736 | 4,13 | ||||
| 2026-01-30 | 13F | Arlington Trust Co LLC | 340 | 8 | ||||||
| 2026-02-02 | 13F | Sachetta, LLC | 167 | 0,00 | 4 | 0,00 | ||||
| 2026-02-04 | 13F | Oregon Public Employees Retirement Fund | 97.838 | -4,30 | 2.338 | 1,17 | ||||
| 2026-02-17 | 13F | Sherbrooke Park Advisers Llc | 0 | -100,00 | 0 | -100,00 | ||||
| 2026-01-26 | 13F | Bcm Advisors, Llc | 11.910 | 0,00 | 285 | 13,15 | ||||
| 2026-02-17 | 13F | Qube Research & Technologies Ltd | 455.417 | -77,11 | 10.884 | -75,81 | ||||
| 2026-02-10 | 13F | Fort Sheridan Advisors Llc | 51.018 | 0,00 | 1.219 | 5,72 | ||||
| 2026-01-26 | 13F | BCS Wealth Management | 11.352 | 271 | ||||||
| 2026-02-05 | 13F | Td Private Client Wealth Llc | 9 | 0,00 | 0 | |||||
| 2026-01-27 | 13F | Tributary Capital Management, LLC | 72.825 | 0,00 | 0 | |||||
| 2026-02-13 | 13F | Morgan Stanley | 5.212.543 | 10,41 | 124.580 | 16,71 | ||||
| 2026-02-17 | 13F | Ancora Advisors, LLC | 2.476 | 51,34 | 59 | 63,89 | ||||
| 2026-01-09 | 13F | Diversified Trust Co | 9.299 | -2,38 | 222 | 3,26 | ||||
| 2026-01-14 | 13F | Spire Wealth Management | 1.313 | -65,06 | 31 | -63,10 | ||||
| 2026-02-13 | 13F | Walleye Trading LLC | Call | 146.100 | 244,58 | 3.492 | 264,41 | |||
| 2026-02-13 | 13F | Walleye Trading LLC | 130.637 | 793,79 | 3.122 | 846,06 | ||||
| 2026-02-17 | 13F | Azora Capital LP | 0 | -100,00 | 0 | -100,00 | ||||
| 2026-01-16 | 13F | Louisiana State Employees Retirement System | 136.200 | -3,61 | 3.255 | 1,91 | ||||
| 2026-02-13 | 13F | Caitong International Asset Management Co., Ltd | 155 | 675,00 | 4 | |||||
| 2026-01-08 | 13F | Wealth Enhancement Advisory Services, Llc | 120.518 | -13,01 | 2.974 | -6,57 | ||||
| 2026-02-13 | 13F | Walleye Trading LLC | Put | 99.500 | 32,49 | 2.378 | 40,05 | |||
| 2026-02-05 | 13F | Berkeley Capital Partners, LLC | 45.044 | 1.077 | ||||||
| 2026-01-29 | 13F | Dunhill Financial, LLC | 10 | 0 | ||||||
| 2026-01-16 | 13F | Trust Co Of Vermont | 579 | 0,00 | 14 | 0,00 | ||||
| 2026-02-12 | 13F | Federated Hermes, Inc. | 39.596 | -12,70 | 946 | -7,71 | ||||
| 2026-02-06 | 13F | Alan B. Lancz & Associates, Inc. | 13.100 | 0,00 | 313 | 5,74 | ||||
| 2026-02-05 | 13F | Gamco Investors, Inc. Et Al | 175.800 | 0,00 | 4.202 | 5,71 | ||||
| 2026-02-12 | 13F | Hrt Financial Lp | 1.782.438 | 43 | ||||||
| 2026-02-17 | 13F | Magnetar Financial LLC | 0 | -100,00 | 0 | |||||
| 2026-02-13 | 13F | Quarry LP | 0 | -100,00 | 0 | |||||
| 2026-02-17 | 13F | Expect Equity LLC | 170.926 | 8,92 | 4.085 | 15,14 | ||||
| 2026-01-28 | 13F | WPG Advisers, LLC | 815 | -5,56 | 19 | 0,00 | ||||
| 2026-01-30 | 13F | Turning Point Benefit Group, Inc. | 145 | 3 | ||||||
| 2026-01-28 | 13F | Klp Kapitalforvaltning As | 112.900 | 6,21 | 2.713 | 12,25 | ||||
| 2026-02-17 | 13F | RMB Capital Management, LLC | 455.185 | 0,70 | 10.879 | 6,45 | ||||
| 2026-02-17 | 13F | Alliancebernstein L.p. | 1.058.235 | -13,86 | 25.292 | -8,94 | ||||
| 2026-02-12 | 13F | JPL Wealth Management, LLC | 0 | -100,00 | 0 | |||||
| 2026-02-11 | 13F | Peachtree Investment Partners, LLC | 17.189 | 0,00 | 411 | 5,67 | ||||
| 2026-02-13 | 13F | Huber Capital Management LLC | 690.768 | 12,66 | 16.509 | 19,09 | ||||
| 2026-02-09 | 13F | Wellington Shields & Co., LLC | 10.000 | 0,00 | 239 | 5,75 | ||||
| 2026-02-13 | 13F | Inspire Advisors, LLC | 11.297 | 270 | ||||||
| 2026-02-17 | 13F | Two Sigma Advisers, Lp | 197.873 | 566,24 | 4.729 | 604,77 | ||||
| 2026-02-05 | 13F | Duncan Williams Asset Management, LLC | 343.772 | -4,07 | 8.859 | 9,33 | ||||
| 2026-01-28 | 13F | DekaBank Deutsche Girozentrale | 5.451 | 0,00 | 0 | |||||
| 2026-02-13 | 13F | Centiva Capital, LP | 24.305 | 581 | ||||||
| 2026-02-17 | 13F | Price T Rowe Associates Inc /md/ | 406.297 | 4,83 | 10 | 12,50 | ||||
| 2026-01-07 | 13F | Lynch & Associates/in | 434.329 | 0,00 | 0 | |||||
| 2026-01-27 | 13F | Meritage Portfolio Management | 423.143 | -4,34 | 10.113 | 1,12 | ||||
| 2026-01-28 | 13F | Southern Capital Advisors, Llc | 21.232 | 0,46 | 507 | 6,29 | ||||
| 2026-02-10 | 13F | Nomura Asset Management Co Ltd | 5.300 | 0,00 | 127 | 5,88 | ||||
| 2026-02-11 | 13F | Simplex Trading, Llc | Call | 813.900 | 911,06 | 19.452 | 1.945.100,00 | |||
| 2026-02-17 | 13F | Blair William & Co/il | 14.840 | 0,82 | 355 | 6,63 | ||||
| 2026-01-21 | 13F | Aaron Wealth Advisors LLC | 9.905 | 5,44 | 237 | 11,32 | ||||
| 2026-02-17 | 13F | Warren Averett Asset Management, LLC | 186.524 | 353,91 | 4.458 | 379,76 | ||||
| 2026-02-03 | 13F | Sequoia Financial Advisors, LLC | 22.136 | 149,42 | 529 | 164,50 | ||||
| 2026-02-13 | 13F | Pathstone Holdings, LLC | 123.165 | -0,56 | 2.947 | 5,14 | ||||
| 2026-02-02 | 13F | Cornerstone Planning Group LLC | 17 | 240,00 | 0 | |||||
| 2026-02-17 | 13F | Janus Henderson Group Plc | 224.948 | 0,00 | 5.375 | 5,77 | ||||
| 2026-01-30 | 13F | Barnes Pettey Financial Advisors, Llc | 19.639 | -10,05 | 469 | -4,87 | ||||
| 2026-02-13 | 13F | Panagora Asset Management Inc | 18.814 | 0,00 | 450 | 5,65 |