Grundlæggende statistik
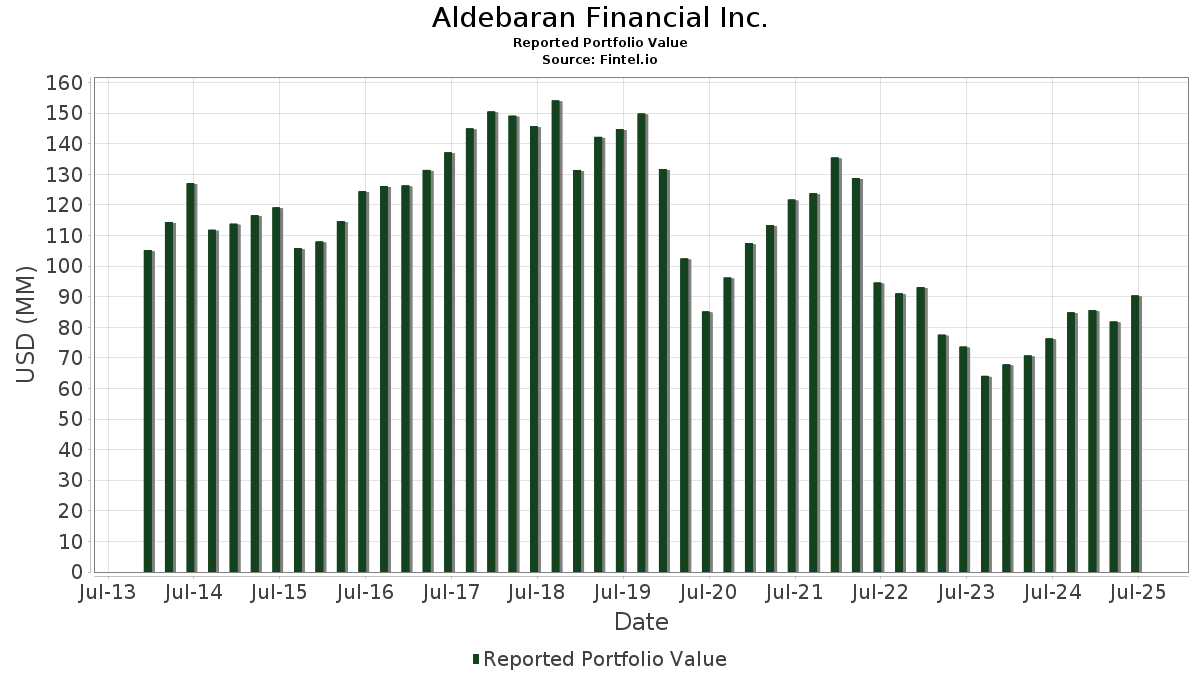
| Porteføljeværdi | $ 90.357.850 |
| Nuværende stillinger | 73 |
Seneste beholdninger, ydeevne, AUM (fra 13F, 13D)
Aldebaran Financial Inc. har afsløret 73 samlede besiddelser i deres seneste SEC-arkivering. Den seneste porteføljeværdi er beregnet til at være $ 90.357.850 USD. Faktiske aktiver under forvaltning (AUM) er denne værdi plus kontanter (som ikke er oplyst). Aldebaran Financial Inc.s største beholdninger er Fortinet, Inc. (US:FTNT) , Berkshire Hathaway Inc. (US:BRK.B) , SPDR Series Trust - SPDR Portfolio S&P 1500 Composite Stock Market ETF (US:SPTM) , Apple Inc. (US:AAPL) , and SPDR S&P 500 ETF (US:SPY) . Aldebaran Financial Inc.s nye stillinger omfatter Strategy Inc (US:MSTR) , Palantir Technologies Inc. (US:PLTR) , .
Top øger dette kvartal
Vi bruger ændringen i porteføljeallokeringen, fordi dette er den mest meningsfulde metrik. Ændringer kan skyldes handler eller ændringer i aktiekurser.
| Sikkerhed | Aktier (MM) |
Værdi (MM$) |
Portefølje % | ΔPortefølje % |
|---|---|---|---|---|
| 0,02 | 3,56 | 3,9369 | 1,0728 | |
| 0,01 | 4,17 | 4,6192 | 0,8555 | |
| 0,00 | 1,92 | 2,1301 | 0,5100 | |
| 0,00 | 2,44 | 2,6957 | 0,4897 | |
| 0,07 | 5,47 | 6,0515 | 0,3484 | |
| 0,01 | 4,72 | 5,2227 | 0,3416 | |
| 0,00 | 0,31 | 0,3409 | 0,3409 | |
| 0,01 | 3,33 | 3,6888 | 0,3382 | |
| 0,00 | 0,29 | 0,3221 | 0,3221 | |
| 0,00 | 1,47 | 1,6245 | 0,3150 |
Top falder i dette kvartal
Vi bruger ændringen i porteføljeallokeringen, fordi dette er den mest meningsfulde metrik. Ændringer kan skyldes handler eller ændringer i aktiekurser.
| Sikkerhed | Aktier (MM) |
Værdi (MM$) |
Portefølje % | ΔPortefølje % |
|---|---|---|---|---|
| 0,02 | 7,55 | 8,3594 | -1,7929 | |
| 0,02 | 5,07 | 5,6067 | -0,9630 | |
| 0,01 | 1,99 | 2,1977 | -0,3972 | |
| 0,00 | 0,31 | 0,3377 | -0,2883 | |
| 0,01 | 2,53 | 2,8018 | -0,2818 | |
| 0,01 | 0,87 | 0,9587 | -0,2361 | |
| 0,01 | 0,59 | 0,6517 | -0,1733 | |
| 0,00 | 0,84 | 0,9295 | -0,1637 | |
| 0,00 | 0,34 | 0,3805 | -0,1541 | |
| 0,00 | 0,57 | 0,6276 | -0,1521 |
13F og Fondsarkivering
Denne formular blev indsendt den 2025-08-14 for rapporteringsperioden 2025-06-30. Klik på linkikonet for at se den fulde transaktionshistorik.
Opgrader for at låse op for premium-data og eksportere til Excel ![]() .
.
| Sikkerhed | Type | Gennemsnitlig aktiekurs | Aktier (MM) |
Δ Aktier (%) |
Δ Aktier (%) |
Værdi ($MM) |
Portefølje (%) |
ΔPortefølje (%) |
|
|---|---|---|---|---|---|---|---|---|---|
| FTNT / Fortinet, Inc. | 0,07 | 0,76 | 7,72 | 10,68 | 8,5460 | 0,0187 | |||
| BRK.B / Berkshire Hathaway Inc. | 0,02 | -0,31 | 7,55 | -9,08 | 8,3594 | -1,7929 | |||
| SPTM / SPDR Series Trust - SPDR Portfolio S&P 1500 Composite Stock Market ETF | 0,07 | 6,41 | 5,47 | 17,19 | 6,0515 | 0,3484 | |||
| AAPL / Apple Inc. | 0,02 | 2,03 | 5,07 | -5,75 | 5,6067 | -0,9630 | |||
| SPY / SPDR S&P 500 ETF | 0,01 | 6,97 | 4,72 | 18,15 | 5,2227 | 0,3416 | |||
| MSFT / Microsoft Corporation | 0,01 | 2,28 | 4,17 | 35,53 | 4,6192 | 0,8555 | |||
| NVDA / NVIDIA Corporation | 0,02 | 4,13 | 3,56 | 51,81 | 3,9369 | 1,0728 | |||
| JPM / JPMorgan Chase & Co. | 0,01 | 2,86 | 3,33 | 21,60 | 3,6888 | 0,3382 | |||
| SPLG / SPDR Series Trust - SPDR Portfolio S&P 500 ETF | 0,04 | 2,04 | 3,27 | 12,81 | 3,6169 | 0,0761 | |||
| WM / Waste Management, Inc. | 0,01 | 1,51 | 2,53 | 0,32 | 2,8018 | -0,2818 | |||
| META / Meta Platforms, Inc. | 0,00 | 5,36 | 2,44 | 34,90 | 2,6957 | 0,4897 | |||
| WMT / Walmart Inc. | 0,02 | 2,82 | 2,30 | 14,52 | 2,5493 | 0,0912 | |||
| PG / The Procter & Gamble Company | 0,01 | 0,04 | 1,99 | -6,50 | 2,1977 | -0,3972 | |||
| GOOG / Alphabet Inc. | 0,01 | 7,17 | 1,98 | 21,68 | 2,1931 | 0,2030 | |||
| QQQ / Invesco QQQ Trust, Series 1 | 0,00 | 23,42 | 1,92 | 45,21 | 2,1301 | 0,5100 | |||
| CRWD / CrowdStrike Holdings, Inc. | 0,00 | -5,17 | 1,47 | 36,97 | 1,6245 | 0,3150 | |||
| LNG / Cheniere Energy, Inc. | 0,01 | -0,59 | 1,40 | 4,65 | 1,5453 | -0,0858 | |||
| DIS / The Walt Disney Company | 0,01 | -1,01 | 1,28 | 24,44 | 1,4204 | 0,1593 | |||
| CRM / Salesforce, Inc. | 0,00 | 0,02 | 1,14 | 1,61 | 1,2602 | -0,1092 | |||
| LLY / Eli Lilly and Company | 0,00 | 15,26 | 1,12 | 8,70 | 1,2449 | -0,0188 | |||
| NSC / Norfolk Southern Corporation | 0,00 | 0,00 | 1,07 | 8,00 | 1,1806 | -0,0257 | |||
| VTI / Vanguard Index Funds - Vanguard Total Stock Market ETF | 0,00 | 1,04 | 0,94 | 11,73 | 1,0437 | 0,0122 | |||
| QQQM / Invesco Exchange-Traded Fund Trust II - Invesco NASDAQ 100 ETF | 0,00 | 1,49 | 0,90 | 19,33 | 0,9913 | 0,0746 | |||
| JNJ / Johnson & Johnson | 0,01 | -3,80 | 0,87 | -11,36 | 0,9587 | -0,2361 | |||
| LOW / Lowe's Companies, Inc. | 0,00 | -1,30 | 0,84 | -6,15 | 0,9295 | -0,1637 | |||
| KO / The Coca-Cola Company | 0,01 | 0,13 | 0,81 | -1,10 | 0,8942 | -0,1040 | |||
| HD / The Home Depot, Inc. | 0,00 | -0,24 | 0,77 | -0,26 | 0,8539 | -0,0908 | |||
| SPMD / SPDR Series Trust - SPDR Portfolio S&P 400 Mid Cap ETF | 0,01 | -0,36 | 0,75 | 5,81 | 0,8278 | -0,0356 | |||
| SPSM / SPDR Series Trust - SPDR Portfolio S&P 600 Small Cap ETF | 0,02 | -0,81 | 0,73 | 3,70 | 0,8069 | -0,0526 | |||
| XSMO / Invesco Exchange-Traded Fund Trust - Invesco S&P SmallCap Momentum ETF | 0,01 | -1,70 | 0,73 | 6,45 | 0,8044 | -0,0292 | |||
| BND / Vanguard Bond Index Funds - Vanguard Total Bond Market ETF | 0,01 | 29,53 | 0,67 | 29,90 | 0,7413 | 0,1109 | |||
| COHR / Coherent Corp. | 0,01 | -1,32 | 0,67 | 35,44 | 0,7366 | 0,1366 | |||
| VYM / Vanguard Whitehall Funds - Vanguard High Dividend Yield ETF | 0,00 | 0,02 | 0,64 | 3,38 | 0,7126 | -0,0485 | |||
| MCD / McDonald's Corporation | 0,00 | 0,09 | 0,64 | -6,31 | 0,7067 | -0,1266 | |||
| UNP / Union Pacific Corporation | 0,00 | 0,00 | 0,63 | -2,63 | 0,6976 | -0,0934 | |||
| XOM / Exxon Mobil Corporation | 0,01 | 0,77 | 0,62 | -8,69 | 0,6864 | -0,1435 | |||
| FHN / First Horizon Corporation | 0,03 | 0,08 | 0,60 | 9,11 | 0,6640 | -0,0071 | |||
| EMN / Eastman Chemical Company | 0,01 | 2,95 | 0,59 | -12,89 | 0,6517 | -0,1733 | |||
| VZ / Verizon Communications Inc. | 0,01 | 0,00 | 0,59 | -4,71 | 0,6504 | -0,1025 | |||
| SCHD / Schwab Strategic Trust - Schwab U.S. Dividend Equity ETF | 0,02 | 0,00 | 0,57 | -5,16 | 0,6313 | -0,1042 | |||
| ABBV / AbbVie Inc. | 0,00 | 0,33 | 0,57 | -10,99 | 0,6276 | -0,1521 | |||
| MPC / Marathon Petroleum Corporation | 0,00 | 0,00 | 0,52 | 14,07 | 0,5750 | 0,0181 | |||
| DLR / Digital Realty Trust, Inc. | 0,00 | -1,65 | 0,52 | 19,63 | 0,5738 | 0,0442 | |||
| NOC / Northrop Grumman Corporation | 0,00 | 20,78 | 0,51 | 17,87 | 0,5627 | 0,0359 | |||
| PHM / PulteGroup, Inc. | 0,00 | -4,08 | 0,50 | -1,59 | 0,5486 | -0,0670 | |||
| SOFI / SoFi Technologies, Inc. | 0,03 | -20,24 | 0,46 | 25,07 | 0,5084 | 0,0589 | |||
| DUK / Duke Energy Corporation | 0,00 | 0,00 | 0,42 | -3,25 | 0,4616 | -0,0653 | |||
| ECL / Ecolab Inc. | 0,00 | 0,00 | 0,39 | 6,54 | 0,4328 | -0,0168 | |||
| ET / Energy Transfer LP - Limited Partnership | 0,02 | 0,00 | 0,39 | -2,51 | 0,4299 | -0,0569 | |||
| TSLA / Tesla, Inc. | 0,00 | 4,92 | 0,37 | 28,28 | 0,4127 | 0,0583 | |||
| GOOGL / Alphabet Inc. | 0,00 | 0,00 | 0,37 | 14,15 | 0,4111 | 0,0128 | |||
| VYMI / Vanguard Whitehall Funds - Vanguard International High Dividend Yield ETF | 0,00 | 0,00 | 0,37 | 8,53 | 0,4091 | -0,0064 | |||
| XLK / The Select Sector SPDR Trust - The Technology Select Sector SPDR Fund | 0,00 | 0,35 | 0,36 | 23,13 | 0,4010 | 0,0412 | |||
| TFC / Truist Financial Corporation | 0,01 | 6,48 | 0,35 | 11,04 | 0,3907 | 0,0029 | |||
| SBUX / Starbucks Corporation | 0,00 | -15,87 | 0,34 | -21,51 | 0,3805 | -0,1541 | |||
| RF / Regions Financial Corporation | 0,01 | 0,11 | 0,34 | 8,28 | 0,3766 | -0,0072 | |||
| USHY / iShares Trust - iShares Broad USD High Yield Corporate Bond ETF | 0,01 | 0,00 | 0,32 | 1,92 | 0,3529 | -0,0295 | |||
| DIA / SPDR Dow Jones Industrial Average ETF Trust | 0,00 | 2,18 | 0,31 | 7,29 | 0,3428 | -0,0102 | |||
| MSTR / Strategy Inc | 0,00 | 0,31 | 0,3409 | 0,3409 | |||||
| UNH / UnitedHealth Group Incorporated | 0,00 | 0,00 | 0,31 | -40,43 | 0,3377 | -0,2883 | |||
| IWF / iShares Trust - iShares Russell 1000 Growth ETF | 0,00 | 0,00 | 0,29 | 17,60 | 0,3261 | 0,0199 | |||
| PLTR / Palantir Technologies Inc. | 0,00 | 0,29 | 0,3221 | 0,3221 | |||||
| CNC / Centene Corporation | 0,01 | 0,00 | 0,28 | -10,58 | 0,3088 | -0,0726 | |||
| KR / The Kroger Co. | 0,00 | -1,03 | 0,28 | 4,96 | 0,3052 | -0,0161 | |||
| ELV / Elevance Health, Inc. | 0,00 | 0,15 | 0,27 | -10,44 | 0,2949 | -0,0688 | |||
| TJX / The TJX Companies, Inc. | 0,00 | 0,28 | 0,26 | 1,95 | 0,2903 | -0,0250 | |||
| CAT / Caterpillar Inc. | 0,00 | 0,00 | 0,25 | 17,59 | 0,2818 | 0,0174 | |||
| COST / Costco Wholesale Corporation | 0,00 | 0,00 | 0,25 | 4,56 | 0,2794 | -0,0154 | |||
| FDX / FedEx Corporation | 0,00 | 0,00 | 0,25 | -6,72 | 0,2767 | -0,0510 | |||
| SLV / iShares Silver Trust | 0,01 | -0,35 | 0,23 | 5,45 | 0,2578 | -0,0120 | |||
| SO / The Southern Company | 0,00 | 0,00 | 0,22 | -0,44 | 0,2490 | -0,0263 | |||
| TOWN / TowneBank | 0,01 | 0,00 | 0,21 | 0,00 | 0,2270 | -0,0237 | |||
| T / AT&T Inc. | 0,01 | 0,20 | 0,2240 | 0,2240 |