Grundlæggende statistik
| Institutionelle aktier (lange) | 198.159.341 - 105,36% (ex 13D/G) - change of -48,10MM shares -19,53% MRQ |
| Institutionel værdi (lang) | $ 9.850.759 USD ($1000) |
Institutionelt ejerskab og aktionærer
Core & Main, Inc. (US:CNM) har 450 institutionelle ejere og aktionærer, der har indsendt 13D/G- eller 13F-formularer til Securities Exchange Commission (SEC). Disse institutioner har i alt 198,159,341 aktier. Største aktionærer omfatter BlackRock, Inc., Vanguard Group Inc, Morgan Stanley, Select Equity Group, L.P., Pictet Asset Management Holding SA, Fmr Llc, Capital World Investors, State Street Corp, Royal London Asset Management Ltd, and First Trust Advisors Lp .
Core & Main, Inc. (NYSE:CNM) institutionel ejerskabsstruktur viser aktuelle positioner i virksomheden efter institutioner og fonde, samt seneste ændringer i positionsstørrelse. Større aktionærer kan omfatte individuelle investorer, investeringsforeninger, hedgefonde eller institutioner. Skema 13D angiver, at investoren besidder (eller besidder) mere end 5 % af virksomheden og har til hensigt (eller har til hensigt at) aktivt at forfølge en ændring i forretningsstrategi. Skema 13G indikerer en passiv investering på over 5%.
The share price as of April 17, 2026 is 50,79 / share. Previously, on April 21, 2025, the share price was 48,15 / share. This represents an increase of 5,48% over that period.

Fondens stemningsscore
Fund Sentiment Score (fka Ownership Accumulation Score) finder de aktier, der bliver mest købt af fonde. Det er resultatet af en sofistikeret, multi-faktor kvantitativ model, der identificerer virksomheder med de højeste niveauer af institutionel akkumulering. Scoringsmodellen bruger en kombination af den samlede stigning i oplyste ejere, ændringerne i porteføljeallokeringer i disse ejere og andre målinger. Tallet går fra 0 til 100, hvor højere tal indikerer et højere niveau af akkumulering for sine jævnaldrende, og 50 er gennemsnittet.
Opdateringsfrekvens: Dagligt
Se Ownership Explorer, som giver en liste over højest rangerende virksomheder.
AI+ Ask Fintel’s AI assistant about Core & Main, Inc..
Select a question to share a public post with an AI-crafted answer.
Thinking of good questions…
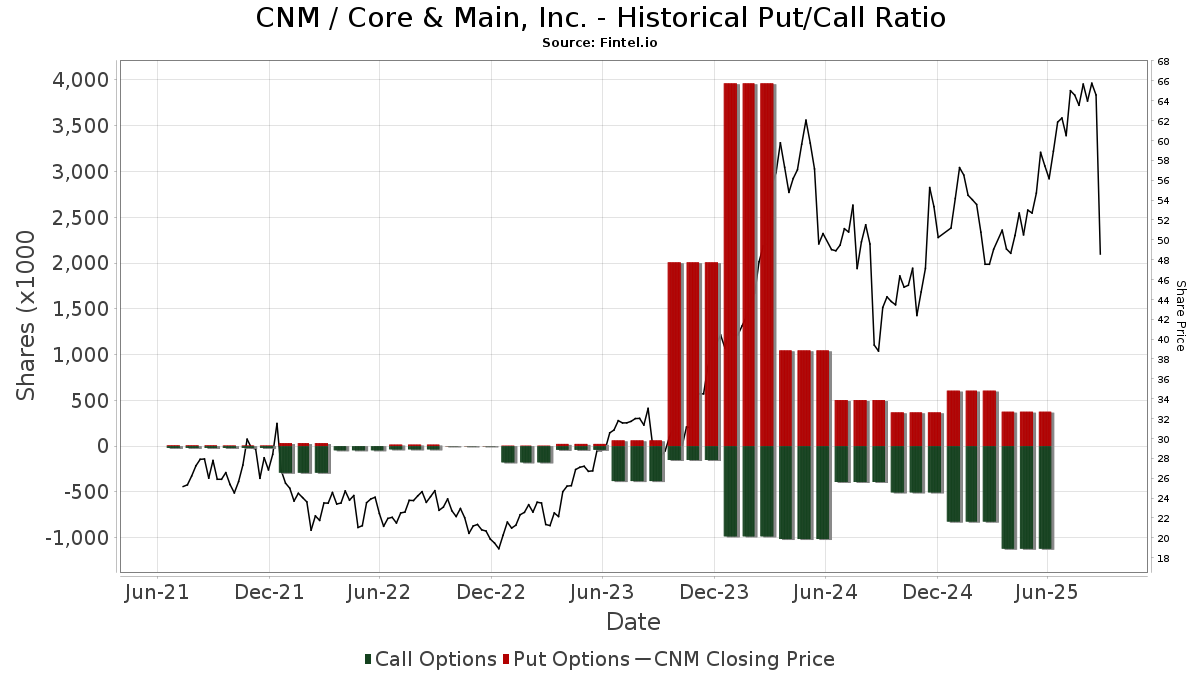
Institutionel Put/Call-forhold
Ud over at indberette standardaktie- og gældsudstedelser skal institutter med mere end 100 mill. aktiver under forvaltning også oplyse deres put- og call-optionsbeholdninger. Da salgsoptioner generelt indikerer negativ stemning, og købsoptioner indikerer positiv stemning, kan vi få en fornemmelse af den overordnede institutionelle stemning ved at plotte forholdet mellem put og kald. Diagrammet til højre viser det historiske put/call-forhold for dette instrument.
Brug af Put/Call Ratio som en indikator for investorernes stemning overvinder en af de vigtigste mangler ved at bruge totalt institutionelt ejerskab, som er, at en betydelig mængde af aktiver under forvaltning investeres passivt for at spore indekser. Passivt forvaltede fonde køber typisk ikke optioner, så indikatoren for put/call-forholdet følger mere nøje følelsen af aktivt forvaltede fonde.
13D/G-arkivering
Vi præsenterer 13D/G ansøgninger separat fra 13F ansøgninger på grund af den forskellige behandling af SEC. 13D/G-ansøgninger kan indgives af grupper af investorer (med én ledende), hvorimod 13F-ansøgninger ikke kan. Dette resulterer i situationer, hvor en investor kan indsende en 13D/G, der rapporterer én værdi for de samlede aktier (der repræsenterer alle de aktier, der ejes af investorgruppen), men derefter indsender en 13F, der rapporterer en anden værdi for de samlede aktier (der udelukkende repræsenterer deres egne) ejendomsret). Det betyder, at aktieejerskab af 13D/G-arkiver og 13F-arkiveringer ofte ikke er direkte sammenlignelige, så vi præsenterer dem separat.
Bemærk: Fra den 16. maj 2021 viser vi ikke længere ejere, der ikke har indsendt en 13D/G inden for det seneste år. Tidligere viste vi den fulde historie af 13D/G-arkiver. Generelt skal enheder, der er forpligtet til at indgive 13D/G-ansøgninger, indgive mindst årligt, før de indsender en afsluttende ansøgning. Dog forlader fonde nogle gange positioner uden at indsende en afsluttende ansøgning (dvs. de afvikler), så visning af den fulde historie resulterede nogle gange i forvirring om det nuværende ejerskab. For at undgå forvirring viser vi nu kun 'aktuelle' ejere - det vil sige - ejere, der har anmeldt inden for det seneste år.
Upgrade to unlock premium data.
| Fil dato | Form | Investor | Forrige Aktier |
Seneste Aktier |
Δ Aktier (Procent) |
Ejendomsret (Procent) |
Δ Ejerskab (Procent) |
|
|---|---|---|---|---|---|---|---|---|
| 2026-04-07 | BlackRock, Inc. | 18,974,773 | 18,990,291 | 0.08 | 10.10 | 1.00 | ||
| 2026-03-26 | VANGUARD GROUP INC | 17,998,027 | 0 | -100.00 | 0.00 | -100.00 | ||
| 2026-02-17 | Select Equity Group, L.P. | 9,692,506 | 7,778,376 | -19.75 | 4.10 | -19.61 | ||
| 2025-11-07 | MORGAN STANLEY | 15,200,309 | 12,469,881 | -17.96 | 6.50 | -18.75 |
13F og NPORT arkivering
Detaljer om 13F-arkivering er gratis. Detaljer om NP-ansøgninger kræver et premium-medlemskab. Grønne rækker angiver nye positioner. Røde rækker angiver lukkede positioner. Klik på linket ikon for at se den fulde transaktionshistorik.
Opgrader
for at låse premium-data op og eksportere til Excel ![]() .
.
| Fil dato | Kilde | Investor | Type | Gennemsnitlig pris (Øst) |
Aktier | Δ Aktier (%) |
Rapporteret Værdi ($1000) |
Δ Værdi (%) |
Port Alloc (%) |
|
|---|---|---|---|---|---|---|---|---|---|---|
| 2026-02-12 | 13F | MetLife Investment Management, LLC | 98.474 | -4,11 | 5.118 | -7,43 | ||||
| 2026-01-12 | 13F | Rialto Wealth Management, LLC | 12 | 140,00 | 1 | |||||
| 2026-02-02 | 13F | Danske Bank A/s | 1.700 | -92,23 | 88 | -92,52 | ||||
| 2026-02-12 | 13F | Intrinsic Edge Capital Management LLC | 0 | -100,00 | 0 | |||||
| 2026-02-10 | 13F | Regency Capital Management Inc.\DE | 28.675 | 57,38 | 1.490 | 52,04 | ||||
| 2026-02-09 | 13F | Huntington National Bank | 253 | -10,28 | 13 | -13,33 | ||||
| 2025-10-30 | 13F | Twin Peaks Wealth Advisors, LLC | 0 | -100,00 | 0 | -100,00 | ||||
| 2026-02-17 | 13F | Royal Bank Of Canada | 205.354 | -60,46 | 10.673 | -61,82 | ||||
| 2026-01-21 | 13F | First United Bank Trust/ | 0 | -100,00 | 0 | |||||
| 2026-02-04 | 13F | Blackhawk Capital Partners LLC. | 0 | -100,00 | 0 | |||||
| 2025-11-13 | 13F | Renaissance Technologies Llc | 0 | -100,00 | 0 | -100,00 | ||||
| 2025-11-06 | 13F | Blume Capital Management, Inc. | 0 | -100,00 | 0 | -100,00 | ||||
| 2026-02-09 | 13F | Quest Partners LLC | 3.651 | 106,62 | 190 | 98,95 | ||||
| 2026-02-17 | 13F | D1 Capital Partners L.P. | 2.647.789 | -48,85 | 137.606 | -50,62 | ||||
| 2026-02-09 | 13F | Nia Impact Advisors, Llc | 67.385 | 1,43 | 3.502 | -2,07 | ||||
| 2026-02-13 | 13F | Dynamic Technology Lab Private Ltd | 17.330 | 901 | ||||||
| 2026-01-27 | 13F | Zurcher Kantonalbank (Zurich Cantonalbank) | 360.404 | -76,26 | 18.730 | -77,08 | ||||
| 2026-02-12 | 13F | Fox Hill Wealth Management | 53.848 | 2.798 | ||||||
| 2026-01-27 | 13F | First Horizon Corp | 30 | -77,61 | 2 | -85,71 | ||||
| 2026-02-11 | 13F | Manchester Capital Management LLC | 3 | 0 | ||||||
| 2026-02-09 | 13F | Legal & General Group Plc | 572.239 | -1,16 | 29.739 | -4,58 | ||||
| 2026-02-12 | 13F | Tribune Investment Group LP | 0 | -100,00 | 0 | |||||
| 2026-02-13 | 13F | Cornerstone Financial Management LLC | 17 | 1 | ||||||
| 2026-02-05 | 13F | IMG Wealth Management, Inc. | 0 | -100,00 | 0 | |||||
| 2026-02-04 | 13F | Versor Investments LP | 17.073 | 887 | ||||||
| 2026-02-13 | 13F | Transamerica Financial Advisors, Inc. | 1 | 0 | ||||||
| 2026-02-06 | 13F | Tortoise Investment Management, LLC | 0 | -100,00 | 0 | |||||
| 2026-02-17 | 13F | Captrust Financial Advisors | 47.868 | 0,09 | 2.488 | -3,38 | ||||
| 2026-04-09 | 13F | Wedmont Private Capital | 5.636 | 29,65 | 290 | 25,11 | ||||
| 2026-02-13 | 13F | Wells Fargo & Company/mn | 99.575 | -38,81 | 5.175 | -40,93 | ||||
| 2026-02-13 | 13F | Fiduciary Trust Co | 8.141 | -8,74 | 423 | -11,87 | ||||
| 2026-02-17 | 13F | Raymond James Financial Inc | 1.783.112 | -5,39 | 93.959 | -7,39 | ||||
| 2026-04-08 | 13F | DiNuzzo Private Wealth, Inc. | 28 | 0,00 | 1 | 0,00 | ||||
| 2026-02-13 | 13F | National Bank Of Canada /fi/ | 15.099 | 21,36 | 785 | 17,19 | ||||
| 2026-02-03 | 13F | Enhancing Capital LLC | 36.327 | 11,20 | 1.888 | 7,34 | ||||
| 2026-02-13 | 13F | MAI Capital Management | 479 | 1,27 | 25 | -4,00 | ||||
| 2026-02-06 | 13F | HighTower Advisors, LLC | 11.607 | -2,14 | 603 | -5,49 | ||||
| 2026-02-06 | 13F | EverSource Wealth Advisors, LLC | 1.679 | 376,99 | 87 | 383,33 | ||||
| 2026-02-10 | 13F | Clear Harbor Asset Management, LLC | 211.496 | -3,54 | 10.991 | -6,87 | ||||
| 2026-02-13 | 13F | Walleye Capital LLC | Put | 16.300 | 847 | |||||
| 2026-01-09 | 13F | Assenagon Asset Management S.A. | 52.963 | 881,89 | 2.752 | 848,97 | ||||
| 2026-02-09 | 13F | Keating Financial Advisory Services, Inc. | 183 | 10 | ||||||
| 2026-01-29 | 13F | Montrusco Bolton Investments Inc. | 171.615 | 2,39 | 8.919 | -1,15 | ||||
| 2026-02-13 | 13F | Walleye Capital LLC | Call | 15.800 | 5.166,67 | 821 | 5.031,25 | |||
| 2026-02-13 | 13F | Rhumbline Advisers | 502.389 | -1,97 | 26.109 | -5,36 | ||||
| 2026-02-17 | 13F | Trexquant Investment LP | 64.063 | 3.329 | ||||||
| 2026-04-06 | 13F | GAMMA Investing LLC | 4.794 | 1,74 | 237 | -3,28 | ||||
| 2026-04-17 | 13F | Bell Investment Advisors, Inc | 106 | 0,00 | 5 | 0,00 | ||||
| 2026-02-02 | 13F | Fifth Third Bancorp | 7.835 | -5,77 | 407 | -8,95 | ||||
| 2026-02-18 | 13F | Vident Advisory, LLC | 27.151 | 230,87 | 1.411 | 219,95 | ||||
| 2026-02-17 | 13F | Glenmede Trust Co Na | 0 | -100,00 | 0 | |||||
| 2026-02-02 | 13F | Horizon Investments, LLC | 34.196 | 1.777 | ||||||
| 2026-01-29 | 13F | UBS Group AG | Call | 0 | -100,00 | 0 | -100,00 | |||
| 2026-02-13 | 13F | Soros Fund Management Llc | 434.454 | 22.579 | ||||||
| 2026-02-13 | 13F | Lord, Abbett & Co. Llc | 0 | -100,00 | 0 | |||||
| 2026-01-26 | 13F | Duff & Phelps Investment Management Co | 357.052 | 5,98 | 18.556 | 2,32 | ||||
| 2025-11-12 | 13F | CIBC Bancorp USA Inc. | 12.567 | 676 | ||||||
| 2026-02-12 | 13F | Colonial Trust Advisors | 50 | 0,00 | 3 | 0,00 | ||||
| 2026-02-13 | 13F | Dockside LLC | 5.302 | 276 | ||||||
| 2026-04-14 | 13F | Nbc Securities, Inc. | 0 | -100,00 | 0 | |||||
| 2026-02-11 | 13F | Jpmorgan Chase & Co | 1.865.756 | -9,01 | 96.963 | -12,16 | ||||
| 2026-02-13 | 13F | Southeast Asset Advisors Inc. | 0 | -100,00 | 0 | |||||
| 2026-04-14 | 13F | Bay Harbor Wealth Management, LLC | 20 | 53,85 | 1 | |||||
| 2026-01-21 | 13F | SJS Investment Consulting Inc. | 16 | -11,11 | 1 | |||||
| 2026-02-10 | 13F | Bridges Investment Management Inc | 4.839 | 251 | ||||||
| 2026-02-12 | 13F | Rossby Financial, LCC | 37 | 2 | ||||||
| 2026-02-02 | 13F | Truist Financial Corp | 917.412 | 0,81 | 47.678 | -2,68 | ||||
| 2026-02-13 | 13F | Alamea Verwaltungs GmbH | 8.083 | 95,95 | 431 | 94,14 | ||||
| 2026-02-13 | 13F | Pinnacle Wealth Planning Services, Inc. | 25 | 1 | ||||||
| 2026-02-12 | 13F | Distillate Capital Partners LLC | 4 | 0 | ||||||
| 2026-02-11 | 13F | Franklin Resources Inc | 17.490 | 183,10 | 909 | 173,49 | ||||
| 2026-02-17 | 13F | Dark Forest Capital Management Lp | 5.834 | 303 | ||||||
| 2026-02-17 | 13F | SummitTX Capital, L.P. | 75.936 | 377,95 | 3.946 | 361,52 | ||||
| 2026-02-17 | 13F | Driehaus Capital Management Llc | 0 | -100,00 | 0 | |||||
| 2026-02-05 | 13F | Northwestern Mutual Investment Management Company, Llc | 42.664 | 0,92 | 2.217 | -2,55 | ||||
| 2026-02-13 | 13F | Landscape Capital Management, L.l.c. | 0 | -100,00 | 0 | |||||
| 2026-01-29 | 13F | Quent Capital, LLC | 117 | 0,00 | 6 | 0,00 | ||||
| 2026-02-11 | 13F | CLARET ASSET MANAGEMENT Corp | 0 | -100,00 | 0 | |||||
| 2026-01-29 | 13F | Pictet Asset Management Holding SA | 7.441.427 | -10,65 | 386.782 | -13,73 | ||||
| 2026-02-17 | 13F | Advisory Services Network, LLC | 0 | -100,00 | 0 | |||||
| 2026-02-12 | 13F | Raiffeisen Bank International AG | 25.000 | -94,97 | 1.322 | -95,04 | ||||
| 2026-04-15 | 13F | Activest Wealth Management | 3 | 0 | ||||||
| 2026-02-18 | 13F | Mackenzie Financial Corp | 769.524 | 0,45 | 40.597 | -1,55 | ||||
| 2026-02-03 | 13F | Chesapeake Capital Corp /il/ | 0 | -100,00 | 0 | |||||
| 2026-02-17 | 13F | Caption Management, LLC | Call | 0 | -100,00 | 0 | ||||
| 2025-12-09 | 13F/A | Tudor Investment Corp Et Al | Call | 7.500 | 404 | |||||
| 2026-02-13 | 13F | Atlas Capital Advisors Llc | 2.231 | -8,08 | 116 | -21,23 | ||||
| 2026-02-17 | 13F | Interval Partners, LP | 1.228.528 | -29,76 | 63.847 | -32,19 | ||||
| 2026-04-10 | 13F/A | OP Asset Management Ltd | 17.643 | 872 | ||||||
| 2026-01-23 | 13F | Avion Wealth | 6 | 0,00 | 0 | |||||
| 2026-02-11 | 13F | United Financial Planning Group LLC | 9 | 0 | ||||||
| 2026-02-17 | 13F | Nomura Holdings Inc | 0 | -100,00 | 0 | |||||
| 2026-04-14 | 13F | Perpetual Ltd | 223.976 | 1,57 | 11.064 | -3,46 | ||||
| 2026-02-12 | 13F | Granite Investment Partners, LLC | 5.103 | -83,50 | 265 | -84,08 | ||||
| 2026-02-17 | 13F | DZ BANK AG Deutsche Zentral Genossenschafts Bank, Frankfurt am Main | 0 | -100,00 | 0 | |||||
| 2025-11-14 | 13F | Sherbrooke Park Advisers Llc | 0 | -100,00 | 0 | -100,00 | ||||
| 2026-02-11 | 13F | Winton Capital Group Ltd | 33.015 | 177,39 | 1.716 | 167,97 | ||||
| 2026-02-17 | 13F | Fmr Llc | 6.354.620 | 2,15 | 330.250 | -1,38 | ||||
| 2026-02-17 | 13F | Ameriprise Financial Inc | 212.613 | 19,45 | 11.049 | 15,32 | ||||
| 2026-02-12 | 13F | Advisors Asset Management, Inc. | 8.286 | -55,72 | 431 | -57,30 | ||||
| 2026-04-07 | 13F | Farther Finance Advisors, LLC | 1.590 | 12,69 | 81 | 10,96 | ||||
| 2026-02-11 | 13F | J.Safra Asset Management Corp | 37 | 0,00 | 2 | 0,00 | ||||
| 2026-02-12 | 13F | Bank Of Montreal /can/ | 15.022 | -18,72 | 781 | -21,53 | ||||
| 2026-02-17 | 13F | Shelton Capital Management | 6.325 | -5,78 | 329 | -9,14 | ||||
| 2025-11-14 | 13F | Cinctive Capital Management LP | 0 | -100,00 | 0 | -100,00 | ||||
| 2026-02-04 | 13F | Virginia Retirement Systems Et Al | 39.250 | 2.040 | ||||||
| 2026-02-04 | 13F | KLCM Advisors, Inc. | 4.000 | -25,93 | 208 | -28,62 | ||||
| 2025-11-14 | 13F | Jain Global LLC | 0 | -100,00 | 0 | -100,00 | ||||
| 2026-02-13 | 13F | Kestra Advisory Services, LLC | 1.421 | 74 | ||||||
| 2026-01-28 | 13F | Quaker Wealth Management, LLC | 0 | -100,00 | 0 | |||||
| 2026-02-17 | 13F | Price T Rowe Associates Inc /md/ | 328.593 | 4,34 | 17 | 6,25 | ||||
| 2026-02-13 | 13F | Neuberger Berman Group LLC | 118.483 | -7,41 | 6.158 | -10,61 | ||||
| 2026-02-13 | 13F | Police & Firemen's Retirement System of New Jersey | 79.718 | -5,25 | 4.143 | -8,52 | ||||
| 2025-11-14 | 13F | Ellevest, Inc. | 0 | -100,00 | 0 | -100,00 | ||||
| 2025-11-13 | 13F | Quantitative Investment Management, LLC | 0 | -100,00 | 0 | |||||
| 2026-02-06 | 13F | Covestor Ltd | 1.913 | 30,76 | 0 | |||||
| 2025-11-14 | 13F | Towarzystwo Funduszy Inwestycyjnych Pzu Sa | 0 | -100,00 | 0 | -100,00 | ||||
| 2026-02-17 | 13F | Signature Equity Partners, LLC | 7 | 0 | ||||||
| 2026-02-13 | 13F | Wexford Capital Lp | 411 | 11,38 | 21 | 10,53 | ||||
| 2026-02-13 | 13F | Toroso Investments, LLC | 220.601 | -5,31 | 11.465 | -8,59 | ||||
| 2026-01-30 | 13F | New York State Teachers Retirement System | 106.167 | 1,67 | 6 | 0,00 | ||||
| 2026-02-17 | 13F | DV Trading LLC | 99 | 5 | ||||||
| 2026-01-29 | 13F | State Of Michigan Retirement System | 45.100 | -0,22 | 2.344 | -3,70 | ||||
| 2026-02-17 | 13F | Advisor Group Holdings, Inc. | 2.889 | -33,43 | 150 | -37,76 | ||||
| 2026-02-13 | 13F | SRS Capital Advisors, Inc. | 281 | -60,59 | 15 | -63,16 | ||||
| 2026-02-13 | 13F | Kennedy Capital Management, Inc. | 152.943 | -2,14 | 7.948 | -5,53 | ||||
| 2026-02-13 | 13F | Trigran Investments, Inc. | 84.661 | 275,85 | 4.400 | 262,95 | ||||
| 2026-02-06 | 13F | Pnc Financial Services Group, Inc. | 8.231 | 20,97 | 428 | 16,67 | ||||
| 2026-01-30 | 13F | Mitsubishi UFJ Trust & Banking Corp | 3.931 | 204 | ||||||
| 2026-02-05 | 13F | Allworth Financial LP | 11.453 | 10,65 | 595 | 6,82 | ||||
| 2025-11-13 | 13F | Quadrature Capital Ltd | 0 | -100,00 | 0 | |||||
| 2026-02-17 | 13F | Maryland State Retirement & Pension System | 8.967 | 0,00 | 466 | -3,32 | ||||
| 2026-02-17 | 13F | California State Teachers Retirement System | 179.884 | 1,04 | 9.349 | -2,45 | ||||
| 2026-02-12 | 13F | Moneta Group Investment Advisors Llc | 6.482 | 0,14 | 337 | -3,45 | ||||
| 2026-01-29 | 13F | Comerica Bank | 63.413 | -4,02 | 3.296 | -7,34 | ||||
| 2026-02-13 | 13F | Johnson Investment Counsel Inc | 0 | -100,00 | 0 | |||||
| 2026-01-26 | 13F | Border to Coast Pensions Partnership Ltd | 0 | -100,00 | 0 | |||||
| 2026-02-09 | 13F | Harbour Investments, Inc. | 5 | 0,00 | 0 | |||||
| 2026-02-06 | 13F | Handelsbanken Fonder AB | 1.426.831 | -49,94 | 74 | -51,63 | ||||
| 2026-02-10 | 13F | Principia Wealth Advisory, LLC | 0 | -100,00 | 0 | |||||
| 2026-02-13 | 13F | Mirova | 0 | -100,00 | 0 | |||||
| 2026-04-08 | 13F | Wealth Enhancement Advisory Services, Llc | 16.986 | 161,16 | 865 | 139,61 | ||||
| 2026-01-23 | 13F | Nbt Bank N A /ny | 1.723 | 2,68 | 90 | -1,11 | ||||
| 2026-02-13 | 13F | Itau Unibanco Holding S.A. | 126 | 15,60 | 7 | 20,00 | ||||
| 2026-02-09 | 13F | Jefferies Financial Group Inc. | Call | 35.000 | -41,67 | 1.819 | -43,70 | |||
| 2026-04-17 | 13F | Vermillion Wealth Management, Inc. | 13 | 1 | ||||||
| 2026-02-09 | 13F | Jefferies Financial Group Inc. | 10.822 | -51,90 | 562 | -53,59 | ||||
| 2026-02-12 | 13F | Wealthspire Advisors, LLC | 0 | -100,00 | 0 | |||||
| 2026-02-11 | 13F | SOUTH STATE Corp | 0 | -100,00 | 0 | |||||
| 2026-02-09 | 13F/A | Fideuram - Intesa Sanpaolo Private Banking S.p.a. | 61.638 | 3.203 | ||||||
| 2026-02-05 | 13F | HFM Investment Advisors, LLC | 7 | -36,36 | 0 | |||||
| 2025-11-14 | 13F | Riposte Capital Llc | 0 | -100,00 | 0 | |||||
| 2026-04-16 | 13F | Trium Capital LLP | 0 | -100,00 | 0 | |||||
| 2026-02-17 | 13F | ISAM Funds (UK) Ltd | 6.078 | 316 | ||||||
| 2026-02-17 | 13F | Alliancebernstein L.p. | 1.790.499 | -0,31 | 93.052 | -3,76 | ||||
| 2025-11-14 | 13F | Sig Brokerage, Lp | 0 | -100,00 | 0 | -100,00 | ||||
| 2026-02-17 | 13F | Schonfeld Strategic Advisors LLC | 487.809 | -64,65 | 25.351 | -65,87 | ||||
| 2026-02-06 | 13F | Larson Financial Group LLC | 246 | -3,15 | 13 | -7,69 | ||||
| 2026-02-11 | 13F | Parallel Advisors, LLC | 550 | -7,72 | 29 | -12,50 | ||||
| 2026-02-17 | 13F | Janus Henderson Group Plc | 4.623.727 | -10,36 | 240.273 | -13,46 | ||||
| 2026-02-13 | 13F | Hill City Capital, LP | 797.000 | 2,77 | 41.420 | -0,78 | ||||
| 2026-02-13 | 13F | Pathstone Holdings, LLC | 26.374 | 12,85 | 1.371 | 8,90 | ||||
| 2026-02-17 | 13F | Sagefield Capital LP | 0 | -100,00 | 0 | -100,00 | ||||
| 2026-02-17 | 13F | Kingdon Capital Management, L.l.c. | 0 | -100,00 | 0 | |||||
| 2026-02-04 | 13F | Madison Asset Management, LLC | 116.796 | 0,67 | 6.070 | -2,82 | ||||
| 2026-02-11 | 13F | BLI - Banque de Luxembourg Investments | 224.400 | -19,77 | 11.866 | -20,96 | ||||
| 2026-02-02 | 13F | Strs Ohio | 4.547 | 0,18 | 236 | -3,28 | ||||
| 2026-04-07 | 13F | CoreCap Advisors, LLC | 59 | 0,00 | 3 | -33,33 | ||||
| 2026-02-04 | 13F | Wsfs Capital Management, Llc | 6.476 | 337 | ||||||
| 2026-02-10 | 13F | New Mexico Educational Retirement Board | 39.600 | 0,00 | 2 | 0,00 | ||||
| 2026-01-21 | 13F | Yousif Capital Management, Llc | 60.919 | -1,18 | 3.464 | 4,37 | ||||
| 2026-02-02 | 13F | Wolverine Asset Management Llc | 0 | -100,00 | 0 | |||||
| 2026-02-03 | 13F | Ethic Inc. | 15.012 | -21,07 | 780 | -23,75 | ||||
| 2026-02-17 | 13F | Samlyn Capital, Llc | 2.841.675 | 6,80 | 147.682 | 3,11 | ||||
| 2026-02-09 | 13F | Atlantic Trust, LLC | 53 | -64,67 | 3 | -75,00 | ||||
| 2026-02-17 | 13F | Two Sigma Advisers, Lp | 0 | -100,00 | 0 | |||||
| 2026-02-17 | 13F | Capital Fund Management S.a. | Call | 24.100 | -24,21 | 1.252 | -26,83 | |||
| 2026-02-17 | 13F | Concentric Capital Strategies, LP | 199.632 | -12,63 | 10.375 | -15,65 | ||||
| 2026-02-17 | 13F | Holocene Advisors, LP | 1.524.113 | -18,58 | 79.208 | -21,39 | ||||
| 2026-02-17 | 13F | Xn Lp | 698.200 | 36.285 | ||||||
| 2025-11-14 | 13F | AXA Investment Managers S.A. | 141.546 | 7.619 | ||||||
| 2026-02-10 | 13F | Commonwealth Of Pennsylvania Public School Empls Retrmt Sys | 47.718 | -1,96 | 2.480 | -5,38 | ||||
| 2026-02-13 | 13F | Y-Intercept (Hong Kong) Ltd | 20.069 | 1.043 | ||||||
| 2025-11-14 | 13F | Skye Global Management LP | 0 | -100,00 | 0 | -100,00 | ||||
| 2026-02-13 | 13F | Citigroup Inc | 30.480 | -17,39 | 1.584 | -20,24 | ||||
| 2026-01-28 | 13F | Peregrine Capital Management Llc | 0 | -100,00 | 0 | |||||
| 2026-02-12 | 13F | Xponance, Inc. | 29.004 | -9,62 | 1.507 | -12,74 | ||||
| 2026-02-17 | 13F | Susquehanna Fundamental Investments, Llc | 27.894 | 1.450 | ||||||
| 2026-02-17 | 13F | Bayberry Capital Partners LP | 257.000 | 13.356 | ||||||
| 2026-02-17 | 13F | Credit Agricole S A | 4.566 | -21,48 | 237 | -24,28 | ||||
| 2026-02-17 | 13F | Summit Trail Advisors, Llc | 13.405 | -11,71 | 697 | -14,81 | ||||
| 2025-11-13 | 13F | Entropy Technologies, LP | 0 | -100,00 | 0 | |||||
| 2026-04-06 | 13F | CX Institutional | 56 | 0 | ||||||
| 2026-02-17 | 13F | Circumference Group LLC | 90.000 | 80,00 | 4.677 | 73,80 | ||||
| 2025-10-22 | 13F | Geneos Wealth Management Inc. | 0 | -100,00 | 0 | |||||
| 2026-04-06 | 13F | Versant Capital Management, Inc | 1.503 | 93,69 | 74 | 85,00 | ||||
| 2026-02-13 | 13F | Charles Schwab Investment Management Inc | 1.860.557 | 1,52 | 96.693 | -1,99 | ||||
| 2026-02-10 | 13F | Bank of New York Mellon Corp | 1.093.724 | -3,26 | 56.841 | -6,60 | ||||
| 2026-02-13 | 13F | Prudential Financial Inc | 10.012 | -42,42 | 520 | -44,39 | ||||
| 2026-02-12 | 13F | Dimensional Fund Advisors Lp | 2.508.945 | 8,63 | 130.406 | 4,90 | ||||
| 2026-02-23 | 13F | Mv Capital Management, Inc. | 1 | 0,00 | 0 | |||||
| 2026-02-17 | 13F | XTX Topco Ltd | 16.816 | 874 | ||||||
| 2026-01-21 | 13F | Clayton Financial Group LLC | 0 | -100,00 | 0 | |||||
| 2026-02-17 | 13F | GCM Grosvenor Holdings, LLC | 0 | -100,00 | 0 | |||||
| 2026-01-26 | 13F | Cwm, Llc | 856 | -20,30 | 0 | |||||
| 2026-02-17 | 13F | Polymer Capital Management (US) LLC | 19.400 | -50,37 | 1.008 | -52,09 | ||||
| 2026-02-12 | 13F | BlackRock, Inc. | 18.928.518 | -0,55 | 983.715 | -3,99 | ||||
| 2026-02-09 | 13F | PGGM Investments | 467.436 | 56,59 | 24 | 50,00 | ||||
| 2026-02-11 | 13F | Ameritas Investment Partners, Inc. | 47.522 | 2.470 | ||||||
| 2026-02-13 | 13F | Van Eck Associates Corp | 73.754 | 4 | ||||||
| 2026-02-11 | 13F | Rise Advisors, LLC | 0 | -100,00 | 0 | |||||
| 2025-11-13 | 13F | Inceptionr Llc | 0 | -100,00 | 0 | |||||
| 2026-02-02 | 13F | Caisse Des Depots Et Consignations | 0 | -100,00 | 0 | |||||
| 2026-02-09 | 13F | Geode Capital Management, Llc | 3.645.108 | 2,38 | 189.474 | -1,16 | ||||
| 2026-02-13 | 13F | Barclays Plc | 114.234 | -31,45 | 5.937 | -33,82 | ||||
| 2026-02-13 | 13F | Commerce Bank | 19.659 | 179,92 | 1.022 | 170,11 | ||||
| 2026-02-17 | 13F | Qube Research & Technologies Ltd | 348.219 | 18.097 | ||||||
| 2026-02-13 | 13F | Stifel Financial Corp | 6.946 | -23,23 | 361 | -26,08 | ||||
| 2026-02-05 | 13F | New York Life Investment Management Llc | 0 | -100,00 | 0 | |||||
| 2026-02-13 | 13F | Morgan Stanley | 14.586.859 | 8,30 | 758.079 | 4,56 | ||||
| 2026-02-11 | 13F | O'shaughnessy Asset Management, Llc | 13.249 | -14,29 | 689 | -17,31 | ||||
| 2026-02-17 | 13F | Interval Partners, LP | Call | 0 | -100,00 | 0 | ||||
| 2026-02-17 | 13F | MIRAE ASSET GLOBAL ETFS HOLDINGS Ltd. | 44.961 | 10,36 | 2.337 | 6,57 | ||||
| 2026-02-12 | 13F | UniSuper Management Pty Ltd | 63.725 | -6,41 | 3.312 | -9,66 | ||||
| 2025-11-12 | 13F | Polen Capital Management Llc | 0 | -100,00 | 0 | |||||
| 2026-02-13 | 13F | Parkside Financial Bank & Trust | 77 | -62,80 | 4 | -63,64 | ||||
| 2025-10-24 | 13F | Roble, Belko & Company, Inc | 0 | -100,00 | 0 | |||||
| 2026-02-13 | 13F | Aigen Investment Management, Lp | 4.865 | 253 | ||||||
| 2026-04-13 | 13F | Creative Financial Designs Inc /adv | 120 | 500,00 | 6 | 400,00 | ||||
| 2025-11-12 | 13F | Globeflex Capital L P | 0 | -100,00 | 0 | |||||
| 2026-02-11 | 13F | Vestcor Inc | 16.928 | -0,90 | 1 | |||||
| 2026-02-12 | 13F | Brown Brothers Harriman & Co | 1.824 | 95 | ||||||
| 2026-02-12 | 13F | Swiss National Bank | 373.900 | 1,69 | 19.432 | -1,83 | ||||
| 2026-02-06 | 13F | Bare Financial Services, Inc | 9 | 0,00 | 0 | |||||
| 2026-04-13 | 13F | Gateway Investment Advisers Llc | 7.341 | 363 | ||||||
| 2026-02-17 | 13F | Aquatic Capital Management LLC | 60.133 | 3.125 | ||||||
| 2026-01-20 | 13F | Cromwell Holdings LLC | 24 | 0,00 | 1 | 0,00 | ||||
| 2026-02-12 | 13F | CIBC Private Wealth Group, LLC | 1.298 | 35,63 | 67 | 31,37 | ||||
| 2026-02-13 | 13F | Walleye Trading LLC | Put | 5.400 | 107,69 | 281 | 101,44 | |||
| 2026-02-13 | 13F | Walleye Trading LLC | Call | 16.100 | 46,36 | 837 | 41,22 | |||
| 2026-02-11 | 13F | Los Angeles Capital Management Llc | 848 | 44 | ||||||
| 2026-02-17 | 13F | Stenahm Asset Managment Ltd | 0 | -100,00 | 0 | |||||
| 2026-02-17 | 13F | Gilder Gagnon Howe & Co Llc | 0 | -100,00 | 0 | -100,00 | ||||
| 2026-02-17 | 13F | Quantinno Capital Management LP | 48.681 | 3,70 | 2.530 | 0,08 | ||||
| 2026-02-13 | 13F | Congruence Capital, LLC | 259.427 | 13.482 | ||||||
| 2026-01-14 | 13F | Jfs Wealth Advisors, Llc | 140 | 40,00 | 7 | 40,00 | ||||
| 2026-04-13 | 13F | Bank of New Hampshire | 98 | 5 | ||||||
| 2026-02-13 | 13F | Edgestream Partners, L.P. | 21.959 | 1.141 | ||||||
| 2026-02-17 | 13F | Balyasny Asset Management Llc | 150.677 | -80,26 | 7.831 | -80,94 | ||||
| 2026-04-17 | 13F | CENTRAL TRUST Co | 2.000 | 0,00 | 99 | -4,85 | ||||
| 2026-02-17 | 13F | VARCOV Co. | 11.823 | 614 | ||||||
| 2026-02-17 | 13F | PharVision Advisers, LLC | 3.851 | 200 | ||||||
| 2026-01-26 | 13F | AE Wealth Management LLC | 5.988 | 311 | ||||||
| 2025-11-12 | 13F | Level Four Advisory Services, Llc | 0 | -100,00 | 0 | |||||
| 2026-01-26 | 13F | Whittier Trust Co | 501 | 28 | ||||||
| 2025-11-14 | 13F | Texas Permanent School Fund | 0 | -100,00 | 0 | -100,00 | ||||
| 2026-01-29 | 13F | Vanguard Group Inc | 17.598.217 | -0,60 | 914.579 | -4,04 | ||||
| 2026-02-17 | 13F | Sea Cliff Partners Management, LP | 272.699 | -1,55 | 14.172 | -4,95 | ||||
| 2026-02-06 | 13F | Algebris (uk) Ltd | 0 | -100,00 | 0 | |||||
| 2026-02-05 | 13F | Thrivent Financial For Lutherans | 328.366 | 23,53 | 17 | 21,43 | ||||
| 2026-02-12 | 13F | Voya Investment Management Llc | 134.678 | -6,34 | 6.999 | -9,57 | ||||
| 2026-02-13 | 13F | Smartleaf Asset Management LLC | 136 | -27,27 | 7 | -30,00 | ||||
| 2026-02-11 | 13F | Zions Bancorporation, National Association /ut/ | 12 | 1 | ||||||
| 2026-02-12 | 13F | Nuveen, LLC | 553.552 | -26,31 | 28.768 | -28,86 | ||||
| 2026-02-13 | 13F | Bridgewater Associates, LP | 0 | -100,00 | 0 | -100,00 | ||||
| 2026-02-13 | 13F | Cullen Capital Management, LLC | 12.559 | -10,44 | 653 | -13,53 | ||||
| 2026-02-03 | 13F | Lmcg Investments, Llc | 109.747 | 5,51 | 5.704 | 1,86 | ||||
| 2025-10-28 | 13F | Ritholtz Wealth Management | 0 | -100,00 | 0 | |||||
| 2026-02-05 | 13F | Atria Investments Llc | 17.031 | -8,29 | 885 | -11,41 | ||||
| 2026-02-17 | 13F | Scientech Research LLC | 4.046 | 210 | ||||||
| 2026-02-17 | 13F | T. Rowe Price Investment Management, Inc. | 200 | -8,68 | 0 | |||||
| 2026-02-13 | 13F | Vontobel Holding Ltd. | 39.647 | 22,91 | 2.060 | 18,66 | ||||
| 2026-01-30 | 13F | Jennison Associates Llc | 775.592 | -62,84 | 40.308 | -64,12 | ||||
| 2026-02-17 | 13F | Moore Capital Management, Lp | 0 | -100,00 | 0 | |||||
| 2026-02-12 | 13F | Commonwealth Equity Services, Llc | 10.041 | -0,69 | 522 | |||||
| 2025-10-21 | 13F | Munro Partners | 0 | -100,00 | 0 | -100,00 | ||||
| 2026-01-16 | 13F | Ronald Blue Trust, Inc. | 199 | -84,37 | 10 | -82,14 | ||||
| 2026-04-13 | 13F | True Wealth Design, LLC | 156 | 1.850,00 | 8 | |||||
| 2026-02-06 | 13F | Profund Advisors Llc | 4.042 | -7,21 | 210 | -10,26 | ||||
| 2026-02-17 | 13F | Citadel Advisors Llc | Call | 100.500 | -36,71 | 5.223 | -38,91 | |||
| 2026-04-10 | 13F | Perigon Wealth Management, LLC | 11.764 | -18,57 | 581 | -22,53 | ||||
| 2026-02-17 | 13F | Citadel Advisors Llc | Put | 29.200 | -42,18 | 1.518 | -44,19 | |||
| 2026-02-17 | 13F | Citadel Advisors Llc | 302.457 | 15.719 | ||||||
| 2025-11-12 | 13F | Fox Run Management, L.l.c. | 0 | -100,00 | 0 | -100,00 | ||||
| 2026-04-09 | 13F | Diversified Management Inc | 32.230 | 734,33 | 1.592 | 696,00 | ||||
| 2026-04-07 | 13F | Signaturefd, Llc | 207 | -16,19 | 10 | -16,67 | ||||
| 2026-01-29 | 13F | UBS Group AG | 487.344 | -30,31 | 25.327 | -32,72 | ||||
| 2026-01-28 | 13F | Salomon & Ludwin, LLC | 0 | -100,00 | 0 | |||||
| 2025-11-14 | 13F | Point72 (DIFC) Ltd | 1.202 | -68,16 | 65 | -71,81 | ||||
| 2026-02-13 | 13F | Schroder Investment Management Group | 400.416 | -4,03 | 20.810 | -7,35 | ||||
| 2026-02-17 | 13F | Bank Of America Corp /de/ | 882.941 | -51,68 | 45.886 | -53,35 | ||||
| 2025-10-23 | 13F | Lecap Asset Management Ltd | 0 | -100,00 | 0 | |||||
| 2026-02-02 | 13F | Oppenheimer Asset Management Inc. | 10.453 | -9,74 | 543 | -12,84 | ||||
| 2026-02-06 | 13F | Global Retirement Partners, LLC | 3.084 | 4,08 | 160 | 0,63 | ||||
| 2026-02-11 | 13F | Deutsche Bank Ag\ | 17.859 | 1,08 | 928 | -2,42 | ||||
| 2026-02-13 | 13F | Macquarie Group Ltd | 0 | -100,00 | 0 | |||||
| 2026-02-05 | 13F | Bessemer Group Inc | 2.590.449 | -18,10 | 135 | -21,18 | ||||
| 2026-01-15 | 13F | Fifth Third Wealth Advisors LLC | 5.465 | -0,15 | 284 | -3,40 | ||||
| 2026-02-13 | 13F | Mariner, LLC | 0 | -100,00 | 0 | |||||
| 2026-02-05 | 13F | Phoenix Holdings Ltd. | 4.315 | -6,09 | 224 | -9,31 | ||||
| 2026-02-13 | 13F | Ubs Asset Management Americas Inc | 576.505 | -1,83 | 29.961 | -5,22 | ||||
| 2025-11-14 | 13F | Squarepoint Ops LLC | 0 | -100,00 | 0 | -100,00 | ||||
| 2025-11-07 | 13F/A | Abn Amro Investment Solutions | 55.673 | 70,78 | 1.606 | 57,30 | ||||
| 2026-01-07 | 13F | Aventura Private Wealth, LLC | 117 | 0,00 | 6 | 0,00 | ||||
| 2026-02-17 | 13F | D. E. Shaw & Co., Inc. | 2.477.349 | 178,97 | 128.748 | 169,33 | ||||
| 2026-02-17 | 13F | Freestone Grove Partners LP | 21.224 | -93,24 | 1.103 | -93,47 | ||||
| 2026-01-30 | 13F | State of New Jersey Common Pension Fund D | 66.901 | 4,11 | 3.477 | 0,49 | ||||
| 2026-04-13 | 13F | Massmutual Trust Co Fsb/adv | 360 | 27,21 | 18 | 21,43 | ||||
| 2026-01-13 | 13F | Sendero Wealth Management, LLC | 16.999 | 0,00 | 883 | -3,50 | ||||
| 2026-01-29 | 13F | Teachers Retirement System Of The State Of Kentucky | 59.600 | 0,00 | 3 | 0,00 | ||||
| 2026-02-05 | 13F | DnB Asset Management AS | 160.478 | 516,13 | 8.340 | 494,86 | ||||
| 2026-02-11 | 13F | Allianz Asset Management GmbH | 684.929 | -3,26 | 35.596 | -6,61 | ||||
| 2026-02-18 | 13F | GWM Advisors LLC | 150 | 0,00 | 8 | -12,50 | ||||
| 2026-01-29 | 13F | Rakuten Securities, Inc. | 0 | -100,00 | 0 | |||||
| 2026-02-11 | 13F | Hughes Financial Services, LLC | 13 | 0,00 | 1 | |||||
| 2026-04-10 | 13F | Oak Thistle LLC | 0 | -100,00 | 0 | |||||
| 2026-02-17 | 13F/A | RBF Capital, LLC | 5.000 | 0,00 | 260 | -3,72 | ||||
| 2026-03-12 | 13F/A | Peak6 Llc | Put | 40.000 | 2.079 | |||||
| 2026-03-12 | 13F/A | Peak6 Llc | Call | 87.600 | -10,25 | 4.553 | -13,34 | |||
| 2026-01-28 | 13F | Arizona State Retirement System | 53.136 | -5,32 | 2.761 | -8,58 | ||||
| 2026-03-12 | 13F/A | Peak6 Llc | 13.333 | 376,35 | 693 | 361,33 | ||||
| 2026-02-02 | 13F | Principal Financial Group Inc | 540.063 | 28,41 | 28.067 | 23,98 | ||||
| 2026-02-05 | 13F | Amalgamated Bank | 90.450 | 0,55 | 5 | 0,00 | ||||
| 2026-02-17 | 13F | Shay Capital LLC | 0 | -100,00 | 0 | |||||
| 2026-01-05 | 13F | Union Bancaire Privee, UBP SA | 16.532 | 68,92 | 888 | 71,90 | ||||
| 2026-04-16 | 13F | SG Americas Securities, LLC | 50.179 | -38,93 | 2 | -50,00 | ||||
| 2026-02-13 | 13F | Royal London Asset Management Ltd | 5.688.595 | 12,50 | 295.636 | 8,61 | ||||
| 2026-02-05 | 13F | Cambridge Investment Research Advisors, Inc. | 8.367 | 0 | ||||||
| 2026-02-11 | 13F | Livforsakringsbolaget Skandia, Omsesidigt | 0 | -100,00 | 0 | |||||
| 2026-02-17 | 13F | Mercer Global Advisors Inc /adv | 7.449 | 7,91 | 387 | 4,31 | ||||
| 2026-02-17 | 13F | Dendur Capital Lp | 898.000 | 0,00 | 46.669 | -3,45 | ||||
| 2026-02-05 | 13F | Td Private Client Wealth Llc | 6 | 0 | ||||||
| 2026-02-17 | 13F | Shay Capital LLC | Call | 0 | -100,00 | 0 | ||||
| 2026-01-27 | 13F | Local Pensions Partnership Investment Ltd | 543.000 | 0,00 | 28.217 | -3,47 | ||||
| 2026-04-15 | 13F | Merit Financial Group, LLC | 5.402 | 267 | ||||||
| 2026-02-02 | 13F | Sachetta, LLC | 33 | 0,00 | 2 | 0,00 | ||||
| 2026-02-12 | 13F | Leith Wheeler Investment Counsel Ltd. | 169.142 | -3,34 | 8.790 | -6,68 | ||||
| 2026-02-17 | 13F | Gotham Asset Management, LLC | 6.720 | -68,53 | 349 | -69,63 | ||||
| 2026-02-04 | 13F | Oregon Public Employees Retirement Fund | 37.857 | -0,79 | 1.967 | -4,19 | ||||
| 2026-01-26 | 13F | Private Trust Co Na | 102 | 0,00 | 5 | 0,00 | ||||
| 2026-02-17 | 13F | Jones Financial Companies Lllp | 74 | -30,19 | 4 | -40,00 | ||||
| 2026-01-29 | 13F | Simon Quick Advisors, Llc | 0 | -100,00 | 0 | |||||
| 2026-02-13 | 13F | Victory Capital Management Inc | 57.079 | -11,60 | 2.966 | -14,65 | ||||
| 2026-02-18 | 13F/A | Empowered Funds, LLC | 8.736 | 454 | ||||||
| 2026-02-12 | 13F | RPg Family Wealth Advisory, LLC | 0 | -100,00 | 0 | |||||
| 2026-01-14 | 13F | ORG Partners LLC | 3 | 0 | ||||||
| 2026-02-17 | 13F | Public Employees Retirement System Of Ohio | 64.279 | -10,37 | 3.341 | -13,47 | ||||
| 2026-02-12 | 13F | Cloud Capital Management, LLC | 0 | -100,00 | 0 | |||||
| 2025-11-14 | 13F | Wolverine Trading, Llc | Call | 56.400 | 99,29 | 3.025 | 77,05 | |||
| 2025-11-14 | 13F | Wolverine Trading, Llc | Put | 11.700 | 51,95 | 627 | 35,13 | |||
| 2026-02-17 | 13F | ArrowMark Colorado Holdings LLC | 202.000 | -57,13 | 10.498 | -58,61 | ||||
| 2026-02-11 | 13F | Twin Tree Management, LP | Call | 56.700 | -59,50 | 2.947 | -60,91 | |||
| 2026-02-10 | 13F | Syntegra Private Wealth Group, LLC | 4.173 | 0,00 | 217 | -3,57 | ||||
| 2025-10-20 | 13F | Allspring Global Investments Holdings, LLC | 0 | -100,00 | 0 | |||||
| 2026-02-09 | 13F | Hartland & Co., LLC | 789 | 28,29 | 41 | 24,24 | ||||
| 2026-02-02 | 13F | Cornerstone Planning Group LLC | 11 | -26,67 | 1 | |||||
| 2025-11-13 | 13F | Diametric Capital, LP | 0 | -100,00 | 0 | -100,00 | ||||
| 2026-02-11 | 13F | Janney Montgomery Scott LLC | 8.700 | -63,06 | 0 | -100,00 | ||||
| 2026-04-15 | 13F | Avanza Fonder AB | 999 | 0,00 | 49 | -3,92 | ||||
| 2026-02-19 | 13F | Invesco Ltd. | 2.917.310 | 2,88 | 151.613 | -0,67 | ||||
| 2026-02-06 | 13F | Meiji Yasuda Asset Management Co Ltd. | 4.407 | 0,00 | 229 | -3,38 | ||||
| 2026-02-17 | 13F | Lighthouse Investment Partners, LLC | 0 | -100,00 | 0 | |||||
| 2026-02-03 | 13F | SBI Securities Co., Ltd. | 123 | 310,00 | 6 | 500,00 | ||||
| 2026-01-23 | 13F | Yorktown Management & Research Co Inc | 13.300 | 0,00 | 691 | -3,36 | ||||
| 2025-11-07 | 13F | Shell Asset Management Co | 2.018 | -62,64 | 0 | |||||
| 2026-02-09 | 13F/A | Swedbank AB | 1.084.200 | -9,57 | 56.346 | -12,70 | ||||
| 2026-02-12 | 13F | Brinker Capital Investments, LLC | 0 | -100,00 | 0 | |||||
| 2026-02-17 | 13F | Liontrust Investment Partners LLP | 1.730.797 | -8,46 | 89.950 | -11,62 | ||||
| 2026-02-03 | 13F | Robeco Schweiz AG | 818.544 | -22,13 | 42.540 | -24,82 | ||||
| 2026-01-07 | 13F | Harbor Investment Advisory, Llc | 1.703 | 0,00 | 89 | -3,30 | ||||
| 2026-02-17 | 13F | Cetera Investment Advisers | 3.902 | -4,46 | 203 | -7,76 | ||||
| 2026-02-13 | 13F | Goodnow Investment Group, Llc | 760.839 | 18,19 | 39.541 | 14,11 | ||||
| 2026-04-15 | 13F | Exchange Traded Concepts, Llc | 18.752 | -28,57 | 926 | -32,11 | ||||
| 2026-02-17 | 13F | TIG Advisors, LLC | Call | 0 | -100,00 | 0 | ||||
| 2026-01-23 | 13F | Hedeker Wealth, LLC | 8.337 | -50,20 | 433 | -51,94 | ||||
| 2026-02-10 | 13F | Natixis Advisors, L.p. | 35.528 | -21,50 | 2 | -50,00 | ||||
| 2026-02-13 | 13F | First Trust Advisors Lp | 5.318.070 | 38,64 | 276.380 | 33,85 | ||||
| 2026-04-17 | 13F | Stephenson National Bank & Trust | 1.126 | 8,58 | 56 | 3,77 | ||||
| 2025-11-14 | 13F | Axa S.a. | 0 | -100,00 | 0 | |||||
| 2026-02-03 | 13F | Sequoia Financial Advisors, LLC | 3.881 | 202 | ||||||
| 2026-02-17 | 13F | TIG Advisors, LLC | Put | 0 | -100,00 | 0 | ||||
| 2026-01-27 | 13F | Forum Financial Management, LP | 4.072 | 212 | ||||||
| 2026-02-12 | 13F | Federated Hermes, Inc. | 768.150 | -18,31 | 39.921 | -21,14 | ||||
| 2026-02-17 | 13F | Pentwater Capital Management LP | Put | 0 | -100,00 | 0 | ||||
| 2026-02-10 | 13F | Envestnet Asset Management Inc | 231.910 | 6,36 | 12.052 | 2,68 | ||||
| 2026-02-12 | 13F | Federation des caisses Desjardins du Quebec | 39.367 | -34,52 | 2.046 | -36,80 | ||||
| 2026-01-27 | 13F | TD Waterhouse Canada Inc. | 500 | 26 | ||||||
| 2026-02-10 | 13F | Bnp Paribas Arbitrage, Sa | 486.620 | 57,02 | 25.290 | 51,59 | ||||
| 2026-02-17 | 13F | Fernbridge Capital Management Lp | 1.546.500 | 104,39 | 80.372 | 97,33 | ||||
| 2026-02-12 | 13F | Ci Investments Inc. | 389.589 | 1,03 | 20.247 | 101.130,00 | ||||
| 2026-02-17 | 13F | Weiss Asset Management LP | 0 | -100,00 | 0 | -100,00 | ||||
| 2025-11-14 | 13F | Northwestern Mutual Wealth Management Co | 0 | -100,00 | 0 | |||||
| 2026-02-13 | 13F | American Century Companies Inc | 52.586 | -60,05 | 2.733 | -61,45 | ||||
| 2026-02-13 | 13F | Umb Bank N A/mo | 2.726 | -9,31 | 142 | -12,42 | ||||
| 2026-02-17 | 13F | Davidson Kempner Capital Management Lp | 300.000 | -53,49 | 15.591 | -55,10 | ||||
| 2026-01-30 | 13F | American Capital Advisory, LLC | 10.912 | 1.091.100,00 | 567 | |||||
| 2026-02-12 | 13F | Jane Street Group, Llc | Call | 158.900 | 138,23 | 8.258 | 130,03 | |||
| 2026-02-27 | 13F/A | Barclays Plc | Call | 0 | -100,00 | 0 | -100,00 | |||
| 2026-02-12 | 13F | Jane Street Group, Llc | 113.068 | 204,86 | 5.876 | 194,39 | ||||
| 2026-02-27 | 13F/A | Barclays Plc | Put | 0 | -100,00 | 0 | -100,00 | |||
| 2026-02-12 | 13F | Jane Street Group, Llc | Put | 10.200 | -12,07 | 530 | -15,06 | |||
| 2026-02-10 | 13F | Nomura Asset Management Co Ltd | 1.070 | 0,00 | 56 | -3,51 | ||||
| 2026-02-11 | 13F | Cerity Partners LLC | 11.561 | -18,76 | 601 | -21,67 | ||||
| 2026-02-13 | 13F | Maplelane Capital, Llc | Call | 0 | -100,00 | 0 | ||||
| 2026-02-17 | 13F | Silvercrest Asset Management Group Llc | 629.198 | -3,05 | 32.699 | -6,40 | ||||
| 2026-01-14 | 13F | Hunter Perkins Capital Management, LLC | 6.785 | 0,00 | 0 | |||||
| 2026-02-13 | 13F | Treasurer of the State of North Carolina | 79.537 | -6,80 | 4 | 0,00 | ||||
| 2026-01-28 | 13F | DekaBank Deutsche Girozentrale | 27.276 | 0,00 | 2 | 0,00 | ||||
| 2026-02-13 | 13F | Maplelane Capital, Llc | 0 | -100,00 | 0 | |||||
| 2026-02-12 | 13F | Marex Group plc | 4.441 | 231 | ||||||
| 2026-02-17 | 13F | Utah Retirement Systems | 10.154 | 0,00 | 528 | -3,48 | ||||
| 2026-01-29 | 13F | Dunhill Financial, LLC | 4 | 0 | ||||||
| 2026-04-16 | 13F | Capital Advisors, Ltd. LLC | 4 | 0,00 | 0 | |||||
| 2026-02-03 | 13F | Farmers & Merchants Investments Inc | 160 | 0,00 | 8 | 0,00 | ||||
| 2026-02-19 | 13F | CI Private Wealth, LLC | 19.466 | -16,17 | 1.012 | -19,12 | ||||
| 2025-11-14 | 13F | Petrus Trust Company, LTA | 0 | -100,00 | 0 | |||||
| 2026-04-13 | 13F | Global X Japan Co., Ltd. | 193 | 10 | ||||||
| 2026-02-05 | 13F | High Note Wealth, LLC | 81 | 8,00 | 4 | 0,00 | ||||
| 2026-02-10 | 13F | State of Wyoming | 9.264 | 100,30 | 481 | 93,95 | ||||
| 2026-02-11 | 13F | Fiduciary Management Inc /wi/ | 2.612.944 | -4,00 | 135.795 | -7,32 | ||||
| 2025-11-12 | 13F | NewSquare Capital LLC | 0 | -100,00 | 0 | |||||
| 2025-10-22 | 13F | NDVR, Inc. | 0 | -100,00 | 0 | |||||
| 2026-02-12 | 13F | Douglass Winthrop Advisors, LLC | 69.134 | -0,74 | 3.593 | -4,19 | ||||
| 2026-02-17 | 13F | Ancora Advisors, LLC | 535 | 28 | ||||||
| 2026-02-17 | 13F | Pentwater Capital Management LP | Call | 0 | -100,00 | 0 | ||||
| 2026-02-13 | 13F | Hudson Bay Capital Management LP | 0 | -100,00 | 0 | |||||
| 2026-02-13 | 13F | Fieldview Capital Management, LLC | 13.593 | 706 | ||||||
| 2026-02-17 | 13F | Modern Wealth Management, LLC | 0 | -100,00 | 0 | |||||
| 2025-11-14 | 13F | Yaupon Capital Management LP | 0 | -100,00 | 0 | -100,00 | ||||
| 2026-02-13 | 13F | BNP Paribas Asset Management Holding S.A. | 118.245 | 5.985,69 | 6 | |||||
| 2026-02-13 | 13F | ACK Asset Management LLC | 900.000 | 0,00 | 46.773 | -3,46 | ||||
| 2026-04-13 | 13F | Wolff Wiese Magana Llc | 24 | 0,00 | 1 | 0,00 | ||||
| 2025-11-13 | 13F | Pinnbrook Capital Management Lp | 0 | -100,00 | 0 | -100,00 | ||||
| 2025-11-05 | 13F | Alps Advisors Inc | 0 | -100,00 | 0 | |||||
| 2026-02-13 | 13F | Forest Avenue Capital Management LP | 1.879.883 | 50,69 | 97.698 | 45,49 | ||||
| 2025-10-28 | 13F | Qrg Capital Management, Inc. | 0 | -100,00 | 0 | -100,00 | ||||
| 2026-02-17 | 13F | HighVista Strategies LLC | 0 | -100,00 | 0 | |||||
| 2026-02-17 | 13F | Hood River Capital Management LLC | 1.330.800 | 69.162 | ||||||
| 2026-02-06 | 13F | ProShare Advisors LLC | 7.647 | -5,19 | 397 | -8,53 | ||||
| 2026-01-27 | 13F | Institute for Wealth Management, LLC. | 0 | -100,00 | 0 | |||||
| 2025-11-14 | 13F | Graham Capital Management, L.P. | 0 | -100,00 | 0 | |||||
| 2026-01-28 | 13F | Klp Kapitalforvaltning As | 42.400 | 7,07 | 2.204 | 3,38 | ||||
| 2026-02-17 | 13F | State Of Wisconsin Investment Board | 83.727 | -4,59 | 4.351 | -7,88 | ||||
| 2026-02-12 | 13F | Campbell & CO Investment Adviser LLC | 13.960 | 64,55 | 726 | 58,99 | ||||
| 2026-01-07 | 13F | Procyon Private Wealth Partners, LLC | 34.225 | 1.779 | ||||||
| 2026-02-17 | 13F | Tower Research Capital LLC (TRC) | 8.823 | -26,47 | 459 | -28,99 | ||||
| 2026-02-10 | 13F | Rothschild Investment Llc | 767 | 0,00 | 40 | -4,88 | ||||
| 2026-02-17 | 13F | FIL Ltd | 1.107.618 | 125,15 | 57.563 | 117,38 | ||||
| 2025-11-14 | 13F | Bridgefront Capital, LLC | 0 | -100,00 | 0 | -100,00 | ||||
| 2026-02-17 | 13F | Chilton Investment Co Llc | 7.422 | -93,06 | 386 | -93,31 | ||||
| 2026-02-17 | 13F | Algert Global Llc | 58.268 | -54,22 | 3 | -50,00 | ||||
| 2026-02-17 | 13F | Pentwater Capital Management LP | 0 | -100,00 | 0 | |||||
| 2025-11-04 | 13F | Gitterman Wealth Management, LLC | 13.439 | 31,11 | 723 | 16,99 | ||||
| 2026-02-13 | 13F | Public Employees Retirement Association Of Colorado | 19.198 | 0,00 | 1 | -100,00 | ||||
| 2026-04-16 | 13F | E. Ohman J:or Asset Management AB | 310.530 | 561,32 | 15.340 | 528,69 | ||||
| 2026-04-06 | 13F | Highline Wealth Partners Llc | 121 | 75,36 | 6 | 66,67 | ||||
| 2026-02-17 | 13F | Polar Capital Holdings Plc | 262.079 | -0,78 | 13.620 | -4,21 | ||||
| 2026-02-12 | 13F | Pembroke Management, LTD | 895.855 | -1,47 | 46.558 | -4,88 | ||||
| 2026-02-17 | 13F | Man Group plc | 198.256 | 704,38 | 10.303 | 677,00 | ||||
| 2026-01-26 | 13F | Thomasville National Bank | 213.816 | 11.112 | ||||||
| 2026-02-13 | 13F | Okabena Investment Services Inc | 0 | -100,00 | 0 | |||||
| 2026-02-03 | 13F | Crossmark Global Holdings, Inc. | 56.423 | -23,54 | 2.932 | -26,18 | ||||
| 2026-02-12 | 13F | Ensign Peak Advisors, Inc | 11.996 | -68,38 | 623 | -69,49 | ||||
| 2026-02-17 | 13F | Creative Planning | 9.526 | -20,09 | 495 | -22,78 | ||||
| 2026-02-17 | 13F | Adage Capital Partners Gp, L.l.c. | 0 | -100,00 | 0 | |||||
| 2026-02-13 | 13F/A | Alberta Investment Management Corp | 0 | -100,00 | 0 | |||||
| 2026-02-03 | 13F | Legacy Wealth Managment, LLC/ID | 17 | 0,00 | 1 | |||||
| 2026-02-10 | 13F | South Street Advisors LLC | 216.950 | -8,62 | 11.275 | -11,78 | ||||
| 2026-02-17 | 13F | Millennium Management Llc | 469.689 | -60,26 | 24.410 | -61,63 | ||||
| 2026-02-17 | 13F | Zimmer Partners, LP | 200.000 | -68,99 | 10.394 | -70,06 | ||||
| 2026-02-10 | 13F | Norges Bank | 2.083.218 | 108.265 | ||||||
| 2026-02-11 | 13F | Illinois Municipal Retirement Fund | 87.656 | 35,53 | 4.555 | 30,85 | ||||
| 2026-02-05 | 13F | Bank Julius Baer & Co. Ltd, Zurich | 33.948 | -40,26 | 1.789 | -41,53 | ||||
| 2026-02-13 | 13F | Grandeur Peak Global Advisors, LLC | 117.473 | -24,76 | 6.105 | -27,36 | ||||
| 2026-04-13 | 13F | IFP Advisors, Inc | 735 | 681,91 | 36 | 800,00 | ||||
| 2026-02-11 | 13F | Twin Tree Management, LP | Put | 0 | -100,00 | 0 | -100,00 | |||
| 2026-02-10 | 13F | Goldman Sachs Group Inc | 440.437 | 5,27 | 22.890 | 1,63 | ||||
| 2025-11-14 | 13F | Hrt Financial Lp | 0 | -100,00 | 0 | -100,00 | ||||
| 2026-02-12 | 13F | Loomis Sayles & Co L P | 214.063 | 4,41 | 11.125 | 0,80 | ||||
| 2026-02-11 | 13F | LPL Financial LLC | 20.476 | 2,24 | 1.064 | -1,30 | ||||
| 2026-02-17 | 13F | Amundi | 3.062.369 | 30,74 | 159.138 | 29,10 | ||||
| 2026-02-17 | 13F | Russell Investments Group, Ltd. | 30.307 | -1,89 | 1.575 | -5,23 | ||||
| 2026-01-29 | 13F | Sanctuary Advisors, LLC | 0 | -100,00 | 0 | -100,00 | ||||
| 2025-11-14 | 13F | Mariner Investment Group Llc | 0 | -100,00 | 0 | -100,00 | ||||
| 2026-02-17 | 13F | Prelude Capital Management, Llc | 5.142 | 267 | ||||||
| 2025-10-23 | 13F | HB Wealth Management, LLC | 0 | -100,00 | 0 | |||||
| 2025-11-14 | 13F | Mariner Investment Group Llc | Call | 0 | -100,00 | 0 | -100,00 | |||
| 2026-02-12 | 13F | Callan Family Office, LLC | 4.507 | 234 | ||||||
| 2026-02-10 | 13F | Machina Capital S.a.s. | 0 | -100,00 | 0 | |||||
| 2026-02-05 | 13F | Isthmus Partners, Llc | 81.307 | 0,07 | 4.226 | 105.525,00 | ||||
| 2026-02-10 | 13F | Mutual Of America Capital Management Llc | 79.360 | -9,39 | 4.124 | -12,52 | ||||
| 2025-11-14 | 13F | Corton Capital Inc. | 0 | -100,00 | 0 | |||||
| 2026-01-23 | 13F | Assetmark, Inc | 161 | 9,52 | 8 | 14,29 | ||||
| 2026-01-28 | 13F | Teacher Retirement System Of Texas | 27.036 | -52,17 | 1.405 | -53,81 | ||||
| 2025-11-14 | 13F | Thematics Asset Management | 418.000 | 14,84 | 22.501 | 2,43 | ||||
| 2026-01-15 | 13F | Nisa Investment Advisors, Llc | 121 | 1,68 | 6 | 0,00 | ||||
| 2026-02-09 | 13F | New Age Alpha Advisors, LLC | 18.816 | -27,00 | 978 | -29,56 | ||||
| 2026-02-10 | 13F | CIBC Asset Management Inc | 6.007 | 0,00 | 312 | -3,41 | ||||
| 2026-02-12 | 13F | Steward Partners Investment Advisory, Llc | 2.654 | 5,15 | 138 | 1,48 | ||||
| 2026-01-23 | 13F | State of Alaska, Department of Revenue | 18.960 | -6,97 | 1 | -100,00 | ||||
| 2026-02-17 | 13F | Kinetic Partners Management, LP | 0 | -100,00 | 0 | |||||
| 2026-02-06 | 13F | Leonteq Securities AG | 3.554 | 335,01 | 185 | 327,91 | ||||
| 2026-02-13 | 13F | Vega Investment Solutions | 958 | 0,00 | 50 | -14,04 | ||||
| 2026-01-30 | 13F | Us Bancorp \de\ | 1.902 | 5,37 | 99 | 1,03 | ||||
| 2026-02-17 | 13F | Spruce House Investment Management Llc | 0 | -100,00 | 0 | |||||
| 2026-02-17 | 13F | Oxford Asset Management Llp | 16.096 | 79,48 | 837 | 54,53 | ||||
| 2026-04-15 | 13F | Fortitude Family Office, LLC | 90 | 130,77 | 4 | 100,00 | ||||
| 2026-02-12 | 13F | Riverwater Partners LLC | 5.752 | -0,48 | 299 | -4,18 | ||||
| 2026-02-18 | 13F | State of Tennessee, Treasury Department | 65.199 | -4,11 | 3.479 | -4,92 | ||||
| 2026-01-27 | 13F | Evergreen Capital Management Llc | 4.382 | 228 | ||||||
| 2025-11-13 | 13F | Clear Street Markets Llc | 0 | -100,00 | 0 | |||||
| 2026-01-30 | 13F/A | M&t Bank Corp | 6.620 | 49,77 | 344 | 45,15 | ||||
| 2026-01-15 | 13F | Retirement Systems of Alabama | 228.859 | -0,19 | 11.894 | -3,65 | ||||
| 2026-02-13 | 13F | Kilter Group LLC | 24 | -14,29 | 1 | 0,00 | ||||
| 2026-02-10 | 13F | Intech Investment Management Llc | 10.112 | 526 | ||||||
| 2026-02-13 | 13F | Sei Investments Co | 136.312 | 38,50 | 7.084 | 33,74 | ||||
| 2026-02-17 | 13F | Tudor Investment Corp Et Al | Put | 4.000 | 208 | |||||
| 2025-10-24 | 13F | Hemington Wealth Management | 179 | 5,92 | 0 | |||||
| 2026-02-17 | 13F | Tudor Investment Corp Et Al | 336.016 | 17.463 | ||||||
| 2026-01-30 | 13F | Richardson Capital Management LLC | 290 | 0,00 | 15 | 0,00 | ||||
| 2026-02-13 | 13F | Verition Fund Management LLC | 159.514 | -14,08 | 8.290 | -17,06 | ||||
| 2026-02-17 | 13F | Camrose Capital Investment Partners LLP | 1.737.226 | 39,04 | 90.284 | 34,23 | ||||
| 2026-02-12 | 13F | BRYN MAWR TRUST Co | 6.789 | 606,45 | 353 | 590,20 | ||||
| 2026-01-15 | 13F | Foster & Motley Inc | 36.599 | -7,26 | 2 | -50,00 | ||||
| 2026-02-13 | 13F | Brown Advisory Inc | 16.230 | 92,09 | 843 | 85,68 | ||||
| 2026-01-26 | 13F | KBC Group NV | 2.618.916 | 11,60 | 136 | 7,94 | ||||
| 2026-01-21 | 13F | Newbridge Financial Services Group, Inc. | 260 | -27,78 | 14 | -31,58 | ||||
| 2026-02-17 | 13F | Sciencast Management LP | 82.787 | 4.302 | ||||||
| 2026-02-04 | 13F | ELCO Management Co., LLC | 6.059 | -58,86 | 315 | -60,35 | ||||
| 2026-01-16 | 13F | Louisiana State Employees Retirement System | 52.800 | 0,00 | 2.744 | -3,45 | ||||
| 2025-11-13 | 13F | Canada Pension Plan Investment Board | 0 | -100,00 | 0 | -100,00 | ||||
| 2026-02-13 | 13F | State Street Corp | 5.733.516 | 0,96 | 297.971 | -2,53 | ||||
| 2026-02-17 | 13F | Lazard Asset Management Llc | 5.303 | 0,00 | 276 | -3,51 | ||||
| 2026-02-12 | 13F | Quadrant Capital Group Llc | 1.712 | -84,50 | 89 | -85,19 | ||||
| 2026-02-05 | 13F | North Dakota State Investment Board | 6.622 | 344 | ||||||
| 2025-11-12 | 13F | Catalyst Funds Management Pty Ltd | 0 | -100,00 | 0 | |||||
| 2026-01-14 | 13F | Spire Wealth Management | 0 | -100,00 | 0 | |||||
| 2026-03-06 | 13F | Hsbc Holdings Plc | 206.358 | -0,55 | 10.724 | -3,98 | ||||
| 2025-11-04 | 13F | Guerra Advisors Inc | 15 | 1 | ||||||
| 2025-11-05 | 13F | BI Asset Management Fondsmaeglerselskab A/S | 0 | -100,00 | 0 | |||||
| 2025-11-14 | 13F | Governors Lane LP | 0 | -100,00 | 0 | -100,00 | ||||
| 2026-02-04 | 13F | Swiss Life Asset Management Ltd | 8.930 | 1,19 | 464 | -2,32 | ||||
| 2026-04-15 | 13F | Covea Finance | 42.200 | 0,00 | 2.085 | -4,97 | ||||
| 2026-02-17 | 13F | Anomaly Capital Management, LP | 695.109 | -71,85 | 36.125 | -72,83 | ||||
| 2026-02-17 | 13F | Df Dent & Co Inc | 0 | -100,00 | 0 | |||||
| 2026-02-13 | 13F | Quarry LP | 732 | 38 | ||||||
| 2026-02-13 | 13F/A | Ontario Teachers Pension Plan Board | 0 | -100,00 | 0 | |||||
| 2026-04-14 | 13F | Zrc Wealth Management, Llc | 34 | 2 | ||||||
| 2026-01-22 | 13F | Bfsg, Llc | 1.968 | -36,96 | 102 | -39,29 | ||||
| 2026-02-05 | 13F | Applied Finance Capital Management, LLC | 0 | -100,00 | 0 | |||||
| 2025-11-13 | 13F | Artemis Investment Management LLP | 0 | -100,00 | 0 | |||||
| 2026-01-27 | 13F | Asset Management One Co., Ltd. | 60.048 | -17,09 | 3.225 | -17,29 | ||||
| 2026-02-13 | 13F | Bornite Capital Management LP | 0 | -100,00 | 0 | |||||
| 2026-02-11 | 13F | Twin Tree Management, LP | 0 | -100,00 | 0 | -100,00 | ||||
| 2026-02-17 | 13F | Engineers Gate Manager LP | 98.537 | -42,28 | 5.121 | -44,28 | ||||
| 2026-02-06 | 13F | AMF Pensionsforsakring AB | 1.342.563 | -0,05 | 69.773 | -3,51 | ||||
| 2025-11-14 | 13F | Wellington Management Group Llp | 0 | -100,00 | 0 | |||||
| 2026-02-12 | 13F | Skandinaviska Enskilda Banken AB (publ) | 5.807 | -1,21 | 302 | -4,75 | ||||
| 2026-01-22 | 13F | V-Square Quantitative Management LLC | 446 | 23 | ||||||
| 2026-02-11 | 13F | Capital World Investors | 6.292.740 | 5,79 | 327.034 | 2,14 | ||||
| 2026-01-28 | 13F | Universal- Beteiligungs- und Servicegesellschaft mbH | 22.164 | -33,59 | 1.152 | -35,91 | ||||
| 2026-02-12 | 13F | New York State Common Retirement Fund | 79.314 | -21,45 | 4.122 | -24,18 | ||||
| 2026-02-17 | 13F | Brevan Howard Capital Management LP | 27.484 | -62,01 | 1.428 | -63,33 | ||||
| 2026-02-09 | 13F | Mediolanum International Funds Ltd | 213.795 | 55,30 | 11.301 | 53,09 | ||||
| 2026-02-13 | 13F | Sterling Capital Management LLC | 5.500 | 8,03 | 286 | 4,01 | ||||
| 2026-02-03 | 13F | Mitsubishi UFJ Kokusai Asset Management Co., Ltd. | 308 | 0,00 | 16 | 0,00 | ||||
| 2026-04-13 | 13F | Wedge Capital Management L L P/nc | 214.157 | 0,93 | 10.579 | -4,05 | ||||
| 2026-02-13 | 13F | JustInvest LLC | 10.003 | -15,53 | 520 | -18,52 | ||||
| 2026-01-27 | 13F | Meritage Portfolio Management | 15.339 | -12,34 | 797 | -15,30 | ||||
| 2026-02-13 | 13F | CDAM (UK) Ltd | 1.276.582 | 9,79 | 66.344 | 6,00 | ||||
| 2026-02-13 | 13F | Walleye Capital LLC | 0 | -100,00 | 0 | -100,00 | ||||
| 2026-02-24 | 13F/A | Pacer Advisors, Inc. | 22.806 | -8,70 | 1.185 | -11,83 | ||||
| 2026-02-11 | 13F | Meeder Asset Management Inc | 117 | 154,35 | 6 | 200,00 | ||||
| 2026-02-17 | 13F | Bell Asset Management Ltd | 75.688 | 1,72 | 3.965 | -1,02 | ||||
| 2026-01-29 | 13F | Impax Asset Management Group plc | 2.872.595 | 10,77 | 149.289 | 6,95 | ||||
| 2025-10-27 | 13F | Nordea Investment Management Ab | 0 | -100,00 | 0 | |||||
| 2026-01-26 | 13F | Whittier Trust Co Of Nevada Inc | 1.959 | 13,76 | 109 | 21,11 | ||||
| 2026-02-09 | 13F | Hantz Financial Services, Inc. | 5.089 | 82,86 | 0 | |||||
| 2026-02-12 | 13F | State Board Of Administration Of Florida Retirement System | 119.765 | 0,00 | 6.224 | -3,44 | ||||
| 2026-02-06 | 13F | Cullen/frost Bankers, Inc. | 0 | -100,00 | 0 | |||||
| 2026-02-17 | 13F | Select Equity Group, L.P. | 7.778.376 | -19,74 | 404.242 | -22,51 | ||||
| 2026-02-10 | 13F | Root Financial Partners, LLC | 423 | 14,95 | 22 | 10,53 | ||||
| 2026-02-12 | 13F | Principal Securities, Inc. | 0 | -100,00 | 0 | -100,00 | ||||
| 2026-04-07 | 13F | Eastern Bank | 220 | 0,00 | 11 | -9,09 | ||||
| 2026-01-28 | 13F | Boston Trust Walden Corp | 195.584 | -3,91 | 10.165 | -7,23 | ||||
| 2026-02-17 | 13F | Aqr Capital Management Llc | 66.754 | 338,05 | 3.469 | 326,69 | ||||
| 2026-01-23 | 13F | Robeco Institutional Asset Management B.V. | 17.761 | 0,00 | 923 | -3,45 | ||||
| 2026-02-12 | 13F | California Public Employees Retirement System | 410.037 | -3,15 | 21.310 | -6,50 | ||||
| 2026-03-16 | 13F/A | Rockefeller Capital Management L.P. | 240.686 | -2,94 | 12.508 | -6,29 | ||||
| 2026-02-12 | 13F | Skopos Labs, Inc. | 6.302 | 338 | ||||||
| 2026-02-17 | 13F | SageView Advisory Group, LLC | 65 | 3 | ||||||
| 2026-02-17 | 13F | Northern Trust Corp | 1.517.763 | -3,92 | 78.878 | -7,24 | ||||
| 2026-02-11 | 13F | Brandywine Global Investment Management, LLC | 131.625 | 2,47 | 6.841 | -1,07 | ||||
| 2026-02-04 | 13F | Securian Asset Management, Inc | 13.863 | -2,39 | 720 | -5,76 | ||||
| 2026-02-17 | 13F | Point72 Asset Management, L.P. | Put | 11.800 | 613 | |||||
| 2026-03-03 | 13F/A | Caitong International Asset Management Co., Ltd | 1 | 0 | ||||||
| 2026-02-17 | 13F | Point72 Asset Management, L.P. | Call | 11.200 | 582 | |||||
| 2025-11-06 | 13F | REAP Financial Group, LLC | 0 | -100,00 | 0 | -100,00 | ||||
| 2026-02-17 | 13F | Point72 Asset Management, L.P. | 694.769 | 23,99 | 36.107 | 19,71 | ||||
| 2026-04-15 | 13F | Steadtrust LLC | 13.980 | 0,00 | 691 | -4,96 | ||||
| 2026-02-17 | 13F | Expect Equity LLC | 46.850 | 0,00 | 2.435 | -3,45 | ||||
| 2025-11-14 | 13F | WealthTrak Capital Management LLC | 0 | -100,00 | 0 | |||||
| 2026-02-10 | 13F | Eurizon Capital SGR S.p.A. | 1.742 | 92 | ||||||
| 2026-02-17 | 13F | Zurich Insurance Group Ltd/FI | 0 | -100,00 | 0 | |||||
| 2026-02-13 | 13F | Manufacturers Life Insurance Company, The | 139.228 | -1,70 | 7.236 | -5,10 | ||||
| 2026-02-17 | 13F | Susquehanna International Group, Llp | Call | 66.200 | -74,69 | 3.440 | -75,57 | |||
| 2026-02-17 | 13F | Susquehanna International Group, Llp | 73.911 | 956,48 | 3.841 | 921,54 | ||||
| 2026-02-17 | 13F | Susquehanna International Group, Llp | Put | 47.200 | -58,60 | 2.453 | -60,04 |
Other Listings
| IT:1CNM | 44,40 € |