Grundlæggende statistik
| Institutionelle ejere | 154 total, 154 long only, 0 short only, 0 long/short - change of 1,30% MRQ |
| Gennemsnitlig porteføljeallokering | 0.3495 % - change of -33,73% MRQ |
| Institutionelle aktier (lange) | 66.144.575 (ex 13D/G) - change of 8,72MM shares 15,18% MRQ |
| Institutionel værdi (lang) | $ 1.345.490 USD ($1000) |
Institutionelt ejerskab og aktionærer
abrdn ETFs - abrdn Bloomberg All Commodity Strategy K-1 Free ETF (US:BCI) har 154 institutionelle ejere og aktionærer, der har indsendt 13D/G- eller 13F-formularer til Securities Exchange Commission (SEC). Disse institutioner har i alt 66,144,575 aktier. Største aktionærer omfatter Wells Fargo & Company/mn, Sei Investments Co, Metis Global Partners, LLC, Bank Of America Corp /de/, Morgan Stanley, Nepc Llc, Northwestern Mutual Wealth Management Co, Royal Bank Of Canada, Great Lakes Advisors, Llc, and Lockheed Martin Investment Management Co .
abrdn ETFs - abrdn Bloomberg All Commodity Strategy K-1 Free ETF (ARCA:BCI) institutionel ejerskabsstruktur viser aktuelle positioner i virksomheden efter institutioner og fonde, samt seneste ændringer i positionsstørrelse. Større aktionærer kan omfatte individuelle investorer, investeringsforeninger, hedgefonde eller institutioner. Skema 13D angiver, at investoren besidder (eller besidder) mere end 5 % af virksomheden og har til hensigt (eller har til hensigt at) aktivt at forfølge en ændring i forretningsstrategi. Skema 13G indikerer en passiv investering på over 5%.
The share price as of September 15, 2025 is 21,48 / share. Previously, on September 16, 2024, the share price was 19,72 / share. This represents an increase of 8,92% over that period.

Fondens stemningsscore
Fund Sentiment Score (fka Ownership Accumulation Score) finder de aktier, der bliver mest købt af fonde. Det er resultatet af en sofistikeret, multi-faktor kvantitativ model, der identificerer virksomheder med de højeste niveauer af institutionel akkumulering. Scoringsmodellen bruger en kombination af den samlede stigning i oplyste ejere, ændringerne i porteføljeallokeringer i disse ejere og andre målinger. Tallet går fra 0 til 100, hvor højere tal indikerer et højere niveau af akkumulering for sine jævnaldrende, og 50 er gennemsnittet.
Opdateringsfrekvens: Dagligt
Se Ownership Explorer, som giver en liste over højest rangerende virksomheder.
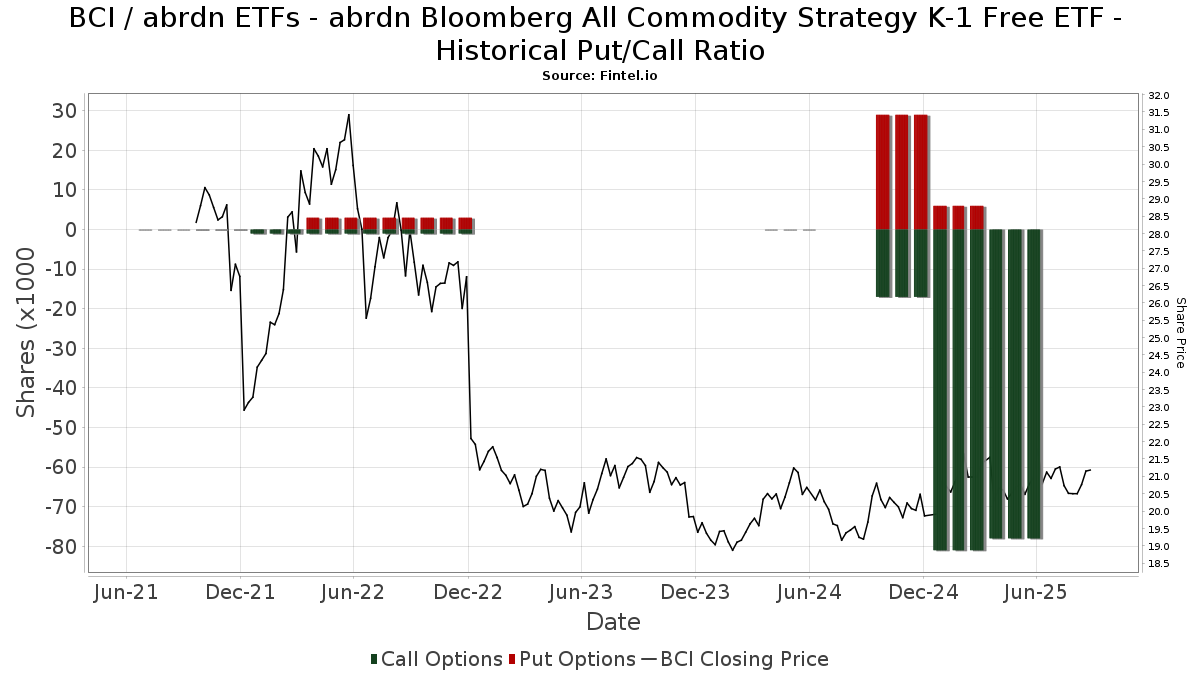
Institutionel Put/Call-forhold
Ud over at indberette standardaktie- og gældsudstedelser skal institutter med mere end 100 mill. aktiver under forvaltning også oplyse deres put- og call-optionsbeholdninger. Da salgsoptioner generelt indikerer negativ stemning, og købsoptioner indikerer positiv stemning, kan vi få en fornemmelse af den overordnede institutionelle stemning ved at plotte forholdet mellem put og kald. Diagrammet til højre viser det historiske put/call-forhold for dette instrument.
Brug af Put/Call Ratio som en indikator for investorernes stemning overvinder en af de vigtigste mangler ved at bruge totalt institutionelt ejerskab, som er, at en betydelig mængde af aktiver under forvaltning investeres passivt for at spore indekser. Passivt forvaltede fonde køber typisk ikke optioner, så indikatoren for put/call-forholdet følger mere nøje følelsen af aktivt forvaltede fonde.
13F og NPORT arkivering
Detaljer om 13F-arkivering er gratis. Detaljer om NP-ansøgninger kræver et premium-medlemskab. Grønne rækker angiver nye positioner. Røde rækker angiver lukkede positioner. Klik på linket ikon for at se den fulde transaktionshistorik.
Opgrader
for at låse premium-data op og eksportere til Excel ![]() .
.
| Fil dato | Kilde | Investor | Type | Gennemsnitlig pris (Øst) |
Aktier | Δ Aktier (%) |
Rapporteret Værdi ($1000) |
Δ Værdi (%) |
Port Alloc (%) |
|
|---|---|---|---|---|---|---|---|---|---|---|
| 2025-08-25 | NP | NDAA - Ned Davis Research 360 Dynamic Allocation ETF | 6.163 | -72,10 | 128 | -72,94 | ||||
| 2025-08-12 | 13F | Aldebaran Capital, Llc | 150.053 | -1,55 | 3.117 | -4,71 | ||||
| 2025-08-12 | 13F | Steward Partners Investment Advisory, Llc | 5.094 | 950,31 | 106 | 950,00 | ||||
| 2025-08-25 | NP | MAINSTAY VP FUNDS TRUST - MainStay VP IQ Hedge Multi-Strategy Portfolio Initial Class | 26.687 | 554 | ||||||
| 2025-07-28 | 13F | Kiker Wealth Management, LLC | 300 | 0,00 | 6 | 0,00 | ||||
| 2025-08-14 | 13F | Smartleaf Asset Management LLC | 2.509 | 52 | ||||||
| 2025-08-14 | 13F | Susquehanna International Group, Llp | 0 | -100,00 | 0 | |||||
| 2025-08-12 | 13F | Accredited Wealth Management, LLC | 22.472 | 467 | ||||||
| 2025-05-05 | 13F | Private Advisor Group, LLC | 0 | -100,00 | 0 | |||||
| 2025-08-13 | 13F | Quadrature Capital Ltd | 207.686 | 4.313 | ||||||
| 2025-08-06 | 13F | Black Swift Group, LLC | 0 | -100,00 | 0 | |||||
| 2025-06-25 | NP | QAI - IQ Hedge Multi-Strategy Tracker ETF | 88.275 | 1.796 | ||||||
| 2025-08-14 | 13F | Sunbelt Securities, Inc. | 2.493 | 0,00 | 49 | -7,55 | ||||
| 2025-08-19 | NP | NORTHWESTERN MUTUAL SERIES FUND INC - Balanced Portfolio | 258.400 | 0,00 | 5.367 | -3,23 | ||||
| 2025-08-04 | 13F | AlphaStar Capital Management, LLC | 164.769 | 3.422 | ||||||
| 2025-08-08 | 13F | Hartland & Co., LLC | 300 | 0,00 | 6 | 0,00 | ||||
| 2025-07-25 | 13F | Concurrent Investment Advisors, LLC | 11.382 | 236 | ||||||
| 2025-07-22 | 13F | MBL Wealth, LLC | 17.424 | -7,22 | 362 | -10,20 | ||||
| 2025-08-07 | 13F | Fund Evaluation Group, LLC | 20.786 | 0,00 | 432 | -3,36 | ||||
| 2025-08-14 | 13F | Ancora Advisors, LLC | 14.700 | 0,00 | 305 | -3,17 | ||||
| 2025-08-07 | 13F | Cahill Financial Advisors Inc | 24.077 | -14,95 | 500 | -17,63 | ||||
| 2025-08-18 | 13F | Hollencrest Capital Management | 28.091 | -2,96 | 583 | -6,12 | ||||
| 2025-08-11 | 13F | United Advisor Group, LLC | 16.704 | 347 | ||||||
| 2025-08-06 | 13F | Csenge Advisory Group | 38.379 | 15,32 | 779 | 13,06 | ||||
| 2025-08-08 | 13F | Creative Planning | 46.137 | -0,19 | 958 | -3,43 | ||||
| 2025-08-14 | 13F | Mml Investors Services, Llc | 30.236 | 35,11 | 1 | |||||
| 2025-08-14 | 13F | UBS Group AG | 5.644 | -34,65 | 117 | -36,76 | ||||
| 2025-08-19 | NP | NORTHWESTERN MUTUAL SERIES FUND INC - Asset Allocation Portfolio | 46.500 | 0,00 | 966 | -3,21 | ||||
| 2025-08-14 | 13F | Wells Fargo & Company/mn | 25.317.919 | 37,02 | 525.853 | 32,61 | ||||
| 2025-04-30 | 13F | Allworth Financial LP | 0 | -100,00 | 0 | |||||
| 2025-07-25 | 13F | Cwm, Llc | 2.272 | 0,00 | 0 | |||||
| 2025-05-15 | 13F/A | Orion Portfolio Solutions, LLC | 97.847 | -5,49 | 2.100 | 2,69 | ||||
| 2025-09-04 | 13F/A | Advisor Group Holdings, Inc. | 3.071 | -29,47 | 64 | -32,26 | ||||
| 2025-08-18 | 13F | Geneos Wealth Management Inc. | 86.201 | -7,94 | 1.790 | -10,90 | ||||
| 2025-07-07 | 13F | Thurston, Springer, Miller, Herd & Titak, Inc. | 4.432 | 19,98 | 92 | 16,46 | ||||
| 2025-07-16 | 13F | ORG Partners LLC | 295 | 6 | ||||||
| 2025-08-07 | 13F | Vise Technologies, Inc. | 189.276 | -1,00 | 3.931 | 4,10 | ||||
| 2025-07-24 | 13F | Ronald Blue Trust, Inc. | 255.394 | 1,79 | 5.305 | -1,49 | ||||
| 2025-07-31 | 13F | Leavell Investment Management, Inc. | 229.861 | 8,39 | 4.774 | 4,90 | ||||
| 2025-08-04 | 13F | Center for Financial Planning, Inc. | 0 | -100,00 | 0 | |||||
| 2025-08-14 | 13F | Royal Bank Of Canada | 1.461.283 | 8,43 | 30.352 | 4,94 | ||||
| 2025-05-05 | 13F | Creekmur Asset Management LLC | 0 | -100,00 | 0 | |||||
| 2025-07-11 | 13F | Farther Finance Advisors, LLC | 1.742 | 97,95 | 36 | 100,00 | ||||
| 2025-04-14 | 13F | Park Avenue Securities Llc | 0 | -100,00 | 0 | |||||
| 2025-04-21 | 13F | Envestnet Portfolio Solutions, Inc. | 0 | -100,00 | 0 | |||||
| 2025-08-26 | NP | TBFC - The Brinsmere Fund - Conservative ETF | 226.990 | 2,68 | 4.715 | -0,63 | ||||
| 2025-07-21 | 13F | Abundance Wealth Counselors | 595.964 | -0,20 | 12 | 0,00 | ||||
| 2025-08-05 | 13F | Verity Asset Management, Inc. | 0 | -100,00 | 0 | |||||
| 2025-08-08 | 13F | Cetera Investment Advisers | 81.527 | -0,83 | 1.693 | -4,02 | ||||
| 2025-08-04 | 13F | Lockheed Martin Investment Management Co | 938.100 | -5,06 | 19.484 | -8,11 | ||||
| 2025-08-13 | 13F | Victory Financial Group, Llc | 38.298 | 5,23 | 795 | 1,53 | ||||
| 2025-07-30 | 13F | Exencial Wealth Advisors, Llc | 28.548 | -18,81 | 593 | -21,49 | ||||
| 2025-08-01 | 13F | Envestnet Asset Management Inc | 349.752 | -11,45 | 7.264 | -14,30 | ||||
| 2025-08-11 | 13F | Principal Securities, Inc. | 8.832 | -9,11 | 183 | -4,19 | ||||
| 2025-07-14 | 13F | GAMMA Investing LLC | 2.090 | 0,00 | 43 | -2,27 | ||||
| 2025-08-14 | 13F | Citadel Advisors Llc | Call | 78.500 | -3,80 | 1.630 | -6,91 | |||
| 2025-07-08 | 13F | Nbc Securities, Inc. | 4.278 | 1.577,65 | 0 | |||||
| 2025-08-13 | 13F | Truvestments Capital Llc | 0 | -100,00 | 0 | |||||
| 2025-05-06 | 13F | Lifeworks Advisors, LLC | 0 | -100,00 | 0 | -100,00 | ||||
| 2025-08-14 | 13F | Atomi Financial Group, Inc. | 13.801 | -35,06 | 287 | -37,28 | ||||
| 2025-08-07 | 13F | Winthrop Capital Management, LLC | 22.654 | 0 | ||||||
| 2025-07-16 | 13F | Diversified Enterprises, LLC | 13.028 | -14,88 | 271 | -17,68 | ||||
| 2025-08-08 | 13F | Crossmark Global Holdings, Inc. | 45.662 | -4,55 | 947 | -7,52 | ||||
| 2025-08-14 | 13F | Disciplina Capital Management LLC | 394.947 | 46,20 | 8.203 | 41,50 | ||||
| 2025-08-08 | 13F | Avantax Advisory Services, Inc. | 12.704 | -34,29 | 264 | -36,47 | ||||
| 2025-08-13 | 13F | Flow Traders U.s. Llc | 0 | -100,00 | 0 | |||||
| 2025-07-29 | 13F | Werba Rubin Papier Wealth Management | 42.484 | 14,83 | 882 | 11,22 | ||||
| 2025-08-08 | 13F | Mason Street Advisors, Llc | 304.900 | 0,00 | 6.333 | -3,22 | ||||
| 2025-08-13 | 13F | Russell Investments Group, Ltd. | 0 | 0 | ||||||
| 2025-08-06 | 13F | First Horizon Advisors, Inc. | 0 | -100,00 | 0 | |||||
| 2025-07-31 | 13F | Resonant Capital Advisors, LLC | 237.666 | -0,13 | 4.936 | -3,35 | ||||
| 2025-08-01 | 13F | Rossby Financial, LCC | 0 | -100,00 | 0 | |||||
| 2025-08-14 | 13F | Raymond James Financial Inc | 321.984 | 702,15 | 6.688 | 676,66 | ||||
| 2025-05-14 | 13F | Huntington National Bank | 5 | -33,33 | ||||||
| 2025-08-14 | 13F | Evergreen Wealth Solutions, LLC | 273.489 | 3,11 | 5.680 | -0,19 | ||||
| 2025-04-23 | 13F | Continuum Advisory, LLC | 0 | -100,00 | 0 | |||||
| 2025-08-08 | 13F | Cornerstone Advisors Asset Management, Inc | 22.712 | -21,21 | 472 | -23,79 | ||||
| 2025-08-14 | 13F | Wiley Bros.-aintree Capital, Llc | 17.770 | -0,79 | 363 | -4,99 | ||||
| 2025-07-24 | 13F | Us Bancorp \de\ | 1.176 | 115,78 | 24 | 118,18 | ||||
| 2025-07-18 | 13F | Truist Financial Corp | 254.562 | -12,82 | 5.287 | -15,62 | ||||
| 2025-08-13 | 13F | Renaissance Technologies Llc | 59.300 | 1.232 | ||||||
| 2025-08-12 | 13F | Global Retirement Partners, LLC | 41 | -91,13 | 1 | -100,00 | ||||
| 2025-08-14 | 13F | CoreCap Advisors, LLC | 9 | -87,84 | 0 | -100,00 | ||||
| 2025-08-27 | 13F/A | Brinker Capital Investments, LLC | 91.922 | -6,06 | 1.909 | -9,05 | ||||
| 2025-08-13 | 13F | Mount Yale Investment Advisors, LLC | 12.525 | 260 | ||||||
| 2025-08-05 | 13F | C2P Capital Advisory Group, LLC d.b.a. Prosperity Capital Advisors | 0 | -100,00 | 0 | |||||
| 2025-07-23 | 13F | Austin Asset Management Co Inc | 29.638 | -0,10 | 616 | -3,30 | ||||
| 2025-08-13 | 13F | Financial & Tax Architects, LLC | 0 | -100,00 | 0 | |||||
| 2025-08-13 | 13F | Avestar Capital, LLC | 103.914 | 20,73 | 2.158 | 16,84 | ||||
| 2025-04-17 | 13F | Rs Crum Inc. | 156.425 | 3.357 | ||||||
| 2025-08-13 | 13F | Leuthold Group, Llc | 36.609 | 0,00 | 760 | -3,18 | ||||
| 2025-08-11 | 13F | Rothschild Investment Llc | 92 | 0,00 | 2 | 0,00 | ||||
| 2025-07-02 | 13F | Boston Standard Wealth Management, LLC | 40.047 | 29,55 | 832 | 32,48 | ||||
| 2025-07-17 | 13F | Keystone Global Partners, LLC | 0 | -100,00 | 0 | |||||
| 2025-08-14 | 13F | Fmr Llc | 267 | 1.113,64 | 6 | |||||
| 2025-08-05 | 13F | Advisors Preferred, LLC | 0 | -100,00 | 0 | |||||
| 2025-08-12 | 13F | Twin Focus Capital Partners, Llc | 0 | -100,00 | 0 | |||||
| 2025-08-13 | 13F | Cresset Asset Management, LLC | 705.422 | 6,35 | 14.652 | 2,92 | ||||
| 2025-08-14 | 13F | Stifel Financial Corp | 486.767 | -3,08 | 10.110 | -6,19 | ||||
| 2025-07-10 | 13F | Signal Advisors Wealth, LLC | 30.806 | 640 | ||||||
| 2025-08-15 | 13F | Morgan Stanley | 2.244.727 | 92,00 | 46.623 | 85,83 | ||||
| 2025-07-31 | 13F | Whipplewood Advisors, LLC | 1.114 | -90,58 | 23 | -14,81 | ||||
| 2025-08-08 | 13F | Empower Advisory Group, LLC | 20.115 | 418 | ||||||
| 2025-08-13 | 13F | Aristides Capital LLC | 30.000 | 0,00 | 623 | -3,11 | ||||
| 2025-07-16 | 13F | Perigon Wealth Management, LLC | 24.492 | -17,55 | 509 | -20,25 | ||||
| 2025-08-14 | 13F | Toroso Investments, LLC | 0 | -100,00 | 0 | |||||
| 2025-08-08 | 13F | MTM Investment Management, LLC | 4.980 | 103 | ||||||
| 2025-07-14 | 13F | AdvisorNet Financial, Inc | 4.371 | 7,77 | 91 | 3,45 | ||||
| 2025-07-31 | 13F | Cambridge Investment Research Advisors, Inc. | 33.156 | -23,53 | 1 | |||||
| 2025-07-10 | 13F | Wealth Enhancement Advisory Services, Llc | 149.107 | -8,26 | 3.143 | -9,87 | ||||
| 2025-07-30 | 13F | Whittier Trust Co | 1.080 | 22 | ||||||
| 2025-07-22 | 13F | Merit Financial Group, LLC | 54.268 | 37,80 | 1.127 | 33,37 | ||||
| 2025-08-14 | 13F | Macquarie Group Ltd | 147.001 | -11,30 | 3.053 | -14,15 | ||||
| 2025-08-19 | 13F | Cape Investment Advisory, Inc. | 581 | -22,84 | 12 | -25,00 | ||||
| 2025-07-30 | 13F | D.a. Davidson & Co. | 11.827 | -37,05 | 246 | -39,21 | ||||
| 2025-08-14 | 13F | Nepc Llc | 2.175.486 | 18,55 | 45.185 | 14,73 | ||||
| 2025-08-11 | 13F | Anfield Capital Management, LLC | 1.021 | 186,80 | 21 | 200,00 | ||||
| 2025-08-11 | 13F | Wealthspire Advisors, LLC | 21.115 | 0,00 | 439 | -3,31 | ||||
| 2025-08-06 | 13F | Walkner Condon Financial Advisors LLC | 30.713 | -16,29 | 638 | -18,93 | ||||
| 2025-08-04 | 13F | Spire Wealth Management | 0 | -100,00 | 0 | |||||
| 2025-08-14 | 13F | Sei Investments Co | 7.953.374 | -17,00 | 165.189 | -19,67 | ||||
| 2025-07-07 | 13F | Upper Left Wealth Management, LLC | 296.586 | 4,50 | 6.160 | 1,15 | ||||
| 2025-05-08 | NP | QALTX - Quantified Alternative Investment Fund Investor Class Shares | 7.900 | 170 | ||||||
| 2025-07-21 | 13F | Ameritas Advisory Services, LLC | 349 | 7 | ||||||
| 2025-05-09 | 13F | Atria Wealth Solutions, Inc. | 0 | -100,00 | 0 | |||||
| 2025-08-14 | 13F | Bank Of America Corp /de/ | 2.577.292 | 34,95 | 53.530 | 30,62 | ||||
| 2025-08-14 | 13F | Mariner, LLC | 29.191 | 606 | ||||||
| 2025-07-29 | 13F | Stratos Wealth Partners, LTD. | 0 | -100,00 | 0 | |||||
| 2025-04-29 | 13F | Td Private Client Wealth Llc | 0 | -100,00 | 0 | |||||
| 2025-08-11 | 13F | Compass Capital Corp /ma/ /adv | 0 | -100,00 | 0 | |||||
| 2025-08-19 | 13F | Advisory Services Network, LLC | 64.723 | 0,36 | 1.336 | -3,47 | ||||
| 2025-08-11 | 13F | Aspen Investment Management Inc | 33.885 | -11,03 | 1 | |||||
| 2025-07-10 | 13F | Oliver Lagore Vanvalin Investment Group | 75 | 2 | ||||||
| 2025-05-14 | 13F | Congress Wealth Management LLC / DE / | 0 | -100,00 | 0 | |||||
| 2025-08-05 | 13F | Sigma Planning Corp | 9.866 | 0,00 | 205 | -3,32 | ||||
| 2025-08-01 | 13F | New York Life Investment Management Llc | 121.072 | 2.515 | ||||||
| 2025-07-30 | 13F | Whittier Trust Co Of Nevada Inc | 2.131 | 0,00 | 44 | -2,22 | ||||
| 2025-08-19 | 13F | Wealth Group, Ltd. | 0 | -100,00 | 0 | |||||
| 2025-08-05 | 13F | Key FInancial Inc | 17 | 0,00 | 0 | |||||
| 2025-04-30 | 13F | Ramiah Investment Group | 50.804 | 38,51 | 1.090 | 53,52 | ||||
| 2025-07-24 | 13F | Callan Family Office, LLC | 13.577 | 0,00 | 282 | -3,44 | ||||
| 2025-08-06 | 13F | Commonwealth Equity Services, Llc | 12.917 | 5,91 | 0 | |||||
| 2025-05-15 | 13F | Fullerton Fund Management Co Ltd | 0 | -100,00 | 0 | |||||
| 2025-08-11 | 13F | HighTower Advisors, LLC | 43.254 | 13,81 | 898 | 10,18 | ||||
| 2025-08-14 | 13F | Vident Advisory, LLC | 22.445 | 91,17 | 466 | 85,66 | ||||
| 2025-07-30 | 13F | Cullen/frost Bankers, Inc. | 0 | -100,00 | 0 | |||||
| 2025-05-15 | 13F | Tower Research Capital LLC (TRC) | 0 | -100,00 | 0 | |||||
| 2025-08-14 | 13F | IHT Wealth Management, LLC | 11.175 | -28,01 | 232 | -30,33 | ||||
| 2025-05-28 | 13F/A | Modern Wealth Management, LLC | 12.301 | 238 | ||||||
| 2025-08-14 | 13F | Bnp Paribas Arbitrage, Sa | 4.698 | 98 | ||||||
| 2025-08-14 | 13F | Alliancebernstein L.p. | 174.950 | 3.634 | ||||||
| 2025-07-11 | 13F | Pinnacle Bancorp, Inc. | 256 | 0,00 | 5 | 0,00 | ||||
| 2025-07-24 | 13F | Comprehensive Money Management Services LLC | 57.211 | -2,78 | 1.188 | -5,86 | ||||
| 2025-08-13 | 13F | Transce3nd, LLC | 13 | 0,00 | 0 | |||||
| 2025-05-08 | 13F | Parkside Financial Bank & Trust | 0 | -100,00 | 0 | -100,00 | ||||
| 2025-07-22 | 13F | Marks Group Wealth Management, Inc | 0 | -100,00 | 0 | |||||
| 2025-08-14 | 13F | GWM Advisors LLC | 50.578 | -17,79 | 1.051 | -20,45 | ||||
| 2025-04-10 | 13F | Retirement Planning Group | 0 | -100,00 | 0 | |||||
| 2025-08-14 | 13F | Comerica Bank | 18.594 | 57,80 | 386 | 53,17 | ||||
| 2025-08-13 | 13F | Jones Financial Companies Lllp | 0 | -100,00 | 0 | |||||
| 2025-07-08 | 13F | Braun-Bostich & Associates Inc. | 0 | -100,00 | 0 | |||||
| 2025-08-08 | 13F | Principal Financial Group Inc | 285.250 | 5.925 | ||||||
| 2025-08-11 | 13F | Citigroup Inc | 9 | 0 | ||||||
| 2025-08-01 | 13F | American Financial & Tax Strategies Inc | 130.550 | -11,82 | 2.712 | -14,67 | ||||
| 2025-07-11 | 13F | Williams Financial, LLC | 0 | -100,00 | 0 | |||||
| 2025-08-06 | 13F | Penserra Capital Management LLC | 598.877 | 2,59 | 12 | 0,00 | ||||
| 2025-07-28 | 13F | Harbour Investments, Inc. | 1.210 | 0,08 | 25 | 0,00 | ||||
| 2025-08-14 | 13F | Citadel Advisors Llc | Put | 0 | -100,00 | 0 | ||||
| 2025-08-06 | 13F | Metis Global Partners, LLC | 7.925.004 | 27,74 | 164.602 | 23,63 | ||||
| 2025-08-14 | 13F | Cohen & Steers, Inc. | 35.159 | -12,70 | 1 | |||||
| 2025-08-04 | 13F | Creative Financial Designs Inc /adv | 150 | 0,00 | 3 | 0,00 | ||||
| 2025-08-04 | 13F | Assetmark, Inc | 330 | 3.566,67 | 7 | |||||
| 2025-07-07 | 13F | Versant Capital Management, Inc | 20 | 0,00 | 0 | |||||
| 2025-07-18 | 13F | SigFig Wealth Management, LLC | 191.010 | 15,87 | 3.988 | 13,59 | ||||
| 2025-04-30 | 13F | ARGI Investment Services, LLC | 0 | -100,00 | 0 | |||||
| 2025-07-24 | 13F | IFP Advisors, Inc | 0 | -100,00 | 0 | |||||
| 2025-05-08 | 13F | Banque Cantonale Vaudoise | 0 | -100,00 | 0 | |||||
| 2025-07-09 | 13F | Bruce G. Allen Investments, LLC | 30.065 | -0,43 | 624 | -3,55 | ||||
| 2025-07-10 | 13F | Stewardship Advisors, LLC | 13.438 | -18,63 | 279 | -21,19 | ||||
| 2025-07-17 | 13F | K2 Financial Inc. | 78.706 | 5,81 | 1.661 | 8,07 | ||||
| 2025-08-11 | 13F | WPG Advisers, LLC | 4.629 | -23,73 | 96 | -26,15 | ||||
| 2025-08-12 | 13F | Rock Creek Group, LP | 0 | -100,00 | 0 | |||||
| 2025-08-12 | 13F | Proequities, Inc. | 0 | 0 | ||||||
| 2025-08-12 | 13F | Jpmorgan Chase & Co | 30 | -93,42 | 1 | -100,00 | ||||
| 2025-08-11 | 13F | Brown Brothers Harriman & Co | 1.900 | 39 | ||||||
| 2025-07-15 | 13F | MCF Advisors LLC | 935.435 | 1,03 | 19.429 | -2,22 | ||||
| 2025-06-05 | 13F | Cim, Llc | 0 | -100,00 | 0 | |||||
| 2025-08-08 | 13F | Pnc Financial Services Group, Inc. | 970 | 0,00 | 20 | 0,00 | ||||
| 2025-07-07 | 13F | Bangor Savings Bank | 2.280 | 0,00 | 47 | -2,08 | ||||
| 2025-06-25 | NP | DPREX - Delaware Global Listed Real Assets Fund CLASS A | 152.691 | -10,44 | 3.107 | -11,13 | ||||
| 2025-08-26 | NP | TBFG - The Brinsmere Fund - Growth ETF | 371.887 | 2,54 | 7.724 | -0,76 | ||||
| 2025-08-13 | 13F | Northwestern Mutual Wealth Management Co | 2.018.914 | 22,64 | 41.933 | 18,70 | ||||
| 2025-08-14 | 13F | Ambassador Advisors, LLC | 22.979 | 2,80 | 477 | -0,42 | ||||
| 2025-08-11 | 13F | Aptus Capital Advisors, LLC | 11.545 | 0,00 | 240 | -3,24 | ||||
| 2025-08-19 | 13F/A | Pitcairn Co | 187.136 | 0,00 | 3.887 | -3,21 | ||||
| 2025-09-10 | NP | LFTEX - Lincoln Inflation Plus Fund Class I | 36.700 | 0,00 | 757 | 1,47 | ||||
| 2025-08-11 | 13F | Great Lakes Advisors, Llc | 1.454.571 | -6,30 | 30.211 | -9,31 | ||||
| 2025-08-12 | 13F | LPL Financial LLC | 144.921 | 11,20 | 3.010 | 7,65 | ||||
| 2025-08-15 | 13F | Captrust Financial Advisors | 43.885 | 39,43 | 911 | 34,96 | ||||
| 2025-08-22 | 13F | Carter Financial Group, INC. | 47.380 | 35,50 | 984 | -1,99 |