Grundlæggende statistik
| Institutionelle aktier (lange) | 255.087.912 - 54,65% (ex 13D/G) - change of -7,58MM shares -3,07% MRQ |
| Institutionel værdi (lang) | $ 12.959.570 USD ($1000) |
Institutionelt ejerskab og aktionærer
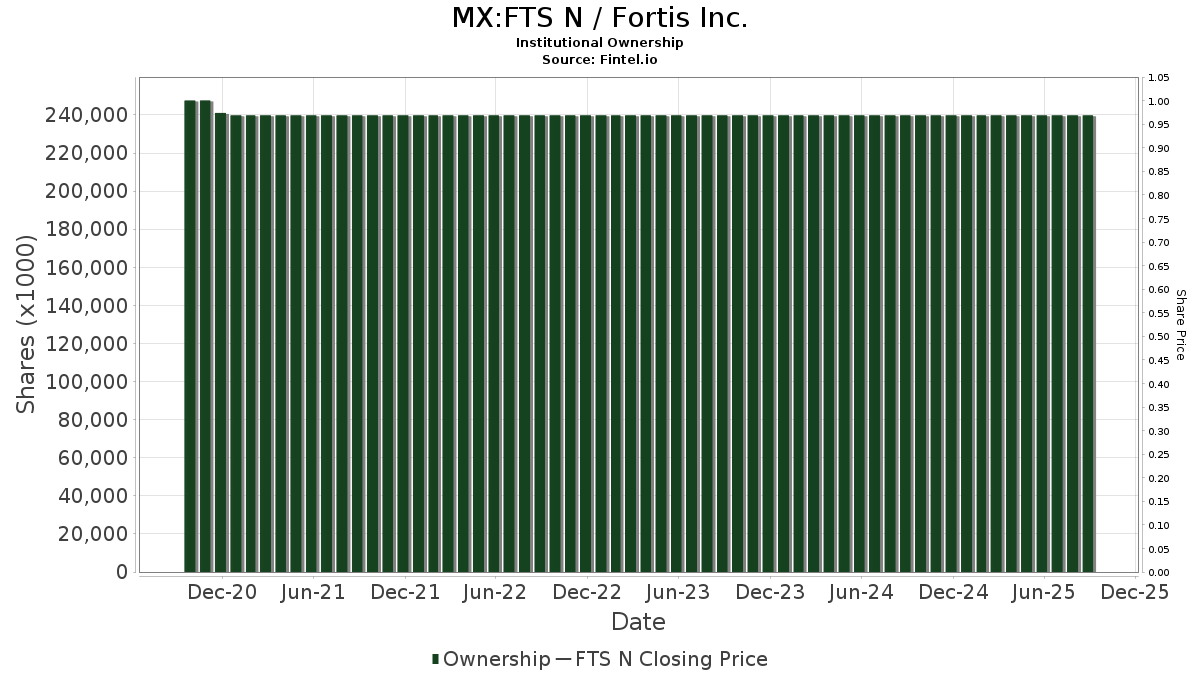
Fortis Inc. (MX:FTS N) har 321 institutionelle ejere og aktionærer, der har indsendt 13D/G- eller 13F-formularer til Securities Exchange Commission (SEC). Disse institutioner har i alt 255,087,912 aktier. Største aktionærer omfatter Royal Bank Of Canada, Bank Of Montreal /can/, Vanguard Group Inc, FIL Ltd, Td Asset Management Inc, Scotia Capital Inc., CIBC World Markets Inc., 1832 Asset Management L.P., National Bank Of Canada /fi/, and Geode Capital Management, Llc .
Fortis Inc. (BMV:FTS N) institutionel ejerskabsstruktur viser aktuelle positioner i virksomheden efter institutioner og fonde, samt seneste ændringer i positionsstørrelse. Større aktionærer kan omfatte individuelle investorer, investeringsforeninger, hedgefonde eller institutioner. Skema 13D angiver, at investoren besidder (eller besidder) mere end 5 % af virksomheden og har til hensigt (eller har til hensigt at) aktivt at forfølge en ændring i forretningsstrategi. Skema 13G indikerer en passiv investering på over 5%.
Fondens stemningsscore
Fund Sentiment Score (fka Ownership Accumulation Score) finder de aktier, der bliver mest købt af fonde. Det er resultatet af en sofistikeret, multi-faktor kvantitativ model, der identificerer virksomheder med de højeste niveauer af institutionel akkumulering. Scoringsmodellen bruger en kombination af den samlede stigning i oplyste ejere, ændringerne i porteføljeallokeringer i disse ejere og andre målinger. Tallet går fra 0 til 100, hvor højere tal indikerer et højere niveau af akkumulering for sine jævnaldrende, og 50 er gennemsnittet.
Opdateringsfrekvens: Dagligt
Se Ownership Explorer, som giver en liste over højest rangerende virksomheder.
AI+ Ask Fintel’s AI assistant about Fortis Inc..
Select a question to share a public post with an AI-crafted answer.
Thinking of good questions…
13F og NPORT arkivering
Detaljer om 13F-arkivering er gratis. Detaljer om NP-ansøgninger kræver et premium-medlemskab. Grønne rækker angiver nye positioner. Røde rækker angiver lukkede positioner. Klik på linket ikon for at se den fulde transaktionshistorik.
Opgrader
for at låse premium-data op og eksportere til Excel ![]() .
.
| Fil dato | Kilde | Investor | Type | Gennemsnitlig pris (Øst) |
Aktier | Δ Aktier (%) |
Rapporteret Værdi ($1000) |
Δ Værdi (%) |
Port Alloc (%) |
|
|---|---|---|---|---|---|---|---|---|---|---|
| 2026-02-17 | 13F | Greenland Capital Management LP | 20.120 | -74,69 | 1.047 | -74,04 | ||||
| 2026-02-11 | 13F | Jpmorgan Chase & Co | 2.470.063 | -2,13 | 128.295 | 0,18 | ||||
| 2026-02-13 | 13F | Aviso Financial Inc. | 0 | -100,00 | 0 | |||||
| 2026-02-11 | 13F | Syon Capital Llc | 8.028 | 417 | ||||||
| 2026-02-09 | 13F | Knights of Columbus Asset Advisors LLC | 76.802 | 5,15 | 3.989 | 7,64 | ||||
| 2026-02-17 | 13F | Maryland State Retirement & Pension System | 577.450 | -5,41 | 30.036 | -2,97 | ||||
| 2026-02-04 | 13F | Heronetta Management, L.P. | 86.000 | 0,00 | 6.137 | 1,09 | ||||
| 2026-01-30 | 13F | Bogart Wealth, LLC | 7 | 0,00 | 0 | |||||
| 2026-02-17 | 13F | Man Group plc | 154.126 | 629,69 | 8.005 | 647,43 | ||||
| 2026-02-17 | 13F | Bank Of America Corp /de/ | 2.370.940 | -5,48 | 123.147 | -3,24 | ||||
| 2026-02-17 | 13F | Glenmede Trust Co Na | 0 | -100,00 | 0 | |||||
| 2026-02-12 | 13F | Northwest & Ethical Investments L.P. | 419.102 | -9,03 | 21.790 | -6,76 | ||||
| 2026-04-22 | 13F | Janney Montgomery Scott LLC | 16.458 | -3,77 | 1 | |||||
| 2026-04-24 | 13F | Triasima Portfolio Management inc. | 256.307 | 2,49 | 14.254 | 9,48 | ||||
| 2026-04-28 | 13F | Argonautica Private Wealth Management, Inc | 12.763 | 6,87 | 712 | 14,84 | ||||
| 2026-02-10 | 13F | Bnp Paribas Arbitrage, Sa | 13.352 | 73,61 | 694 | 77,69 | ||||
| 2026-02-17 | 13F | Two Sigma Investments, Lp | 635.815 | 33.024 | ||||||
| 2026-02-11 | 13F | Metis Global Partners, LLC | 14.740 | -23,62 | 766 | -21,68 | ||||
| 2026-02-17 | 13F | Jones Financial Companies Lllp | 70.339 | -23,39 | 3.653 | -20,48 | ||||
| 2026-04-28 | 13F | SBI Securities Co., Ltd. | 37 | 2,78 | 2 | 100,00 | ||||
| 2026-02-13 | 13F | Wells Fargo & Company/mn | 89.904 | -16,24 | 4.677 | -14,07 | ||||
| 2026-02-12 | 13F | Ensign Peak Advisors, Inc | 32.151 | 0,00 | 1.674 | 2,58 | ||||
| 2026-02-17 | 13F | DZ BANK AG Deutsche Zentral Genossenschafts Bank, Frankfurt am Main | 0 | -100,00 | 0 | -100,00 | ||||
| 2026-04-13 | 13F | JCIC Asset Management Inc. | 6.090 | 1,67 | 339 | 9,00 | ||||
| 2026-04-15 | 13F | Addenda Capital Inc. | 169.950 | -0,72 | 13.190 | 7,97 | ||||
| 2026-04-15 | 13F | Financial Management Professionals, Inc. | 221 | 1,84 | 12 | 9,09 | ||||
| 2026-02-17 | 13F | Energy Income Partners, LLC | 0 | -100,00 | 0 | -100,00 | ||||
| 2026-02-17 | 13F | State Of Wisconsin Investment Board | 176.474 | 9.187 | ||||||
| 2026-02-11 | 13F | Parallel Advisors, LLC | 2.499 | 17,16 | 130 | 19,44 | ||||
| 2026-02-13 | 13F | Clarity Asset Management, Inc. | 612 | 0,66 | 32 | 3,33 | ||||
| 2026-02-18 | 13F | State of Tennessee, Treasury Department | 280.859 | -0,05 | 15.058 | 5,62 | ||||
| 2026-02-17 | 13F | Amundi | 861.275 | 28,03 | 44.735 | 31,73 | ||||
| 2025-11-20 | 13F | Asset Dedication, LLC | 0 | -100,00 | 0 | -100,00 | ||||
| 2026-02-03 | 13F | Crossmark Global Holdings, Inc. | 265.074 | -8,43 | 13.768 | -6,27 | ||||
| 2026-02-12 | 13F | Brinker Capital Investments, LLC | 30.083 | 26,67 | 1.563 | 29,63 | ||||
| 2026-02-20 | 13F | Sunbelt Securities, Inc. | 116 | 0,87 | 6 | 20,00 | ||||
| 2026-02-12 | 13F | Aviva Plc | 1.315.444 | 5,79 | 68.444 | 8,62 | ||||
| 2026-02-13 | 13F | Morgan Stanley | 3.549.885 | 4,81 | 184.381 | 7,29 | ||||
| 2026-03-20 | 13F | Purpose Unlimited Inc. | 64.396 | 3.348 | ||||||
| 2026-02-12 | 13F | Principal Securities, Inc. | 0 | -100,00 | 0 | |||||
| 2026-02-10 | 13F | Norges Bank | 6.462.155 | 335.980 | ||||||
| 2026-04-07 | 13F | Cardinal Capital Management, Inc. | 13.000 | 10,97 | 725 | -13,07 | ||||
| 2026-02-17 | 13F | Agf Management Ltd | 21.824 | 82,90 | 1.361 | 61,64 | ||||
| 2026-02-17 | 13F | SIG North Trading, ULC | Put | 163.900 | 1,42 | 8.513 | 3,82 | |||
| 2026-02-17 | 13F | SIG North Trading, ULC | Call | 376.100 | 46,00 | 19.535 | 49,46 | |||
| 2025-11-14 | 13F | Susquehanna International Group, Llp | Call | 0 | -100,00 | 0 | -100,00 | |||
| 2026-04-13 | 13F | Hm Payson & Co | 368 | 0,00 | 21 | 5,26 | ||||
| 2026-04-23 | 13F | Farmers & Merchants Investments Inc | 95.942 | 4,52 | 5.353 | 12,27 | ||||
| 2025-11-12 | 13F | K.J. Harrison & Partners Inc | 0 | -100,00 | 0 | -100,00 | ||||
| 2025-11-14 | 13F | ExodusPoint Capital Management, LP | 0 | -100,00 | 0 | |||||
| 2026-02-13 | 13F | Towarzystwo Funduszy Inwestycyjnych Pzu Sa | 0 | -100,00 | 0 | |||||
| 2026-02-12 | 13F | BRYN MAWR TRUST Co | 171 | -95,73 | 9 | -96,06 | ||||
| 2026-01-16 | 13F | Verus Wealth Management, Llc | 0 | -100,00 | 0 | |||||
| 2026-02-12 | 13F | BlackRock, Inc. | 1.414.678 | 16,26 | 73.478 | 19,01 | ||||
| 2026-02-12 | 13F | Concorde Asset Management, LLC | 29.000 | 0,00 | 1.506 | 3,51 | ||||
| 2026-02-05 | 13F | Tucker Asset Management Llc | 43 | 2 | ||||||
| 2026-02-10 | 13F | CIBC World Markets Inc. | 8.564.134 | 8,59 | 445.335 | 11,35 | ||||
| 2026-02-17 | 13F | D. E. Shaw & Co., Inc. | 246.462 | -37,67 | 12.810 | -36,13 | ||||
| 2026-02-06 | 13F | Harvest Portfolios Group Inc. | 85.867 | 5,93 | 4.464 | 8,59 | ||||
| 2026-02-13 | 13F | Candriam Luxembourg S.C.A. | 6.773 | 0,00 | 353 | 2,62 | ||||
| 2026-02-10 | 13F | CIBC Asset Management Inc | 2.655.787 | -8,20 | 138.443 | -5,74 | ||||
| 2026-02-17 | 13F | Toronto Dominion Bank | 3.806.142 | -29,34 | 197.894 | -27,50 | ||||
| 2026-02-17 | 13F | Toronto Dominion Bank | Put | 171.000 | 3,89 | 8.891 | 6,51 | |||
| 2026-02-17 | 13F | Toronto Dominion Bank | Call | 243.500 | -57,86 | 12.660 | -56,80 | |||
| 2026-01-27 | 13F | Lorne Steinberg Wealth Management Inc. | 5.779 | 301 | ||||||
| 2026-02-13 | 13F | Barclays Plc | 80.809 | 416,45 | 4.197 | 429,26 | ||||
| 2026-02-19 | 13F | Invesco Ltd. | 1.314.274 | 1,57 | 68.263 | 3,97 | ||||
| 2026-02-17 | 13F | Twinbeech Capital Lp | 0 | -100,00 | 0 | |||||
| 2026-04-09 | 13F | Pacifica Partners Inc. | 9.486 | -1,04 | 528 | 6,45 | ||||
| 2026-01-30 | 13F/A | M&t Bank Corp | 9.498 | 1,05 | 493 | 3,57 | ||||
| 2026-02-12 | 13F | Jane Street Group, Llc | 82.242 | -34,10 | 4.272 | -32,54 | ||||
| 2026-02-13 | 13F | Kilter Group LLC | 7 | 75,00 | 0 | |||||
| 2026-02-13 | 13F | Great West Life Assurance Co /can/ | 591.059 | -1,65 | 31 | 0,00 | ||||
| 2026-02-13 | 13F | Citigroup Inc | 360.376 | 14,89 | 18.761 | 17,90 | ||||
| 2026-02-17 | 13F | Lazard Asset Management Llc | 22.391 | -7,73 | 1.164 | -5,37 | ||||
| 2026-04-24 | 13F | Mitchell & Pahl Private Wealth, Llc | 18.046 | 3,04 | 1.007 | 10,67 | ||||
| 2026-02-13 | 13F | JustInvest LLC | 6.198 | -15,49 | 322 | -13,71 | ||||
| 2026-02-13 | 13F/A | Ontario Teachers Pension Plan Board | 0 | -100,00 | 0 | -100,00 | ||||
| 2026-02-13 | 13F | Bank Of Nova Scotia | 4.405.195 | -12,52 | 229.024 | -10,33 | ||||
| 2026-02-12 | 13F | Grey Fox Wealth Advisors, LLC | 0 | -100,00 | 0 | |||||
| 2026-04-21 | 13F | Value Partners Investments Inc. | 98.796 | -12,60 | 5.501 | -6,54 | ||||
| 2026-02-17 | 13F | Tower Research Capital LLC (TRC) | 997 | -90,43 | 52 | -90,34 | ||||
| 2026-04-07 | 13F | Mb, Levis & Associates, Llc | 77 | 0,00 | 4 | 33,33 | ||||
| 2026-04-21 | 13F | Financial Consulate, Inc | 84 | 600,00 | 5 | |||||
| 2026-01-23 | 13F | LOM Asset Management Ltd | 835 | 60 | ||||||
| 2026-01-23 | 13F | Westside Investment Management, Inc. | 345 | 0,00 | 18 | 0,00 | ||||
| 2026-02-04 | 13F | Swiss Life Asset Management Ltd | 69.944 | 8,82 | 3.636 | 11,37 | ||||
| 2026-03-03 | 13F/A | Caitong International Asset Management Co., Ltd | 2.197 | 85,40 | 114 | 90,00 | ||||
| 2026-02-11 | 13F | Simplex Trading, Llc | Call | 600 | -40,00 | 31 | ||||
| 2026-02-13 | 13F | First Trust Advisors Lp | 880.443 | -2,00 | 45.739 | 0,34 | ||||
| 2026-01-26 | 13F | Private Trust Co Na | 330 | -23,08 | 17 | -19,05 | ||||
| 2026-01-29 | 13F | Richard C. Young & CO., LTD. | 134.237 | -2,62 | 6.972 | -0,31 | ||||
| 2025-11-07 | 13F | Shell Asset Management Co | 45.623 | -38,37 | 2 | -33,33 | ||||
| 2026-02-17 | 13F | Guardian Partners Inc. | 307.660 | 2,41 | 16.638 | 9,63 | ||||
| 2025-10-30 | 13F | Ridgewood Investments LLC | 0 | -100,00 | 0 | -100,00 | ||||
| 2026-04-21 | 13F | Vise Technologies, Inc. | 19.842 | 0,00 | 1.031 | 0,00 | ||||
| 2026-02-06 | 13F | Newport Trust Co | 9.909 | 1,80 | 515 | 4,26 | ||||
| 2026-02-11 | 13F | Group One Trading, L.p. | 0 | -100,00 | 0 | -100,00 | ||||
| 2026-04-22 | 13F | Viewpoint Investment Partners Corp | 10.247 | 537 | ||||||
| 2026-01-27 | 13F | Evergreen Capital Management Llc | 6.398 | -5,99 | 332 | -3,77 | ||||
| 2026-01-29 | 13F | Copeland Capital Management, LLC | 57 | 0,00 | 3 | 0,00 | ||||
| 2026-02-17 | 13F | Wellington Management Group Llp | 0 | -100,00 | 0 | |||||
| 2026-02-10 | 13F | Quantbot Technologies LP | 0 | -100,00 | 0 | |||||
| 2026-01-20 | 13F | Cromwell Holdings LLC | 1.850 | 0,71 | 96 | 3,23 | ||||
| 2026-02-17 | 13F | Susquehanna International Group, Llp | 8.661 | 37,26 | 450 | 40,31 | ||||
| 2025-11-10 | 13F | Clear Creek Financial Management, LLC | 0 | -100,00 | 0 | -100,00 | ||||
| 2026-02-17 | 13F | Voloridge Investment Management, Llc | 0 | -100,00 | 0 | |||||
| 2026-02-13 | 13F | Squarepoint Ops LLC | 0 | -100,00 | 0 | |||||
| 2026-04-22 | 13F | Stone House Investment Management, LLC | 14 | 0,00 | 1 | |||||
| 2026-02-06 | 13F | Larson Financial Group LLC | 1.343 | 81,73 | 70 | 86,49 | ||||
| 2026-02-13 | 13F | BNP Paribas Asset Management Holding S.A. | 49.413 | 4 | ||||||
| 2026-04-21 | 13F | Hennessy Advisors Inc | 94.176 | 0,00 | 5.254 | 7,42 | ||||
| 2026-02-10 | 13F | Gulf International Bank (UK) Ltd | 24.578 | 0,17 | 1 | 0,00 | ||||
| 2026-04-22 | 13F | Pictet Asset Management Holding SA | 291.583 | -1,78 | 16.216 | 4,93 | ||||
| 2026-04-08 | 13F | Community Financial Services Group, LLC | 1.727 | 97 | ||||||
| 2026-04-28 | 13F | DGS Capital Management, LLC | 50.519 | 2,40 | 2.818 | 9,99 | ||||
| 2026-02-11 | 13F | Allianz Asset Management GmbH | 7.919 | -72,84 | 412 | -72,12 | ||||
| 2026-01-21 | 13F | Newbridge Financial Services Group, Inc. | 400 | 21 | ||||||
| 2026-02-17 | 13F | Creative Planning | 205.655 | 97,13 | 10.682 | 101,79 | ||||
| 2026-02-13 | 13F | Sienna Gestion | 0 | -100,00 | 0 | |||||
| 2026-02-17 | 13F | Advisor Group Holdings, Inc. | 6.373 | 11,12 | 331 | 14,53 | ||||
| 2026-02-17 | 13F | Advisory Services Network, LLC | 5.002 | 35,67 | 260 | 38,50 | ||||
| 2026-02-12 | 13F | Steward Partners Investment Advisory, Llc | 295 | 0,00 | 15 | 7,14 | ||||
| 2026-04-23 | 13F | Lansforsakringar Fondforvaltning AB (publ) | 115.172 | 1,82 | 6.405 | 8,76 | ||||
| 2026-02-12 | 13F | UniSuper Management Pty Ltd | 10.100 | 18,82 | 721 | 20,00 | ||||
| 2026-01-23 | 13F | Assetmark, Inc | 114 | 0,00 | 6 | 0,00 | ||||
| 2026-02-13 | 13F | Aigen Investment Management, Lp | 18.890 | 1.146 | ||||||
| 2026-04-13 | 13F | Mather Group, Llc. | 25 | 1 | ||||||
| 2026-02-11 | 13F | Letko, Brosseau & Associates Inc | 7.900 | 0,00 | 411 | 2,75 | ||||
| 2026-02-11 | 13F | West Family Investments, Inc. | 5.219 | -4,12 | 271 | -1,81 | ||||
| 2026-02-13 | 13F | SRS Capital Advisors, Inc. | 957 | -75,07 | 50 | -74,74 | ||||
| 2025-11-13 | 13F | Glenmede Investment Management, LP | 11.878 | 0,00 | 603 | 6,36 | ||||
| 2026-02-18 | 13F | Guardian Capital Lp | 737.570 | 3,62 | 38.365 | 6,24 | ||||
| 2026-04-20 | 13F | Ritholtz Wealth Management | 6.821 | 381 | ||||||
| 2026-02-18 | 13F | Vident Advisory, LLC | 15.822 | -13,01 | 822 | -10,95 | ||||
| 2025-12-18 | 13F | Danske Bank A/s | 0 | -100,00 | 0 | |||||
| 2026-02-10 | 13F | Forsta Ap-fonden | 139.700 | -6,05 | 7.273 | -3,61 | ||||
| 2026-02-13 | 13F | Mariner, LLC | 39.564 | 14,24 | 2.055 | 16,96 | ||||
| 2026-04-22 | 13F | Canoe Financial LP | 6.919 | -8,91 | 386 | -2,28 | ||||
| 2026-02-13 | 13F | Beutel, Goodman & Co Ltd. | 4.319.468 | -36,68 | 225 | -35,26 | ||||
| 2026-02-11 | 13F | Fiera Capital Corp | 838.298 | -10,51 | 43.598 | -8,21 | ||||
| 2026-02-13 | 13F | Public Sector Pension Investment Board | 0 | -100,00 | 0 | |||||
| 2026-02-13 | 13F | Arrowstreet Capital, Limited Partnership | 682.972 | -52,71 | 35.502 | -51,53 | ||||
| 2026-04-20 | 13F | Assenagon Asset Management S.A. | 19.052 | -98,07 | 1.060 | -97,93 | ||||
| 2026-04-22 | 13F | Gold Investment Management Ltd. | 81.445 | 1,93 | 4.539 | 9,27 | ||||
| 2026-02-13 | 13F | Verition Fund Management LLC | 67.855 | 3.524 | ||||||
| 2026-02-17 | 13F | Ewing Morris & Co. Investment Partners Ltd. | 64.408 | 0,22 | 3.394 | 4,11 | ||||
| 2026-01-26 | 13F | Cwm, Llc | 371 | 0,00 | 0 | |||||
| 2026-02-17 | 13F | Graham Capital Management, L.P. | 33.914 | 1.761 | ||||||
| 2026-02-13 | 13F | National Bank Of Canada /fi/ | Call | 4.673 | -5,19 | 24.293 | -2,84 | |||
| 2026-02-06 | 13F | GPS Wealth Strategies Group, LLC | 0 | -100,00 | 0 | |||||
| 2026-04-21 | 13F | Nemes Rush Group LLC | 102 | 0,99 | 6 | 0,00 | ||||
| 2026-02-10 | 13F | Savant Capital, LLC | 24.317 | 4,31 | 1.263 | 6,85 | ||||
| 2026-04-13 | 13F | Trust Co | 13 | 0,00 | 1 | |||||
| 2026-02-17 | 13F | Cetera Investment Advisers | 23.240 | 5,30 | 1.207 | 7,86 | ||||
| 2026-02-13 | 13F | National Bank Of Canada /fi/ | Put | 291 | -7,91 | 1.513 | -5,62 | |||
| 2026-01-29 | 13F | Dunhill Financial, LLC | 318 | 0,00 | 17 | 0,00 | ||||
| 2026-02-17 | 13F | Millennium Management Llc | 0 | -100,00 | 0 | |||||
| 2026-01-30 | 13F | Us Bancorp \de\ | 19.231 | 4,69 | 999 | 7,08 | ||||
| 2026-02-06 | 13F | EverSource Wealth Advisors, LLC | 3.303 | -0,42 | 172 | 1,79 | ||||
| 2026-02-17 | 13F | Nearwater Capital Markets, Ltd | 0 | -100,00 | 0 | |||||
| 2026-02-17 | 13F | Trexquant Investment LP | 117.951 | 61,82 | 6.126 | 65,66 | ||||
| 2026-04-27 | 13F | HB Wealth Management, LLC | 3.758 | 210 | ||||||
| 2026-04-14 | 13F | American State Bank (Iowa) | 0 | -100,00 | 0 | |||||
| 2026-02-12 | 13F | Renaissance Technologies Llc | 658.952 | -35,19 | 34.226 | -33,66 | ||||
| 2026-01-15 | 13F | J. Safra Sarasin Holding AG | 6.784 | 35,33 | 353 | 38,98 | ||||
| 2026-01-28 | 13F | Davis-rea Ltd. | 165.411 | 1,75 | 8.605 | 4,29 | ||||
| 2026-04-20 | 13F | Miller Howard Investments Inc /ny | 24.613 | 7,58 | 1.373 | 15,57 | ||||
| 2026-04-24 | 13F | Root Financial Partners, LLC | 24 | 50,00 | 1 | |||||
| 2026-02-13 | 13F | Neuberger Berman Group LLC | 123.901 | 4,01 | 6.450 | 6,74 | ||||
| 2026-01-16 | 13F | Ronald Blue Trust, Inc. | 0 | -100,00 | 0 | |||||
| 2026-04-22 | 13F | QV Investors Inc. | 853.037 | -5,19 | 47 | 2,17 | ||||
| 2026-02-04 | 13F | Beverly Hills Private Wealth, LLC | 7.394 | 0,00 | 375 | 0,00 | ||||
| 2026-04-27 | 13F | Truist Financial Corp | 14.450 | -2,08 | 806 | 5,22 | ||||
| 2026-02-05 | 13F | Gabelli Funds Llc | 166.150 | -0,48 | 8.649 | 2,10 | ||||
| 2026-04-06 | 13F | Versant Capital Management, Inc | 10.609 | 9,03 | 592 | 17,03 | ||||
| 2026-02-05 | 13F | AlphaCore Capital LLC | 7.387 | -6,38 | 384 | -4,25 | ||||
| 2026-02-17 | 13F | Ninepoint Partners LP | 59.008 | -1,15 | 3.065 | 1,19 | ||||
| 2026-02-17 | 13F | Northern Trust Corp | 293.571 | -25,49 | 15.248 | -23,73 | ||||
| 2026-02-17 | 13F | Investment Management Corp of Ontario | 61.954 | 232,98 | 3.218 | 240,78 | ||||
| 2026-03-18 | 13F | Employees Provident Fund Board | 0 | -100,00 | 0 | |||||
| 2026-04-24 | 13F | Private Advisor Group, LLC | 18.132 | 0,02 | 1.012 | 7,44 | ||||
| 2026-02-17 | 13F | Brevan Howard Capital Management LP | 0 | -100,00 | 0 | |||||
| 2026-04-21 | 13F | Venturi Wealth Management, LLC | 5.155 | 288 | ||||||
| 2026-02-10 | 13F | Envestnet Asset Management Inc | 141.751 | -6,07 | 7.363 | -3,85 | ||||
| 2026-02-05 | 13F | Cambridge Investment Research Advisors, Inc. | 6.852 | 1,56 | 0 | |||||
| 2026-02-17 | 13F | Aqr Capital Management Llc | 211.926 | 599,59 | 11.016 | 616,72 | ||||
| 2026-02-13 | 13F | Stifel Financial Corp | 45.088 | 1,14 | 2.342 | 3,49 | ||||
| 2026-02-13 | 13F | Baird Financial Group, Inc. | 36.987 | 8,01 | 1.921 | 10,59 | ||||
| 2026-02-13 | 13F | Van Eck Associates Corp | 197.441 | 7,73 | 10 | 11,11 | ||||
| 2026-02-05 | 13F | Allworth Financial LP | 1.154 | -11,84 | 60 | -10,61 | ||||
| 2026-02-17 | 13F | Balyasny Asset Management Llc | 125.117 | -24,13 | 6.499 | -22,34 | ||||
| 2026-02-12 | 13F | Bank Of Nova Scotia Trust Co | 391.593 | -1,54 | 20.339 | 0,79 | ||||
| 2026-02-11 | 13F | Deutsche Bank Ag\ | 984.532 | 0,07 | 51.137 | 2,44 | ||||
| 2026-04-24 | 13F | Washington Capital Management Inc | 18.740 | 0,00 | 1.046 | 7,40 | ||||
| 2026-02-02 | 13F | Intact Investment Management Inc. | 921.744 | -2,46 | 47.920 | -0,04 | ||||
| 2026-02-04 | 13F | Kepler Cheuvreux (Suisse) SA | 0 | -100,00 | 0 | |||||
| 2026-02-04 | 13F | Mascoma Wealth Management LLC | 91 | 0,00 | 5 | 0,00 | ||||
| 2026-04-13 | 13F | Baskin Financial Services Inc. | 6.089 | -18,26 | 0 | |||||
| 2026-01-29 | 13F | Vanguard Group Inc | 24.129.958 | 2,27 | 1.254.541 | 4,83 | ||||
| 2026-02-09 | 13F | Huntington National Bank | 3.021 | 0,00 | 157 | 1,96 | ||||
| 2026-02-12 | 13F | Federation des caisses Desjardins du Quebec | 1.315.586 | 0,55 | 68.375 | 3,64 | ||||
| 2026-02-11 | 13F | Tacita Capital Inc | 57.596 | 1,27 | 2.996 | 3,81 | ||||
| 2026-02-06 | 13F | Bare Financial Services, Inc | 111 | 0,00 | 6 | 0,00 | ||||
| 2026-04-07 | 13F | Signaturefd, Llc | 37.839 | 0,74 | 2.111 | 8,26 | ||||
| 2026-02-10 | 13F | Godfrey Financial Associates, Inc. | 16 | 1 | ||||||
| 2026-02-12 | 13F | Brown Brothers Harriman & Co | 253 | 488,37 | 13 | 550,00 | ||||
| 2026-02-13 | 13F | Kestra Advisory Services, LLC | 2.277 | 118 | ||||||
| 2026-02-13 | 13F | MAI Capital Management | 1.370 | -26,07 | 71 | -24,47 | ||||
| 2026-02-13 | 13F | Natixis | 26.499 | 38,72 | 1.376 | 42,00 | ||||
| 2026-04-24 | 13F | Ninety One UK Ltd | 93.518 | -26,83 | 5.201 | -21,84 | ||||
| 2026-02-13 | 13F | Rhumbline Advisers | 12.470 | -11,65 | 648 | -9,64 | ||||
| 2026-02-17 | 13F | Utah Retirement Systems | 55.938 | 0,00 | 2.912 | 2,64 | ||||
| 2026-02-19 | 13F | Atomi Financial Group, Inc. | 5.247 | 15,67 | 273 | 18,26 | ||||
| 2026-02-12 | 13F | Quadrant Capital Group Llc | 3.009 | 1,28 | 156 | 4,00 | ||||
| 2026-02-17 | 13F | BCV Asset Management Inc. | 104.845 | 7.755 | ||||||
| 2026-02-17 | 13F | Laird Norton Trust Company, Llc | 11.897 | 618 | ||||||
| 2026-04-10 | 13F | Country Trust Bank | 0 | -100,00 | 0 | |||||
| 2026-02-17 | 13F | Ameriprise Financial Inc | 16.244 | -1,25 | 984 | 0,61 | ||||
| 2026-02-17 | 13F | Millennium Management Llc | Put | 25.000 | 0,00 | 1.784 | 1,13 | |||
| 2026-02-14 | 13F | Rockefeller Capital Management L.P. | 2.082 | 0,53 | 108 | 2,86 | ||||
| 2026-02-17 | 13F | Mercer Global Advisors Inc /adv | 9.995 | 11,60 | 519 | 14,32 | ||||
| 2026-02-09 | 13F | Harbour Investments, Inc. | 339 | 0,00 | 18 | 0,00 | ||||
| 2026-02-13 | 13F | Ubs Asset Management Americas Inc | 651 | 34 | ||||||
| 2026-02-13 | 13F | Alberta Investment Management Corp | 100.300 | 5.215 | ||||||
| 2026-02-05 | 13F | John G Ullman & Associates Inc | 3.900 | 203 | ||||||
| 2026-02-17 | 13F | FIL Ltd | 19.898.613 | 9,14 | 1.034.545 | 11,87 | ||||
| 2026-02-17 | 13F | Silvercrest Asset Management Group Llc | 6.182 | 0,00 | 321 | 2,56 | ||||
| 2026-04-13 | 13F | True Wealth Design, LLC | 300 | 114,29 | 17 | 128,57 | ||||
| 2026-04-15 | 13F | Trust Co Of Toledo Na /oh/ | 597 | 0,00 | 33 | 6,45 | ||||
| 2026-02-05 | 13F | Bessemer Group Inc | 621 | 31,57 | 0 | |||||
| 2026-02-12 | 13F | Swiss National Bank | 1.334.782 | -7,51 | 69.538 | -5,04 | ||||
| 2026-02-17 | 13F | PDT Partners, LLC | 11.600 | 0,00 | 603 | 2,38 | ||||
| 2026-02-10 | 13F/A | Northwestern Mutual Wealth Management Co | 10.410 | 131,44 | 541 | 136,84 | ||||
| 2026-02-12 | 13F | APG Asset Management N.V. | 255.797 | -6,92 | 11.338 | -4,44 | ||||
| 2026-02-11 | 13F | Westerkirk Capital Inc. | 1.410 | -93,32 | 73 | -93,18 | ||||
| 2026-04-14 | 13F | Nbc Securities, Inc. | 1.048 | -3,14 | 58 | 3,57 | ||||
| 2026-02-13 | 13F | Healthcare Of Ontario Pension Plan Trust Fund | 146.000 | 0,00 | 7.591 | 2,54 | ||||
| 2026-03-20 | 13F/A | Hsbc Holdings Plc | 0 | -100,00 | 0 | -100,00 | ||||
| 2026-01-29 | 13F | Concord Wealth Partners | 300 | 0,00 | 16 | 0,00 | ||||
| 2026-02-06 | 13F | HighTower Advisors, LLC | 4.220 | 219 | ||||||
| 2026-02-09 | 13F | Legal & General Group Plc | 5.954.579 | 1,55 | 309.966 | 4,19 | ||||
| 2026-04-13 | 13F | IFP Advisors, Inc | 70 | 0,00 | 4 | 0,00 | ||||
| 2025-11-14 | 13F | Cubist Systematic Strategies, LLC | 7.868 | 399 | ||||||
| 2025-11-14 | 13F | SIG North Trading, ULC | 0 | -100,00 | 0 | -100,00 | ||||
| 2026-02-10 | 13F | State of Wyoming | 0 | -100,00 | 0 | |||||
| 2026-04-20 | 13F | Cardinal Point Capital Management, ULC | 10.615 | 0,13 | 591 | 7,26 | ||||
| 2026-02-12 | 13F | Bank Of Montreal /can/ | Put | 3.800 | -19,15 | 198 | -17,23 | |||
| 2026-02-12 | 13F | Bank Of Montreal /can/ | Call | 240.000 | 8.471,43 | 12.478 | 8.749,65 | |||
| 2026-02-12 | 13F | Bank Of Montreal /can/ | 24.521.460 | 6,01 | 1.274.917 | 8,69 | ||||
| 2026-02-17 | 13F | Quadrature Capital Ltd | 314.801 | 16.387 | ||||||
| 2026-02-13 | 13F | Dixon Mitchell Investment Counsel Inc. | 2.640 | 137 | ||||||
| 2026-02-18 | 13F | Mackenzie Financial Corp | 3.343.961 | 4,55 | 173.752 | 7,12 | ||||
| 2026-02-13 | 13F | Ieq Capital, Llc | 8.921 | 8,71 | 463 | 11,30 | ||||
| 2026-02-17 | 13F | Wiley Bros.-aintree Capital, Llc | 9.092 | 7,29 | 472 | 10,02 | ||||
| 2025-11-12 | 13F | Group One Trading, L.p. | Call | 0 | -100,00 | 0 | -100,00 | |||
| 2026-02-13 | 13F | Mml Investors Services, Llc | 17.545 | -4,59 | 911 | -2,36 | ||||
| 2026-04-10 | 13F | Pure Financial Advisors, Inc. | 4.542 | 253 | ||||||
| 2026-02-13 | 13F | BRITISH COLUMBIA INVESTMENT MANAGEMENT Corp | 264.928 | -8,59 | 13.774 | -6,28 | ||||
| 2026-01-14 | 13F | Eastern Bank | 0 | -100,00 | 0 | |||||
| 2026-02-06 | 13F | Global Retirement Partners, LLC | 50 | -98,00 | 3 | -98,41 | ||||
| 2026-04-08 | 13F | Wealth Enhancement Advisory Services, Llc | 4.263 | 242 | ||||||
| 2026-02-10 | 13F | Intech Investment Management Llc | 13.693 | 58,54 | 713 | 62,56 | ||||
| 2026-02-13 | 13F | Bollard Group LLC | 149.996 | -12,67 | 8 | -12,50 | ||||
| 2026-02-23 | 13F | Mv Capital Management, Inc. | 5 | 0 | ||||||
| 2026-02-17 | 13F | Canada Pension Plan Investment Board | 2.441.148 | -9,10 | 126.920 | -6,80 | ||||
| 2026-04-06 | 13F | GAMMA Investing LLC | 416 | 0,00 | 23 | 9,52 | ||||
| 2026-02-10 | 13F | Hillsdale Investment Management Inc. | 783.178 | -3,69 | 40.791 | -1,08 | ||||
| 2026-04-17 | 13F | Ignite Planners, LLC | 7.832 | -2,19 | 435 | 1,87 | ||||
| 2026-02-12 | 13F | Campbell & CO Investment Adviser LLC | 0 | -100,00 | 0 | |||||
| 2026-04-17 | 13F | AdvisorNet Financial, Inc | 0 | -100,00 | 0 | |||||
| 2026-02-11 | 13F | Franklin Resources Inc | 811.632 | 2,43 | 42.198 | 5,02 | ||||
| 2026-04-21 | 13F | Aaron Wealth Advisors LLC | 8.960 | 500 | ||||||
| 2026-02-17 | 13F | Captrust Financial Advisors | 6.426 | 0,94 | 334 | 3,10 | ||||
| 2025-11-21 | 13F/A | Royal Bank Of Canada | Call | 0 | -100,00 | 0 | -100,00 | |||
| 2026-04-15 | 13F | Compagnie Lombard Odier SCmA | 1.488 | 0,00 | 83 | 6,49 | ||||
| 2026-01-15 | 13F | Mn Services Vermogensbeheer B.V. | 193.104 | 2,99 | 10 | 11,11 | ||||
| 2026-02-17 | 13F | Credit Agricole S A | 12.069 | 4,80 | 627 | 7,19 | ||||
| 2026-01-27 | 13F | Zurcher Kantonalbank (Zurich Cantonalbank) | 175.760 | 40,46 | 9.150 | 44,12 | ||||
| 2026-02-06 | 13F | Pnc Financial Services Group, Inc. | 2.813 | 54,90 | 146 | 58,70 | ||||
| 2026-02-12 | 13F | Scotia Capital Inc. | 9.372.669 | 2,28 | 486.866 | 5,44 | ||||
| 2026-02-17 | 13F | Russell Investments Group, Ltd. | 193.754 | 10,39 | 10.083 | 13,45 | ||||
| 2025-10-30 | 13F | Twin Peaks Wealth Advisors, LLC | 0 | -100,00 | 0 | -100,00 | ||||
| 2026-02-13 | 13F | Woodbridge CO LTD | 601.750 | 0,00 | 31.255 | 2,36 | ||||
| 2025-11-14 | 13F | Atom Investors LP | 0 | -100,00 | 0 | -100,00 | ||||
| 2025-11-12 | 13F | NewSquare Capital LLC | 0 | -100,00 | 0 | -100,00 | ||||
| 2026-04-13 | 13F | Creative Financial Designs Inc /adv | 2.382 | -21,41 | 133 | -15,92 | ||||
| 2026-02-09 | 13F | Geode Capital Management, Llc | 6.593.417 | 5,99 | 357.381 | 9,20 | ||||
| 2026-02-11 | 13F | CoreFirst Bank & Trust | 0 | -100,00 | 0 | |||||
| 2026-02-13 | 13F | American Century Companies Inc | 133.156 | 18,73 | 6.923 | 21,69 | ||||
| 2026-02-13 | 13F | National Bank Of Canada /fi/ | 7.340.045 | 4,86 | 380.973 | 7,69 | ||||
| 2026-04-17 | 13F | Cache Advisors, LLC | 147 | 11 | ||||||
| 2026-01-15 | 13F | Bernard Wealth Management Corp. | 195 | 0,00 | 10 | 11,11 | ||||
| 2026-04-17 | 13F | Brown, Lisle/cummings, Inc. | 10 | 1 | ||||||
| 2026-02-11 | 13F | Capital World Investors | 41.721 | 23,49 | 2.169 | 26,62 | ||||
| 2026-02-09 | 13F | Kingsview Wealth Management, LLC | 4.954 | 7,58 | 257 | 10,30 | ||||
| 2026-02-17 | 13F | Raymond James Financial Inc | 40.358 | -4,12 | 2.096 | -1,83 | ||||
| 2026-02-13 | 13F | Parkside Financial Bank & Trust | 117 | 67,14 | 6 | 100,00 | ||||
| 2026-02-11 | 13F | Coleford Investment Management Ltd. | 206.705 | -0,41 | 10.753 | 2,26 | ||||
| 2026-02-13 | 13F | Kayne Anderson Rudnick Investment Management Llc | 807.749 | -3,12 | 41.955 | -0,83 | ||||
| 2026-02-17 | 13F | Citadel Advisors Llc | 346.192 | 281,37 | 17.981 | 290,47 | ||||
| 2026-02-17 | 13F | Optiver Holding B.V. | 0 | -100,00 | 0 | |||||
| 2026-02-02 | 13F | Benjamin Edwards Inc | 5.153 | 6,93 | 268 | 9,43 | ||||
| 2026-02-12 | 13F | Commonwealth Equity Services, Llc | 11.331 | 4,98 | 589 | |||||
| 2026-02-13 | 13F | Marshall Wace, Llp | 31.590 | 1.641 | ||||||
| 2026-02-03 | 13F | Strengthening Families & Communities, LLC | 0 | -100,00 | 0 | |||||
| 2026-02-11 | 13F | Cerity Partners LLC | 10.315 | -3,89 | 536 | -1,65 | ||||
| 2026-02-10 | 13F | Bank of New York Mellon Corp | 560.021 | -1,58 | 29.088 | 0,75 | ||||
| 2026-02-12 | 13F | Penserra Capital Management LLC | 30 | 0,00 | 0 | |||||
| 2026-02-02 | 13F | Addison Capital Co | 32.508 | -11,20 | 1.688 | -9,10 | ||||
| 2026-02-17 | 13F | Citadel Advisors Llc | Call | 0 | -100,00 | 0 | ||||
| 2026-02-13 | 13F | Charles Schwab Investment Management Inc | 1.447.016 | 1,60 | 75.330 | 4,26 | ||||
| 2026-01-22 | 13F | Bartlett & Co. Wealth Management Llc | 94 | 0,00 | 5 | 0,00 | ||||
| 2026-02-06 | 13F | Cumberland Partners Ltd | 19.400 | 0,26 | 1.010 | 2,85 | ||||
| 2026-02-17 | 13F | Point72 Asset Management, L.P. | 0 | -100,00 | 0 | -100,00 | ||||
| 2026-02-17 | 13F | Sciencast Management LP | 13.082 | 679 | ||||||
| 2026-04-24 | 13F | ProShare Advisors LLC | 57.100 | -0,23 | 3.186 | 7,06 | ||||
| 2025-11-06 | 13F | Versor Investments LP | 0 | -100,00 | 0 | -100,00 | ||||
| 2025-11-14 | 13F | Wetherby Asset Management Inc | 11.284 | -6,13 | 573 | -0,17 | ||||
| 2026-04-27 | 13F | Y-Intercept (Hong Kong) Ltd | 37.109 | 2.070 | ||||||
| 2026-04-17 | 13F | Weaver Capital Management LLC | 4.368 | -4,67 | 244 | 2,53 | ||||
| 2026-04-20 | 13F | Hilton Head Capital Partners, LLC | 30 | 0,00 | 2 | 0,00 | ||||
| 2026-01-27 | 13F | WealthCollab, LLC | 260 | -9,41 | 14 | -7,14 | ||||
| 2025-11-14 | 13F/A | Skopos Labs, Inc. | 0 | -100,00 | 0 | -100,00 | ||||
| 2026-02-13 | 13F | 1832 Asset Management L.P. | 8.408.188 | -0,69 | 436.721 | 1,66 | ||||
| 2026-04-22 | 13F | Caledonia Investments Plc | 410.000 | -10,23 | 22.784 | -4,09 | ||||
| 2026-02-12 | 13F | Alps Advisors Inc | 22.692 | 27,78 | 1.179 | 30,74 | ||||
| 2026-02-17 | 13F | Qube Research & Technologies Ltd | 44.835 | -78,75 | 2.331 | -78,23 | ||||
| 2026-02-10 | 13F | Connor, Clark & Lunn Investment Management Ltd. | 4.240.412 | 14,37 | 220.461 | 17,26 | ||||
| 2026-02-17 | 13F | Ancora Advisors, LLC | 26 | 1 | ||||||
| 2026-02-11 | 13F | Clearbridge Investments, LLC | 2.128.320 | -2,93 | 110.545 | -0,64 | ||||
| 2026-02-13 | 13F | Royal London Asset Management Ltd | 27.063 | 7,02 | 1.406 | 9,51 | ||||
| 2025-11-04 | 13F | Frank, Rimerman Advisors LLC | 0 | -100,00 | 0 | -100,00 | ||||
| 2026-01-20 | 13F | Cigna Investments Inc /new | 8.970 | 0,00 | 0 | |||||
| 2026-02-17 | 13F | Magnetar Financial LLC | 0 | -100,00 | 0 | |||||
| 2026-02-17 | 13F | Engineers Gate Manager LP | 0 | -100,00 | 0 | |||||
| 2026-02-18 | 13F | GWM Advisors LLC | 1.283 | 0,08 | 67 | 1,54 | ||||
| 2026-02-10 | 13F | Goldman Sachs Group Inc | 4.871.309 | -5,76 | 253.016 | -3,53 | ||||
| 2026-02-03 | 13F | Sequoia Financial Advisors, LLC | 21.836 | 27,98 | 1.134 | 31,10 | ||||
| 2026-02-02 | 13F | Cornerstone Planning Group LLC | 121 | 47,56 | 6 | 50,00 | ||||
| 2026-02-13 | 13F | Korea Investment CORP | 383.165 | -5,00 | 19.947 | -2,52 | ||||
| 2026-04-22 | 13F | Spire Wealth Management | 99 | 0,00 | 6 | 0,00 | ||||
| 2026-01-27 | 13F | TD Waterhouse Canada Inc. | 5.138.553 | 4,14 | 266.942 | 7,24 | ||||
| 2026-02-12 | 13F | Federated Hermes, Inc. | 179.005 | -1,63 | 9.298 | 0,70 | ||||
| 2026-02-10 | 13F | One Capital Management, LLC | 4.538 | 236 | ||||||
| 2026-02-13 | 13F | Gen-Wealth Partners Inc | 32 | 0,00 | 2 | 0,00 | ||||
| 2026-02-17 | 13F | Susquehanna International Group, Llp | Put | 0 | -100,00 | 0 | ||||
| 2026-02-10 | 13F | Td Asset Management Inc | 13.523.672 | -0,06 | 704.030 | 2,55 | ||||
| 2026-02-12 | 13F | Dimensional Fund Advisors Lp | 678.764 | 3,28 | 35.256 | 5,73 | ||||
| 2026-04-07 | 13F | CoreCap Advisors, LLC | 305 | 72,32 | 17 | 88,89 | ||||
| 2026-01-30 | 13F | Mitsubishi UFJ Trust & Banking Corp | 0 | -100,00 | 0 | |||||
| 2026-02-17 | 13F | Blair William & Co/il | 5.443 | 0,00 | 283 | 2,17 | ||||
| 2026-02-10 | 13F | Natixis Advisors, L.p. | 67.765 | 2,43 | 4 | 0,00 | ||||
| 2026-02-17 | 13F | Fmr Llc | 68.628 | -1,33 | 3.568 | 1,16 | ||||
| 2026-02-12 | 13F | Hrt Financial Lp | 7.617 | 32,52 | 0 | |||||
| 2026-02-13 | 13F | Mufg Securities (canada), Ltd. | 769.632 | -7,64 | 40.023 | -5,30 | ||||
| 2026-04-07 | 13F | Farther Finance Advisors, LLC | 1.377 | 0,58 | 77 | 8,45 | ||||
| 2026-02-17 | 13F | Royal Bank Of Canada | Put | 1.500.000 | 0,00 | 77.910 | 2,36 | |||
| 2026-02-11 | 13F | LPL Financial LLC | 60.140 | 0,94 | 3.124 | 3,31 | ||||
| 2025-11-07 | 13F | Sierra Ocean, Llc | 0 | -100,00 | 0 | -100,00 | ||||
| 2026-02-17 | 13F | Alliancebernstein L.p. | 48.194 | 0,37 | 2.503 | 2,75 | ||||
| 2026-01-23 | 13F | Baillie Gifford & Co | 265.404 | -15,87 | 13.817 | -13,67 | ||||
| 2026-04-28 | 13F | Duff & Phelps Investment Management Co | 981.900 | 0,00 | 76.205 | 49,08 | ||||
| 2026-02-17 | 13F | Two Sigma Advisers, Lp | 479.419 | 82,00 | 24.901 | 86,32 | ||||
| 2026-04-22 | 13F | Louisbourg Investments Inc. | 19.054 | -57,78 | 1.061 | -54,87 | ||||
| 2025-11-07 | 13F | Fifth Third Bancorp | 0 | -100,00 | 0 | -100,00 | ||||
| 2026-02-13 | 13F | Pathstone Holdings, LLC | 10.901 | 7,17 | 566 | 9,69 | ||||
| 2026-02-10 | 13F | Basepoint Wealth LLC | 97 | 5 | ||||||
| 2026-02-13 | 13F | Manufacturers Life Insurance Company, The | 0 | -100,00 | 0 | |||||
| 2026-02-05 | 13F | 1620 Investment Advisors, Inc. | 2.715 | 0,67 | 141 | 3,68 | ||||
| 2026-02-17 | 13F | Janus Henderson Group Plc | 23.977 | 0,00 | 1.248 | 2,97 | ||||
| 2026-02-12 | 13F | Nuveen, LLC | 358.714 | 0,63 | 18.674 | 3,27 | ||||
| 2026-02-13 | 13F | Smartleaf Asset Management LLC | 1.933 | 76,05 | 101 | 81,82 | ||||
| 2026-02-17 | 13F | Quantinno Capital Management LP | 242.000 | 19,15 | 12.570 | 21,98 | ||||
| 2026-04-27 | 13F | Td Private Client Wealth Llc | 22 | 266,67 | 1 | |||||
| 2026-04-17 | 13F | Cidel Asset Management Inc | 981.216 | 82,54 | 54.568 | 95,00 | ||||
| 2026-02-12 | 13F | CIBC Private Wealth Group, LLC | 363 | 0,00 | 19 | 0,00 | ||||
| 2026-02-12 | 13F | Andra AP-fonden | 32.654 | 2.330 | ||||||
| 2026-02-10 | 13F | Keyvantage Wealth, Llc | 20.845 | 0,05 | 1.083 | 2,37 | ||||
| 2026-01-29 | 13F | UBS Group AG | 464.259 | -12,43 | 24.114 | -10,36 | ||||
| 2026-02-17 | 13F | Public Employees Retirement System Of Ohio | 95.072 | 0,24 | 4.949 | 2,85 | ||||
| 2026-01-29 | 13F | Aprio Wealth Management, LLC | 4.279 | 222 | ||||||
| 2026-02-17 | 13F | XTX Topco Ltd | 43.143 | -51,39 | 2.241 | -50,26 | ||||
| 2026-01-28 | 13F | DekaBank Deutsche Girozentrale | 377.359 | 0,00 | 16 | -11,11 | ||||
| 2026-02-13 | 13F | PCM Encore, LLC | 5.906 | 307 | ||||||
| 2026-02-11 | 13F | O'shaughnessy Asset Management, Llc | 28.034 | -33,49 | 1.457 | -31,87 | ||||
| 2026-02-13 | 13F | Macquarie Group Ltd | 0 | -100,00 | 0 | |||||
| 2025-11-12 | 13F | 111 Capital | 0 | -100,00 | 0 | -100,00 | ||||
| 2026-02-17 | 13F | Royal Bank Of Canada | 35.184.008 | -6,09 | 1.827.459 | -3,87 | ||||
| 2026-04-28 | 13F | Golden State Wealth Management, LLC | 925 | 0,65 | 52 | 8,51 | ||||
| 2026-02-17 | 13F | Worldquant Millennium Advisors Llc | 0 | -100,00 | 0 |