Grundlæggende statistik
| Institutionelle aktier (lange) | 208.730.274 - 68,54% (ex 13D/G) - change of -49,13MM shares -19,05% MRQ |
| Institutionel værdi (lang) | $ 1.638.369 USD ($1000) |
Institutionelt ejerskab og aktionærer
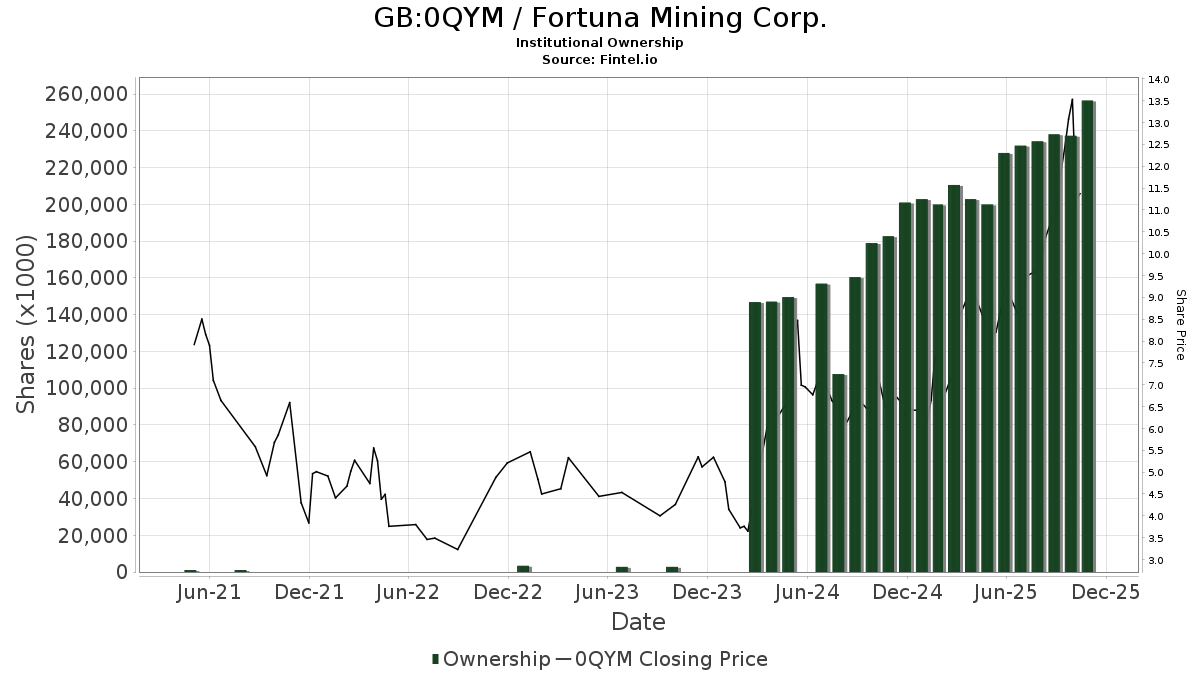
Fortuna Mining Corp. (GB:0QYM) har 241 institutionelle ejere og aktionærer, der har indsendt 13D/G- eller 13F-formularer til Securities Exchange Commission (SEC). Disse institutioner har i alt 208,730,274 aktier. Største aktionærer omfatter Van Eck Associates Corp, Arrowstreet Capital, Limited Partnership, MIRAE ASSET GLOBAL ETFS HOLDINGS Ltd., Acadian Asset Management Llc, Dimensional Fund Advisors Lp, Toroso Investments, LLC, Morgan Stanley, American Century Companies Inc, Vanguard Group Inc, and D. E. Shaw & Co., Inc. .
Fortuna Mining Corp. (LSE:0QYM) institutionel ejerskabsstruktur viser aktuelle positioner i virksomheden efter institutioner og fonde, samt seneste ændringer i positionsstørrelse. Større aktionærer kan omfatte individuelle investorer, investeringsforeninger, hedgefonde eller institutioner. Skema 13D angiver, at investoren besidder (eller besidder) mere end 5 % af virksomheden og har til hensigt (eller har til hensigt at) aktivt at forfølge en ændring i forretningsstrategi. Skema 13G indikerer en passiv investering på over 5%.
The share price as of May 1, 2026 is 12,99 / share. Previously, on May 6, 2025, the share price was 8,42 / share. This represents an increase of 54,28% over that period.
Fondens stemningsscore
Fund Sentiment Score (fka Ownership Accumulation Score) finder de aktier, der bliver mest købt af fonde. Det er resultatet af en sofistikeret, multi-faktor kvantitativ model, der identificerer virksomheder med de højeste niveauer af institutionel akkumulering. Scoringsmodellen bruger en kombination af den samlede stigning i oplyste ejere, ændringerne i porteføljeallokeringer i disse ejere og andre målinger. Tallet går fra 0 til 100, hvor højere tal indikerer et højere niveau af akkumulering for sine jævnaldrende, og 50 er gennemsnittet.
Opdateringsfrekvens: Dagligt
Se Ownership Explorer, som giver en liste over højest rangerende virksomheder.
AI+ Ask Fintel’s AI assistant about Fortuna Mining Corp..
Select a question to share a public post with an AI-crafted answer.
Thinking of good questions…
13F og NPORT arkivering
Detaljer om 13F-arkivering er gratis. Detaljer om NP-ansøgninger kræver et premium-medlemskab. Grønne rækker angiver nye positioner. Røde rækker angiver lukkede positioner. Klik på linket ikon for at se den fulde transaktionshistorik.
Opgrader
for at låse premium-data op og eksportere til Excel ![]() .
.
| Fil dato | Kilde | Investor | Type | Gennemsnitlig pris (Øst) |
Aktier | Δ Aktier (%) |
Rapporteret Værdi ($1000) |
Δ Værdi (%) |
Port Alloc (%) |
|
|---|---|---|---|---|---|---|---|---|---|---|
| 2026-02-11 | 13F | Deutsche Bank Ag\ | 1.243.414 | 28,70 | 12.198 | 40,91 | ||||
| 2026-02-17 | 13F | Balyasny Asset Management Llc | 721.721 | 52,89 | 7.080 | 67,42 | ||||
| 2026-02-11 | 13F | Picton Mahoney Asset Management | 157.668 | -27,95 | 1.547 | 154.600,00 | ||||
| 2026-02-11 | 13F | Jpmorgan Chase & Co | 144.772 | -69,57 | 1.420 | -66,69 | ||||
| 2026-02-13 | 13F | Global Strategic Management Inc | 941.349 | 9 | ||||||
| 2026-04-14 | 13F | Prospera Financial Services Inc | 16.788 | 167 | ||||||
| 2026-02-10 | 13F | Jupiter Asset Management Ltd | 231.361 | 276,61 | 2.270 | 312,73 | ||||
| 2026-02-12 | 13F | Aristides Capital LLC | 0 | -100,00 | 0 | |||||
| 2026-02-13 | 13F | Van Eck Associates Corp | 24.185.050 | -17,40 | 237 | -9,54 | ||||
| 2026-02-13 | 13F | Walleye Capital LLC | Put | 126.900 | 111,85 | 1.245 | 132,09 | |||
| 2026-04-21 | 13F | PharVision Advisers, LLC | 0 | -100,00 | 0 | |||||
| 2026-02-13 | 13F | Walleye Capital LLC | Call | 91.300 | 271,14 | 896 | 306,82 | |||
| 2026-02-13 | 13F | Charles Schwab Investment Management Inc | 655.431 | 42,04 | 6.431 | 55,64 | ||||
| 2026-02-02 | 13F | Intact Investment Management Inc. | 126.400 | 1.239 | ||||||
| 2026-02-05 | 13F | Allworth Financial LP | 3.500 | 0,00 | 34 | 9,68 | ||||
| 2026-02-17 | 13F | Guggenheim Capital Llc | 409.728 | 2,39 | 4.019 | 12,11 | ||||
| 2026-02-12 | 13F | Campbell & CO Investment Adviser LLC | 221.566 | 15,80 | 2.174 | 26,78 | ||||
| 2026-02-13 | 13F | Ingalls & Snyder Llc | 27.500 | 0,00 | 0 | |||||
| 2026-02-17 | 13F | Man Group plc | 783.022 | 192,48 | 7.681 | 220,31 | ||||
| 2025-11-14 | 13F | Luminist Capital LLC | 0 | -100,00 | 0 | |||||
| 2026-02-13 | 13F | National Bank Of Canada /fi/ | 506.332 | -57,65 | 4.959 | -53,38 | ||||
| 2026-02-13 | 13F | MAI Capital Management | 482 | 0,00 | 5 | 0,00 | ||||
| 2026-02-12 | 13F | Northwest & Ethical Investments L.P. | 75.262 | -28,82 | 738 | -22,09 | ||||
| 2026-02-17 | 13F | Schonfeld Strategic Advisors LLC | 17.860 | -78,29 | 175 | -76,22 | ||||
| 2026-02-12 | 13F | Scotia Capital Inc. | 0 | -100,00 | 0 | |||||
| 2026-02-10 | 13F | Godfrey Financial Associates, Inc. | 55 | 1 | ||||||
| 2026-02-17 | 13F | CastleKnight Management LP | 157.700 | 1.547 | ||||||
| 2026-02-17 | 13F | Jones Financial Companies Lllp | 4.653 | 365,30 | 46 | 462,50 | ||||
| 2026-02-17 | 13F | CastleKnight Management LP | Call | 100.000 | 981 | |||||
| 2026-02-13 | 13F | Causeway Capital Management Llc | 863.628 | 645,36 | 8.474 | 717,16 | ||||
| 2026-04-15 | 13F | Generali Investments CEE, investicni spolecnost, a.s. | 8.000 | 0,00 | 79 | 1,28 | ||||
| 2026-04-28 | 13F | SBI Securities Co., Ltd. | 3.522 | 12,63 | 35 | 13,33 | ||||
| 2026-04-22 | 13F | Coastal Investment Advisors, Inc. | 55.550 | -0,18 | 552 | 1,10 | ||||
| 2026-02-13 | 13F | Wells Fargo & Company/mn | 5.190 | -47,73 | 51 | -43,18 | ||||
| 2026-02-17 | 13F | Millennium Management Llc | 1.523.049 | -63,14 | 14.941 | -59,64 | ||||
| 2026-02-17 | 13F | Two Sigma Investments, Lp | 3.341.086 | -12,11 | 32.776 | -3,77 | ||||
| 2026-01-30 | 13F | R Squared Ltd | 0 | -100,00 | 0 | |||||
| 2026-02-09 | 13F | Harbour Investments, Inc. | 1.775 | -31,07 | 17 | -26,09 | ||||
| 2026-04-15 | 13F | Financial Management Professionals, Inc. | 2.869 | 28 | ||||||
| 2026-03-12 | 13F/A | Peak6 Llc | Call | 191.600 | -87,83 | 1.880 | -86,68 | |||
| 2026-02-13 | 13F | SRS Capital Advisors, Inc. | 441 | 47,00 | 4 | 100,00 | ||||
| 2026-02-18 | 13F | State of Tennessee, Treasury Department | 34.925 | -65,15 | 342 | -61,98 | ||||
| 2026-04-28 | 13F | Kathmere Capital Management, LLC | 26.213 | 85,71 | 260 | 88,41 | ||||
| 2026-04-24 | 13F | Root Financial Partners, LLC | 93 | 0,00 | 1 | |||||
| 2026-02-17 | 13F | DZ BANK AG Deutsche Zentral Genossenschafts Bank, Frankfurt am Main | 1.789.733 | -2,29 | 17.557 | 7,08 | ||||
| 2026-01-21 | 13F | Rathbone Brothers plc | 0 | -100,00 | 0 | |||||
| 2026-02-10 | 13F/A | Northwestern Mutual Wealth Management Co | 683 | 7 | ||||||
| 2026-02-10 | 13F | Quantbot Technologies LP | 62.176 | -86,64 | 610 | -85,39 | ||||
| 2026-02-17 | 13F | Amundi | 3.754.336 | 1,38 | 36.830 | 10,87 | ||||
| 2026-02-12 | 13F | Swiss National Bank | 607.930 | 1,28 | 5.969 | 11,03 | ||||
| 2026-02-17 | 13F | PDT Partners, LLC | 102.831 | 0,00 | 1.009 | 9,45 | ||||
| 2026-02-13 | 13F | Prudential Financial Inc | 37.200 | -19,48 | 365 | -11,62 | ||||
| 2026-02-17 | 13F | Pinnacle Financial Partners, Inc. | 28.500 | 280 | ||||||
| 2026-02-17 | 13F | Numerai GP LLC | 51.191 | -33,77 | 502 | -27,46 | ||||
| 2026-02-12 | 13F | Principal Securities, Inc. | 0 | -100,00 | 0 | -100,00 | ||||
| 2026-02-13 | 13F | Pine Valley Investments Ltd Liability Co | 383.771 | 0,89 | 3.765 | 10,45 | ||||
| 2026-04-13 | 13F | IFP Advisors, Inc | 3.000 | 0,00 | 30 | 0,00 | ||||
| 2026-02-17 | 13F | Capital Fund Management S.a. | Put | 56.200 | -44,08 | 551 | -38,78 | |||
| 2026-04-09 | 13F | Towarzystwo Funduszy Inwestycyjnych Allianz Polska S.A. | 125.900 | -13,53 | 1.250 | -13,67 | ||||
| 2026-02-12 | 13F | Hollencrest Capital Management | 116.100 | 0,00 | 1.139 | 9,42 | ||||
| 2026-04-21 | 13F | Sicart Associates LLC | 648.736 | 0,00 | 6.442 | 1,21 | ||||
| 2025-11-14 | 13F | SummitTX Capital, L.P. | 0 | -100,00 | 0 | |||||
| 2025-11-07 | 13F | Shell Asset Management Co | 4.682 | -73,38 | 0 | |||||
| 2026-02-17 | 13F | SIG North Trading, ULC | Put | 91.000 | -30,21 | 893 | -23,63 | |||
| 2026-02-17 | 13F | SIG North Trading, ULC | Call | 38.600 | -53,94 | 379 | -49,60 | |||
| 2026-02-11 | 13F | Winton Capital Group Ltd | 29.400 | 288 | ||||||
| 2026-02-17 | 13F | Capital Fund Management S.a. | Call | 168.600 | -14,24 | 1.654 | -6,13 | |||
| 2026-02-17 | 13F | SIG North Trading, ULC | 192.842 | 111,27 | 1.892 | 131,46 | ||||
| 2026-04-20 | 13F | Cardinal Point Capital Management, ULC | 22.650 | -21,22 | 225 | -20,57 | ||||
| 2026-02-13 | 13F | Dynamic Technology Lab Private Ltd | 56.972 | -34,42 | 559 | -28,15 | ||||
| 2025-11-14 | 13F | Cubist Systematic Strategies, LLC | 1.401.371 | 45,44 | 12.555 | 99,24 | ||||
| 2026-02-09 | 13F | Legal & General Group Plc | 1.458.914 | 13,13 | 14.311 | 23,89 | ||||
| 2026-04-23 | 13F | Farmers & Merchants Investments Inc | 150 | 0,00 | 1 | 0,00 | ||||
| 2026-01-22 | 13F | Greenberg Financial Group | 10.000 | 0,00 | 98 | -1,01 | ||||
| 2026-02-12 | 13F | Sprott Inc. | 276.085 | -9,46 | 2.708 | -0,88 | ||||
| 2026-02-12 | 13F | Groupe la Francaise | 695.000 | 0,00 | 6.809 | 9,31 | ||||
| 2026-04-20 | 13F | Dagco, Inc. | 800 | 0,00 | 8 | 0,00 | ||||
| 2026-02-13 | 13F | Citigroup Inc | 30.756 | 33,74 | 302 | 46,83 | ||||
| 2026-02-12 | 13F | BlackRock, Inc. | 63.079 | 3.153.850,00 | 619 | |||||
| 2026-02-02 | 13F | Wolverine Asset Management Llc | Put | 551.500 | 4,75 | 5.410 | 14,69 | |||
| 2026-02-17 | 13F | D. E. Shaw & Co., Inc. | Call | 271.800 | 165,69 | 2.666 | 191,05 | |||
| 2026-02-17 | 13F | D. E. Shaw & Co., Inc. | 7.527.066 | 19,97 | 73.832 | 31,35 | ||||
| 2026-02-04 | 13F | Plato Investment Management Ltd | 7.537 | 74 | ||||||
| 2026-02-17 | 13F | Canada Pension Plan Investment Board | 1.081.000 | -32,87 | 10.593 | -26,50 | ||||
| 2026-02-18 | 13F | Mackenzie Financial Corp | 1.761.664 | 330,04 | 17.509 | 377,58 | ||||
| 2026-02-10 | 13F | CIBC World Markets Inc. | 225.968 | 12,59 | 2.214 | 23,27 | ||||
| 2025-11-13 | 13F | Farringdon Capital, Ltd. | 0 | -100,00 | 0 | |||||
| 2026-04-27 | 13F | Pensionmark Financial Group, Llc | 104.545 | -27,54 | 1.038 | -26,64 | ||||
| 2026-02-10 | 13F | Close Asset Management Ltd | 10.000 | 0,00 | 0 | |||||
| 2026-05-01 | 13F | U S Global Investors Inc | 383.650 | -31,56 | 3.810 | -30,73 | ||||
| 2026-02-17 | 13F | Prelude Capital Management, Llc | 23.534 | -48,56 | 231 | -43,77 | ||||
| 2026-04-20 | 13F | Banque Cantonale Vaudoise | 6.553 | 1.001,34 | 65 | 983,33 | ||||
| 2026-02-10 | 13F | CIBC Asset Management Inc | 288.377 | -2,91 | 2.828 | 6,44 | ||||
| 2026-02-17 | 13F | Toronto Dominion Bank | 2.680.091 | -1,18 | 26.263 | 8,19 | ||||
| 2026-02-17 | 13F | Toronto Dominion Bank | Put | 3.200 | -31,91 | 31 | -26,19 | |||
| 2026-02-17 | 13F | Toronto Dominion Bank | Call | 4.300 | -35,82 | 42 | -28,81 | |||
| 2025-11-13 | 13F | Blueshift Asset Management, LLC | 0 | -100,00 | 0 | -100,00 | ||||
| 2025-11-14 | 13F | Marex Group plc | 0 | -100,00 | 0 | -100,00 | ||||
| 2026-01-15 | 13F | Hara Capital LLC | 2.700 | 0,00 | 26 | 8,33 | ||||
| 2026-02-13 | 13F | De Lisle Partners LLP | 228.775 | -23,43 | 2.245 | -16,17 | ||||
| 2026-02-17 | 13F | Jain Global LLC | 61.164 | 5,34 | 599 | 15,41 | ||||
| 2026-02-13 | 13F | BRITISH COLUMBIA INVESTMENT MANAGEMENT Corp | 163.075 | -8,84 | 1.598 | -0,19 | ||||
| 2026-04-23 | 13F | Klein Pavlis & Peasley Financial, Inc. | 116.582 | -2,25 | 1.158 | -1,03 | ||||
| 2026-02-13 | 13F | Integrated Wealth Concepts LLC | 0 | -100,00 | 0 | |||||
| 2026-02-12 | 13F | Jane Street Group, Llc | Call | 93.700 | 337,85 | 919 | 381,15 | |||
| 2026-02-13 | 13F | Kilter Group LLC | 43 | 0,00 | 0 | |||||
| 2026-02-12 | 13F | Jane Street Group, Llc | 2.420.469 | 382,63 | 23.745 | 428,47 | ||||
| 2026-02-12 | 13F | Jane Street Group, Llc | Put | 68.300 | 64,18 | 670 | 80,11 | |||
| 2026-02-13 | 13F | Barclays Plc | 282.605 | 2,82 | 2.772 | 12,59 | ||||
| 2026-02-17 | 13F | Keebeck Alpha, LP | 23.534 | -48,56 | 231 | -43,77 | ||||
| 2026-02-14 | 13F | Rockefeller Capital Management L.P. | 1.000 | 0,00 | 10 | 12,50 | ||||
| 2026-02-17 | 13F | Cape Investment Advisory, Inc. | 100 | 1 | ||||||
| 2026-02-17 | 13F | Lazard Asset Management Llc | 61.523 | -61,79 | 603 | -58,22 | ||||
| 2026-05-01 | 13F/A | Lodestone Wealth Management LLC | 1.000 | 10 | ||||||
| 2026-02-19 | 13F | Invesco Ltd. | 3.004.000 | -3,68 | 29.469 | 5,46 | ||||
| 2026-02-10 | 13F | Hillsdale Investment Management Inc. | 1.361.635 | -50,78 | 13.367 | -46,02 | ||||
| 2026-02-13 | 13F | Quarry LP | 1.344 | -97,09 | 13 | -96,85 | ||||
| 2026-02-12 | 13F | Bank Of Montreal /can/ | Call | 511.500 | 5.012 | |||||
| 2026-02-11 | 13F | Tiaa Trust, National Association | 436.540 | 0,00 | 4.282 | 9,49 | ||||
| 2026-02-12 | 13F | Bank Of Montreal /can/ | Put | 20.800 | 204 | |||||
| 2026-02-12 | 13F | Bank Of Montreal /can/ | 3.496.112 | -15,22 | 34.260 | -7,18 | ||||
| 2026-04-24 | 13F | UMA Financial Services, Inc. | 60 | 0,00 | 1 | |||||
| 2026-02-13 | 13F | JustInvest LLC | 15.179 | 3,56 | 149 | 12,98 | ||||
| 2026-04-20 | 13F | SILVER OAK SECURITIES, Inc | 24.915 | 0,00 | 247 | 0,00 | ||||
| 2026-04-24 | 13F | Profund Advisors Llc | 33.026 | 4,74 | 328 | 5,83 | ||||
| 2026-02-10 | 13F | Acadian Asset Management Llc | 11.382.736 | -2,48 | 112 | 6,73 | ||||
| 2026-01-27 | 13F | Zurcher Kantonalbank (Zurich Cantonalbank) | 93.280 | 12,67 | 915 | 23,48 | ||||
| 2026-02-17 | 13F | Engineers Gate Manager LP | 85.180 | -66,92 | 836 | -63,81 | ||||
| 2026-02-04 | 13F | Swiss Life Asset Management Ltd | 33.947 | 141,89 | 333 | 165,60 | ||||
| 2026-02-11 | 13F | Allianz Asset Management GmbH | 188.495 | 2,45 | 1.850 | 12,26 | ||||
| 2026-02-17 | 13F | Captrust Financial Advisors | 12.485 | 0,00 | 122 | 9,91 | ||||
| 2025-11-14 | 13F | Point72 Asia (Singapore) Pte. Ltd. | 0 | -100,00 | 0 | |||||
| 2026-04-29 | 13F | Navalign, LLC | 0 | -100,00 | 0 | |||||
| 2026-02-02 | 13F | Wolverine Asset Management Llc | Call | 128.100 | 128.000,00 | 1.257 | ||||
| 2026-02-04 | 13F | Versor Investments LP | 0 | -100,00 | 0 | |||||
| 2026-02-17 | 13F | Brevan Howard Capital Management LP | 111.207 | 456,01 | 1.091 | 508,94 | ||||
| 2026-02-13 | 13F | Colony Group, LLC | 12.471 | 122 | ||||||
| 2026-04-07 | 13F | Carolina Wealth Advisors, LLC | 0 | -100,00 | 0 | |||||
| 2026-02-04 | 13F | Centric Wealth Management | 11.000 | 10,00 | 108 | 30,49 | ||||
| 2026-05-01 | 13F | Thrivent Financial For Lutherans | 104.910 | 1 | ||||||
| 2025-11-14 | 13F | Axa S.a. | 0 | -100,00 | 0 | |||||
| 2026-01-27 | 13F | Proffitt & Goodson Inc | 2.500 | 0,00 | 25 | 9,09 | ||||
| 2026-02-10 | 13F | State of Wyoming | 22.190 | 218 | ||||||
| 2026-02-11 | 13F | Vise Technologies, Inc. | 0 | -100,00 | 0 | |||||
| 2026-02-12 | 13F | CoreCommodity Management, LLC | 76.897 | -18,09 | 754 | -10,34 | ||||
| 2025-11-14 | 13F | Capstone Investment Advisors, Llc | 30.057 | 269 | ||||||
| 2026-04-27 | 13F | Tsfg, Llc | 1.000 | 0,00 | 0 | |||||
| 2026-03-04 | 13F | SHP Wealth Management | 100 | 1 | ||||||
| 2026-02-17 | 13F | Russell Investments Group, Ltd. | 990.008 | -4,69 | 9.718 | 4,56 | ||||
| 2026-02-17 | 13F | Massar Capital Management, LP | 43.914 | 431 | ||||||
| 2026-02-11 | 13F | Franklin Resources Inc | 183.514 | 7,56 | 1.798 | 17,75 | ||||
| 2026-02-06 | 13F | Larson Financial Group LLC | 442 | 281,03 | 4 | 300,00 | ||||
| 2026-02-17 | 13F | Parallax Volatility Advisers, L.P. | Call | 400.000 | 0,00 | 3.924 | 9,49 | |||
| 2026-02-09 | 13F | Geode Capital Management, Llc | 1.464.898 | 17,84 | 19.002 | 27,95 | ||||
| 2025-11-14 | 13F | Beacon Pointe Advisors, LLC | 0 | -100,00 | 0 | |||||
| 2026-02-17 | 13F | Citadel Advisors Llc | Call | 453.400 | 4,21 | 4.448 | 14,08 | |||
| 2026-02-17 | 13F | Citadel Advisors Llc | 207.063 | -88,93 | 2.031 | -87,88 | ||||
| 2026-02-17 | 13F | Advisor Group Holdings, Inc. | 10.774 | 63,19 | 106 | 94,44 | ||||
| 2026-02-17 | 13F | Citadel Advisors Llc | Put | 174.300 | -34,08 | 1.710 | -27,86 | |||
| 2026-04-22 | 13F | Stone House Investment Management, LLC | 250 | 594,44 | 2 | |||||
| 2026-02-13 | 13F | American Century Companies Inc | 8.269.909 | 2,96 | 81.053 | 12,69 | ||||
| 2026-02-13 | 13F | Aire Advisors, Llc | 0 | -100,00 | 0 | |||||
| 2026-04-22 | 13F | Pictet Asset Management Holding SA | 63.314 | 13,22 | 627 | 14,42 | ||||
| 2026-04-29 | 13F | Hughes Financial Services, LLC | 60 | 0,00 | 1 | |||||
| 2026-02-17 | 13F | Susquehanna International Group, Llp | 416.874 | 422,37 | 4.090 | 471,89 | ||||
| 2026-02-03 | 13F | McIlrath & Eck, LLC | 300 | 0,00 | 3 | 0,00 | ||||
| 2026-02-17 | 13F | Susquehanna International Group, Llp | Put | 351.000 | 47,54 | 3.443 | 61,57 | |||
| 2026-04-15 | 13F | Merit Financial Group, LLC | 0 | -100,00 | 0 | |||||
| 2026-01-28 | 13F | CAPROCK Group, Inc. | 36.868 | 104,94 | 362 | 161,59 | ||||
| 2026-02-17 | 13F | Fmr Llc | 0 | -100,00 | 0 | -100,00 | ||||
| 2026-02-17 | 13F | Susquehanna International Group, Llp | Call | 1.144.700 | -6,40 | 11.230 | 2,47 | |||
| 2026-04-14 | 13F | Drive Wealth Management, Llc | 13.879 | -0,67 | 138 | 0,00 | ||||
| 2026-02-06 | 13F | Global Retirement Partners, LLC | 233 | 0,00 | 2 | 0,00 | ||||
| 2026-02-13 | 13F | BNP Paribas Asset Management Holding S.A. | 252.533 | 3 | ||||||
| 2026-02-05 | 13F | Chase Investment Counsel Corp | 371.199 | 4 | ||||||
| 2026-04-28 | 13F | DGS Capital Management, LLC | 12.103 | 15,77 | 120 | 17,65 | ||||
| 2026-02-12 | 13F | Steward Partners Investment Advisory, Llc | 5.000 | 0,00 | 49 | 11,36 | ||||
| 2026-02-13 | 13F | Public Sector Pension Investment Board | 0 | -100,00 | 0 | |||||
| 2025-11-14 | 13F | Evelyn Partners Investment Management (Europe) Ltd | 0 | -100,00 | 0 | -100,00 | ||||
| 2025-12-09 | 13F/A | Tudor Investment Corp Et Al | 25.378 | -74,41 | 227 | -64,97 | ||||
| 2026-02-11 | 13F | Simplex Trading, Llc | 10.934 | 107 | ||||||
| 2026-02-12 | 13F | Commonwealth Equity Services, Llc | 19.072 | -2,69 | 187 | |||||
| 2026-04-28 | 13F | Alberta Investment Management Corp | 81.867 | -73,89 | 814 | -73,51 | ||||
| 2026-02-17 | 13F | Raymond James Financial Inc | 57.955 | 91,40 | 569 | 109,59 | ||||
| 2026-02-17 | 13F | Two Sigma Securities, Llc | 13.299 | 130 | ||||||
| 2026-04-08 | 13F | West Financial Advisors, LLC | 150 | 0,00 | 1 | 0,00 | ||||
| 2026-01-23 | 13F | Assetmark, Inc | 65 | 0,00 | 1 | |||||
| 2026-04-29 | 13F | Skopos Labs, Inc. | 27.194 | 54,71 | 270 | 55,17 | ||||
| 2026-02-13 | 13F | Morgan Stanley | 8.472.690 | -7,38 | 83.117 | 1,41 | ||||
| 2026-04-15 | 13F | DAVENPORT & Co LLC | 50.700 | 0,00 | 503 | 1,21 | ||||
| 2026-04-27 | 13F | Sound Income Strategies, LLC | 0 | -100,00 | 0 | |||||
| 2026-02-13 | 13F | Mariner, LLC | 96.874 | 134,42 | 950 | 156,76 | ||||
| 2026-02-05 | 13F | Baader Bank INC | 0 | -100,00 | 0 | |||||
| 2025-11-14 | 13F | Capula Management Ltd | 0 | -100,00 | 0 | -100,00 | ||||
| 2026-02-17 | 13F | Capital Fund Management S.a. | 555.821 | 49,22 | 5.453 | 63,38 | ||||
| 2026-02-18 | 13F | Vident Advisory, LLC | 40.323 | -86,98 | 396 | -85,76 | ||||
| 2025-11-14 | 13F | Walleye Capital LLC | 0 | -100,00 | 0 | -100,00 | ||||
| 2026-02-17 | 13F | Susquehanna Advisors Group, Inc. | 33.700 | 331 | ||||||
| 2026-02-17 | 13F | SPWM Advisors LLC | 10.010 | 98 | ||||||
| 2026-02-13 | 13F | Virtus ETF Advisers LLC | 37.681 | 0,00 | 370 | 9,50 | ||||
| 2025-11-13 | 13F | FORA Capital, LLC | 0 | -100,00 | 0 | -100,00 | ||||
| 2025-11-07 | 13F | Synovus Financial Corp | 28.500 | 0,00 | 255 | 37,10 | ||||
| 2026-02-17 | 13F | Jump Financial, LLC | 475.726 | 4.667 | ||||||
| 2026-02-06 | 13F | EverSource Wealth Advisors, LLC | 5.363 | -0,72 | 53 | 8,33 | ||||
| 2026-04-08 | 13F | Miracle Mile Advisors, LLC | 0 | -100,00 | 0 | |||||
| 2026-02-13 | 13F | Manufacturers Life Insurance Company, The | 0 | -100,00 | 0 | |||||
| 2026-04-20 | 13F | Ritholtz Wealth Management | 223.245 | 27,28 | 2.217 | 28,84 | ||||
| 2026-02-17 | 13F/A | Sentinus, LLC | 10.500 | 103 | ||||||
| 2025-11-14 | 13F | Virtu Financial LLC | 0 | -100,00 | 0 | |||||
| 2026-01-30 | 13F | Pvg Asset Management Corp | 25.960 | 255 | ||||||
| 2026-02-13 | 13F | Walleye Trading LLC | Put | 23.300 | 1.692,31 | 229 | 1.972,73 | |||
| 2026-02-13 | 13F | Walleye Trading LLC | Call | 78.900 | 155,34 | 774 | 180,43 | |||
| 2026-04-28 | 13F | Golden State Equity Partners | 37.241 | 370 | ||||||
| 2026-04-27 | 13F | Y-Intercept (Hong Kong) Ltd | 353.533 | 71,20 | 3.511 | 73,33 | ||||
| 2026-01-27 | 13F | WealthCollab, LLC | 1.762 | 0,00 | 17 | 13,33 | ||||
| 2026-02-17 | 13F | Ancora Advisors, LLC | 1.332 | 0,00 | 13 | 18,18 | ||||
| 2026-02-17 | 13F | Scientech Research LLC | 29.297 | 287 | ||||||
| 2026-04-08 | 13F | Afg Fiduciary Services Limited Partnership | 15.000 | 154 | ||||||
| 2026-02-12 | 13F | Hohimer Wealth Management, Llc | 0 | -100,00 | 0 | |||||
| 2026-02-17 | 13F | Qube Research & Technologies Ltd | 2.547.053 | 1.614,33 | 24.987 | 1.777,24 | ||||
| 2026-02-11 | 13F | Prudential Plc | 43.120 | -7,35 | 423 | 1,44 | ||||
| 2026-04-17 | 13F | AdvisorNet Financial, Inc | 2.935 | -6,38 | 29 | -3,33 | ||||
| 2026-02-10 | 13F | Connor, Clark & Lunn Investment Management Ltd. | 573.130 | -78,37 | 5.616 | -76,33 | ||||
| 2026-02-17 | 13F | Gotham Asset Management, LLC | 363.376 | 41,85 | 3.565 | 55,29 | ||||
| 2026-02-09 | 13F | IPG Investment Advisors LLC | 30.500 | 0,00 | 299 | 9,52 | ||||
| 2026-04-16 | 13F | Sheets Smith Wealth Management | 68.766 | -0,30 | 683 | 0,89 | ||||
| 2026-02-17 | 13F | Royal Bank Of Canada | 1.047.884 | 80,78 | 10.279 | 97,94 | ||||
| 2026-02-12 | 13F | Renaissance Technologies Llc | 1.517.600 | -31,83 | 14.888 | -25,36 | ||||
| 2026-02-13 | 13F | Squarepoint Ops LLC | Put | 11.300 | 0,00 | 111 | 8,91 | |||
| 2026-02-18 | 13F | GWM Advisors LLC | 211.355 | 6,31 | 2.073 | 16,40 | ||||
| 2025-11-14 | 13F | Point72 (DIFC) Ltd | 0 | -100,00 | 0 | |||||
| 2026-04-17 | 13F | PKO Investment Management Joint-Stock Co | 151.438 | 45,09 | 1.502 | 46,68 | ||||
| 2026-02-17 | 13F | Quantitative Investment Management, LLC | 0 | -100,00 | 0 | |||||
| 2026-02-17 | 13F | Tower Research Capital LLC (TRC) | 100 | -91,43 | 1 | -100,00 | ||||
| 2026-04-16 | 13F | SG Americas Securities, LLC | 32.901 | -44,92 | 0 | |||||
| 2026-02-13 | 13F | Arrowstreet Capital, Limited Partnership | 20.216.810 | 3,52 | 198.176 | 13,33 | ||||
| 2026-02-10 | 13F | Goldman Sachs Group Inc | 3.977.108 | -45,66 | 39.015 | -40,51 | ||||
| 2026-02-10 | 13F | Savant Capital, LLC | 45.798 | 4,80 | 449 | 14,83 | ||||
| 2026-02-17 | 13F | Optiver Holding B.V. | 0 | -100,00 | 0 | |||||
| 2026-04-27 | 13F | PFG Investments, LLC | 13.579 | 0,00 | 135 | 0,75 | ||||
| 2026-02-17 | 13F | Alliancebernstein L.p. | 138.939 | 217,50 | 1.363 | 247,45 | ||||
| 2026-02-10 | 13F | PCJ Investment Counsel Ltd. | 486.520 | 24,20 | 4.768 | 35,97 | ||||
| 2026-02-17 | 13F | Graham Capital Management, L.P. | 27.338 | 31,97 | 268 | 44,86 | ||||
| 2026-02-17 | 13F | New Vernon Capital Holdings II LLC | 7.475 | 0,00 | 101 | 51,52 | ||||
| 2026-02-13 | 13F | Verition Fund Management LLC | 22.000 | -56,42 | 216 | -52,43 | ||||
| 2025-11-14 | 13F | Squarepoint Ops LLC | 0 | -100,00 | 0 | -100,00 | ||||
| 2026-02-17 | 13F | Cetera Investment Advisers | 14.343 | 22,19 | 141 | 33,33 | ||||
| 2026-01-27 | 13F | TD Waterhouse Canada Inc. | 49.252 | 146,70 | 483 | 172,32 | ||||
| 2026-02-11 | 13F | Erste Asset Management GmbH | 65.600 | 651 | ||||||
| 2026-01-28 | 13F | Geneos Wealth Management Inc. | 4.100 | 2,50 | 40 | 14,29 | ||||
| 2026-02-17 | 13F | Perritt Capital Management Inc | 0 | -100,00 | 0 | |||||
| 2026-02-13 | 13F | Caitong International Asset Management Co., Ltd | 883 | -47,57 | 9 | -46,67 | ||||
| 2026-01-23 | 13F | Rsm Us Wealth Management Llc | 11.688 | 1,82 | 116 | 13,73 | ||||
| 2026-04-20 | 13F | LVW Advisors, LLC | 36.702 | 364 | ||||||
| 2026-02-13 | 13F | Centiva Capital, LP | 12.884 | 126 | ||||||
| 2026-04-30 | 13F | Nuveen, LLC | 2.425.256 | -6,16 | 24.034 | -5,22 | ||||
| 2026-01-29 | 13F | Vanguard Group Inc | 8.255.178 | 80,95 | 80.892 | 98,06 | ||||
| 2026-02-10 | 13F | Td Asset Management Inc | 1.629.640 | -7,69 | 15.990 | 1,14 | ||||
| 2026-02-17 | 13F | Advisory Services Network, LLC | 0 | -100,00 | 0 | |||||
| 2026-04-27 | 13F | Leonteq Securities AG | 2.000 | 0,00 | 28 | 3,85 | ||||
| 2026-02-12 | 13F | Dimensional Fund Advisors Lp | 10.066.599 | 8,15 | 98.758 | 18,43 | ||||
| 2025-11-12 | 13F | Catalyst Funds Management Pty Ltd | 0 | -100,00 | 0 | |||||
| 2026-04-15 | 13F | Cypress Wealth Services, LLC | 14.511 | -31,00 | 144 | -30,10 | ||||
| 2026-02-11 | 13F | LPL Financial LLC | 120.628 | -24,98 | 1.183 | -17,85 | ||||
| 2025-11-14 | 13F | ExodusPoint Capital Management, LP | 160.085 | -44,61 | 1.434 | 143.300,00 | ||||
| 2026-02-13 | 13F | Aigen Investment Management, Lp | 0 | -100,00 | 0 | |||||
| 2026-02-17 | 13F | Two Sigma Advisers, Lp | 1.207.100 | -1,83 | 11.842 | 7,48 | ||||
| 2026-02-17 | 13F | Trexquant Investment LP | 971.709 | -40,74 | 9.532 | -35,12 | ||||
| 2026-02-12 | 13F | Hrt Financial Lp | 246.537 | 2 | ||||||
| 2026-02-17 | 13F | Crabel Capital Management, LLC | 0 | -100,00 | 0 | |||||
| 2026-02-06 | 13F | Auxano Advisors, LLC | 200.000 | 1.962 | ||||||
| 2026-02-12 | 13F | Federation des caisses Desjardins du Quebec | 158.579 | 0,95 | 1.554 | 12,12 | ||||
| 2026-04-09 | 13F | Pacifica Partners Inc. | 880 | 0,00 | 9 | 0,00 | ||||
| 2026-04-07 | 13F | Farther Finance Advisors, LLC | 10.362 | 20,08 | 108 | 28,57 | ||||
| 2025-11-12 | 13F | Headlands Technologies LLC | 0 | -100,00 | 0 | |||||
| 2026-04-30 | 13F | Kestra Advisory Services, LLC | 0 | -100,00 | 0 | |||||
| 2025-11-14 | 13F | Algert Global Llc | 0 | -100,00 | 0 | |||||
| 2026-01-21 | 13F/A | Euro Pacific Asset Management, LLC | 4.464.769 | 0,88 | 43 | 10,26 | ||||
| 2026-04-16 | 13F | Toth Financial Advisory Corp | 85 | 1 | ||||||
| 2026-01-14 | 13F | ORG Partners LLC | 600 | 5.900,00 | 6 | |||||
| 2026-02-13 | 13F | Smartleaf Asset Management LLC | 2.374 | 24 | ||||||
| 2026-02-17 | 13F | Voloridge Investment Management, Llc | 2.221.012 | 6,67 | 21.788 | 16,79 | ||||
| 2026-02-13 | 13F | Toroso Investments, LLC | 9.666.827 | 8,04 | 94.832 | 18,29 | ||||
| 2026-01-07 | 13F | Aventura Private Wealth, LLC | 1.500 | 0,00 | 15 | 7,69 | ||||
| 2026-01-29 | 13F | UBS Group AG | Put | 300.000 | 0,00 | 2.943 | 9,49 | |||
| 2026-01-29 | 13F | UBS Group AG | 2.695.663 | 34,80 | 26.444 | 47,58 | ||||
| 2026-02-10 | 13F | Bnp Paribas Arbitrage, Sa | 37.112 | -21,16 | 364 | -13,54 | ||||
| 2026-02-04 | 13F | Independent Advisor Alliance | 14.930 | -2,07 | 146 | 7,35 | ||||
| 2026-04-28 | 13F | Flagship Harbor Advisors, Llc | 0 | -100,00 | 0 | |||||
| 2026-02-13 | 13F | Bridgefront Capital, LLC | 19.804 | 194 | ||||||
| 2026-02-13 | 13F | Neuberger Berman Group LLC | 142.084 | 76,44 | 1.394 | 93,34 | ||||
| 2026-04-21 | 13F | Abbington Investment Group | 127.816 | 5,75 | 1.269 | 7,09 | ||||
| 2025-11-24 | 13F | Penn Capital Management Co Inc | 0 | -100,00 | 0 | -100,00 | ||||
| 2026-02-17 | 13F | XTX Topco Ltd | 61.686 | -57,66 | 605 | -53,64 | ||||
| 2026-04-30 | 13F | Channing Global Advisors, Llc | 124.082 | 1.232 | ||||||
| 2026-02-17 | 13F | Public Employees Retirement System Of Ohio | 812.040 | -2,17 | 7.968 | 7,18 | ||||
| 2026-04-24 | 13F | Oakworth Capital, Inc. | 200 | 0,00 | 2 | 0,00 | ||||
| 2026-02-17 | 13F | Bank Of America Corp /de/ | 1.600.972 | 181,32 | 15.706 | 208,00 | ||||
| 2026-02-17 | 13F | MIRAE ASSET GLOBAL ETFS HOLDINGS Ltd. | 18.013.453 | 31,42 | 176.751 | 44,00 | ||||
| 2026-02-17 | 13F | Investment Management Corp of Ontario | 37.673 | 230,90 | 370 | 261,76 | ||||
| 2026-02-10 | 13F | Envestnet Asset Management Inc | 25.254 | 56,50 | 248 | 71,53 | ||||
| 2026-04-30 | 13F | Cambridge Investment Research Advisors, Inc. | 99.606 | 104,99 | 1 | |||||
| 2025-11-14 | 13F | Ubs Asset Management Americas Inc | 0 | -100,00 | 0 | |||||
| 2026-02-17 | 13F | Point72 Asset Management, L.P. | 700.334 | 546,89 | 6.869 | 608,88 | ||||
| 2026-02-11 | 13F | O'shaughnessy Asset Management, Llc | 897.363 | -3,33 | 8.798 | 5,86 | ||||
| 2026-02-17 | 13F | Aqr Capital Management Llc | 138.788 | 1.360 | ||||||
| 2026-04-23 | 13F | Chelsea Counsel Co | 8.680 | 0,00 | 85 | 0,00 | ||||
| 2026-02-09 | 13F | Employees Retirement System of Texas | 7.263 | 0,00 | 0 | |||||
| 2026-02-13 | 13F | Entropy Technologies, LP | 77.192 | 757 |