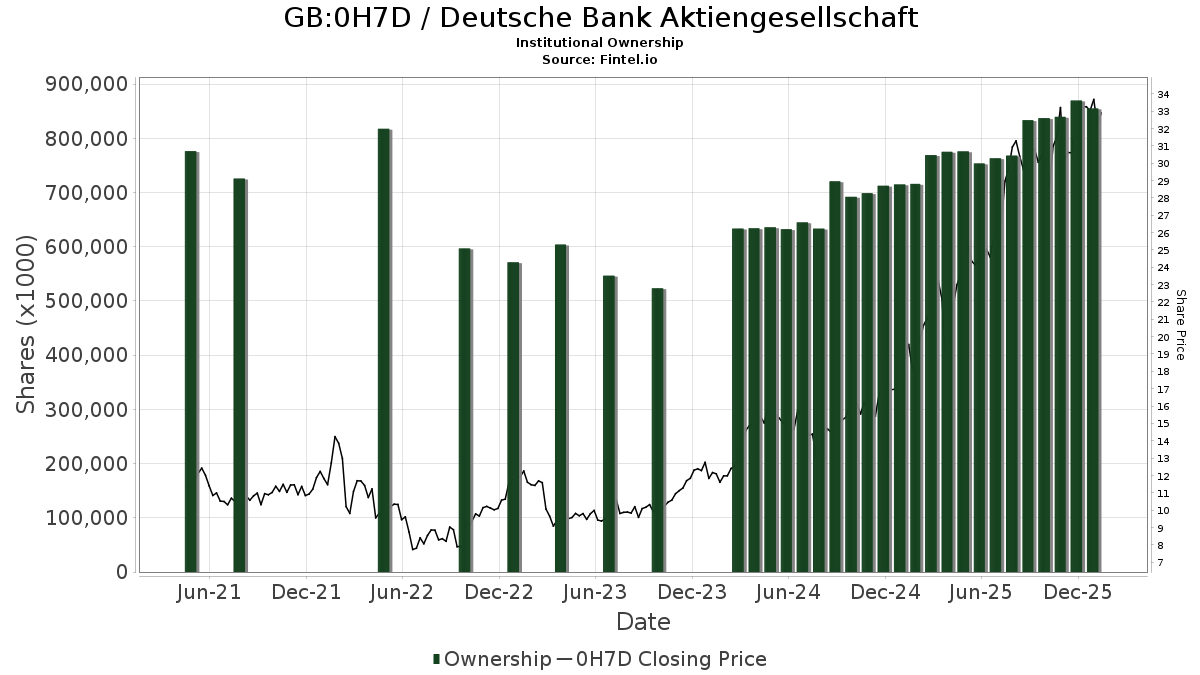
Grundlæggende statistik
| Institutionelle aktier (lange) | 627.649.148 - 33,38% (ex 13D/G) - change of -223,54MM shares -26,26% MRQ |
| Institutionel værdi (lang) | $ 22.237.171 USD ($1000) |
Institutionelt ejerskab og aktionærer
Deutsche Bank Aktiengesellschaft (GB:0H7D) har 490 institutionelle ejere og aktionærer, der har indsendt 13D/G- eller 13F-formularer til Securities Exchange Commission (SEC). Disse institutioner har i alt 627,649,148 aktier. Største aktionærer omfatter Vanguard Group Inc, Capital International Investors, Deutsche Bank Ag\, Amundi, UBS Group AG, Fisher Asset Management, LLC, Acadian Asset Management Llc, DekaBank Deutsche Girozentrale, Goldman Sachs Group Inc, and Legal & General Group Plc .
Deutsche Bank Aktiengesellschaft (LSE:0H7D) institutionel ejerskabsstruktur viser aktuelle positioner i virksomheden efter institutioner og fonde, samt seneste ændringer i positionsstørrelse. Større aktionærer kan omfatte individuelle investorer, investeringsforeninger, hedgefonde eller institutioner. Skema 13D angiver, at investoren besidder (eller besidder) mere end 5 % af virksomheden og har til hensigt (eller har til hensigt at) aktivt at forfølge en ændring i forretningsstrategi. Skema 13G indikerer en passiv investering på over 5%.
The share price as of May 1, 2026 is 26,57 / share. Previously, on May 6, 2025, the share price was 23,60 / share. This represents an increase of 12,58% over that period.
Fondens stemningsscore
Fund Sentiment Score (fka Ownership Accumulation Score) finder de aktier, der bliver mest købt af fonde. Det er resultatet af en sofistikeret, multi-faktor kvantitativ model, der identificerer virksomheder med de højeste niveauer af institutionel akkumulering. Scoringsmodellen bruger en kombination af den samlede stigning i oplyste ejere, ændringerne i porteføljeallokeringer i disse ejere og andre målinger. Tallet går fra 0 til 100, hvor højere tal indikerer et højere niveau af akkumulering for sine jævnaldrende, og 50 er gennemsnittet.
Opdateringsfrekvens: Dagligt
Se Ownership Explorer, som giver en liste over højest rangerende virksomheder.
AI+ Ask Fintel’s AI assistant about Deutsche Bank Aktiengesellschaft.
Select a question to share a public post with an AI-crafted answer.
Thinking of good questions…
13F og NPORT arkivering
Detaljer om 13F-arkivering er gratis. Detaljer om NP-ansøgninger kræver et premium-medlemskab. Grønne rækker angiver nye positioner. Røde rækker angiver lukkede positioner. Klik på linket ikon for at se den fulde transaktionshistorik.
Opgrader
for at låse premium-data op og eksportere til Excel ![]() .
.
| Fil dato | Kilde | Investor | Type | Gennemsnitlig pris (Øst) |
Aktier | Δ Aktier (%) |
Rapporteret Værdi ($1000) |
Δ Værdi (%) |
Port Alloc (%) |
|
|---|---|---|---|---|---|---|---|---|---|---|
| 2026-01-07 | 13F | Yeomans Consulting Group, Inc. | 9.759 | -3,83 | 376 | 4,44 | ||||
| 2026-04-17 | 13F | Bell Investment Advisors, Inc | 191 | -41,23 | 6 | -58,33 | ||||
| 2026-02-06 | 13F | HighTower Advisors, LLC | 60.848 | -1,56 | 2.346 | 7,22 | ||||
| 2025-11-12 | 13F | CIBC Bancorp USA Inc. | 6.478 | 209 | ||||||
| 2026-04-15 | 13F | Activest Wealth Management | 5.000 | 0,00 | 145 | -25,77 | ||||
| 2026-02-13 | 13F | Menard Financial Group LLC | 0 | -100,00 | 0 | |||||
| 2026-02-12 | 13F | Hrt Financial Lp | 18.934 | 1 | ||||||
| 2026-02-12 | 13F | Bank Of Montreal /can/ | 1.066.295 | 4,53 | 41.422 | 12,11 | ||||
| 2026-02-19 | 13F | Invesco Ltd. | 4.289.794 | 24,46 | 165.414 | 35,54 | ||||
| 2026-04-24 | 13F | Yousif Capital Management, Llc | 27.446 | 0,00 | 817 | -20,53 | ||||
| 2026-04-14 | 13F | Banque Pictet & Cie Sa | 12.300 | -71,72 | 356 | -79,01 | ||||
| 2026-02-17 | 13F | Fmr Llc | 12.519.558 | 4,15 | 487.147 | 15,25 | ||||
| 2026-04-21 | 13F | Maseco Llp | 0 | -100,00 | 0 | |||||
| 2026-02-09 | 13F | Keating Financial Advisory Services, Inc. | 50 | 2 | ||||||
| 2026-04-17 | 13F | Anchyra Partners Llc | 0 | -100,00 | 0 | |||||
| 2026-02-11 | 13F | Zions Bancorporation, National Association /ut/ | 1.552 | 0,00 | 60 | 9,26 | ||||
| 2026-02-13 | 13F | Transamerica Financial Advisors, Inc. | 341 | 13 | ||||||
| 2026-02-18 | 13F | Vident Advisory, LLC | 76.846 | -17,90 | 2.964 | -10,59 | ||||
| 2026-04-29 | 13F | Envestnet Portfolio Solutions, Inc. | 8.970 | -18,35 | 267 | -36,88 | ||||
| 2026-02-12 | 13F | Brown Brothers Harriman & Co | 3.870 | 199,54 | 149 | 231,11 | ||||
| 2026-02-13 | 13F | Causeway Capital Management Llc | 14.194.354 | -19,44 | 551.671 | -11,05 | ||||
| 2026-04-16 | 13F | Toth Financial Advisory Corp | 7.100 | -11,25 | 211 | -31,49 | ||||
| 2026-02-10 | 13F | State of Wyoming | 11.599 | 0,98 | 447 | 10,10 | ||||
| 2026-02-13 | 13F | SRS Capital Advisors, Inc. | 2.048 | -66,48 | 79 | -63,89 | ||||
| 2025-11-10 | 13F | Hartland & Co., LLC | 0 | -100,00 | 0 | |||||
| 2026-04-21 | 13F | Venturi Wealth Management, LLC | 32.519 | -20,83 | 968 | -38,85 | ||||
| 2026-04-08 | 13F | Wealth Science Advisors LLC | 89 | 3 | ||||||
| 2026-04-13 | 13F | Mather Group, Llc. | 17 | 1 | ||||||
| 2026-02-17 | 13F | Trexquant Investment LP | 11.128 | -94,64 | 429 | -94,16 | ||||
| 2026-02-17 | 13F | State Of Wisconsin Investment Board | 767.538 | 29.847 | ||||||
| 2026-02-17 | 13F | Polar Capital Holdings Plc | 0 | -100,00 | 0 | |||||
| 2026-02-17 | 13F | Canada Pension Plan Investment Board | 2.871.076 | 43,31 | 111.531 | 58,36 | ||||
| 2026-04-07 | 13F | Farther Finance Advisors, LLC | 12.104 | 29,11 | 369 | 1,94 | ||||
| 2026-04-22 | 13F | Sterling Capital Management LLC | 17.519 | 35,69 | 522 | 4,83 | ||||
| 2026-02-13 | 13F | National Bank Of Canada /fi/ | 328.049 | -0,08 | 12.656 | -15,48 | ||||
| 2026-02-17 | 13F | Optiver Holding B.V. | Put | 703.400 | -32,26 | 27.123 | -26,23 | |||
| 2026-04-28 | 13F | LGT Group Foundation | 137.484 | 1,51 | 4.091 | -22,24 | ||||
| 2026-02-17 | 13F | Optiver Holding B.V. | Call | 246.300 | -11,37 | 9.497 | -3,49 | |||
| 2026-02-13 | 13F | Pinnacle Wealth Planning Services, Inc. | 8.163 | 9,88 | 315 | 19,39 | ||||
| 2026-02-17 | 13F | Millennium Management Llc | Put | 123.000 | -23,22 | 4.152 | -13,52 | |||
| 2026-02-17 | 13F | Millennium Management Llc | Call | 121.800 | 604,05 | 4.296 | 656,34 | |||
| 2026-02-11 | 13F | Metis Global Partners, LLC | 53.896 | -8,76 | 2.097 | 1,01 | ||||
| 2026-02-17 | 13F | Millennium Management Llc | 1.153.101 | 20,01 | 44.464 | 30,69 | ||||
| 2025-11-13 | 13F | Capital Wealth Planning, LLC | 0 | -100,00 | 0 | |||||
| 2026-02-10 | 13F | Savant Capital, LLC | 12.253 | 32,34 | 472 | 44,34 | ||||
| 2026-02-11 | 13F | J.Safra Asset Management Corp | 494 | 19 | ||||||
| 2026-02-12 | 13F | Steward Partners Investment Advisory, Llc | 574 | 17,14 | 22 | 29,41 | ||||
| 2026-04-15 | 13F | Signature Estate & Investment Advisors Llc | 8.509 | 2,77 | 253 | -20,69 | ||||
| 2026-04-30 | 13F | Nisa Investment Advisors, Llc | 953 | 6,12 | 28 | -17,65 | ||||
| 2026-01-29 | 13F | Concurrent Investment Advisors, LLC | 12.754 | 80,14 | 492 | 96,40 | ||||
| 2026-04-08 | 13F | Arlington Trust Co LLC | 191 | 6 | ||||||
| 2026-02-04 | 13F | Valeo Financial Advisors, LLC | 10.864 | 10,15 | 419 | 19,77 | ||||
| 2026-02-12 | 13F | Third Avenue Management Llc | 337.193 | 13.002 | ||||||
| 2026-02-13 | 13F | Mml Investors Services, Llc | 112.972 | 16,44 | 4.356 | 26,81 | ||||
| 2026-02-05 | 13F | Gabelli Funds Llc | 38.000 | 0,00 | 1.465 | 8,92 | ||||
| 2026-02-05 | 13F | Allworth Financial LP | 4.330 | 28,26 | 167 | 39,50 | ||||
| 2026-02-10 | 13F/A | Northwestern Mutual Wealth Management Co | 18.492 | 132,87 | 713 | 153,74 | ||||
| 2025-11-14 | 13F | Cubist Systematic Strategies, LLC | 0 | -100,00 | 0 | -100,00 | ||||
| 2026-04-27 | 13F | HB Wealth Management, LLC | 11.448 | 16,20 | 341 | -10,29 | ||||
| 2026-02-05 | 13F | AlphaCore Capital LLC | 46.740 | -9,66 | 1.802 | -1,64 | ||||
| 2026-02-06 | 13F | Cullen/frost Bankers, Inc. | 9 | 0 | ||||||
| 2026-02-05 | 13F | Baader Bank INC | 346.255 | 3,62 | 13.465 | 14,33 | ||||
| 2026-02-06 | 13F | Global Retirement Partners, LLC | 29.948 | 76,51 | 1.155 | 92,33 | ||||
| 2026-02-13 | 13F | Atlas Capital Advisors Llc | 22.816 | -13,29 | 880 | 14,16 | ||||
| 2026-04-16 | 13F | Baron Wealth Management LLC | 24.859 | -9,38 | 740 | -29,99 | ||||
| 2025-11-13 | 13F | Entropy Technologies, LP | 0 | -100,00 | 0 | -100,00 | ||||
| 2026-02-13 | 13F | NLB Skladi, upravljanje premozenja, d.o.o. | 68.932 | 2.678 | ||||||
| 2025-11-06 | 13F | Haven Private, LLC | 0 | -100,00 | 0 | -100,00 | ||||
| 2025-11-13 | 13F | Arrowstreet Capital, Limited Partnership | 0 | -100,00 | 0 | -100,00 | ||||
| 2026-02-10 | 13F | Goldman Sachs Group Inc | 16.725.910 | -4,22 | 644.951 | 4,30 | ||||
| 2026-02-05 | 13F | Qsemble Capital Management, LP | 43.761 | 1.687 | ||||||
| 2026-02-10 | 13F | Goldman Sachs Group Inc | Call | 746.400 | -75,33 | 28.781 | -73,14 | |||
| 2026-01-30 | 13F | Catalytic Wealth RIA, LLC | 20.391 | 7,56 | 786 | 17,14 | ||||
| 2026-02-10 | 13F | Goldman Sachs Group Inc | Put | 4.247.600 | -59,64 | 163.787 | -56,05 | |||
| 2026-04-21 | 13F | Wedbush Securities Inc | 7.552 | -4,02 | 0 | |||||
| 2026-02-17 | 13F | Quadrature Capital Ltd | 8.040 | 310 | ||||||
| 2026-02-13 | 13F | Sofos Investments, Inc. | 1 | -96,30 | 0 | |||||
| 2026-04-29 | 13F | Cary Street Partner Investment Advisory Llc | 1.109 | -13,90 | 33 | -32,65 | ||||
| 2026-02-13 | 13F | Toroso Investments, LLC | 6.204 | 240 | ||||||
| 2026-02-17 | 13F | Oddo Bhf Asset Management Sas | 0 | -100,00 | 0 | |||||
| 2026-02-12 | 13F | Intesa Sanpaolo Wealth Management | 2.557 | 99 | ||||||
| 2026-02-17 | 13F | Parallax Volatility Advisers, L.P. | Put | 0 | -100,00 | 0 | ||||
| 2026-02-17 | 13F | Susquehanna Advisors Group, Inc. | 0 | -100,00 | 0 | |||||
| 2025-11-14 | 13F | Point72 Hong Kong Ltd | 0 | -100,00 | 0 | -100,00 | ||||
| 2026-04-08 | 13F | Wealth Enhancement Advisory Services, Llc | 34.873 | -19,64 | 1.038 | -38,54 | ||||
| 2026-02-11 | 13F | Fox Run Management, L.l.c. | 0 | -100,00 | 0 | |||||
| 2026-04-28 | 13F | Nbt Bank N A /ny | 10.000 | 0,00 | 290 | -25,90 | ||||
| 2026-02-17 | 13F | Susquehanna International Group, Llp | Call | 585.100 | -22,59 | 22.561 | -15,70 | |||
| 2026-02-17 | 13F | Susquehanna International Group, Llp | 33.900 | -19,65 | 1.307 | -12,46 | ||||
| 2026-02-17 | 13F | Susquehanna International Group, Llp | Put | 853.100 | 7,42 | 32.896 | 16,97 | |||
| 2026-04-30 | 13F | Waterfront Wealth Inc. | 24.601 | 177,60 | 733 | 109,74 | ||||
| 2026-04-06 | 13F | Highline Wealth Partners Llc | 51 | -64,83 | 2 | -80,00 | ||||
| 2026-02-17 | 13F | Philadelphia Financial Management of San Francisco, LLC | 436.262 | 4,88 | 16.822 | 14,21 | ||||
| 2026-02-17 | 13F | Russell Investments Group, Ltd. | 3.122.270 | -5,03 | 121.412 | 4,88 | ||||
| 2026-02-11 | 13F | LPL Financial LLC | 111.528 | 6,08 | 4.301 | 15,53 | ||||
| 2025-11-07 | 13F | Atticus Wealth Management, Llc | 0 | -100,00 | 0 | |||||
| 2026-04-02 | 13F | Byrne Asset Management LLC | 1.895 | 56 | ||||||
| 2026-02-04 | 13F | HighPoint Advisor Group LLC | 6.120 | 236 | ||||||
| 2026-04-24 | 13F | Root Financial Partners, LLC | 369 | -46,68 | 11 | -61,54 | ||||
| 2026-02-17 | 13F | DZ BANK AG Deutsche Zentral Genossenschafts Bank, Frankfurt am Main | 14.619.298 | 2,34 | 564.573 | 12,32 | ||||
| 2026-04-15 | 13F | Financial Management Professionals, Inc. | 151 | 0,00 | 4 | -20,00 | ||||
| 2026-02-13 | 13F | Allianz Se | 35.000 | 0,00 | 1.361 | 10,29 | ||||
| 2026-02-09 | 13F | Jefferies Financial Group Inc. | 234.537 | 268,75 | 9.117 | 307,74 | ||||
| 2026-02-18 | 13F | EP Wealth Advisors, Inc. | 6.399 | 247 | ||||||
| 2026-02-10 | 13F | Intech Investment Management Llc | 980.976 | -22,57 | 38.146 | -14,44 | ||||
| 2026-04-30 | 13F | BRYN MAWR TRUST Co | 0 | -100,00 | 0 | |||||
| 2026-01-29 | 13F | Concord Wealth Partners | 0 | -100,00 | 0 | |||||
| 2026-02-11 | 13F | Simplex Trading, Llc | Call | 125.100 | -45,94 | 4.824 | 60.187,50 | |||
| 2026-02-11 | 13F | Simplex Trading, Llc | Put | 167.600 | -13,74 | 6.463 | 107.600,00 | |||
| 2026-02-12 | 13F | Pinnacle Holdings, LLC | 24.900 | 0,00 | 960 | 8,97 | ||||
| 2026-04-28 | 13F | Steigerwald, Gordon & Koch Inc. | 500 | 0,00 | 15 | -26,32 | ||||
| 2026-04-23 | 13F | SJS Investment Consulting Inc. | 593 | -17,41 | 18 | -37,04 | ||||
| 2026-04-15 | 13F | FNY Investment Advisers, LLC | 0 | -100,00 | 0 | |||||
| 2026-01-30 | 13F | Mitsubishi UFJ Trust & Banking Corp | 113.930 | -29,21 | 4.390 | -22,74 | ||||
| 2026-02-12 | 13F | Ensign Peak Advisors, Inc | 80.200 | 0,00 | 3.119 | 10,49 | ||||
| 2026-02-10 | 13F | Measured Wealth Private Client Group, LLC | 12.122 | 467 | ||||||
| 2026-04-10 | 13F | Henry James International Management Inc. | 163.636 | -29,65 | 4.873 | -45,67 | ||||
| 2026-04-22 | 13F | Traveka Wealth, LLC | 8.139 | -0,20 | 242 | -22,93 | ||||
| 2026-02-03 | 13F | Crossmark Global Holdings, Inc. | 162.712 | -6,19 | 6.274 | 2,17 | ||||
| 2026-02-12 | 13F | Penserra Capital Management LLC | 120 | -28,57 | 0 | |||||
| 2026-02-11 | 13F | Capital Group Investment Management Pte. Ltd. | 170.510 | -3,20 | 6.630 | 6,97 | ||||
| 2026-02-17 | 13F | Glenmede Trust Co Na | 31.922 | 18,02 | 1.231 | 90,99 | ||||
| 2026-02-17 | 13F | Old Mission Capital Llc | 5.636 | -53,88 | 255 | 64,52 | ||||
| 2026-04-27 | 13F | Y-Intercept (Hong Kong) Ltd | 0 | -100,00 | 0 | |||||
| 2026-02-12 | 13F | Marex Group plc | 100.134 | -54,58 | 3.861 | -50,28 | ||||
| 2026-01-22 | 13F | Richardson Financial Services Inc. | 28 | 1 | ||||||
| 2026-04-15 | 13F | Radnor Capital Management, LLC | 55.400 | -19,01 | 1.650 | -37,47 | ||||
| 2026-04-29 | 13F | Sageworth Trust Co | 23.135 | 689 | ||||||
| 2026-02-10 | 13F | Bnp Paribas | 17.000 | 0,00 | 662 | 10,72 | ||||
| 2026-02-03 | 13F | Alpha Cubed Investments, LLC | 6.240 | 1,78 | 241 | 10,60 | ||||
| 2026-02-26 | 13F | TD Capital Management LLC | 14 | 1 | ||||||
| 2026-04-23 | 13F | North Star Investment Management Corp. | 15 | -80,26 | 0 | -100,00 | ||||
| 2026-02-10 | 13F | Martin Investment Management, LLC | 525.950 | 20.281 | ||||||
| 2026-02-10 | 13F | Norges Bank | 13.705.195 | 532.397 | ||||||
| 2026-04-20 | 13F | Banque Cantonale Vaudoise | 72.849 | -0,20 | 2.108 | -25,75 | ||||
| 2026-02-10 | 13F | Principia Wealth Advisory, LLC | 106 | -0,93 | 4 | 33,33 | ||||
| 2026-02-12 | 13F | JPL Wealth Management, LLC | 0 | -100,00 | 0 | |||||
| 2026-02-12 | 13F | Aviva Plc | 2.091.968 | 3,39 | 81.278 | 14,31 | ||||
| 2026-01-13 | 13F | Stephens Consulting, LLC | 99 | 4 | ||||||
| 2025-11-10 | 13F | Jupiter Asset Management Ltd | 0 | -100,00 | 0 | |||||
| 2025-11-13 | 13F | Gordian Capital Singapore Pte Ltd | 0 | -100,00 | 0 | |||||
| 2026-02-17 | 13F | Keebeck Wealth Management, LLC | 5.667 | 219 | ||||||
| 2026-04-24 | 13F | USS Investment Management Ltd | 288.107 | 1,03 | 8.569 | -23,00 | ||||
| 2026-02-17 | 13F | Royal Bank Of Canada | 1.849.265 | -3,08 | 71.307 | 5,54 | ||||
| 2026-04-29 | 13F | American Capital Advisory, LLC | 0 | -100,00 | 0 | |||||
| 2026-02-10 | 13F | Greenspring Advisors, LLC | 7.037 | 271 | ||||||
| 2025-11-07 | 13F | Sierra Ocean, Llc | 0 | -100,00 | 0 | |||||
| 2026-02-06 | 13F | Bare Financial Services, Inc | 81 | 200,00 | 3 | |||||
| 2026-02-17 | 13F | Armistice Capital, Llc | 0 | -100,00 | 0 | |||||
| 2026-04-30 | 13F | Whipplewood Advisors, LLC | 221 | 7 | ||||||
| 2026-04-29 | 13F | Skopos Labs, Inc. | 8.372 | 22,09 | 249 | -5,68 | ||||
| 2026-02-11 | 13F | Capital World Investors | 19.455 | -99,56 | 755 | -99,52 | ||||
| 2025-11-12 | 13F | United Advisor Group, LLC | 0 | -100,00 | 0 | -100,00 | ||||
| 2026-04-21 | 13F | GHP Investment Advisors, Inc. | 2.135 | 64 | ||||||
| 2026-04-28 | 13F | Meridian Investment Counsel Inc. | 8.000 | 0,00 | 238 | -22,73 | ||||
| 2026-01-14 | 13F | Wolff Wiese Magana Llc | 0 | -100,00 | 0 | |||||
| 2026-02-17 | 13F | Royal Bank Of Canada | Put | 250.000 | 9.640 | |||||
| 2026-04-20 | 13F | Ronald Blue Trust, Inc. | 7.030 | -9,55 | 209 | -30,10 | ||||
| 2026-04-23 | 13F | Oppenheimer Asset Management Inc. | 72.695 | 50,18 | 2.165 | 15,97 | ||||
| 2026-02-02 | 13F | Ashton Thomas Securities, Llc | 17.489 | 37,81 | 674 | 50,11 | ||||
| 2026-02-17 | 13F | Bank Of America Corp /de/ | 11.700.990 | -5,38 | 451.190 | 3,03 | ||||
| 2026-02-11 | 13F | GW&K Investment Management, LLC | 308 | 0,00 | 0 | |||||
| 2026-04-09 | 13F | FCG Investment Co | 37.838 | -26,71 | 1.127 | -38,40 | ||||
| 2026-02-17 | 13F | Css Llc/il | 17.740 | -4,31 | 684 | 4,27 | ||||
| 2026-02-10 | 13F | Bank of New York Mellon Corp | 3.142.981 | -0,60 | 121.193 | 8,62 | ||||
| 2026-02-17 | 13F | Credit Agricole S A | 5.995.534 | -10,55 | 231.188 | -2,59 | ||||
| 2026-04-30 | 13F | Clear Street Markets Llc | 500 | -86,84 | 15 | -90,41 | ||||
| 2026-05-01 | 13F | Citizens Financial Group Inc/ri | 9.653 | -3,85 | 287 | -25,84 | ||||
| 2026-02-17 | 13F | MIRAE ASSET GLOBAL ETFS HOLDINGS Ltd. | 267.807 | -6,85 | 10.414 | 2,92 | ||||
| 2026-02-17 | 13F | Capital Fund Management S.a. | Put | 341.500 | 297,09 | 13.168 | 332,45 | |||
| 2026-02-17 | 13F | Capital Fund Management S.a. | Call | 149.500 | 204,48 | 5.765 | 231,65 | |||
| 2026-02-12 | 13F | Triumph Capital Management | 1.167 | 29,67 | 45 | 45,16 | ||||
| 2026-02-12 | 13F | Scotia Capital Inc. | 8.874 | 5,33 | 342 | 14,77 | ||||
| 2026-02-12 | 13F | DRW Securities, LLC | 10.000 | 386 | ||||||
| 2026-02-13 | 13F | Ieq Capital, Llc | 25.949 | 23,40 | 1.001 | 34,41 | ||||
| 2026-04-13 | 13F | Highland Capital Management, Llc | 24.090 | -0,41 | 717 | -23,07 | ||||
| 2026-04-28 | 13F | Sage Rhino Capital Llc | 8.210 | -2,46 | 244 | -24,69 | ||||
| 2026-02-10 | 13F | Godfrey Financial Associates, Inc. | 9 | 0 | ||||||
| 2025-11-14 | 13F | Aigen Investment Management, Lp | 0 | -100,00 | 0 | -100,00 | ||||
| 2026-02-17 | 13F | Cresset Asset Management, LLC | 10.860 | -1,65 | 419 | 7,18 | ||||
| 2026-02-17 | 13F | Public Employees Retirement System Of Ohio | 1.185.994 | 1,89 | 46.111 | 12,29 | ||||
| 2026-04-10 | 13F | Intellectus Partners, LLC | 81.232 | 0,00 | 2.419 | -22,77 | ||||
| 2026-02-17 | 13F | Quantinno Capital Management LP | 590.425 | 20,88 | 22.767 | 31,63 | ||||
| 2025-11-14 | 13F | Virtu Financial LLC | 0 | -100,00 | 0 | -100,00 | ||||
| 2026-01-29 | 13F | Sanctuary Advisors, LLC | 57.725 | -5,65 | 2.226 | 2,72 | ||||
| 2026-04-24 | 13F | Optas, LLC | 0 | -100,00 | 0 | |||||
| 2026-01-30 | 13F/A | M&t Bank Corp | 21.047 | 5,07 | 811 | 14,39 | ||||
| 2026-04-13 | 13F | Artemis Investment Management LLP | 0 | -100,00 | 0 | |||||
| 2026-02-17 | 13F | Cape Investment Advisory, Inc. | 212 | 0,00 | 8 | 14,29 | ||||
| 2025-11-14 | 13F | Eqis Capital Management, Inc. | 0 | -100,00 | 0 | |||||
| 2026-02-11 | 13F | O'shaughnessy Asset Management, Llc | 574.990 | -2,20 | 22.166 | 6,55 | ||||
| 2026-02-09 | 13F | Huntington National Bank | 397 | 13,11 | 15 | 25,00 | ||||
| 2026-02-04 | 13F | Independent Advisor Alliance | 6.540 | -3,07 | 252 | 5,88 | ||||
| 2025-11-13 | 13F | Clear Street Markets Llc | Put | 0 | -100,00 | 0 | -100,00 | |||
| 2026-02-13 | 13F | Parkside Financial Bank & Trust | 834 | 0,00 | 32 | 10,34 | ||||
| 2026-02-09 | 13F | Todd Asset Management Llc | 134.444 | -60,48 | 5.184 | -56,01 | ||||
| 2026-04-16 | 13F | TB Alternative Assets Ltd. | 0 | -100,00 | 0 | |||||
| 2026-02-13 | 13F | BNP Paribas Asset Management Holding S.A. | 4.092.647 | 136 | ||||||
| 2026-02-13 | 13F | BRITISH COLUMBIA INVESTMENT MANAGEMENT Corp | 11.481 | 0,37 | 446 | 10,70 | ||||
| 2026-02-06 | 13F | Vestmark Advisory Solutions, Inc. | 89.788 | 78,08 | 3.462 | 93,95 | ||||
| 2026-02-18 | 13F | GWM Advisors LLC | 13.010 | 65,69 | 502 | 80,22 | ||||
| 2026-02-12 | 13F | Kahn Brothers Group Inc /de/ | 10.000 | 0,00 | 386 | 8,76 | ||||
| 2026-04-28 | 13F | Alberta Investment Management Corp | 0 | -100,00 | 0 | |||||
| 2026-04-30 | 13F | Private Trust Co Na | 249 | -23,62 | 7 | -41,67 | ||||
| 2026-02-11 | 13F | Jpmorgan Chase & Co | 7.293.341 | -38,03 | 281.231 | -32,52 | ||||
| 2026-02-12 | 13F | Renaissance Technologies Llc | 0 | -100,00 | 0 | |||||
| 2026-02-11 | 13F | Jpmorgan Chase & Co | Call | 1.447.900 | -46,47 | 55.831 | -41,71 | |||
| 2026-02-05 | 13F | Bessemer Group Inc | 1.991 | 0,25 | 0 | |||||
| 2026-02-11 | 13F | Jpmorgan Chase & Co | Put | 699.100 | -87,34 | 26.957 | -86,22 | |||
| 2026-02-13 | 13F | Cornerstone Financial Management LLC | 77 | 3 | ||||||
| 2026-02-14 | 13F | Frec Markets, Inc. | 5.645 | 218 | ||||||
| 2026-04-21 | 13F | Founders Capital Management | 1.500 | -25,00 | 45 | -42,86 | ||||
| 2026-02-17 | 13F | Ameriprise Financial Inc | 61.564 | 8,64 | 2.374 | 18,35 | ||||
| 2026-02-17 | 13F | GeoWealth Management, LLC | 23.911 | -51,76 | 922 | -47,46 | ||||
| 2025-11-20 | 13F | Maven Securities LTD | 0 | -100,00 | 0 | |||||
| 2026-02-12 | 13F | Insigneo Advisory Services, Llc | 6.018 | -33,50 | 232 | -27,50 | ||||
| 2026-04-22 | 13F | ABN AMRO Bank N.V. | 202.511 | -23,34 | 5.900 | -42,35 | ||||
| 2026-02-13 | 13F | Barclays Plc | 0 | -100,00 | 0 | |||||
| 2026-02-13 | 13F | Banco Santander, S.A. | 4.068.622 | 4,74 | 156.886 | 14,06 | ||||
| 2026-04-08 | 13F | Heritage Family Offices, LLP | 6.888 | -48,23 | 205 | -60,04 | ||||
| 2026-04-22 | 13F | Stone House Investment Management, LLC | 8 | 14,29 | 0 | |||||
| 2026-04-23 | 13F | Lansforsakringar Fondforvaltning AB (publ) | 760.516 | 2,91 | 22.007 | -23,42 | ||||
| 2026-05-01 | 13F | Wealthspire Advisors, LLC | 0 | -100,00 | 0 | |||||
| 2026-02-17 | 13F | Mercer Global Advisors Inc /adv | 158.803 | 5,50 | 6.123 | 14,90 | ||||
| 2026-02-13 | 13F | Vontobel Holding Ltd. | Call | 18.000 | 200,00 | 699 | 232,86 | |||
| 2026-02-13 | 13F | Vontobel Holding Ltd. | 347.740 | -8,54 | 13.508 | 1,08 | ||||
| 2026-02-17 | 13F | XTX Topco Ltd | 31.358 | 278,63 | 1.209 | 312,63 | ||||
| 2026-02-13 | 13F | Vontobel Holding Ltd. | Put | 105.000 | -46,15 | 4.079 | -40,50 | |||
| 2026-02-13 | 13F | Wells Fargo & Company/mn | 1.116.240 | 2,72 | 43.042 | 11,86 | ||||
| 2026-04-07 | 13F | Signaturefd, Llc | 40.943 | 6,19 | 1.219 | -17,97 | ||||
| 2026-04-23 | 13F | Oppenheimer & Co Inc | 153.047 | -13,17 | 4.558 | -32,95 | ||||
| 2026-04-06 | 13F | GAMMA Investing LLC | 537 | 0,00 | 16 | -25,00 | ||||
| 2026-04-17 | 13F | CENTRAL TRUST Co | 74 | 100,00 | 2 | 100,00 | ||||
| 2026-02-12 | 13F | CIBC Private Wealth Group, LLC | 1.926 | -32,04 | 74 | -26,00 | ||||
| 2026-04-14 | 13F | Westend Capital Management LLC | 371.021 | 2,85 | 11.049 | -20,57 | ||||
| 2026-01-29 | 13F | Sava Infond d.o.o. | 6.400 | 0,00 | 249 | 10,22 | ||||
| 2026-04-20 | 13F | Contravisory Investment Management, Inc. | 9.740 | -6,14 | 290 | -27,50 | ||||
| 2026-02-13 | 13F | Quarry LP | 0 | -100,00 | 0 | |||||
| 2026-02-27 | 13F | Groupama Asset Managment | 147.750 | 4,73 | 4.892 | 15,79 | ||||
| 2026-02-10 | 13F | MUFG Securities EMEA plc | 134 | 0,00 | 5 | 25,00 | ||||
| 2026-02-13 | 13F | Evelyn Partners Investment Management Services Ltd | 1.432 | 0,00 | 56 | 10,00 | ||||
| 2026-04-13 | 13F | True Wealth Design, LLC | 1.023 | 77,30 | 30 | 36,36 | ||||
| 2026-04-30 | 13F | Cambridge Investment Research Advisors, Inc. | 15.395 | 0,42 | 0 | |||||
| 2026-02-09 | 13F | Legal & General Group Plc | 14.664.607 | 2,32 | 570.302 | 13,06 | ||||
| 2026-02-12 | 13F | Principal Securities, Inc. | 0 | -100,00 | 0 | -100,00 | ||||
| 2026-04-27 | 13F | Albion Financial Group /ut | 175 | 20,69 | 5 | 0,00 | ||||
| 2026-01-28 | 13F | CAPROCK Group, Inc. | 36.195 | 9,83 | 1.396 | 20,57 | ||||
| 2026-02-10 | 13F | Acadian Asset Management Llc | 19.876.273 | 5,78 | 773 | 16,79 | ||||
| 2026-02-14 | 13F | Rockefeller Capital Management L.P. | 8.837 | -95,93 | 341 | -95,57 | ||||
| 2026-02-13 | 13F | Alerus Financial Na | 300 | 0,00 | 12 | 10,00 | ||||
| 2026-02-12 | 13F | M&G Plc | 17.813 | -53,54 | 692 | -48,78 | ||||
| 2025-11-12 | 13F | Sciencast Management LP | 0 | -100,00 | 0 | -100,00 | ||||
| 2026-04-29 | 13F | CVA Family Office, LLC | 134 | 36,73 | 4 | 0,00 | ||||
| 2026-02-13 | 13F | Ubs Asset Management Americas Inc | 10.715 | 413 | ||||||
| 2026-02-12 | 13F | Commonwealth Equity Services, Llc | 8.244 | -2,21 | 318 | |||||
| 2026-04-27 | 13F | Meramec Financial Planners, LLC | 1.000 | 0,00 | 33 | -10,81 | ||||
| 2026-02-09 | 13F | Frazier Financial Advisors, LLC | 874 | -2,67 | 34 | 6,45 | ||||
| 2026-04-27 | 13F | Sound Income Strategies, LLC | 105 | -54,55 | 3 | -62,50 | ||||
| 2026-04-24 | 13F | UMA Financial Services, Inc. | 105 | -45,31 | 3 | -57,14 | ||||
| 2026-02-05 | 13F | Phoenix Holdings Ltd. | 8.100 | -27,03 | 312 | -20,61 | ||||
| 2026-04-24 | 13F | Vision Financial Markets Llc | 315 | 9 | ||||||
| 2026-02-17 | 13F | Summit Global Investments | 35.483 | 1 | ||||||
| 2026-04-13 | 13F | Massmutual Trust Co Fsb/adv | 2.603 | -17,21 | 78 | -36,36 | ||||
| 2026-02-11 | 13F | Deutsche Bank Ag\ | 56.750.099 | -33,99 | 2.188.284 | -28,12 | ||||
| 2026-02-13 | 13F | Walleye Capital LLC | Put | 154.600 | -49,66 | 5.961 | -45,18 | |||
| 2025-11-14 | 13F | ICONIQ Capital, LLC | 0 | -100,00 | 0 | |||||
| 2026-02-13 | 13F | Walleye Capital LLC | 14.749 | -58,48 | 569 | -54,81 | ||||
| 2025-11-06 | 13F | Ameritas Advisory Services, LLC | 0 | -100,00 | 0 | |||||
| 2026-04-10 | 13F | Perigon Wealth Management, LLC | 0 | -100,00 | 0 | |||||
| 2026-02-13 | 13F | Walleye Capital LLC | Call | 21.100 | -88,69 | 814 | -87,69 | |||
| 2025-11-12 | 13F | Cambria Investment Management, L.P. | 149.542 | 0,00 | 4.434 | 0,00 | ||||
| 2026-02-17 | 13F | Worldquant Millennium Advisors Llc | 331.962 | 65,27 | 12.904 | 82,70 | ||||
| 2026-02-04 | 13F | Paradigm Asset Management Co Llc | 36.800 | 1.431 | ||||||
| 2026-02-17 | 13F | Raymond James Financial Inc | 745.191 | 0,97 | 28.739 | 9,98 | ||||
| 2026-04-24 | 13F | Triasima Portfolio Management inc. | 0 | -100,00 | 0 | |||||
| 2026-02-13 | 13F | Charles Schwab Investment Management Inc | 311.271 | 12,80 | 12.003 | 22,83 | ||||
| 2025-11-13 | 13F | Sienna Gestion | 0 | -100,00 | 0 | -100,00 | ||||
| 2025-11-10 | 13F | Optiver Holding B.V. | 0 | -100,00 | 0 | -100,00 | ||||
| 2026-02-13 | 13F | Osmosis Investment Management UK Ltd | 45.621 | 1.774 | ||||||
| 2026-02-10 | 13F | SCS Capital Management LLC | 218.560 | 0,02 | 8.428 | 8,92 | ||||
| 2026-03-04 | 13F | SHP Wealth Management | 92 | 4 | ||||||
| 2026-02-17 | 13F | Appaloosa Lp | 3.150.000 | -16,89 | 121.464 | -9,49 | ||||
| 2026-02-10 | 13F | Forsta Ap-fonden | 427.972 | 14,19 | 0 | |||||
| 2026-04-30 | 13F | ASR Vermogensbeheer N.V. | 584.563 | 35,35 | 16.901 | 0,63 | ||||
| 2026-05-01 | 13F | International Assets Investment Management, Llc | 0 | -100,00 | 0 | |||||
| 2026-01-28 | 13F | DekaBank Deutsche Girozentrale | Put | 0 | -100,00 | 0 | ||||
| 2026-04-23 | 13F | TFC Financial Management | 514 | 0,00 | 15 | -21,05 | ||||
| 2026-02-04 | 13F | Dogwood Wealth Management LLC | 49 | 0,00 | 2 | 0,00 | ||||
| 2026-02-17 | 13F | United Capital Financial Advisers, Llc | 29.155 | 3,95 | 1.124 | 13,19 | ||||
| 2026-02-11 | 13F | West Family Investments, Inc. | 13.022 | 0,00 | 502 | 8,89 | ||||
| 2026-02-17 | 13F | Wiley Bros.-aintree Capital, Llc | 100.819 | 16,13 | 3.889 | 26,51 | ||||
| 2026-04-07 | 13F | Park Avenue Securities Llc | 27.354 | -42,23 | 1 | -100,00 | ||||
| 2026-02-10 | 13F | Quantbot Technologies LP | 246.916 | 858,71 | 9.521 | 945,12 | ||||
| 2026-02-11 | 13F | Manchester Capital Management LLC | 9.069 | 350 | ||||||
| 2026-05-01 | 13F/A | Lodestone Wealth Management LLC | 90 | 0,00 | 3 | -33,33 | ||||
| 2026-01-15 | 13F | Allspring Global Investments Holdings, LLC | 39.679 | -5,02 | 1.542 | 4,97 | ||||
| 2026-02-17 | 13F | Tower Research Capital LLC (TRC) | 57.569 | 179,33 | 2.220 | 204,39 | ||||
| 2026-02-17 | 13F | Edmond De Rothschild Holding S.a. | 1.229.612 | 0,53 | 47.837 | 11,23 | ||||
| 2026-02-12 | 13F | MetLife Investment Management, LLC | 166.265 | -3,92 | 6.463 | 6,12 | ||||
| 2026-02-11 | 13F | Franklin Resources Inc | 8.933.075 | -10,22 | 343.702 | -1,73 | ||||
| 2026-04-20 | 13F | Ritholtz Wealth Management | 163.539 | -5,79 | 4.870 | -27,24 | ||||
| 2026-02-13 | 13F | Rhumbline Advisers | 24.156 | -3,18 | 931 | 5,44 | ||||
| 2026-04-27 | 13F | Truist Financial Corp | 17.616 | -4,88 | 525 | -26,61 | ||||
| 2026-04-30 | 13F | Cromwell Holdings LLC | 6.166 | 0,00 | 184 | -22,78 | ||||
| 2025-11-13 | 13F | Eisler Capital Management Ltd. | Put | 250.000 | 0,00 | 8.835 | 20,96 | |||
| 2026-05-01 | 13F | Thrivent Financial For Lutherans | 66.184 | -11,56 | 2 | -50,00 | ||||
| 2026-04-22 | 13F | Pictet Asset Management Holding SA | 2.209.846 | 39,96 | 63.943 | 4,16 | ||||
| 2026-04-30 | 13F | Munich Reinsurance Co Stock Corp in Munich | 1.361.924 | 39.411 | ||||||
| 2026-04-10 | 13F | Abound Wealth Management | 84 | -33,33 | 3 | -50,00 | ||||
| 2026-02-11 | 13F | Fiera Capital Corp | 236.337 | 25,97 | 9.113 | 37,18 | ||||
| 2026-02-11 | 13F | Capital International Investors | 66.506.600 | -19,43 | 2.586.227 | -10,92 | ||||
| 2026-01-27 | 13F | Zurcher Kantonalbank (Zurich Cantonalbank) | 1.632.150 | 1,03 | 63.468 | 11,63 | ||||
| 2026-02-17 | 13F | Magnetar Financial LLC | 0 | -100,00 | 0 | |||||
| 2026-02-11 | 13F | Capital Group Private Client Services, Inc. | 660.092 | -8,92 | 25.677 | 0,73 | ||||
| 2026-04-21 | 13F | Pinnacle Associates Ltd | 34.725 | -10,02 | 1.034 | -30,51 | ||||
| 2026-02-13 | 13F | MAI Capital Management | 4.525 | 4,05 | 174 | 12,99 | ||||
| 2026-02-24 | 13F | SG Trading Solutions, LLC | 35.772 | 1 | ||||||
| 2026-02-17 | 13F | Captrust Financial Advisors | 5.818 | -1,05 | 224 | 7,69 | ||||
| 2026-02-10 | 13F | Gifford Fong Associates | 15.000 | 0,00 | 1 | |||||
| 2025-11-13 | 13F | Glenmede Investment Management, LP | 29.345 | -4,35 | 1.039 | 15,70 | ||||
| 2026-01-27 | 13F | Institute for Wealth Management, LLC. | 6.533 | -2,75 | 252 | 5,91 | ||||
| 2026-01-20 | 13F | Myriad Asset Management US LP | 0 | -100,00 | 0 | |||||
| 2026-04-15 | 13F | Gf Fund Management Co. Ltd. | 0 | -100,00 | 0 | |||||
| 2026-02-13 | 13F | Caitong International Asset Management Co., Ltd | 380 | 2.823,08 | 15 | |||||
| 2026-02-10 | 13F | Natixis Advisors, L.p. | 359.703 | -16,63 | 14 | -13,33 | ||||
| 2026-02-13 | 13F | OpenArc Corporate Advisory, LLC | 5.296 | 204 | ||||||
| 2026-05-01 | 13F | Fifth Third Bancorp | 1.022 | 9,07 | 30 | -16,67 | ||||
| 2026-02-12 | 13F | Hollencrest Capital Management | 27.216 | 0,00 | 1.049 | 8,93 | ||||
| 2026-02-17 | 13F | HPC Germany GmbH & Co. KG | 49.718 | 0,00 | 1.930 | 9,60 | ||||
| 2026-04-27 | 13F | Ethic Inc. | 19.116 | 73,32 | 569 | 33,88 | ||||
| 2026-02-17 | 13F | Zurich Insurance Group Ltd/FI | 590.902 | 20,30 | 22.970 | 33,14 | ||||
| 2026-02-17 | 13F | Cetera Investment Advisers | 88.477 | 40,90 | 3.412 | 53,44 | ||||
| 2026-04-24 | 13F | Essex Financial Services, Inc. | 34.246 | 59,37 | 1.020 | 23,07 | ||||
| 2026-04-29 | 13F | Credit Industriel Et Commercial | 397 | -74,14 | 11 | -81,36 | ||||
| 2026-02-10 | 13F | Private Wealth Asset Management, LLC | 49 | 0,00 | 2 | 0,00 | ||||
| 2026-02-11 | 13F | Cerity Partners LLC | 134.613 | 3,47 | 5.191 | 12,68 | ||||
| 2026-02-17 | 13F | Alliancebernstein L.p. | 664.920 | -12,94 | 25.639 | -5,20 | ||||
| 2026-04-03 | 13F | Investors Research Corp | 5.992 | 0,00 | 178 | -22,94 | ||||
| 2026-02-11 | 13F | Twin Tree Management, LP | Call | 7.400 | -86,83 | 285 | -85,68 | |||
| 2026-02-11 | 13F | Twin Tree Management, LP | Put | 26.500 | 32,50 | 1.022 | 44,21 | |||
| 2026-02-11 | 13F | Twin Tree Management, LP | 10.402 | 401 | ||||||
| 2026-02-10 | 13F | Td Asset Management Inc | 661.394 | -0,46 | 25.714 | 9,97 | ||||
| 2026-04-20 | 13F | YANKCOM Partnership | 0 | -100,00 | 0 | |||||
| 2026-02-13 | 13F | Morgan Stanley | 4.693.952 | 3,23 | 180.999 | 12,41 | ||||
| 2026-02-12 | 13F | Andra AP-fonden | 53.268 | 1.764 | ||||||
| 2026-01-26 | 13F | SMART Wealth LLC | 0 | -100,00 | 0 | |||||
| 2026-02-13 | 13F | Marshall Wace, Llp | 5.518.473 | 214.360 | ||||||
| 2026-01-29 | 13F | Teachers Retirement System Of The State Of Kentucky | 133.500 | -5,65 | 5 | 0,00 | ||||
| 2026-02-13 | 13F | Umb Bank N A/mo | 946 | 0,00 | 36 | 9,09 | ||||
| 2026-02-17 | 13F | Fwl Investment Management, Llc | 223 | 0,00 | 9 | 14,29 | ||||
| 2026-02-13 | 13F | Rokos Capital Management LLP | Call | 0 | -100,00 | 0 | ||||
| 2026-02-17 | 13F | Moore Capital Management, Lp | 1.177.988 | 86,39 | 45.796 | 106,07 | ||||
| 2026-01-23 | 13F | Westside Investment Management, Inc. | 1.186 | 0,00 | 47 | 9,52 | ||||
| 2026-02-02 | 13F | Montag A & Associates Inc | 0 | -100,00 | 0 | |||||
| 2026-02-11 | 13F | Dorsey & Whitney Trust CO LLC | 20.561 | 5,31 | 793 | 14,62 | ||||
| 2026-02-13 | 13F | American Century Companies Inc | 1.129.857 | -3,69 | 43.567 | 4,88 | ||||
| 2026-02-03 | 13F/A | Bank Of America Corp /de/ | Put | 0 | -100,00 | 0 | -100,00 | |||
| 2026-01-29 | 13F | Aprio Wealth Management, LLC | 24.313 | 0,83 | 938 | 9,85 | ||||
| 2026-02-13 | 13F | Manufacturers Life Insurance Company, The | 0 | -100,00 | 0 | |||||
| 2026-04-13 | 13F | IFP Advisors, Inc | 2.559 | 32,38 | 76 | 2,70 | ||||
| 2026-02-10 | 13F | Bnp Paribas Arbitrage, Sa | 264.882 | 3,67 | 10.214 | 12,89 | ||||
| 2026-04-06 | 13F | Versant Capital Management, Inc | 21.795 | 33,61 | 649 | 3,34 | ||||
| 2026-02-18 | 13F | Mackenzie Financial Corp | 294.181 | 67,16 | 11.419 | 84,64 | ||||
| 2026-01-27 | 13F | TD Waterhouse Canada Inc. | 90.013 | -31,61 | 3.470 | -25,73 | ||||
| 2026-02-17 | 13F | Dv Equities, Llc | 4.398 | 170 | ||||||
| 2026-02-17 | 13F | Advisory Services Network, LLC | 0 | -100,00 | 0 | |||||
| 2026-04-15 | 13F | Generali Investments CEE, investicni spolecnost, a.s. | 18.658 | 555 | ||||||
| 2026-02-04 | 13F | Pacer Advisors, Inc. | 1.134.357 | 4.470,33 | 50.970 | 5.745,07 | ||||
| 2026-04-14 | 13F | Pictet & Cie (Europe) SA | 80.551 | 1,70 | 2.331 | -24,33 | ||||
| 2026-02-13 | 13F | Citigroup Inc | Call | 88.400 | -74,63 | 3.438 | -72,08 | |||
| 2026-04-14 | 13F | Pictet & Cie (Europe) SA | Put | 6.000 | -45,45 | 174 | -59,48 | |||
| 2026-02-13 | 13F | Citigroup Inc | Put | 890.000 | 22,29 | 34.609 | 34,59 | |||
| 2026-02-12 | 13F | Federated Hermes, Inc. | 93.794 | -1,20 | 3.648 | 9,25 | ||||
| 2026-02-13 | 13F | Citigroup Inc | 5.960.521 | 51,97 | 231.781 | 67,26 | ||||
| 2026-04-27 | 13F | Leonteq Securities AG | 0 | -100,00 | 0 | |||||
| 2026-01-07 | 13F | Sagespring Wealth Partners, Llc | 12.764 | 6,20 | 492 | 15,76 | ||||
| 2026-01-28 | 13F | DekaBank Deutsche Girozentrale | 17.786.599 | -11,44 | 704 | -1,12 | ||||
| 2026-02-17 | 13F | Fullerton Fund Management Co Ltd | 20.606 | 51,73 | 801 | 67,22 | ||||
| 2026-04-06 | 13F | Rosenberg Matthew Hamilton | 4.216 | 0,00 | 126 | -22,84 | ||||
| 2026-02-03 | 13F | Generali Asset Management SPA SGR | 400.958 | -1,89 | 13.276 | 8,46 | ||||
| 2026-02-17 | 13F | Occudo Quantitative Strategies Lp | 276.908 | 10.678 | ||||||
| 2026-01-23 | 13F | Rsm Us Wealth Management Llc | 25.395 | 7,43 | 986 | 17,68 | ||||
| 2026-01-09 | 13F | SG Americas Securities, LLC | 0 | -100,00 | 0 | -100,00 | ||||
| 2026-02-17 | 13F | Lighthouse Investment Partners, LLC | 0 | -100,00 | 0 | |||||
| 2026-02-11 | 13F | Allianz Asset Management GmbH | 2.460.331 | 17,19 | 95.673 | 29,18 | ||||
| 2026-02-11 | 13F | Syon Capital Llc | 31.205 | 1.203 | ||||||
| 2026-04-27 | 13F | Td Private Client Wealth Llc | 532 | 184,49 | 16 | 114,29 | ||||
| 2026-02-02 | 13F | Cornerstone Planning Group LLC | 7.728 | 12.998,31 | 306 | 30.400,00 | ||||
| 2026-02-13 | 13F | Arkadios Wealth Advisors | 6.422 | -3,22 | 248 | 5,56 | ||||
| 2025-11-12 | 13F | Simplex Trading, Llc | 0 | -100,00 | 0 | |||||
| 2026-04-07 | 13F | Retirement Wealth Solutions LLC | 161 | -53,33 | 5 | -69,23 | ||||
| 2026-02-19 | 13F | CI Private Wealth, LLC | 29.314 | -31,89 | 1.125 | -26,05 | ||||
| 2026-02-10 | 13F | Nomura Asset Management Co Ltd | 0 | 0 | ||||||
| 2026-02-10 | 13F | Envestnet Asset Management Inc | 857.485 | -8,85 | 33.065 | -0,74 | ||||
| 2026-02-17 | 13F | Grantham, Mayo, Van Otterloo & Co. LLC | 3.822.714 | -9,33 | 148.650 | 0,19 | ||||
| 2026-04-22 | 13F | Advocate Investing Services LLC | 2.400 | 0,00 | 71 | -22,83 | ||||
| 2026-02-13 | 13F | LFG Wealth Partners, LLC | 33.666 | 1.298 | ||||||
| 2026-02-17 | 13F | Liontrust Investment Partners LLP | 5.702.338 | 8,34 | 221.741 | 19,72 | ||||
| 2026-04-23 | 13F | MQS Management LLC | 7.851 | 234 | ||||||
| 2026-02-11 | 13F | Winton Capital Group Ltd | 17.900 | 690 | ||||||
| 2026-02-17 | 13F | Caisse De Depot Et Placement Du Quebec | 4.128.475 | 104,19 | 160.517 | 125,61 | ||||
| 2026-04-29 | 13F | WPG Advisers, LLC | 163 | 0,00 | 5 | -33,33 | ||||
| 2026-02-17 | 13F | Citadel Advisors Llc | Call | 314.100 | -11,87 | 12.112 | -4,03 | |||
| 2026-02-17 | 13F | Citadel Advisors Llc | 648.564 | -10,10 | 25.009 | -2,10 | ||||
| 2026-02-17 | 13F | Ancora Advisors, LLC | 93 | 4 | ||||||
| 2025-11-04 | 13F | High Note Wealth, LLC | 0 | -100,00 | 0 | |||||
| 2026-02-17 | 13F | Citadel Advisors Llc | Put | 249.500 | -14,35 | 9.621 | -6,73 | |||
| 2026-01-28 | 13F | Salomon & Ludwin, LLC | 704 | -10,32 | 28 | 0,00 | ||||
| 2026-04-28 | 13F | Kathmere Capital Management, LLC | 21.129 | -9,86 | 629 | -30,34 | ||||
| 2026-05-01 | 13F | CenterStar Asset Management, LLC | Put | 0 | -100,00 | 0 | ||||
| 2026-01-28 | 13F | Legacy Capital Group California, Inc. | 10.278 | -16,90 | 396 | -9,38 | ||||
| 2026-02-12 | 13F | Campbell & CO Investment Adviser LLC | 44.005 | 1.702 | ||||||
| 2026-02-13 | 13F | Strategic Global Advisors, LLC | 12.312 | 12,56 | 475 | 22,48 | ||||
| 2026-02-17 | 13F | Bank Of America Corp /de/ | Call | 0 | -100,00 | 0 | ||||
| 2026-04-27 | 13F | Greenleaf Trust | 9.412 | 21,60 | 280 | -6,04 | ||||
| 2026-04-28 | 13F | Kingswood Wealth Advisors, Llc | 0 | -100,00 | 0 | |||||
| 2026-02-12 | 13F | Intesa Sanpaolo S.p.a. | 498.995 | 19.413 | ||||||
| 2026-05-01 | 13F | Hantz Financial Services, Inc. | 100 | 104,08 | 0 | |||||
| 2026-02-12 | 13F | BlackRock, Inc. | 1.988.144 | -0,94 | 76.663 | 7,88 | ||||
| 2026-02-17 | 13F | Utah Retirement Systems | 198.922 | 0,00 | 7.735 | 10,50 | ||||
| 2026-02-06 | 13F | EverSource Wealth Advisors, LLC | 8.336 | 14,44 | 321 | 24,90 | ||||
| 2026-02-17 | 13F | Two Sigma Advisers, Lp | 92.124 | 544,58 | 3.552 | 601,98 | ||||
| 2026-04-24 | 13F | Key FInancial Inc | 483 | 36,44 | 14 | 7,69 | ||||
| 2026-02-09 | 13F | Themes Management Co LLC | 24.306 | 937 | ||||||
| 2026-05-01 | 13F | Arlington Capital Management, Inc. | 86.685 | 0,12 | 2.581 | -22,68 | ||||
| 2026-02-17 | 13F | Blair William & Co/il | 47.796 | 105,43 | 1.843 | 123,94 | ||||
| 2026-04-30 | 13F | Manning & Napier Advisors Llc | 201 | -41,91 | 6 | -61,54 | ||||
| 2026-01-29 | 13F | Vanguard Group Inc | 80.119.806 | 1,33 | 3.087.737 | 10,26 | ||||
| 2026-02-17 | 13F | Laird Norton Trust Company, Llc | 59.326 | 2.288 | ||||||
| 2025-11-12 | 13F | NewSquare Capital LLC | 0 | -100,00 | 0 | |||||
| 2026-04-24 | 13F | Raiffeisen Bank International AG | Call | 0 | -100,00 | 0 | ||||
| 2026-02-12 | 13F | Quadrant Capital Group Llc | 65.671 | 0,20 | 2.532 | 9,14 | ||||
| 2026-04-17 | 13F | AdvisorNet Financial, Inc | 0 | -100,00 | 0 | |||||
| 2025-11-14 | 13F | AXA Investment Managers S.A. | 1.061.891 | 31.804 | ||||||
| 2026-02-17 | 13F | SIH Partners, LLLP | Put | 9.286.200 | 13,98 | 358.076 | 24,12 | |||
| 2025-11-10 | 13F | Raiffeisen Bank International AG | 0 | -100,00 | 0 | -100,00 | ||||
| 2026-02-17 | 13F | SIH Partners, LLLP | Call | 2.690.800 | -24,57 | 103.757 | -17,86 | |||
| 2026-02-17 | 13F | D. E. Shaw & Co., Inc. | Call | 73.500 | 2.834 | |||||
| 2026-02-06 | 13F | Entrust Financial Llc | 95 | 4 | ||||||
| 2026-02-13 | 13F | Neuberger Berman Group LLC | 65.470 | 28,57 | 2.537 | 40,94 | ||||
| 2026-04-27 | 13F | FSM Wealth Advisors, LLC | 9.564 | -6,61 | 285 | -27,92 | ||||
| 2026-02-19 | 13F | Atomi Financial Group, Inc. | 51.974 | 6,26 | 2.004 | 15,77 | ||||
| 2026-04-28 | 13F | LGT Fund Management Co Ltd. | 206.146 | -1,44 | 6.135 | -24,50 | ||||
| 2026-05-01 | 13F | Royal London Asset Management Ltd | 362.053 | -2,79 | 10.782 | -24,93 | ||||
| 2026-02-18 | 13F | Achmea Investment Management B.V. | 127.530 | 0,00 | 5 | 0,00 | ||||
| 2026-02-05 | 13F | Leuthold Group, Llc | 261.209 | 0,34 | 10.072 | 9,26 | ||||
| 2026-02-11 | 13F | Capital International Sarl | 1.559.237 | -0,32 | 60.635 | 10,17 | ||||
| 2026-02-02 | 13F | Varma Mutual Pension Insurance Co | 256.900 | -4,82 | 9.990 | 5,17 | ||||
| 2026-04-30 | 13F | Groupe des Assurances du Credit Mutuel | 254.000 | 7.564 | ||||||
| 2026-04-30 | 13F | Sequoia Financial Advisors, LLC | 43.863 | 86,91 | 1.306 | 44,47 | ||||
| 2026-02-06 | 13F | GPS Wealth Strategies Group, LLC | 0 | -100,00 | 0 | |||||
| 2026-02-09 | 13F | Powell Investment Advisors, LLC | 0 | -100,00 | 0 | |||||
| 2026-04-14 | 13F | Nippon Life Insurance Co | 2.898.520 | 84 | ||||||
| 2026-01-07 | 13F | Innova Wealth Partners | Call | 0 | -100,00 | 0 | -100,00 | |||
| 2026-04-13 | 13F | Creative Financial Designs Inc /adv | 419 | 110,55 | 12 | 71,43 | ||||
| 2026-02-17 | 13F | SIH Partners, LLLP | 295.267 | 41,18 | 11.385 | 53,75 | ||||
| 2026-04-07 | 13F | Five Oceans Advisors | 8.029 | 0,00 | 239 | -22,65 | ||||
| 2026-02-17 | 13F | Schonfeld Strategic Advisors LLC | 235.946 | 9.098 | ||||||
| 2026-02-17 | 13F | FIL Ltd | 134.895 | 17,89 | 5.249 | 30,45 | ||||
| 2026-02-17 | 13F | Janus Henderson Group Plc | 6.938.180 | -20,04 | 271.002 | -11,27 | ||||
| 2026-02-13 | 13F | Macquarie Group Ltd | 0 | -100,00 | 0 | -100,00 | ||||
| 2026-02-13 | 13F | Pathstone Holdings, LLC | 162.749 | 8,38 | 6.276 | 18,02 | ||||
| 2026-02-17 | 13F | Creative Planning | 273.809 | 8,07 | 10.558 | 17,69 | ||||
| 2026-02-13 | 13F | Korea Investment CORP | 1.816.547 | -27,77 | 70.638 | -20,18 | ||||
| 2025-11-14 | 13F | Axa S.a. | 0 | -100,00 | 0 | -100,00 | ||||
| 2026-04-10 | 13F | Quaker Wealth Management, LLC | 0 | -100,00 | 0 | |||||
| 2025-11-12 | 13F | HAP Trading, LLC | Call | 13.600 | 90 | |||||
| 2026-02-17 | 13F | Jain Global LLC | 39.280 | 19,10 | 1.515 | 29,73 | ||||
| 2026-02-17 | 13F | Qube Research & Technologies Ltd | Put | 915.500 | -18,59 | 35.564 | -10,03 | |||
| 2026-02-13 | 13F | Public Sector Pension Investment Board | 1.432.217 | -10,42 | 55.636 | -1,12 | ||||
| 2026-02-17 | 13F | Qube Research & Technologies Ltd | 207.969 | -11,04 | 8.027 | -3,02 | ||||
| 2026-04-30 | 13F | Nuveen, LLC | 3.353.312 | -4,28 | 97.037 | -28,77 | ||||
| 2026-01-29 | 13F | UBS Group AG | Put | 2.524.000 | -44,07 | 97.325 | -39,09 | |||
| 2026-02-13 | 13F | Ossiam | 250.871 | 1,38 | 9.755 | 12,02 | ||||
| 2026-02-13 | 13F | Walleye Trading LLC | Put | 85.200 | -44,35 | 3.285 | -39,40 | |||
| 2026-04-15 | 13F | Compagnie Lombard Odier SCmA | 585.277 | -7,00 | 16.936 | -30,80 | ||||
| 2026-01-29 | 13F | UBS Group AG | Call | 2.826.199 | -48,00 | 108.978 | -43,38 | |||
| 2026-02-13 | 13F | Walleye Trading LLC | Call | 16.800 | -76,99 | 648 | -74,96 | |||
| 2026-01-29 | 13F | UBS Group AG | 31.268.175 | 4,38 | 1.205.701 | 13,67 | ||||
| 2026-04-14 | 13F | Thurston, Springer, Miller, Herd & Titak, Inc. | 3.069 | -16,87 | 91 | -35,92 | ||||
| 2026-02-06 | 13F | Larson Financial Group LLC | 514 | 73,06 | 20 | 90,00 | ||||
| 2026-02-13 | 13F | Walleye Trading LLC | 11.677 | 450 | ||||||
| 2026-02-13 | 13F | First Trust Advisors Lp | 342.598 | -33,15 | 13.284 | -26,40 | ||||
| 2026-04-02 | 13F | Ares Financial Consulting, LLC | 1.600 | 49 | ||||||
| 2026-04-01 | 13F | Bangor Savings Bank | 0 | -100,00 | 0 | |||||
| 2026-02-17 | 13F | Capital Fund Management S.a. | 65.436 | 9,57 | 2.523 | 19,35 | ||||
| 2026-02-11 | 13F | Capital International Ltd /ca/ | 791.389 | -6,25 | 30.791 | 3,72 | ||||
| 2026-04-14 | 13F | Prospera Financial Services Inc | 41.333 | -0,46 | 1.231 | -23,17 | ||||
| 2026-02-11 | 13F | Group One Trading, L.p. | Call | 129.900 | 13,65 | 5.009 | 23,75 | |||
| 2026-02-11 | 13F | Group One Trading, L.p. | Put | 184.800 | -8,38 | 7.126 | -0,24 | |||
| 2026-02-05 | 13F | Commerzbank Aktiengesellschaft /fi | 3.258.795 | 4,26 | 126 | 13,64 | ||||
| 2026-02-12 | 13F | Groupe la Francaise | Put | 375.000 | 0,00 | 12.416 | -5,84 | |||
| 2026-01-27 | 13F | Bayforest Capital Ltd | 0 | -100,00 | 0 | |||||
| 2026-02-17 | 13F | TCG Advisory Services, LLC | 13.700 | 3,44 | 528 | 12,82 | ||||
| 2026-02-20 | 13F/A | Prestige Wealth Management Group LLC | 0 | -100,00 | 0 | |||||
| 2026-02-10 | 13F | CIBC World Markets Inc. | 188.954 | 4,05 | 7.348 | 15,15 | ||||
| 2026-02-13 | 13F | State Street Corp | 8.440 | 0,00 | 325 | 9,06 | ||||
| 2026-01-23 | 13F | Assetmark, Inc | 323.424 | 9,33 | 12.471 | 19,05 | ||||
| 2026-01-26 | 13F | Reyes Financial Architecture, Inc. | 115 | 4 | ||||||
| 2026-02-13 | 13F | Stifel Financial Corp | 159.047 | 5,83 | 6.133 | 15,24 | ||||
| 2026-02-17 | 13F | Tudor Investment Corp Et Al | 313.973 | -9,14 | 12.107 | -1,06 | ||||
| 2026-02-12 | 13F | New York State Common Retirement Fund | 136.130 | 5.249 | ||||||
| 2026-02-17 | 13F | Tudor Investment Corp Et Al | Put | 91.100 | -22,14 | 3.513 | -15,21 | |||
| 2026-02-17 | 13F | Amundi | 53.920.096 | 8,72 | 2.079.159 | 19,98 | ||||
| 2026-02-12 | 13F | Callan Family Office, LLC | 163.688 | 64,43 | 6.312 | 79,04 | ||||
| 2026-02-17 | 13F | Tudor Investment Corp Et Al | Call | 79.000 | 7,34 | 3.046 | 16,88 | |||
| 2025-11-14 | 13F | Two Sigma Securities, Llc | 0 | -100,00 | 0 | -100,00 | ||||
| 2026-04-13 | 13F | Gradient Investments LLC | 149.459 | 373.547,50 | 4.451 | 222.400,00 | ||||
| 2026-04-30 | 13F | Independence Bank of Kentucky | 0 | -100,00 | 0 | |||||
| 2026-02-18 | 13F | State of Tennessee, Treasury Department | 137.257 | -55,38 | 5.437 | -49,77 | ||||
| 2026-04-20 | 13F | Assenagon Asset Management S.A. | 336.512 | 52,32 | 9.738 | 13,35 | ||||
| 2026-05-01 | 13F | Anchor Investment Management, LLC | 3.000 | 0,00 | 89 | -22,61 | ||||
| 2025-11-14 | 13F | Wetherby Asset Management Inc | 42.728 | 0,39 | 1.513 | 21,35 | ||||
| 2025-11-06 | 13F | Ground Swell Capital, LLC | 0 | -100,00 | 0 | -100,00 | ||||
| 2026-02-13 | 13F | Towarzystwo Funduszy Inwestycyjnych Pzu Sa | 3.000 | 0,00 | 117 | 10,48 | ||||
| 2026-02-11 | 13F | First Command Advisory Services, Inc. | 28 | 0,00 | 1 | |||||
| 2026-02-13 | 13F | Squarepoint Ops LLC | Call | 23.900 | 922 | |||||
| 2026-02-13 | 13F | Sei Investments Co | 139.690 | 7,45 | 5.387 | 17,01 | ||||
| 2026-02-13 | 13F | GQG Partners LLC | 0 | -100,00 | 0 | -100,00 | ||||
| 2026-01-21 | 13F | Newbridge Financial Services Group, Inc. | 0 | -100,00 | 0 | |||||
| 2026-02-13 | 13F | Pacific Center for Financial Services | 25 | 0,00 | 1 | |||||
| 2026-01-30 | 13F | Camden Capital, LLC | 6.082 | 1,74 | 235 | 10,90 | ||||
| 2026-04-30 | 13F | Legacy Financial Advisors, Inc. | 6.898 | -15,13 | 205 | -34,50 | ||||
| 2026-02-04 | 13F | Plato Investment Management Ltd | 67.397 | 19,40 | 2.633 | 46,36 | ||||
| 2026-04-22 | 13F | JNBA Financial Advisors | 66 | 0,00 | 2 | -50,00 | ||||
| 2026-02-17 | 13F | Jones Financial Companies Lllp | 20.218 | 3,95 | 780 | 12,41 | ||||
| 2026-02-12 | 13F | Johnson Financial Group, Inc. | 0 | -100,00 | 0 | |||||
| 2026-02-10 | 13F | Mutual Of America Capital Management Llc | 715.593 | 0,00 | 27.828 | 10,66 | ||||
| 2026-02-17 | 13F | EFG International AG | 13.862 | 535 | ||||||
| 2026-01-30 | 13F | Us Bancorp \de\ | 56.290 | 1,50 | 2.171 | 10,55 | ||||
| 2026-02-06 | 13F | Pnc Financial Services Group, Inc. | 47.674 | -0,82 | 1.838 | 7,99 | ||||
| 2026-02-17 | 13F | Lazard Asset Management Llc | 1.737.872 | 26,85 | 67.510 | 40,18 | ||||
| 2026-02-17 | 13F | Northern Trust Corp | 2.083.155 | 0,27 | 80.326 | 9,19 | ||||
| 2026-02-09 | 13F | Fisher Asset Management, LLC | 27.398.661 | 3,66 | 1.056.492 | 12,88 | ||||
| 2026-02-13 | 13F | Kilter Group LLC | 9 | 0,00 | 0 | |||||
| 2026-04-24 | 13F | Private Advisor Group, LLC | 10.332 | 16,84 | 308 | -9,71 | ||||
| 2026-02-10 | 13F | Rothschild Investment Llc | 1.641 | 1,05 | 63 | 10,53 | ||||
| 2026-02-12 | 13F | Jane Street Group, Llc | Call | 127.600 | -42,55 | 4.920 | -37,44 | |||
| 2026-02-17 | 13F | Entrust Global Partners L L C | 0 | -100,00 | 0 | |||||
| 2026-02-12 | 13F | Jane Street Group, Llc | 1.817.598 | -19,33 | 70.087 | -12,15 | ||||
| 2025-11-14 | 13F | Binnacle Investments Inc | 76 | -2,56 | 3 | 0,00 | ||||
| 2026-02-12 | 13F | Jane Street Group, Llc | Put | 49.600 | -68,08 | 1.913 | -65,25 | |||
| 2026-02-11 | 13F | IMA Wealth, Inc. | 145 | 6 | ||||||
| 2025-11-13 | 13F | Farringdon Capital, Ltd. | 0 | -100,00 | 0 | |||||
| 2026-04-30 | 13F | Kestra Advisory Services, LLC | 0 | -100,00 | 0 | |||||
| 2026-02-17 | 13F | Engineers Gate Manager LP | 49.674 | -42,81 | 1.915 | -37,72 | ||||
| 2026-02-13 | 13F | Verition Fund Management LLC | 0 | -100,00 | 0 | |||||
| 2026-04-22 | 13F | Janney Montgomery Scott LLC | 55.195 | -1,27 | 2 | -50,00 | ||||
| 2026-02-17 | 13F | Graham Capital Management, L.P. | 37.930 | 1.463 | ||||||
| 2025-11-03 | 13F | Annis Gardner Whiting Capital Advisors, LLC | 0 | -100,00 | 0 | |||||
| 2026-02-13 | 13F | Smartleaf Asset Management LLC | 14.636 | 2,26 | 568 | 12,48 | ||||
| 2026-02-17 | 13F | Wellington Management Group Llp | 364.750 | -84,80 | 14.184 | -83,21 | ||||
| 2026-04-21 | 13F | Financial Consulate, Inc | 349 | 52,40 | 10 | 25,00 | ||||
| 2026-02-11 | 13F | Group One Trading, L.p. | 0 | -100,00 | 0 | -100,00 | ||||
| 2026-02-09 | 13F | Putnam Fl Investment Management Co | 7.008 | 10,94 | 270 | 21,08 | ||||
| 2026-01-27 | 13F | Exane Asset Management | 0 | -100,00 | 0 | |||||
| 2026-02-13 | 13F | Evelyn Partners Investment Management LLP | 4.250 | 0,00 | 165 | 10,74 | ||||
| 2026-05-01 | 13F | Rakuten Securities, Inc. | 8.981 | 100,87 | 267 | 55,23 | ||||
| 2026-02-05 | 13F | Tucker Asset Management Llc | 104 | 4 | ||||||
| 2026-02-05 | 13F | Atria Investments Llc | 30.961 | -13,18 | 1.194 | -5,47 | ||||
| 2026-04-16 | 13F | Evolve Private Wealth, Llc | 7.721 | 30,29 | 230 | 0,44 | ||||
| 2026-02-17 | 13F | Point72 Asset Management, L.P. | Put | 134.600 | 9,16 | 5.190 | 18,87 | |||
| 2026-02-17 | 13F | Point72 Asset Management, L.P. | Call | 81.100 | 6,29 | 3.127 | 15,77 | |||
| 2026-02-12 | 13F | Brinker Capital Investments, LLC | 34.036 | 28,16 | 1.312 | 39,57 | ||||
| 2026-02-03 | 13F | Ballentine Partners, LLC | 19.268 | 8,62 | 743 | 18,15 | ||||
| 2025-11-06 | 13F | Wealthstream Advisors, Inc. | 6.628 | 235 | ||||||
| 2026-04-24 | 13F | Keybank National Association/oh | 13.377 | 47,16 | 398 | 13,71 | ||||
| 2026-02-17 | 13F | Point72 Asset Management, L.P. | 800.643 | 30.873 | ||||||
| 2026-04-10 | 13F | Magnus Financial Group LLC | 8.028 | -11,33 | 239 | -31,52 | ||||
| 2026-02-17 | 13F | Aqr Capital Management Llc | 7.969.257 | 2.731,84 | 309.477 | 3.005,95 | ||||
| 2026-03-12 | 13F/A | Peak6 Llc | Put | 52.200 | 16,00 | 2.013 | 26,30 | |||
| 2026-03-12 | 13F/A | Peak6 Llc | Call | 85.700 | 2,51 | 3.305 | 11,62 | |||
| 2026-04-30 | 13F | Hsbc Holdings Plc | 55.846 | -92,44 | 1.618 | -94,37 | ||||
| 2026-01-27 | 13F | Evergreen Capital Management Llc | 24.744 | 3,84 | 954 | 13,17 | ||||
| 2026-03-12 | 13F/A | Peak6 Llc | 26.530 | 869,31 | 1.023 | 964,58 | ||||
| 2026-04-30 | 13F | Hsbc Holdings Plc | Call | 2.520.800 | 73.024 | |||||
| 2026-02-12 | 13F | Voya Investment Management Llc | 244.098 | 8,42 | 9.492 | 19,82 | ||||
| 2026-02-17 | 13F | Advisor Group Holdings, Inc. | 34.730 | -43,90 | 1.339 | -38,69 | ||||
| 2026-04-30 | 13F | Hsbc Holdings Plc | Put | 2.175.800 | 63.029 | |||||
| 2026-04-27 | 13F | Qrg Capital Management, Inc. | 162.220 | -22,59 | 4.831 | -40,22 | ||||
| 2026-02-17 | 13F | Viking Global Investors Lp | 0 | -100,00 | 0 | |||||
| 2026-01-29 | 13F | IMC-Chicago, LLC | Put | 45.800 | -53,50 | 1.766 | -49,35 | |||
| 2026-01-29 | 13F | IMC-Chicago, LLC | Call | 175.800 | -8,05 | 6.779 | 0,12 | |||
| 2026-02-12 | 13F | Federation des caisses Desjardins du Quebec | 28.532 | -0,17 | 1.107 | 9,61 | ||||
| 2026-02-13 | 13F | JustInvest LLC | 160.448 | -8,83 | 6.187 | -0,72 | ||||
| 2025-11-07 | 13F | Credit Industriel Et Commercial | Put | 0 | -100,00 | 0 | -100,00 | |||
| 2026-04-29 | 13F | Cary Street Partners Financial Llc | 55.400 | 0,09 | 1.650 | -22,73 | ||||
| 2025-11-14 | 13F | Mount Yale Investment Advisors, LLC | 0 | -100,00 | 0 | -100,00 | ||||
| 2025-11-14 | 13F | Squarepoint Ops LLC | 0 | -100,00 | 0 | -100,00 | ||||
| 2026-01-27 | 13F | WealthCollab, LLC | 568 | 0,00 | 22 | 5,00 | ||||
| 2026-04-24 | 13F | Abacus Wealth Partners, LLC | 11.840 | -4,46 | 353 | -26,21 | ||||
| 2026-02-10 | 13F | Verus Capital Partners, Llc | 5.562 | 214 | ||||||
| 2025-12-15 | 13F | CTC Alternative Strategies, Ltd. | 0 | -100,00 | 0 | |||||
| 2026-02-05 | 13F | Elyxium Wealth, LLC | 48 | 2 | ||||||
| 2026-04-21 | 13F | Vise Technologies, Inc. | 17.788 | 0,00 | 686 | 0,00 | ||||
| 2026-02-11 | 13F | Empowered Funds, LLC | 250 | 10 | ||||||
| 2026-02-10 | 13F | Sivia Capital Partners, LLC | 18.313 | 29,78 | 706 | 41,48 | ||||
| 2026-02-06 | 13F | Pinnbrook Capital Management Lp | 0 | -100,00 | 0 | -100,00 | ||||
| 2026-02-05 | 13F | Bank Julius Baer & Co. Ltd, Zurich | 216.553 | 47,36 | 8.350 | 60,48 | ||||
| 2026-02-17 | 13F | Parallax Volatility Advisers, L.P. | 20.500 | -25,28 | 790 | -18,64 | ||||
| 2026-02-09 | 13F | Mediolanum International Funds Ltd | 350.432 | 28,16 | 13.643 | 41,66 | ||||
| 2026-02-17 | 13F | SageView Advisory Group, LLC | 216 | 8 | ||||||
| 2026-02-12 | 13F | Hm Payson & Co | 0 | -100,00 | 0 | |||||
| 2026-04-14 | 13F | Drive Wealth Management, Llc | 12.319 | -22,69 | 367 | -40,39 | ||||
| 2026-02-12 | 13F | Groupe la Francaise | 1.291.643 | 64,88 | 50.227 | 82,14 | ||||
| 2026-04-20 | 13F | Jfs Wealth Advisors, Llc | 930 | 0,00 | 28 | -22,86 | ||||
| 2026-04-23 | 13F | Forum Financial Management, LP | 0 | -100,00 | 0 | |||||
| 2026-02-13 | 13F | 1832 Asset Management L.P. | 138.842 | 5.354 | ||||||
| 2026-02-13 | 13F | Mariner, LLC | 220.200 | 26,42 | 8.493 | 37,70 | ||||
| 2026-04-21 | 13F | PDS Planning, Inc | 7.564 | 0,38 | 225 | -22,41 | ||||
| 2026-02-11 | 13F | 111 Capital | 104.030 | 4.046 | ||||||
| 2026-01-20 | 13F | Ascent Group, LLC | 8.239 | 17,18 | 318 | 27,82 | ||||
| 2026-02-13 | 13F | Kayne Anderson Rudnick Investment Management Llc | 44.131 | 5,46 | 1.702 | 14,85 | ||||
| 2026-01-26 | 13F | Cwm, Llc | 4.504 | 2,60 | 0 | |||||
| 2026-02-12 | 13F | Pitcairn Co | 0 | -100,00 | 0 | |||||
| 2026-02-09 | 13F | Bleakley Financial Group, LLC | 83.959 | 8,85 | 3.237 | 18,53 | ||||
| 2026-01-14 | 13F | ORG Partners LLC | 100 | 0,00 | 4 | 0,00 | ||||
| 2026-02-11 | 13F | Westerkirk Capital Inc. | 39.890 | 0,00 | 1.538 | 8,92 | ||||
| 2026-04-20 | 13F | LVW Advisors, LLC | 13.063 | -20,72 | 389 | -38,74 | ||||
| 2026-02-11 | 13F | Parallel Advisors, LLC | 11.338 | -2,64 | 437 | 6,07 | ||||
| 2025-11-14 | 13F | Wolverine Trading, Llc | Call | 0 | -100,00 | 0 | -100,00 | |||
| 2026-04-13 | 13F | Trust Co | 18 | 0,00 | 1 | |||||
| 2026-02-17 | 13F | Two Sigma Investments, Lp | 65.357 | 2.520 | ||||||
| 2025-11-14 | 13F | Wolverine Trading, Llc | Put | 0 | -100,00 | 0 | -100,00 | |||
| 2026-05-01 | 13F | New Republic Capital, LLC | 0 | -100,00 | 0 | |||||
| 2026-02-20 | 13F | Kovitz Investment Group Partners, LLC | 0 | -100,00 | 0 | |||||
| 2025-11-14 | 13F | Wolverine Trading, Llc | 0 | -100,00 | 0 | -100,00 | ||||
| 2026-01-23 | 13F | Bridgewater Advisors Inc. | 5.666 | 215 | ||||||
| 2026-02-17 | 13F | Bamco Inc /ny/ | 202.402 | -6,39 | 7.805 | 1,93 | ||||
| 2026-02-03 | 13F | NewEdge Wealth, LLC | 55.401 | 8,51 | 2.136 | 14,90 | ||||
| 2026-02-04 | 13F | D'Orazio & Associates, Inc. | 15.477 | -0,38 | 597 | 8,36 | ||||
| 2026-02-10 | 13F | Bruce G. Allen Investments, LLC | 339 | 0,00 | 13 | 8,33 | ||||
| 2025-11-14 | 13F | Centiva Capital, LP | 0 | -100,00 | 0 | |||||
| 2026-04-13 | 13F | St Germain D J Co Inc | 34 | 0,00 | 1 | 0,00 | ||||
| 2026-04-15 | 13F | Diligent Investors, LLC | 20.000 | 0,00 | 596 | -22,83 | ||||
| 2026-02-05 | 13F | Center for Financial Planning, Inc. | 0 | -100,00 | 0 | |||||
| 2026-02-17 | 13F | Signature Equity Partners, LLC | 281 | 11 | ||||||
| 2026-02-11 | 13F | Capital International Inc /ca/ | 3.091.176 | -38,99 | 120.265 | -32,49 | ||||
| 2026-02-06 | 13F | Addison Advisors LLC | 15 | 1 | ||||||
| 2026-04-17 | 13F | Brown, Lisle/cummings, Inc. | 20 | 0,00 | 1 | |||||
| 2026-04-15 | 13F | Merit Financial Group, LLC | 12.877 | -1,40 | 383 | -23,86 | ||||
| 2026-04-28 | 13F | DGS Capital Management, LLC | 10.234 | -34,54 | 305 | -49,50 | ||||
| 2026-02-11 | 13F | Prudential Plc | 326.336 | 1,67 | 12.677 | 12,36 | ||||
| 2026-02-23 | 13F | Beaird Harris Wealth Management, LLC | 0 | 0 | ||||||
| 2026-02-13 | 13F | Colony Group, LLC | 97.486 | 17,60 | 3.697 | 25,93 | ||||
| 2026-04-28 | 13F | Southern Michigan Bank & Trust | 30 | 1 | ||||||
| 2026-02-13 | 13F | Gemsstock Ltd. | 0 | -100,00 | 0 | |||||
| 2026-02-02 | 13F | Benjamin Edwards Inc | 15.307 | 4,29 | 590 | 13,68 |