Grundlæggende statistik
| Institutionelle aktier (lange) | 353.273.998 - 84,83% (ex 13D/G) - change of -86,66MM shares -19,81% MRQ |
| Institutionel værdi (lang) | $ 5.768.782 USD ($1000) |
Institutionelt ejerskab og aktionærer
XP Inc. (US:XP) har 345 institutionelle ejere og aktionærer, der har indsendt 13D/G- eller 13F-formularer til Securities Exchange Commission (SEC). Disse institutioner har i alt 353,273,998 aktier. Største aktionærer omfatter BlackRock, Inc., Capital World Investors, Dodge & Cox, General Atlantic Llc, ARGA Investment Management, LP, Massachusetts Financial Services Co /ma/, Arrowstreet Capital, Limited Partnership, Morgan Stanley, State Street Corp, and Ninety One UK Ltd .
XP Inc. (NasdaqGS:XP) institutionel ejerskabsstruktur viser aktuelle positioner i virksomheden efter institutioner og fonde, samt seneste ændringer i positionsstørrelse. Større aktionærer kan omfatte individuelle investorer, investeringsforeninger, hedgefonde eller institutioner. Skema 13D angiver, at investoren besidder (eller besidder) mere end 5 % af virksomheden og har til hensigt (eller har til hensigt at) aktivt at forfølge en ændring i forretningsstrategi. Skema 13G indikerer en passiv investering på over 5%.
The share price as of April 23, 2026 is 19,63 / share. Previously, on April 24, 2025, the share price was 15,56 / share. This represents an increase of 26,16% over that period.

Fondens stemningsscore
Fund Sentiment Score (fka Ownership Accumulation Score) finder de aktier, der bliver mest købt af fonde. Det er resultatet af en sofistikeret, multi-faktor kvantitativ model, der identificerer virksomheder med de højeste niveauer af institutionel akkumulering. Scoringsmodellen bruger en kombination af den samlede stigning i oplyste ejere, ændringerne i porteføljeallokeringer i disse ejere og andre målinger. Tallet går fra 0 til 100, hvor højere tal indikerer et højere niveau af akkumulering for sine jævnaldrende, og 50 er gennemsnittet.
Opdateringsfrekvens: Dagligt
Se Ownership Explorer, som giver en liste over højest rangerende virksomheder.
AI+ Ask Fintel’s AI assistant about XP Inc..
Select a question to share a public post with an AI-crafted answer.
Thinking of good questions…
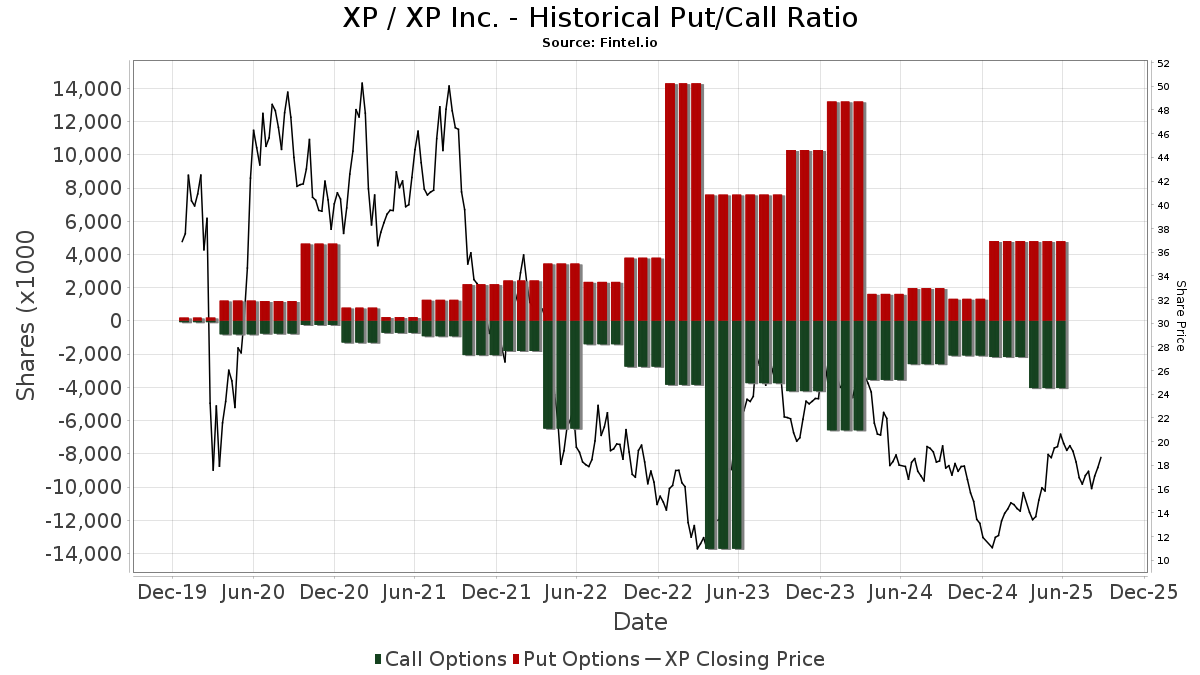
Institutionel Put/Call-forhold
Ud over at indberette standardaktie- og gældsudstedelser skal institutter med mere end 100 mill. aktiver under forvaltning også oplyse deres put- og call-optionsbeholdninger. Da salgsoptioner generelt indikerer negativ stemning, og købsoptioner indikerer positiv stemning, kan vi få en fornemmelse af den overordnede institutionelle stemning ved at plotte forholdet mellem put og kald. Diagrammet til højre viser det historiske put/call-forhold for dette instrument.
Brug af Put/Call Ratio som en indikator for investorernes stemning overvinder en af de vigtigste mangler ved at bruge totalt institutionelt ejerskab, som er, at en betydelig mængde af aktiver under forvaltning investeres passivt for at spore indekser. Passivt forvaltede fonde køber typisk ikke optioner, så indikatoren for put/call-forholdet følger mere nøje følelsen af aktivt forvaltede fonde.
13D/G-arkivering
Vi præsenterer 13D/G ansøgninger separat fra 13F ansøgninger på grund af den forskellige behandling af SEC. 13D/G-ansøgninger kan indgives af grupper af investorer (med én ledende), hvorimod 13F-ansøgninger ikke kan. Dette resulterer i situationer, hvor en investor kan indsende en 13D/G, der rapporterer én værdi for de samlede aktier (der repræsenterer alle de aktier, der ejes af investorgruppen), men derefter indsender en 13F, der rapporterer en anden værdi for de samlede aktier (der udelukkende repræsenterer deres egne) ejendomsret). Det betyder, at aktieejerskab af 13D/G-arkiver og 13F-arkiveringer ofte ikke er direkte sammenlignelige, så vi præsenterer dem separat.
Bemærk: Fra den 16. maj 2021 viser vi ikke længere ejere, der ikke har indsendt en 13D/G inden for det seneste år. Tidligere viste vi den fulde historie af 13D/G-arkiver. Generelt skal enheder, der er forpligtet til at indgive 13D/G-ansøgninger, indgive mindst årligt, før de indsender en afsluttende ansøgning. Dog forlader fonde nogle gange positioner uden at indsende en afsluttende ansøgning (dvs. de afvikler), så visning af den fulde historie resulterede nogle gange i forvirring om det nuværende ejerskab. For at undgå forvirring viser vi nu kun 'aktuelle' ejere - det vil sige - ejere, der har anmeldt inden for det seneste år.
Upgrade to unlock premium data.
| Fil dato | Form | Investor | Forrige Aktier |
Seneste Aktier |
Δ Aktier (Procent) |
Ejendomsret (Procent) |
Δ Ejerskab (Procent) |
|
|---|---|---|---|---|---|---|---|---|
| 2026-02-13 | XP Control LLC | 101,752,469 | 19.60 | 3.70 | ||||
| 2026-01-21 | BlackRock, Inc. | 28,858,937 | 34,482,479 | 19.49 | 8.30 | 25.76 | ||
| 2025-12-04 | GENERAL ATLANTIC LLC | 29,617,733 | 22,758,833 | -23.16 | 5.40 | -23.94 | ||
| 2025-08-13 | DODGE & COX | 43,153,245 | 34,308,445 | -20.50 | 7.90 | -20.20 | ||
| 2025-08-07 | Mawer Investment Management Ltd. | 24,589,426 | 0 | -100.00 | 0.00 | -100.00 | ||
| 2025-05-13 | Capital World Investors | 30,606,282 | 39,691,272 | 29.68 | 9.10 | 28.17 |
13F og NPORT arkivering
Detaljer om 13F-arkivering er gratis. Detaljer om NP-ansøgninger kræver et premium-medlemskab. Grønne rækker angiver nye positioner. Røde rækker angiver lukkede positioner. Klik på linket ikon for at se den fulde transaktionshistorik.
Opgrader
for at låse premium-data op og eksportere til Excel ![]() .
.
| Fil dato | Kilde | Investor | Type | Gennemsnitlig pris (Øst) |
Aktier | Δ Aktier (%) |
Rapporteret Værdi ($1000) |
Δ Værdi (%) |
Port Alloc (%) |
|
|---|---|---|---|---|---|---|---|---|---|---|
| 2026-02-02 | 13F | Danske Bank A/s | 94.900 | -7,95 | 1.554 | -19,82 | ||||
| 2026-02-12 | 13F | Ensign Peak Advisors, Inc | 19.750 | 0,00 | 323 | -12,94 | ||||
| 2025-11-13 | 13F | Capital Fund Management S.a. | 0 | -100,00 | 0 | -100,00 | ||||
| 2026-02-12 | 13F | Principal Securities, Inc. | 0 | -100,00 | 0 | |||||
| 2026-02-13 | 13F | Dynamic Technology Lab Private Ltd | 0 | -100,00 | 0 | |||||
| 2026-02-03 | 13F | Ethic Inc. | 44.060 | 31,98 | 721 | 14,99 | ||||
| 2026-02-17 | 13F | Raymond James Financial Inc | 11.727 | -68,82 | 192 | -72,95 | ||||
| 2026-04-24 | 13F | Yousif Capital Management, Llc | 11.498 | 0,00 | 219 | 3,81 | ||||
| 2026-02-06 | 13F | Covestor Ltd | 8.382 | -0,93 | 0 | |||||
| 2026-02-11 | 13F | Inceptionr Llc | 0 | -100,00 | 0 | |||||
| 2026-02-13 | 13F | BNP Paribas Asset Management Holding S.A. | 264.766 | 4 | ||||||
| 2026-04-10 | 13F | Marshall Financial Group LLC | 10.351 | -11,78 | 197 | 2,60 | ||||
| 2026-02-10 | 13F | Triglav Skladi, D.o.o. | 46.033 | 31,52 | 754 | 14,61 | ||||
| 2026-01-08 | 13F | Nordea Investment Management Ab | 522.514 | 8.572 | ||||||
| 2026-02-23 | 13F | Virtu Financial LLC | 13.746 | 0 | ||||||
| 2026-02-13 | 13F | Royal London Asset Management Ltd | 333.300 | 0,48 | 5.456 | -12,45 | ||||
| 2026-02-17 | 13F | Lazard Asset Management Llc | 59.926 | -75,23 | 981 | -78,44 | ||||
| 2025-11-14 | 13F | L2 Asset Management, LLC | 0 | -100,00 | 0 | -100,00 | ||||
| 2026-02-13 | 13F | Inspire Advisors, LLC | 13.486 | 221 | ||||||
| 2026-04-06 | 13F | GAMMA Investing LLC | 13.024 | 21,15 | 248 | 41,14 | ||||
| 2026-04-20 | 13F | Jfs Wealth Advisors, Llc | 3 | 0,00 | 0 | |||||
| 2026-02-09 | 13F | Atlantic Trust, LLC | 429 | -6,74 | 7 | -12,50 | ||||
| 2026-02-13 | 13F | Pinnacle Wealth Planning Services, Inc. | 8.926 | 146 | ||||||
| 2026-02-13 | 13F | Prudential Financial Inc | 0 | -100,00 | 0 | |||||
| 2026-02-17 | 13F | Point72 Asset Management, L.P. | Put | 77.500 | 1.269 | |||||
| 2026-02-17 | 13F | Point72 Asset Management, L.P. | Call | 350.700 | 5.741 | |||||
| 2025-11-12 | 13F | 111 Capital | 0 | -100,00 | 0 | |||||
| 2026-02-17 | 13F | Point72 Asset Management, L.P. | 311.028 | 5.092 | ||||||
| 2026-02-06 | 13F | Handelsbanken Fonder AB | 295.584 | 23,23 | 5 | 0,00 | ||||
| 2026-02-10 | 13F | Sustainable Growth Advisers, LP | 680.170 | 27,13 | 11.134 | 10,76 | ||||
| 2026-02-12 | 13F | Hyperion Capital Advisors LP | 61.067 | 307,11 | 1.000 | 255,52 | ||||
| 2026-02-17 | 13F | Advisor Group Holdings, Inc. | 4.476 | -94,81 | 73 | -95,34 | ||||
| 2026-02-11 | 13F | Ramirez Asset Management, Inc. | 122 | 2 | ||||||
| 2026-02-13 | 13F | Dodge & Cox | 33.960.545 | -1,50 | 555.934 | -14,19 | ||||
| 2026-02-10 | 13F | Norges Bank | 4.898.974 | 80.196 | ||||||
| 2026-04-22 | 13F | Stone House Investment Management, LLC | 332 | 621,74 | 6 | |||||
| 2026-02-17 | 13F | Oaktree Capital Management Lp | 3.320.159 | 63,32 | 54.351 | 42,29 | ||||
| 2026-02-13 | 13F | Strategic Global Advisors, LLC | 0 | -100,00 | 0 | |||||
| 2026-04-23 | 13F | Impact Partnership Wealth, LLC | 0 | -100,00 | 0 | |||||
| 2026-04-08 | 13F | Grove Bank & Trust | 1.429 | -0,63 | 27 | 17,39 | ||||
| 2026-02-11 | 13F | Fox Run Management, L.l.c. | 0 | -100,00 | 0 | |||||
| 2025-11-12 | 13F | HAP Trading, LLC | Call | 450.900 | 1.429 | |||||
| 2025-11-12 | 13F | HAP Trading, LLC | Put | 41.700 | 71 | |||||
| 2026-02-06 | 13F | Larson Financial Group LLC | 861 | 46,43 | 14 | 27,27 | ||||
| 2026-01-23 | 13F | Sumitomo Mitsui Trust Holdings, Inc. | 799.887 | 3,17 | 13.094 | -10,11 | ||||
| 2026-02-12 | 13F | New York State Common Retirement Fund | 1.367.877 | 80,49 | 22.392 | 57,25 | ||||
| 2026-02-17 | 13F | Mercer Global Advisors Inc /adv | 0 | -100,00 | 0 | |||||
| 2026-02-09 | 13F/A | Swedbank AB | 221.900 | 0,00 | 3.633 | -12,88 | ||||
| 2026-01-13 | 13F | Dakota Wealth Management | 13.363 | 15,30 | 219 | 0,46 | ||||
| 2025-11-14 | 13F | Cubist Systematic Strategies, LLC | 0 | -100,00 | 0 | -100,00 | ||||
| 2025-11-05 | 13F | Machina Capital S.a.s. | 0 | -100,00 | 0 | |||||
| 2026-03-16 | 13F/A | Rockefeller Capital Management L.P. | 1.242 | 204,41 | 20 | 185,71 | ||||
| 2026-02-13 | 13F | Schroder Investment Management Group | 7.098.293 | -42,23 | 116.199 | -49,67 | ||||
| 2025-11-14 | 13F | Aquatic Capital Management LLC | 0 | -100,00 | 0 | |||||
| 2025-11-04 | 13F | UMA Financial Services, Inc. | 0 | -100,00 | 0 | |||||
| 2026-02-17 | 13F | Oaktree Fund Advisors, LLC | 187.074 | 59,99 | 3.062 | 39,37 | ||||
| 2026-02-06 | 13F | Resona Asset Management Co.,Ltd. | 93.751 | 5,32 | 1.536 | -8,36 | ||||
| 2026-02-17 | 13F | Wealth Watch Advisors, INC | 0 | -100,00 | 0 | |||||
| 2026-02-12 | 13F | Federated Hermes, Inc. | 1.454.534 | -0,59 | 23.811 | -13,40 | ||||
| 2026-02-17 | 13F | Jones Financial Companies Lllp | 61 | 0,00 | 1 | -100,00 | ||||
| 2026-02-17 | 13F | Bank Of America Corp /de/ | Put | 0 | -100,00 | 0 | ||||
| 2026-02-03 | 13F | SBI Securities Co., Ltd. | 386 | 0,00 | 6 | -14,29 | ||||
| 2026-02-10 | 13F | Envestnet Asset Management Inc | 119.168 | -5,84 | 1.951 | -18,00 | ||||
| 2026-02-05 | 13F/A | Truxt Investmentos Ltda. | 0 | -100,00 | 0 | -100,00 | ||||
| 2026-03-12 | 13F/A | Peak6 Llc | Call | 0 | -100,00 | 0 | -100,00 | |||
| 2026-02-13 | 13F | Headlands Technologies LLC | 28.122 | 460 | ||||||
| 2026-02-13 | 13F | Macquarie Group Ltd | 36.147 | -40,17 | 592 | -49,79 | ||||
| 2026-02-13 | 13F | Stifel Financial Corp | 116.882 | -27,58 | 1.913 | -36,91 | ||||
| 2026-02-17 | 13F | Bank Of America Corp /de/ | Call | 0 | -100,00 | 0 | ||||
| 2026-02-17 | 13F | Susquehanna International Group, Llp | 119.078 | -70,20 | 1.949 | -74,04 | ||||
| 2026-02-17 | 13F | Northern Trust Corp | 2.568.818 | 0,14 | 42.052 | -12,76 | ||||
| 2026-02-17 | 13F | Susquehanna International Group, Llp | Put | 583.200 | 20,67 | 9.547 | 5,12 | |||
| 2026-01-28 | 13F | Klp Kapitalforvaltning As | 112.500 | 0,00 | 1.842 | -12,87 | ||||
| 2026-02-13 | 13F | Neo Ivy Capital Management | 114.184 | 18,91 | 1.869 | 3,60 | ||||
| 2026-02-06 | 13F | Tredje AP-fonden | 0 | -100,00 | 0 | |||||
| 2026-02-17 | 13F | Susquehanna International Group, Llp | Call | 2.081.000 | 369,96 | 34.066 | 309,44 | |||
| 2026-02-13 | 13F | Mariner, LLC | 31.843 | -4,20 | 522 | -16,51 | ||||
| 2026-04-09 | 13F | Park Place Capital Corp | 103 | 0,00 | 2 | 0,00 | ||||
| 2026-02-17 | 13F | Wiley Bros.-aintree Capital, Llc | 23.646 | -60,44 | 387 | -65,54 | ||||
| 2026-02-17 | 13F | TB Capital Gestao de Recursos Ltda. | 0 | -100,00 | 0 | |||||
| 2026-04-13 | 13F | Massmutual Trust Co Fsb/adv | 1.098 | 28,57 | 21 | 53,85 | ||||
| 2026-02-13 | 13F | Sei Investments Co | 1.588.560 | 53,73 | 26.005 | 33,93 | ||||
| 2026-02-13 | 13F | National Bank Of Canada /fi/ | 335 | -6,69 | 5 | -16,67 | ||||
| 2025-10-24 | 13F | Meeder Asset Management Inc | 0 | -100,00 | 0 | -100,00 | ||||
| 2026-02-11 | 13F | Capital Wealth Planning, LLC | 197.874 | -13,23 | 3.202 | -25,28 | ||||
| 2026-02-17 | 13F | Schonfeld Strategic Advisors LLC | 0 | -100,00 | 0 | |||||
| 2026-02-11 | 13F | OneAscent Investment Solutions LLC | 15.904 | -0,41 | 260 | -13,33 | ||||
| 2026-04-20 | 13F | Banque Cantonale Vaudoise | 160.000 | 3.046 | ||||||
| 2026-02-17 | 13F | Dauntless Investment Group, LLC | 46.696 | 132,67 | 764 | 102,65 | ||||
| 2026-02-17 | 13F | Maryland State Retirement & Pension System | 19.068 | 0,00 | 312 | -12,85 | ||||
| 2026-01-30 | 13F | Us Bancorp \de\ | 12.635 | -3,99 | 207 | -16,60 | ||||
| 2026-02-13 | 13F | BRITISH COLUMBIA INVESTMENT MANAGEMENT Corp | 155.600 | 11,62 | 2.547 | -2,75 | ||||
| 2026-02-06 | 13F | Leonteq Securities AG | 0 | -100,00 | 0 | |||||
| 2026-02-12 | 13F | Swiss National Bank | 880.564 | 8,88 | 14.415 | -5,15 | ||||
| 2026-02-06 | 13F | HighTower Advisors, LLC | 60.147 | -0,93 | 985 | -13,68 | ||||
| 2026-04-06 | 13F | Versant Capital Management, Inc | 5.228 | 25,73 | 100 | 45,59 | ||||
| 2025-11-06 | 13F | Financial Advocates Investment Management | 0 | -100,00 | 0 | -100,00 | ||||
| 2026-02-13 | 13F | PCM Encore, LLC | 12.793 | 209 | ||||||
| 2026-02-17 | 13F | Two Sigma Investments, Lp | 693.311 | 108,99 | 11.350 | 82,08 | ||||
| 2026-02-11 | 13F | Deutsche Bank Ag\ | 1.553.131 | 158,09 | 25.425 | 124,85 | ||||
| 2025-11-06 | 13F | Abich Financial Wealth Management LLC | 0 | -100,00 | 0 | |||||
| 2026-02-13 | 13F | Smartleaf Asset Management LLC | 357 | -61,65 | 6 | -70,59 | ||||
| 2026-02-13 | 13F | Virtus ETF Advisers LLC | 4.000 | 0,00 | 65 | -13,33 | ||||
| 2025-11-13 | 13F | Quadrature Capital Ltd | 0 | -100,00 | 0 | -100,00 | ||||
| 2026-02-13 | 13F | OMERS ADMINISTRATION Corp | 26.717 | 437 | ||||||
| 2026-02-13 | 13F | Martingale Asset Management L P | 30.171 | -53,17 | 494 | -59,26 | ||||
| 2026-02-13 | 13F | Fieldview Capital Management, LLC | 0 | -100,00 | 0 | |||||
| 2026-02-12 | 13F | Quadrant Capital Group Llc | 3.045 | -4,55 | 50 | -16,95 | ||||
| 2026-04-20 | 13F | Assenagon Asset Management S.A. | 1.930.445 | 146,11 | 36.756 | 186,25 | ||||
| 2026-01-27 | 13F | Zurcher Kantonalbank (Zurich Cantonalbank) | 91.010 | 0,00 | 1.490 | -12,92 | ||||
| 2026-01-28 | 13F | Teacher Retirement System Of Texas | 31.533 | -8,91 | 516 | -20,62 | ||||
| 2026-02-17 | 13F | Bamco Inc /ny/ | 1.195.477 | -35,57 | 19.570 | -43,87 | ||||
| 2026-02-06 | 13F | Pnc Financial Services Group, Inc. | 13.855 | 4,31 | 227 | -9,24 | ||||
| 2026-02-05 | 13F | WIM INVESTMENT MANAGEMENT Ltd | 0 | -100,00 | 0 | -100,00 | ||||
| 2026-02-17 | 13F | Caisse De Depot Et Placement Du Quebec | 167.968 | -78,30 | 2.750 | -81,10 | ||||
| 2026-02-10 | 13F | Rothschild Investment Llc | 121 | -97,85 | 2 | -99,05 | ||||
| 2026-02-17 | 13F | PDT Partners, LLC | 292.877 | -44,48 | 4.794 | -51,63 | ||||
| 2026-04-24 | 13F | Deltec Asset Management Llc | 13.000 | 248 | ||||||
| 2026-02-11 | 13F | Simplex Trading, Llc | Put | 192.400 | 30,62 | 3.150 | 157.350,00 | |||
| 2026-02-13 | 13F | Causeway Capital Management Llc | 0 | -100,00 | 0 | |||||
| 2026-02-17 | 13F | Lighthouse Investment Partners, LLC | 11.078 | 181 | ||||||
| 2025-10-31 | 13F | Investment House Llc | 0 | -100,00 | 0 | |||||
| 2026-04-24 | 13F | Ninety One North America, Inc. | 1.924.627 | 34,03 | 36.645 | 55,89 | ||||
| 2026-02-12 | 13F | Great Lakes Advisors, Llc | 384.593 | -27,98 | 6.296 | -37,26 | ||||
| 2026-01-29 | 13F | Matthews International Capital Management Llc | 101.999 | -68,13 | 1.670 | -72,24 | ||||
| 2026-02-17 | 13F | Tudor Investment Corp Et Al | Call | 11.000 | -81,85 | 180 | -84,18 | |||
| 2026-02-17 | 13F | Private Advisor Group, LLC | 17.889 | -45,71 | 293 | -52,83 | ||||
| 2026-02-12 | 13F | Provida Pension Fund Administrator | 0 | -100,00 | 0 | -100,00 | ||||
| 2026-02-17 | 13F | Tudor Investment Corp Et Al | Put | 44.700 | 288,70 | 732 | 238,43 | |||
| 2026-01-29 | 13F | Sanctuary Advisors, LLC | 52.916 | -23,31 | 866 | -33,18 | ||||
| 2026-02-17 | 13F | Tudor Investment Corp Et Al | 22.154 | 363 | ||||||
| 2026-02-11 | 13F | Havemeyer Place LP | 51.663 | 846 | ||||||
| 2026-02-17 | 13F | Tower Research Capital LLC (TRC) | 1.479 | -31,69 | 24 | -40,00 | ||||
| 2026-01-22 | 13F | Massachusetts Financial Services Co /ma/ | 12.263.021 | 11,87 | 200.746 | -2,54 | ||||
| 2026-02-12 | 13F | Hollencrest Capital Management | 3 | 0,00 | 0 | |||||
| 2026-02-13 | 13F | Kilter Group LLC | 65 | -12,16 | 1 | 0,00 | ||||
| 2026-04-23 | 13F | Drucker Wealth 3.0, LLC | 36.176 | 7,45 | 689 | 24,86 | ||||
| 2026-02-13 | 13F | Cloverfields Capital Group, Lp | 0 | -100,00 | 0 | |||||
| 2026-02-13 | 13F | SRS Capital Advisors, Inc. | 363 | -88,07 | 6 | -91,23 | ||||
| 2026-02-13 | 13F | MAI Capital Management | 68 | -6,85 | 1 | 0,00 | ||||
| 2026-02-17 | 13F | Voloridge Investment Management, Llc | 1.243.222 | -43,65 | 20.352 | -50,91 | ||||
| 2026-04-22 | 13F | Sterling Capital Management LLC | 12.348 | -42,79 | 235 | -33,43 | ||||
| 2026-02-12 | 13F | Skandinaviska Enskilda Banken AB (publ) | 20.434 | -63,64 | 335 | -68,34 | ||||
| 2026-02-13 | 13F | Public Sector Pension Investment Board | 0 | -100,00 | 0 | |||||
| 2026-02-17 | 13F | California State Teachers Retirement System | 87.653 | 62,00 | 1.435 | 41,14 | ||||
| 2026-02-13 | 13F | Entropy Technologies, LP | 0 | -100,00 | 0 | |||||
| 2025-11-06 | 13F | Applied Finance Capital Management, LLC | 0 | -100,00 | 0 | |||||
| 2026-02-13 | 13F | Walleye Trading LLC | Put | 161.400 | -45,33 | 2.642 | -52,36 | |||
| 2026-02-13 | 13F | Blueshift Asset Management, LLC | 0 | -100,00 | 0 | |||||
| 2026-04-15 | 13F | Merit Financial Group, LLC | 15.261 | 14,63 | 291 | 33,64 | ||||
| 2026-01-30 | 13F | ARGA Investment Management, LP | 19.900.087 | 119,16 | 325.764 | 90,94 | ||||
| 2026-02-09 | 13F | William Blair Investment Management, Llc | 596.760 | -67,79 | 9.769 | -71,94 | ||||
| 2026-02-13 | 13F | Walleye Trading LLC | Call | 133.200 | -36,54 | 2.180 | -44,73 | |||
| 2026-02-13 | 13F | Walleye Trading LLC | 458.496 | 118,47 | 7.506 | 90,34 | ||||
| 2025-11-13 | 13F | Renaissance Technologies Llc | 0 | -100,00 | 0 | |||||
| 2026-02-04 | 13F | INCA Investments LLC | 0 | -100,00 | 0 | |||||
| 2026-02-12 | 13F | Federation des caisses Desjardins du Quebec | 16.292 | 11,86 | 267 | -2,56 | ||||
| 2026-02-12 | 13F | Campbell & CO Investment Adviser LLC | 0 | -100,00 | 0 | |||||
| 2026-02-13 | 13F | Walleye Capital LLC | Call | 56.000 | 55,99 | 917 | 35,91 | |||
| 2026-02-13 | 13F | Walleye Capital LLC | Put | 101.000 | 8,72 | 1.653 | -5,27 | |||
| 2026-02-13 | 13F | Walleye Capital LLC | 16.432 | 245,36 | 269 | 201,12 | ||||
| 2026-01-30 | 13F | Wealth High Governance Capital Ltda | 610.262 | 9.990 | ||||||
| 2026-02-13 | 13F | Arrowstreet Capital, Limited Partnership | 11.799.175 | 10,91 | 193.152 | -3,37 | ||||
| 2026-02-17 | 13F | Armistice Capital, Llc | 18.204 | 298 | ||||||
| 2026-02-13 | 13F | Verition Fund Management LLC | 151.819 | 1,01 | 2.485 | -12,00 | ||||
| 2026-02-13 | 13F | VPR Management LLC | 37.068 | 0,00 | 607 | -12,93 | ||||
| 2026-02-13 | 13F | Rhumbline Advisers | 400.214 | -2,61 | 6.551 | -15,15 | ||||
| 2026-02-13 | 13F | Umb Bank N A/mo | 25 | -16,67 | 0 | |||||
| 2026-01-29 | 13F | Rakuten Securities, Inc. | 13 | -18,75 | 0 | |||||
| 2026-02-05 | 13F | North Dakota State Investment Board | 14.347 | 235 | ||||||
| 2026-02-13 | 13F | Police & Firemen's Retirement System of New Jersey | 212.050 | -4,77 | 3.471 | -17,02 | ||||
| 2026-02-17 | 13F | Russell Investments Group, Ltd. | 1.509.009 | 2,96 | 24.709 | -10,50 | ||||
| 2026-01-26 | 13F | JGP Global Gestao de Recursos Ltda. | 250.064 | -58,40 | 4.094 | -63,76 | ||||
| 2026-02-17 | 13F | Two Sigma Advisers, Lp | 0 | -100,00 | 0 | |||||
| 2026-02-19 | 13F | Invesco Ltd. | 594.745 | 64,33 | 9.736 | 43,16 | ||||
| 2026-02-13 | 13F | Nfj Investment Group, Llc | 53.884 | 4,94 | 882 | -8,51 | ||||
| 2026-02-10 | 13F/A | Northwestern Mutual Wealth Management Co | 86 | 1 | ||||||
| 2026-04-16 | 13F | Tandem Capital Management Corp /adv | 19.663 | -2,67 | 374 | 13,33 | ||||
| 2026-02-11 | 13F | SOUTH STATE Corp | 30 | 0,00 | 0 | |||||
| 2026-04-21 | 13F | OneAscent Wealth Management LLC | 21.040 | 15,41 | 401 | 34,23 | ||||
| 2026-02-17 | 13F | Summit Trail Advisors, Llc | 26.134 | 17,28 | 428 | 2,15 | ||||
| 2026-01-30 | 13F | Turning Point Benefit Group, Inc. | 12 | 0,00 | 0 | |||||
| 2025-11-14 | 13F | Two Sigma Securities, Llc | 0 | -100,00 | 0 | |||||
| 2026-02-12 | 13F | BRYN MAWR TRUST Co | 0 | -100,00 | 0 | -100,00 | ||||
| 2026-02-17 | 13F | Cetera Investment Advisers | 11.518 | -72,58 | 189 | -76,17 | ||||
| 2026-01-16 | 13F | Standard Life Aberdeen plc | 27.076 | 7,44 | 443 | -6,34 | ||||
| 2026-02-12 | 13F | Jane Street Group, Llc | 0 | -100,00 | 0 | -100,00 | ||||
| 2026-02-13 | 13F | Diametric Capital, LP | 35.697 | 584 | ||||||
| 2026-02-13 | 13F | Absolute Gestao de Investimentos Ltda. | 2.262.857 | 108,63 | 37.043 | 81,77 | ||||
| 2026-01-27 | 13F | Novem Group | 0 | -100,00 | 0 | |||||
| 2026-02-17 | 13F | Atom Investors LP | 0 | -100,00 | 0 | |||||
| 2026-02-02 | 13F | Principal Financial Group Inc | 11.416 | -23,35 | 187 | -33,33 | ||||
| 2026-01-30 | 13F | State of New Jersey Common Pension Fund D | 113.593 | -35,41 | 1.860 | -43,73 | ||||
| 2026-02-17 | 13F | Price T Rowe Associates Inc /md/ | 198.103 | 5,97 | 3 | 0,00 | ||||
| 2026-02-11 | 13F | Los Angeles Capital Management Llc | 1.192.359 | 5,37 | 21.343 | 0,38 | ||||
| 2026-02-17 | 13F | GAM Holding AG | 248.615 | 387,48 | 4.070 | 324,74 | ||||
| 2026-02-13 | 13F | Treasurer of the State of North Carolina | 457.144 | -3,59 | 7 | -12,50 | ||||
| 2026-02-17 | 13F | Credit Agricole S A | 14.200 | 0,00 | 232 | -12,78 | ||||
| 2026-02-17 | 13F | Fmr Llc | 7.360.536 | 2,24 | 120.492 | -10,93 | ||||
| 2026-02-17 | 13F | Millennium Management Llc | 1.792.836 | 492,52 | 29.349 | 416,24 | ||||
| 2026-02-17 | 13F | Engineers Gate Manager LP | 100.677 | -49,83 | 1.648 | -56,29 | ||||
| 2025-11-14 | 13F | Teza Capital Management LLC | 0 | -100,00 | 0 | -100,00 | ||||
| 2025-11-07 | 13F | Gsa Capital Partners Llp | 0 | -100,00 | 0 | |||||
| 2025-11-14 | 13F | Natixis | 0 | -100,00 | 0 | -100,00 | ||||
| 2026-04-13 | 13F | True Wealth Design, LLC | 70 | 0,00 | 1 | 0,00 | ||||
| 2026-02-17 | 13F | Millennium Management Llc | Call | 0 | -100,00 | 0 | ||||
| 2026-02-11 | 13F | Simplex Trading, Llc | 0 | -100,00 | 0 | -100,00 | ||||
| 2026-02-05 | 13F | Bessemer Group Inc | 121 | 0 | ||||||
| 2026-02-17 | 13F | Trexquant Investment LP | 48.172 | -88,38 | 789 | -89,89 | ||||
| 2026-02-06 | 13F | Kimelman & Baird, LLC | 3 | 0,00 | 0 | |||||
| 2026-02-23 | 13F | Mv Capital Management, Inc. | 257 | 0,00 | 4 | -20,00 | ||||
| 2026-04-23 | 13F | Oppenheimer Asset Management Inc. | 11.451 | 0,00 | 218 | 16,58 | ||||
| 2026-02-12 | 13F | State Board Of Administration Of Florida Retirement System | 295.581 | 0,00 | 4.839 | -12,88 | ||||
| 2026-02-13 | 13F | JustInvest LLC | 11.983 | -6,04 | 196 | -17,99 | ||||
| 2026-02-17 | 13F | General Atlantic Llc | 22.699.133 | -11,05 | 371.585 | -22,50 | ||||
| 2026-02-17 | 13F | Amundi | 761.804 | 25,79 | 12.471 | 20,27 | ||||
| 2026-04-15 | 13F | FNY Investment Advisers, LLC | 0 | -100,00 | 0 | |||||
| 2026-04-15 | 13F | Activest Wealth Management | 124 | 6,90 | 2 | 100,00 | ||||
| 2026-02-13 | 13F | 1832 Asset Management L.P. | 10.949 | 179 | ||||||
| 2026-02-11 | 13F | Brandywine Global Investment Management, LLC | 110.609 | 1.811 | ||||||
| 2026-04-02 | 13F | Ares Financial Consulting, LLC | 42 | 0,00 | 1 | |||||
| 2026-01-29 | 13F | UBS Group AG | 1.441.237 | 102,90 | 23.593 | 76,77 | ||||
| 2026-02-10 | 13F | Quantbot Technologies LP | 0 | -100,00 | 0 | |||||
| 2026-02-13 | 13F | Barclays Plc | 68.772 | 40,21 | 1.126 | 22,15 | ||||
| 2025-11-14 | 13F | AXA Investment Managers S.A. | 36.020 | 677 | ||||||
| 2026-02-03 | 13F | Mitsubishi UFJ Kokusai Asset Management Co., Ltd. | 457.119 | 29,60 | 7.396 | 11,60 | ||||
| 2026-04-06 | 13F | CX Institutional | 582 | 0 | ||||||
| 2026-02-12 | 13F | DRW Securities, LLC | 29.079 | 46,59 | 476 | 27,27 | ||||
| 2026-02-17 | 13F | Capstone Investment Advisors, Llc | 0 | -100,00 | 0 | -100,00 | ||||
| 2026-02-12 | 13F | Voya Investment Management Llc | 357.587 | -2,07 | 5.854 | -14,69 | ||||
| 2026-02-17 | 13F | FIL Ltd | 892.359 | 32,98 | 14.608 | 15,86 | ||||
| 2026-02-12 | 13F | MetLife Investment Management, LLC | 8.159 | -3,49 | 134 | -15,82 | ||||
| 2026-02-17 | 13F | Utah Retirement Systems | 21.424 | 0,00 | 351 | -12,94 | ||||
| 2026-04-24 | 13F | Root Financial Partners, LLC | 70 | 311,76 | 1 | |||||
| 2026-02-17 | 13F | Breakout Capital Partners, LP | 0 | -100,00 | 0 | -100,00 | ||||
| 2026-04-16 | 13F | Diversified Trust Co | 0 | -100,00 | 0 | |||||
| 2026-02-10 | 13F | Intech Investment Management Llc | 0 | -100,00 | 0 | |||||
| 2026-01-15 | 13F | Nisa Investment Advisors, Llc | 150 | -57,14 | 2 | -66,67 | ||||
| 2026-02-11 | 13F | Allianz Asset Management GmbH | 200.930 | 124,56 | 3.289 | 95,66 | ||||
| 2026-02-13 | 13F | Victory Capital Management Inc | 0 | -100,00 | 0 | |||||
| 2026-02-11 | 13F | Prudential Plc | 23.362 | -9,88 | 382 | -21,56 | ||||
| 2026-04-22 | 13F | Pictet Asset Management Holding SA | 532.173 | -1,36 | 10.133 | 14,73 | ||||
| 2026-02-11 | 13F | Arizona PSPRS Trust | 0 | -100,00 | 0 | |||||
| 2026-02-13 | 13F | Banco Santander, S.A. | 33.696 | 552 | ||||||
| 2026-02-09 | 13F | Legal & General Group Plc | 2.760.141 | 9,01 | 45.184 | -5,03 | ||||
| 2026-02-10 | 13F | Fideuram Asset Management (Ireland) dac | 10.404 | 141 | ||||||
| 2025-11-07 | 13F | Shell Asset Management Co | 2.689 | -74,82 | 0 | |||||
| 2026-02-10 | 13F | Acadian Asset Management Llc | 346.126 | -62,67 | 6 | -70,59 | ||||
| 2025-11-21 | 13F | Nebula Research & Development LLC | 0 | -100,00 | 0 | -100,00 | ||||
| 2026-01-29 | 13F | Vanguard Group Inc | 3.784.717 | 4,72 | 61.956 | -8,77 | ||||
| 2026-02-10 | 13F | BW Gestao de Investimentos Ltda. | 389.738 | 6.380 | ||||||
| 2026-01-28 | 13F | Kapitalo Investimentos Ltda | 225.664 | 0,00 | 3.694 | -12,88 | ||||
| 2026-02-17 | 13F | DZ BANK AG Deutsche Zentral Genossenschafts Bank, Frankfurt am Main | 385.242 | 6.306 | ||||||
| 2026-02-18 | 13F | Mackenzie Financial Corp | 297.059 | -52,03 | 4.904 | -57,86 | ||||
| 2026-02-13 | 13F | Ubs Asset Management Americas Inc | 2.391.289 | 39.145 | ||||||
| 2026-02-12 | 13F | Nuveen, LLC | 1.438.237 | 0,65 | 23.544 | -12,31 | ||||
| 2026-02-13 | 13F | American Century Companies Inc | 2.490.307 | 2,90 | 40.766 | -10,36 | ||||
| 2026-02-09 | 13F | Hartland & Co., LLC | 82 | -60,95 | 1 | -66,67 | ||||
| 2026-02-13 | 13F | Transamerica Financial Advisors, Inc. | 185 | 3 | ||||||
| 2026-02-10 | 13F | Globeflex Capital L P | 357.941 | 5,40 | 5.859 | -8,17 | ||||
| 2026-02-05 | 13F | Amalgamated Bank | 34.217 | 61,72 | 1 | |||||
| 2026-02-17 | 13F | Dark Forest Capital Management Lp | 0 | -100,00 | 0 | |||||
| 2026-02-11 | 13F | Vestcor Inc | 11.430 | 234,90 | 0 | |||||
| 2026-01-26 | 13F | La Banque Postale Asset Management SA | 141.145 | -7,31 | 2.311 | -19,26 | ||||
| 2026-02-11 | 13F | Winton Capital Group Ltd | 65.000 | 1.064 | ||||||
| 2026-02-13 | 13F | Neuberger Berman Group LLC | 43.938 | -0,97 | 719 | -13,69 | ||||
| 2026-02-17 | 13F | Creative Planning | 69.663 | -10,63 | 1.140 | -22,13 | ||||
| 2026-02-04 | 13F | Virginia Retirement Systems Et Al | 0 | -100,00 | 0 | |||||
| 2026-02-17 | 13F | Ameriprise Financial Inc | 547.480 | -70,82 | 8.962 | -74,58 | ||||
| 2026-02-09 | 13F | Geode Capital Management, Llc | 4.866.728 | 4,39 | 79.285 | -9,06 | ||||
| 2026-02-09 | 13F | Fisher Asset Management, LLC | 4.377.265 | -3,14 | 71.656 | -15,61 | ||||
| 2026-02-13 | 13F | Wells Fargo & Company/mn | 26.331 | 31,27 | 431 | 14,63 | ||||
| 2026-02-12 | 13F | Aviva Plc | 289.977 | 8,97 | 4.747 | -5,08 | ||||
| 2026-02-12 | 13F | Earnest Partners Llc | 380.478 | -2,85 | 6.228 | -15,36 | ||||
| 2026-04-24 | 13F | Sumitomo Mitsui DS Asset Management Company, Ltd | 21.368 | 0,00 | 407 | 16,33 | ||||
| 2026-02-17 | 13F | MIRAE ASSET GLOBAL ETFS HOLDINGS Ltd. | 6.867 | 11,77 | 113 | -3,45 | ||||
| 2026-02-17 | 13F | Twinbeech Capital Lp | 319.928 | 5.237 | ||||||
| 2026-01-28 | 13F | WPG Advisers, LLC | 180 | 35,34 | 3 | 0,00 | ||||
| 2026-04-17 | 13F | Outlook Wealth Advisors, LLC | 18.907 | -0,46 | 360 | 15,81 | ||||
| 2025-11-06 | 13F | CIBC World Markets Inc. | 0 | -100,00 | 0 | -100,00 | ||||
| 2026-02-17 | 13F | Summit Global Investments | 0 | -100,00 | 0 | |||||
| 2026-04-20 | 13F | Ronald Blue Trust, Inc. | 3.664 | -7,54 | 70 | 7,81 | ||||
| 2026-01-26 | 13F | KBC Group NV | 171.436 | 37,39 | 3 | 0,00 | ||||
| 2026-02-05 | 13F | Elyxium Wealth, LLC | 238 | 4 | ||||||
| 2026-04-08 | 13F | Legacy Wealth Asset Management, LLC | 33.132 | 2,91 | 631 | 19,54 | ||||
| 2026-02-09 | 13F | Employees Retirement System of Texas | 25.905 | -57,00 | 0 | -100,00 | ||||
| 2026-02-11 | 13F | J.Safra Asset Management Corp | 600 | 10 | ||||||
| 2026-02-13 | 13F | First Trust Advisors Lp | 534.939 | -56,50 | 8.757 | -62,11 | ||||
| 2026-02-10 | 13F | Bnp Paribas Arbitrage, Sa | 1.123.191 | 122,52 | 18.387 | 93,86 | ||||
| 2026-02-26 | 13F/A | Aristides Capital LLC | Put | 500.000 | 0,00 | 8.185 | -12,88 | |||
| 2026-02-17 | 13F | Triveni Capital Investments LP | 333.734 | 5.463 | ||||||
| 2025-11-14 | 13F | Point72 Hong Kong Ltd | 0 | -100,00 | 0 | |||||
| 2026-02-11 | 13F | Parallel Advisors, LLC | 1.513 | 0,60 | 25 | -14,29 | ||||
| 2026-02-17 | 13F | Aqr Capital Management Llc | 289.332 | -15,17 | 4.736 | -26,09 | ||||
| 2026-03-06 | 13F | Hsbc Holdings Plc | 108.818 | 7,69 | 1.791 | -4,74 | ||||
| 2026-02-13 | 13F | Toroso Investments, LLC | 133.652 | -10,51 | 2.188 | -22,06 | ||||
| 2026-02-17 | 13F | SummitTX Capital, L.P. | 30.978 | 2,85 | 507 | -10,27 | ||||
| 2026-02-02 | 13F | Fifth Third Bancorp | 23 | 0,00 | 0 | |||||
| 2026-02-13 | 13F | Thornburg Investment Management Inc | 450.131 | 7.369 | ||||||
| 2026-02-17 | 13F | XTX Topco Ltd | 160.090 | 208,08 | 2.621 | 168,44 | ||||
| 2026-02-10 | 13F | Bruce G. Allen Investments, LLC | 33 | 0,00 | 1 | |||||
| 2026-02-17 | 13F | Man Group plc | 30.700 | 503 | ||||||
| 2026-02-13 | 13F | Y-Intercept (Hong Kong) Ltd | 0 | -100,00 | 0 | -100,00 | ||||
| 2026-02-18 | 13F | GWM Advisors LLC | 0 | -100,00 | 0 | |||||
| 2026-02-17 | 13F | Balyasny Asset Management Llc | 12.944 | -96,55 | 212 | -97,00 | ||||
| 2026-02-17 | 13F | Jump Financial, LLC | 192.093 | -73,16 | 3.145 | -76,62 | ||||
| 2025-11-14 | 13F | Wolverine Trading, Llc | 0 | -100,00 | 0 | -100,00 | ||||
| 2026-02-09 | 13F | Huntington National Bank | 35 | 0,00 | 1 | |||||
| 2026-04-17 | 13F | Bell Investment Advisors, Inc | 104 | 50,72 | 2 | 0,00 | ||||
| 2026-02-17 | 13F | Liontrust Investment Partners LLP | 231.700 | 953,18 | 3.793 | 754,05 | ||||
| 2025-10-24 | 13F | Bayforest Capital Ltd | 0 | -100,00 | 0 | -100,00 | ||||
| 2026-02-13 | 13F | Bridgefront Capital, LLC | 16.725 | 33,52 | 274 | 16,17 | ||||
| 2026-02-13 | 13F | Korea Investment CORP | 161.000 | 14,84 | 2.636 | 0,04 | ||||
| 2026-02-12 | 13F | BlackRock, Inc. | 46.729.141 | 4,14 | 764.956 | -9,27 | ||||
| 2026-04-17 | 13F | Verde Servicos Internacionais S.A. | 168.923 | 3 | ||||||
| 2026-02-12 | 13F | Xponance, Inc. | 28.687 | -0,92 | 470 | -13,79 | ||||
| 2026-02-11 | 13F | Franklin Resources Inc | 2.734.137 | 10,34 | 44.758 | -3,88 | ||||
| 2026-02-20 | 13F/A | Atmos Capital Gestao De Recursos Ltda. | Call | 6.136.000 | 205,27 | 100.446 | 165,96 | |||
| 2026-02-20 | 13F/A | Atmos Capital Gestao De Recursos Ltda. | 5.621.659 | -32,66 | 92.027 | -41,34 | ||||
| 2026-04-07 | 13F | Farther Finance Advisors, LLC | 1.746 | -54,54 | 33 | -48,39 | ||||
| 2026-04-15 | 13F | Paragon Capital Management Ltd | 12.787 | -5,10 | 243 | 10,45 | ||||
| 2026-02-06 | 13F | Fairtree Asset Management (Pty) Ltd | 38.208 | 8,07 | 625 | -5,87 | ||||
| 2026-02-06 | 13F | Global Retirement Partners, LLC | 5.597 | 154,29 | 92 | 121,95 | ||||
| 2026-02-17 | 13F | EFG International AG | 48.637 | 796 | ||||||
| 2026-02-05 | 13F | Qsemble Capital Management, LP | 38.334 | 0,98 | 628 | -12,06 | ||||
| 2026-02-11 | 13F | O'shaughnessy Asset Management, Llc | 12.493 | 0,16 | 205 | -12,82 | ||||
| 2026-02-13 | 13F | Rokos Capital Management LLP | 231.317 | 3.790 | ||||||
| 2026-02-12 | 13F | Loomis Sayles & Co L P | 318.004 | -9,97 | 5.206 | -21,56 | ||||
| 2026-02-12 | 13F | Banco BTG Pactual S.A. | 23.909 | -61,10 | 391 | -66,12 | ||||
| 2026-02-11 | 13F | Capital World Investors | 37.497.038 | -6,04 | 613.829 | -18,14 | ||||
| 2026-02-06 | 13F | EverSource Wealth Advisors, LLC | 1.690 | 6,22 | 28 | -6,90 | ||||
| 2026-02-17 | 13F | Public Employees Retirement System Of Ohio | 1.936.961 | 54,12 | 31.708 | 34,28 | ||||
| 2026-01-30 | 13F | Pekin Hardy Strauss, Inc. | 14.500 | 237 | ||||||
| 2026-02-12 | 13F | Brinker Capital Investments, LLC | 17.777 | 10,93 | 291 | -3,32 | ||||
| 2026-02-12 | 13F | Hrt Financial Lp | 64.879 | -84,97 | 1 | -87,50 | ||||
| 2026-01-09 | 13F | Seafarer Capital Partners, LLC | 3.771.000 | 0,00 | 61.731 | -12,88 | ||||
| 2026-02-23 | 13F | Vinland Capital Management Gestora de Recursos LTDA. | Put | 0 | -100,00 | 0 | -100,00 | |||
| 2026-02-17 | 13F | 9823 Capital, L.P. | 11.198 | 183 | ||||||
| 2026-02-11 | 13F | LPL Financial LLC | 10.454 | -66,19 | 171 | -70,57 | ||||
| 2026-02-12 | 13F | California Public Employees Retirement System | 783.961 | 1,54 | 12.833 | -11,54 | ||||
| 2026-02-17 | 13F | Capital Fund Management S.a. | Call | 16.300 | 267 | |||||
| 2026-02-17 | 13F | Capital Fund Management S.a. | Put | 22.500 | -34,21 | 368 | -42,68 | |||
| 2026-02-10 | 13F | Bank of New York Mellon Corp | 1.255.393 | -1,77 | 20.551 | -14,42 | ||||
| 2026-01-27 | 13F | Asset Management One Co., Ltd. | 56.553 | -3,72 | 930 | -15,68 | ||||
| 2025-11-14 | 13F | Quarry LP | 0 | -100,00 | 0 | |||||
| 2026-01-23 | 13F | Halbert Hargrove Global Advisors, Llc | 0 | -100,00 | 0 | |||||
| 2026-02-17 | 13F | Royal Bank Of Canada | 469.548 | 19,35 | 7.686 | 3,98 | ||||
| 2026-02-17 | 13F | Mirabella Financial Services Llp | 262.897 | 4.304 | ||||||
| 2026-02-12 | 13F | CIBC Private Wealth Group, LLC | 133 | -15,29 | 2 | 0,00 | ||||
| 2026-04-23 | 13F | CWM Advisors, LLC | 89.121 | 1,03 | 1.697 | 17,45 | ||||
| 2026-02-17 | 13F | Bank Of America Corp /de/ | 3.857.852 | 0,78 | 63.153 | -12,20 | ||||
| 2026-04-22 | 13F | Advocate Investing Services LLC | 0 | -100,00 | 0 | |||||
| 2026-04-21 | 13F | OneAscent Financial Services LLC | 25.759 | 29,85 | 490 | 51,23 | ||||
| 2026-01-15 | 13F | Frank, Rimerman Advisors LLC | 14.606 | 0,00 | 239 | -12,77 | ||||
| 2026-01-23 | 13F | Diversify Advisory Services, LLC | 0 | -100,00 | 0 | |||||
| 2026-02-17 | 13F | Advisory Services Network, LLC | 0 | -100,00 | 0 | |||||
| 2025-11-06 | 13F | Whipplewood Advisors, LLC | 0 | -100,00 | 0 | |||||
| 2026-01-21 | 13F | Rheos Capital Works Inc. | 500.000 | 66,67 | 8 | 60,00 | ||||
| 2026-02-13 | 13F | State Street Corp | 9.503.007 | 1,55 | 155.564 | -11,53 | ||||
| 2026-04-22 | 13F | Janney Montgomery Scott LLC | 19.491 | -6,97 | 0 | |||||
| 2026-02-05 | 13F | Atria Investments Llc | 34.312 | -7,02 | 562 | -19,05 | ||||
| 2026-01-20 | 13F | Cromwell Holdings LLC | 53 | 0,00 | 1 | |||||
| 2025-10-30 | 13F | Rakuten Investment Management, Inc. | 0 | -100,00 | 0 | |||||
| 2025-11-17 | 13F | PharVision Advisers, LLC | 0 | -100,00 | 0 | |||||
| 2026-02-12 | 13F | Marex Group plc | 51.915 | 353,29 | 850 | 293,06 | ||||
| 2026-02-17 | 13F | Quantitative Investment Management, LLC | 0 | -100,00 | 0 | |||||
| 2026-02-13 | 13F | Manufacturers Life Insurance Company, The | 85.405 | 7,08 | 1.398 | -6,68 | ||||
| 2025-11-14 | 13F | Cubist Systematic Strategies, LLC | Put | 30.000 | 564 | |||||
| 2026-02-17 | 13F | Aster Capital Management (DIFC) Ltd | 3.390 | 55 | ||||||
| 2026-01-29 | 13F | IMC-Chicago, LLC | 132.945 | 114,06 | 2.176 | 86,62 | ||||
| 2025-11-14 | 13F | Petrus Trust Company, LTA | 0 | -100,00 | 0 | |||||
| 2026-01-29 | 13F | IMC-Chicago, LLC | Put | 175.400 | -20,38 | 2.871 | -30,64 | |||
| 2025-10-31 | 13F | Symphony Financial, Ltd. Co. | 0 | -100,00 | 0 | -100,00 | ||||
| 2026-02-12 | 13F | Aware Super Pty Ltd as trustee of Aware Super | 427.660 | 7.001 | ||||||
| 2026-01-29 | 13F | Quent Capital, LLC | 26 | -81,02 | 0 | -100,00 | ||||
| 2026-02-17 | 13F | Parallax Volatility Advisers, L.P. | Call | 119.600 | 1.958 | |||||
| 2026-02-05 | 13F | Allworth Financial LP | 505 | 35,75 | 8 | 33,33 | ||||
| 2026-02-17 | 13F | Canada Pension Plan Investment Board | 0 | -100,00 | 0 | |||||
| 2026-02-17 | 13F | Parallax Volatility Advisers, L.P. | 34.126 | 559 | ||||||
| 2026-04-07 | 13F | Signaturefd, Llc | 5.759 | -0,02 | 110 | 15,96 | ||||
| 2026-02-17 | 13F | PointState Capital LP | 571.756 | 9.360 | ||||||
| 2025-11-14 | 13F | WealthTrak Capital Management LLC | 0 | -100,00 | 0 | |||||
| 2026-01-30 | 13F | Mitsubishi UFJ Trust & Banking Corp | 905.893 | -12,54 | 14.829 | -23,81 | ||||
| 2025-11-10 | 13F | Barings Llc | 0 | -100,00 | 0 | |||||
| 2026-02-13 | 13F | Citigroup Inc | 1.103.495 | 19,59 | 18.064 | 4,19 | ||||
| 2026-02-10 | 13F | Nomura Asset Management Co Ltd | 56.100 | 0,00 | 918 | -12,90 | ||||
| 2026-02-17 | 13F | Graham Capital Management, L.P. | 20.650 | 11,50 | 338 | -2,87 | ||||
| 2026-01-26 | 13F | Cwm, Llc | 14.339 | -13,53 | 0 | |||||
| 2026-02-12 | 13F | Jane Street Group, Llc | Put | 25.800 | -71,55 | 422 | -75,23 | |||
| 2026-02-11 | 13F | Harvest Fund Management Co., Ltd | 52.676 | 48,22 | 1 | |||||
| 2026-02-12 | 13F | Jane Street Group, Llc | Call | 40.400 | -62,21 | 661 | -67,08 | |||
| 2026-02-17 | 13F | Polymer Capital Management (US) LLC | 18.873 | 309 | ||||||
| 2026-02-17 | 13F | Nomura Holdings Inc | 20.037 | 328 | ||||||
| 2026-02-17 | 13F | Citadel Advisors Llc | Call | 169.600 | -73,71 | 2.776 | -77,10 | |||
| 2026-02-17 | 13F | Citadel Advisors Llc | Put | 201.400 | -70,46 | 3.297 | -74,27 | |||
| 2026-02-11 | 13F | CenterBook Partners LP | 0 | -100,00 | 0 | -100,00 | ||||
| 2026-02-17 | 13F | Citadel Advisors Llc | 182.639 | -67,55 | 2.990 | -71,73 | ||||
| 2026-03-03 | 13F/A | Caitong International Asset Management Co., Ltd | 30 | -98,94 | 0 | -100,00 | ||||
| 2026-02-12 | 13F | APG Asset Management N.V. | 212.000 | 8,83 | 2.955 | -5,17 | ||||
| 2026-02-11 | 13F | Group One Trading, L.p. | Put | 95.800 | -46,90 | 1.568 | -53,73 | |||
| 2026-02-11 | 13F | Group One Trading, L.p. | 220.023 | 19,39 | 3.602 | 4,02 | ||||
| 2026-02-17 | 13F | Nissay Asset Management Corp /japan/ /adv | 270.979 | 4.436 | ||||||
| 2025-11-14 | 13F | Capitolis Liquid Global Markets LLC | 0 | -100,00 | 0 | |||||
| 2026-04-03 | 13F | Investors Research Corp | 0 | -100,00 | 0 | |||||
| 2026-02-17 | 13F | Squadra Investments - Gestao De Recursos Ltda. | Put | 0 | -100,00 | 0 | ||||
| 2026-02-12 | 13F | Bank Of Montreal /can/ | 1.290.621 | 21.127 | ||||||
| 2026-02-13 | 13F | Cornerstone Financial Management LLC | 56 | 1 | ||||||
| 2026-02-17 | 13F | Squadra Investments - Gestao De Recursos Ltda. | 4.793.735 | -30,20 | 78.473 | -39,19 | ||||
| 2026-02-10 | 13F | Goldman Sachs Group Inc | Call | 1.549.600 | 47,58 | 25.367 | 28,57 | |||
| 2026-02-10 | 13F | Goldman Sachs Group Inc | Put | 1.079.600 | -38,31 | 17.673 | -46,25 | |||
| 2026-02-13 | 13F | Marshall Wace, Llp | Put | 0 | -100,00 | 0 | ||||
| 2026-02-13 | 13F | Marshall Wace, Llp | 0 | -100,00 | 0 | |||||
| 2026-02-17 | 13F | D. E. Shaw & Co., Inc. | 296.491 | -18,37 | 4.854 | -28,88 | ||||
| 2026-02-10 | 13F | Goldman Sachs Group Inc | 1.570.073 | 69,48 | 25.702 | 47,65 | ||||
| 2026-02-13 | 13F | Marshall Wace, Llp | Call | 0 | -100,00 | 0 | ||||
| 2026-02-17 | 13F | Praetorian PR LLC | 1.000.000 | 0,00 | 16.370 | -12,88 | ||||
| 2026-02-13 | 13F | SPX Equities Gestao de Recursos Ltda | 4.195.379 | 109,74 | 68.678 | 82,73 | ||||
| 2026-02-04 | 13F | Swiss Life Asset Management Ltd | 46.486 | 30,13 | 761 | 13,26 | ||||
| 2026-04-13 | 13F | Global X Japan Co., Ltd. | 5.734 | 109 | ||||||
| 2026-04-16 | 13F | SG Americas Securities, LLC | 680.507 | 158,91 | 13 | 200,00 | ||||
| 2026-02-17 | 13F | Alliancebernstein L.p. | 487.810 | 185,22 | 7.985 | 148,52 | ||||
| 2025-11-14 | 13F | Susquehanna Portfolio Strategies, LLC | 0 | -100,00 | 0 | -100,00 | ||||
| 2026-04-13 | 13F | IFP Advisors, Inc | 117 | -12,69 | 2 | 0,00 | ||||
| 2026-02-05 | 13F | DnB Asset Management AS | 44.043 | -72,31 | 721 | -75,90 | ||||
| 2026-02-17 | 13F | Optiver Holding B.V. | 1.440.068 | 230,23 | 23.574 | 187,72 | ||||
| 2026-04-24 | 13F | Ninety One UK Ltd | 8.055.677 | 30,21 | 153.380 | 51,45 | ||||
| 2026-02-17 | 13F | Optiver Holding B.V. | Put | 433.100 | 7,92 | 7.090 | -5,98 | |||
| 2026-04-15 | 13F | Norden Group Llc | 10.983 | 209 | ||||||
| 2026-02-06 | 13F | Lsv Asset Management | 25.400 | 0,00 | 0 | |||||
| 2026-04-23 | 13F | SJS Investment Consulting Inc. | 5 | 0 | ||||||
| 2026-03-12 | 13F/A | Peak6 Llc | Put | 108.000 | -5,84 | 1.768 | -18,00 | |||
| 2026-02-11 | 13F | Cerity Partners LLC | 0 | -100,00 | 0 | |||||
| 2026-04-08 | 13F | Wealth Enhancement Advisory Services, Llc | 19.611 | 5,02 | 365 | 14,47 | ||||
| 2026-03-12 | 13F/A | Peak6 Llc | 96.030 | 528,96 | 1.572 | 449,65 | ||||
| 2026-02-09 | 13F | Keating Financial Advisory Services, Inc. | 2 | 0 | ||||||
| 2026-02-12 | 13F | Johnson Financial Group, Inc. | 91 | 0,00 | 1 | 0,00 | ||||
| 2026-04-13 | 13F | CGC Financial Services, LLC | 0 | -100,00 | 0 | |||||
| 2026-04-21 | 13F | Robeco Institutional Asset Management B.V. | 1.656.177 | 363,12 | 31.534 | 438,66 | ||||
| 2026-02-12 | 13F | Triumph Capital Management | 800 | 60,00 | 13 | 44,44 | ||||
| 2026-02-03 | 13F | Crossmark Global Holdings, Inc. | 361.263 | -52,97 | 5.914 | -59,03 | ||||
| 2025-11-14 | 13F | Orbis Allan Gray Ltd | 0 | -100,00 | 0 | -100,00 | ||||
| 2026-02-13 | 13F | Charles Schwab Investment Management Inc | 87.356 | 0,55 | 1.430 | -12,38 | ||||
| 2026-02-17 | 13F | Sig Brokerage, Lp | Call | 0 | -100,00 | 0 | ||||
| 2026-02-10 | 13F | State of Wyoming | 0 | -100,00 | 0 | |||||
| 2026-02-17 | 13F | Sig Brokerage, Lp | Put | 0 | -100,00 | 0 | ||||
| 2026-02-13 | 13F | Nutshell Asset Management Ltd | 200.000 | 3.274 | ||||||
| 2026-02-10 | 13F | Axq Capital, Lp | 34.574 | 22,35 | 566 | 6,60 | ||||
| 2025-11-14 | 13F | Wolverine Trading, Llc | Call | 30.000 | 9,49 | 571 | 5,75 | |||
| 2025-11-14 | 13F | Wolverine Trading, Llc | Put | 15.300 | -50,65 | 291 | -52,30 | |||
| 2026-01-22 | 13F | V-Square Quantitative Management LLC | 13.800 | 0,00 | 226 | -13,13 | ||||
| 2026-02-10 | 13F | Gulf International Bank (UK) Ltd | 17.346 | 0,00 | 0 | |||||
| 2026-02-13 | 13F | Parkside Financial Bank & Trust | 333 | 86,03 | 5 | 66,67 | ||||
| 2026-02-13 | 13F | Morgan Stanley | 9.524.277 | 13,24 | 155.912 | -1,34 | ||||
| 2026-02-13 | 13F | Ieq Capital, Llc | 27.119 | -41,43 | 444 | -49,02 | ||||
| 2026-04-24 | 13F | IFM Investors Pty Ltd | 35.523 | 33,03 | 676 | |||||
| 2025-11-12 | 13F | Itau Unibanco Holding S.A. | 0 | -100,00 | 0 | |||||
| 2026-02-12 | 13F | Cibc World Markets Corp | 0 | -100,00 | 0 | |||||
| 2025-11-14 | 13F | Skopos Labs, Inc. | 0 | -100,00 | 0 | |||||
| 2026-02-06 | 13F | Tortoise Investment Management, LLC | 0 | -100,00 | 0 | |||||
| 2026-02-02 | 13F | Hussman Strategic Advisors, Inc. | 84.000 | 1.375 | ||||||
| 2026-02-10 | 13F | Connor, Clark & Lunn Investment Management Ltd. | 141.112 | 882,06 | 2.310 | 758,74 | ||||
| 2026-04-23 | 13F | Lansforsakringar Fondforvaltning AB (publ) | 78.000 | 0,00 | 1.485 | 16,38 | ||||
| 2026-04-24 | 13F | Strs Ohio | 24.042 | -6,09 | 458 | 9,07 | ||||
| 2026-02-11 | 13F | Jpmorgan Chase & Co | 434.493 | -67,00 | 7.113 | -71,25 | ||||
| 2025-11-14 | 13F | Absoluto Partners Gestao de Recursos Ltda | 0 | -100,00 | 0 | |||||
| 2026-02-17 | 13F | SageView Advisory Group, LLC | 95 | 2 | ||||||
| 2026-04-15 | 13F | Exchange Traded Concepts, Llc | 196.959 | 8,49 | 3.750 | 26,22 | ||||
| 2026-01-30 | 13F | Jennison Associates Llc | 1.738.889 | -36,88 | 28.466 | -45,01 | ||||
| 2026-02-10 | 13F | National Pension Service | 107.022 | 9,68 | 1.752 | -4,47 | ||||
| 2026-01-23 | 13F | Westside Investment Management, Inc. | 545 | 0,00 | 9 | -11,11 | ||||
| 2026-02-17 | 13F | Quantinno Capital Management LP | 144.423 | 19,94 | 2.364 | 4,51 |