Grundlæggende statistik
| Institutionelle aktier (lange) | 31.653.155 - 101,22% (ex 13D/G) - change of -3,63MM shares -10,28% MRQ |
| Institutionel værdi (lang) | $ 1.706.904 USD ($1000) |
Institutionelt ejerskab og aktionærer
V2X, Inc. (US:VVX) har 274 institutionelle ejere og aktionærer, der har indsendt 13D/G- eller 13F-formularer til Securities Exchange Commission (SEC). Disse institutioner har i alt 31,653,155 aktier. Største aktionærer omfatter Aip, Llc, Fmr Llc, BlackRock, Inc., Vanguard Group Inc, Reinhart Partners, Inc., Dimensional Fund Advisors Lp, State Street Corp, Ophir Asset Management Pty Ltd, Wellington Management Group Llp, and Victory Capital Management Inc .
V2X, Inc. (NYSE:VVX) institutionel ejerskabsstruktur viser aktuelle positioner i virksomheden efter institutioner og fonde, samt seneste ændringer i positionsstørrelse. Større aktionærer kan omfatte individuelle investorer, investeringsforeninger, hedgefonde eller institutioner. Skema 13D angiver, at investoren besidder (eller besidder) mere end 5 % af virksomheden og har til hensigt (eller har til hensigt at) aktivt at forfølge en ændring i forretningsstrategi. Skema 13G indikerer en passiv investering på over 5%.
The share price as of March 27, 2026 is 68,32 / share. Previously, on March 28, 2025, the share price was 49,55 / share. This represents an increase of 37,88% over that period.

Fondens stemningsscore
Fund Sentiment Score (fka Ownership Accumulation Score) finder de aktier, der bliver mest købt af fonde. Det er resultatet af en sofistikeret, multi-faktor kvantitativ model, der identificerer virksomheder med de højeste niveauer af institutionel akkumulering. Scoringsmodellen bruger en kombination af den samlede stigning i oplyste ejere, ændringerne i porteføljeallokeringer i disse ejere og andre målinger. Tallet går fra 0 til 100, hvor højere tal indikerer et højere niveau af akkumulering for sine jævnaldrende, og 50 er gennemsnittet.
Opdateringsfrekvens: Dagligt
Se Ownership Explorer, som giver en liste over højest rangerende virksomheder.
AI+ Ask Fintel’s AI assistant about V2X, Inc..
Select a question to share a public post with an AI-crafted answer.
Thinking of good questions…
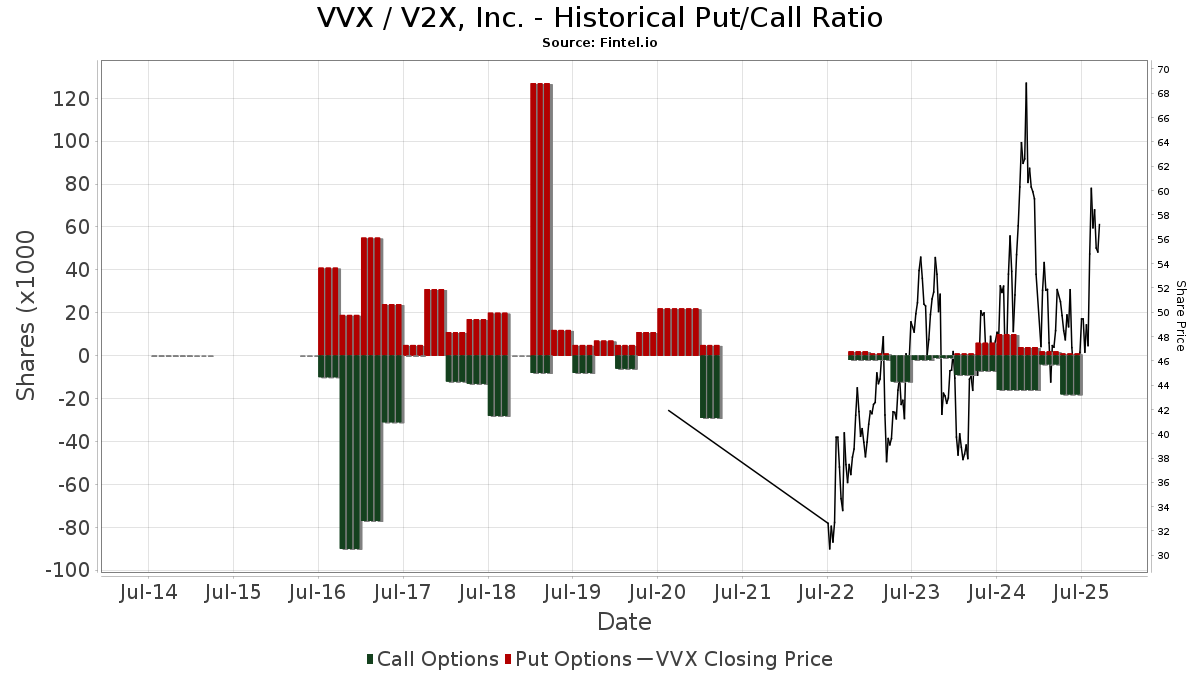
Institutionel Put/Call-forhold
Ud over at indberette standardaktie- og gældsudstedelser skal institutter med mere end 100 mill. aktiver under forvaltning også oplyse deres put- og call-optionsbeholdninger. Da salgsoptioner generelt indikerer negativ stemning, og købsoptioner indikerer positiv stemning, kan vi få en fornemmelse af den overordnede institutionelle stemning ved at plotte forholdet mellem put og kald. Diagrammet til højre viser det historiske put/call-forhold for dette instrument.
Brug af Put/Call Ratio som en indikator for investorernes stemning overvinder en af de vigtigste mangler ved at bruge totalt institutionelt ejerskab, som er, at en betydelig mængde af aktiver under forvaltning investeres passivt for at spore indekser. Passivt forvaltede fonde køber typisk ikke optioner, så indikatoren for put/call-forholdet følger mere nøje følelsen af aktivt forvaltede fonde.
13D/G-arkivering
Vi præsenterer 13D/G ansøgninger separat fra 13F ansøgninger på grund af den forskellige behandling af SEC. 13D/G-ansøgninger kan indgives af grupper af investorer (med én ledende), hvorimod 13F-ansøgninger ikke kan. Dette resulterer i situationer, hvor en investor kan indsende en 13D/G, der rapporterer én værdi for de samlede aktier (der repræsenterer alle de aktier, der ejes af investorgruppen), men derefter indsender en 13F, der rapporterer en anden værdi for de samlede aktier (der udelukkende repræsenterer deres egne) ejendomsret). Det betyder, at aktieejerskab af 13D/G-arkiver og 13F-arkiveringer ofte ikke er direkte sammenlignelige, så vi præsenterer dem separat.
Bemærk: Fra den 16. maj 2021 viser vi ikke længere ejere, der ikke har indsendt en 13D/G inden for det seneste år. Tidligere viste vi den fulde historie af 13D/G-arkiver. Generelt skal enheder, der er forpligtet til at indgive 13D/G-ansøgninger, indgive mindst årligt, før de indsender en afsluttende ansøgning. Dog forlader fonde nogle gange positioner uden at indsende en afsluttende ansøgning (dvs. de afvikler), så visning af den fulde historie resulterede nogle gange i forvirring om det nuværende ejerskab. For at undgå forvirring viser vi nu kun 'aktuelle' ejere - det vil sige - ejere, der har anmeldt inden for det seneste år.
Upgrade to unlock premium data.
| Fil dato | Form | Investor | Forrige Aktier |
Seneste Aktier |
Δ Aktier (Procent) |
Ejendomsret (Procent) |
Δ Ejerskab (Procent) |
|
|---|---|---|---|---|---|---|---|---|
| 2026-03-16 | American Industrial Partners Capital Fund VI, L.P. | 5,017,286 | 2,471,854 | -50.73 | 7.90 | -50.93 | ||
| 2025-10-17 | BlackRock, Inc. | 1,417,143 | 1,740,104 | 22.79 | 5.50 | 22.22 | ||
| 2025-05-12 | FMR LLC | 3,712,196 | 4,726,864 | 27.33 | 15.00 | 27.12 |
13F og NPORT arkivering
Detaljer om 13F-arkivering er gratis. Detaljer om NP-ansøgninger kræver et premium-medlemskab. Grønne rækker angiver nye positioner. Røde rækker angiver lukkede positioner. Klik på linket ikon for at se den fulde transaktionshistorik.
Opgrader
for at låse premium-data op og eksportere til Excel ![]() .
.
| Fil dato | Kilde | Investor | Type | Gennemsnitlig pris (Øst) |
Aktier | Δ Aktier (%) |
Rapporteret Værdi ($1000) |
Δ Værdi (%) |
Port Alloc (%) |
|
|---|---|---|---|---|---|---|---|---|---|---|
| 2026-02-02 | 13F | Strs Ohio | 10.100 | 0,00 | 551 | -6,14 | ||||
| 2026-02-17 | 13F | G2 Investment Partners Management LLC | 48.000 | 2.618 | ||||||
| 2026-02-17 | 13F | Signature Equity Partners, LLC | 136 | 7 | ||||||
| 2026-02-12 | 13F | Jane Street Group, Llc | 20.369 | 1.111 | ||||||
| 2026-02-17 | 13F | Freestone Grove Partners LP | 3.922 | 214 | ||||||
| 2026-02-13 | 13F | Aurora Investment Counsel | 33.305 | 1.817 | ||||||
| 2026-02-13 | 13F | Verition Fund Management LLC | 22.375 | 52,21 | 1.221 | 43,02 | ||||
| 2026-02-09 | 13F | Keating Financial Advisory Services, Inc. | 4 | 0 | ||||||
| 2025-11-14 | 13F | Cubist Systematic Strategies, LLC | 0 | -100,00 | 0 | -100,00 | ||||
| 2026-02-17 | 13F | Quadrature Capital Ltd | 14.189 | 774 | ||||||
| 2026-02-13 | 13F | De Lisle Partners LLP | 9.000 | 0,00 | 491 | -6,13 | ||||
| 2026-02-17 | 13F | Royal Bank Of Canada | 15.268 | -27,95 | 832 | -32,41 | ||||
| 2026-02-10 | 13F | Bnp Paribas Arbitrage, Sa | 27.716 | 95,57 | 1.512 | 83,60 | ||||
| 2025-11-14 | 13F | Numerai GP LLC | 0 | -100,00 | 0 | |||||
| 2026-01-29 | 13F | Sanctuary Advisors, LLC | 7.883 | 430 | ||||||
| 2026-02-17 | 13F | Engineers Gate Manager LP | 7.608 | -26,15 | 415 | -30,60 | ||||
| 2025-11-12 | 13F | Pitcairn Co | 0 | -100,00 | 0 | |||||
| 2026-02-11 | 13F | Empowered Funds, LLC | 144.008 | 10,84 | 7.856 | 4,08 | ||||
| 2026-01-20 | 13F | Signaturefd, Llc | 140 | 0,00 | 8 | -12,50 | ||||
| 2026-02-17 | 13F | ExodusPoint Capital Management, LP | 0 | -100,00 | 0 | -100,00 | ||||
| 2026-02-06 | 13F | HighTower Advisors, LLC | 11.875 | 648 | ||||||
| 2026-02-17 | 13F | Capstone Investment Advisors, Llc | 0 | -100,00 | 0 | -100,00 | ||||
| 2026-02-17 | 13F | Zimmer Partners, LP | 90.077 | 4.914 | ||||||
| 2025-10-24 | 13F | Hemington Wealth Management | 8 | 0,00 | 0 | |||||
| 2026-02-12 | 13F | BlackRock, Inc. | 2.251.582 | 7,81 | 122.824 | 1,24 | ||||
| 2026-01-21 | 13F | Capital Advisors, Ltd. LLC | 27 | 0,00 | 0 | |||||
| 2026-02-17 | 13F | Jones Financial Companies Lllp | 3.334 | 531,44 | 182 | 546,43 | ||||
| 2025-11-04 | 13F | Delta Asset Management Llc/tn | 0 | -100,00 | 0 | |||||
| 2026-02-10 | 13F | Globeflex Capital L P | 36.530 | 0,10 | 1.993 | -5,99 | ||||
| 2026-02-05 | 13F | Abacus Wealth Partners, LLC | 4.203 | 229 | ||||||
| 2026-02-17 | 13F | Ameriprise Financial Inc | 40.495 | 2.209 | ||||||
| 2026-02-13 | 13F | Arrowstreet Capital, Limited Partnership | 0 | -100,00 | 0 | |||||
| 2025-12-09 | 13F/A | Tudor Investment Corp Et Al | 25.171 | 1.462 | ||||||
| 2026-02-09 | 13F | Quest Partners LLC | 11.717 | 47,77 | 639 | 38,91 | ||||
| 2025-10-30 | 13F | Cornerstone Wealth Group, LLC | 0 | -100,00 | 0 | |||||
| 2026-02-06 | 13F | EverSource Wealth Advisors, LLC | 322 | 1,26 | 18 | -5,56 | ||||
| 2026-02-17 | 13F | Northern Trust Corp | 190.675 | 5,36 | 10.401 | -1,06 | ||||
| 2026-01-29 | 13F | UBS Group AG | 108.343 | 118,17 | 5.910 | 104,92 | ||||
| 2025-09-29 | NP | RIVSX - River Oak Discovery Fund | 15.768 | 0,00 | 747 | -4,72 | ||||
| 2026-02-03 | 13F | Ethic Inc. | 19.323 | 7,50 | 1.054 | 0,96 | ||||
| 2026-01-08 | 13F | Armstrong Advisory Group, Inc | 47 | 0,00 | 3 | 0,00 | ||||
| 2026-02-13 | 13F | Caitong International Asset Management Co., Ltd | 348 | 18,37 | 19 | 5,88 | ||||
| 2026-02-02 | 13F | Oppenheimer Asset Management Inc. | 15.010 | 35,35 | 819 | 27,02 | ||||
| 2026-02-13 | 13F | Squarepoint Ops LLC | 41.006 | -20,68 | 2.237 | -25,52 | ||||
| 2026-02-02 | 13F | Danske Bank A/s | 1.825 | 100 | ||||||
| 2026-02-13 | 13F | JustInvest LLC | 4.195 | 2,02 | 229 | -4,60 | ||||
| 2026-02-13 | 13F | Smartleaf Asset Management LLC | 368 | 1.944,44 | 20 | 1.900,00 | ||||
| 2026-02-02 | 13F | Seizert Capital Partners, Llc | 4.229 | 0,00 | 231 | -6,12 | ||||
| 2025-10-15 | 13F | Chesapeake Asset Management Llc | 0 | -100,00 | 0 | -100,00 | ||||
| 2026-02-11 | 13F | LPL Financial LLC | 10.959 | 185,54 | 598 | 168,92 | ||||
| 2026-02-13 | 13F | MAI Capital Management | 5 | 0 | ||||||
| 2026-02-04 | 13F | Versor Investments LP | 7.216 | -44,19 | 394 | -47,67 | ||||
| 2026-02-13 | 13F | Wells Fargo & Company/mn | 79.174 | 12,37 | 4.319 | 5,52 | ||||
| 2026-01-29 | 13F | Quent Capital, LLC | 12 | 0,00 | 1 | |||||
| 2026-01-12 | 13F | Salem Investment Counselors Inc | 16.804 | 15,82 | 917 | 8,79 | ||||
| 2026-01-28 | 13F | Barrett & Company, Inc. | 49 | 0,00 | 3 | 0,00 | ||||
| 2026-02-11 | 13F | Janney Montgomery Scott LLC | 48.915 | 25,54 | 3 | 0,00 | ||||
| 2026-02-12 | 13F | DRW Securities, LLC | 0 | -100,00 | 0 | |||||
| 2026-02-13 | 13F | Morgan Stanley | 248.578 | 20,86 | 13.560 | 13,50 | ||||
| 2026-01-20 | 13F | Harbor Capital Advisors, Inc. | 32.432 | 41,02 | 2 | 0,00 | ||||
| 2026-02-02 | 13F | Principal Financial Group Inc | 31.707 | 45,97 | 1.730 | 37,11 | ||||
| 2026-02-13 | 13F | Prospector Partners Llc | 0 | -100,00 | 0 | |||||
| 2026-02-04 | 13F | Ameritas Advisory Services, LLC | 0 | -100,00 | 0 | |||||
| 2026-01-05 | 13F | Burkett Financial Services, Llc | 13 | 1 | ||||||
| 2026-02-09 | 13F | Royce & Associates Lp | 131.750 | -38,85 | 7.187 | -42,58 | ||||
| 2026-02-11 | 13F | Los Angeles Capital Management Llc | 21.255 | 87,68 | 1.212 | 84,32 | ||||
| 2026-02-17 | 13F | Janus Henderson Group Plc | 12.110 | 57,07 | 661 | 47,65 | ||||
| 2026-01-29 | 13F | Comerica Bank | 465 | -3,12 | 25 | -7,41 | ||||
| 2026-02-12 | 13F | Renaissance Technologies Llc | 0 | -100,00 | 0 | |||||
| 2026-02-13 | 13F | Ieq Capital, Llc | 8.991 | 490 | ||||||
| 2026-02-17 | 13F | Edmond De Rothschild Holding S.a. | 42.158 | 19,96 | 2.300 | 12,64 | ||||
| 2026-01-29 | 13F | St Germain D J Co Inc | 12 | 0,00 | 1 | |||||
| 2026-02-06 | 13F | Bastion Asset Management Inc. | 149.670 | 25,36 | 8.225 | 20,78 | ||||
| 2026-02-13 | 13F | Rhumbline Advisers | 30.233 | -1,59 | 1.649 | -7,57 | ||||
| 2026-01-30 | 13F | Torren Management, LLC | 165 | 9 | ||||||
| 2025-10-30 | 13F | Twin Peaks Wealth Advisors, LLC | 0 | -100,00 | 0 | |||||
| 2026-01-28 | 13F | Arizona State Retirement System | 6.621 | 8,65 | 361 | 1,98 | ||||
| 2026-02-18 | 13F | EP Wealth Advisors, Inc. | 4.395 | -0,70 | 240 | 11,68 | ||||
| 2026-01-09 | 13F | SG Americas Securities, LLC | 18.939 | 360,02 | 1 | |||||
| 2026-02-12 | 13F | Dimensional Fund Advisors Lp | 1.333.727 | 6,60 | 72.756 | 0,11 | ||||
| 2026-02-18 | 13F | State of Tennessee, Treasury Department | 4.877 | -4,93 | 336 | 12,42 | ||||
| 2026-02-17 | 13F | Citadel Advisors Llc | Call | 16.100 | 85,06 | 878 | 73,86 | |||
| 2026-02-17 | 13F | Citadel Advisors Llc | 624.920 | 106,32 | 34.089 | 93,75 | ||||
| 2026-02-03 | 13F | Legacy Wealth Managment, LLC/ID | 0 | -100,00 | 0 | |||||
| 2026-02-17 | 13F | Lazard Asset Management Llc | 37.665 | -8,54 | 2.055 | -14,13 | ||||
| 2026-02-17 | 13F | D. E. Shaw & Co., Inc. | 221.162 | 76,62 | 12.064 | 65,85 | ||||
| 2026-01-21 | 13F | SJS Investment Consulting Inc. | 1 | 0 | ||||||
| 2026-01-27 | 13F | GHP Investment Advisors, Inc. | 11 | 0,00 | 1 | |||||
| 2026-01-29 | 13F | James Investment Research Inc | 7.334 | 0,00 | 400 | -6,10 | ||||
| 2026-02-12 | 13F | Nuveen, LLC | 446.678 | -0,78 | 24.366 | -6,82 | ||||
| 2026-02-13 | 13F | Manufacturers Life Insurance Company, The | 0 | -100,00 | 0 | |||||
| 2026-02-10 | 13F | Cornerstone Select Advisors, LLC | 4.812 | -1,19 | 262 | -7,09 | ||||
| 2026-02-12 | 13F | Principal Securities, Inc. | 0 | -100,00 | 0 | |||||
| 2026-02-13 | 13F | Great West Life Assurance Co /can/ | 3.742 | -81,40 | 0 | -100,00 | ||||
| 2026-01-08 | 13F | True Wealth Design, LLC | 25 | 66,67 | 1 | |||||
| 2026-02-06 | 13F | Global Retirement Partners, LLC | 1 | 0,00 | 0 | |||||
| 2026-02-05 | 13F | Bessemer Group Inc | 117 | 277,42 | 0 | |||||
| 2026-01-14 | 13F | Hennion & Walsh Asset Management, Inc. | 55.721 | 2,24 | 3.040 | -3,98 | ||||
| 2026-01-30 | 13F | New York State Teachers Retirement System | 1.762 | 16,61 | 0 | |||||
| 2026-02-12 | 13F | MetLife Investment Management, LLC | 12.781 | 13,21 | 697 | 6,41 | ||||
| 2026-02-13 | 13F | Boston Partners | 554.274 | 0,19 | 30.245 | -5,89 | ||||
| 2026-02-17 | 13F | Jump Financial, LLC | 0 | -100,00 | 0 | |||||
| 2026-02-11 | 13F | Cerity Partners LLC | 4.458 | 243 | ||||||
| 2026-02-13 | 13F | Police & Firemen's Retirement System of New Jersey | 5.818 | 11,84 | 317 | 4,97 | ||||
| 2026-02-14 | 13F | Whipplewood Advisors, LLC | 24 | 0,00 | 1 | 0,00 | ||||
| 2026-02-13 | 13F | Sei Investments Co | 93.538 | 29,17 | 5.102 | 21,30 | ||||
| 2026-01-29 | 13F | Vanguard Group Inc | 1.434.711 | 20,61 | 78.263 | 13,26 | ||||
| 2026-02-09 | 13F | Systematic Financial Management Lp | 429.002 | 3,65 | 23.402 | -2,67 | ||||
| 2026-02-13 | 13F | Jacobs Levy Equity Management, Inc | 18.270 | 997 | ||||||
| 2026-02-13 | 13F | Quarry LP | 24 | 1 | ||||||
| 2026-01-30 | 13F | Us Bancorp \de\ | 396 | -17,84 | 22 | -22,22 | ||||
| 2026-02-17 | 13F | SageView Advisory Group, LLC | 5 | 0 | ||||||
| 2025-11-14 | 13F | Point72 Asset Management, L.P. | 0 | -100,00 | 0 | |||||
| 2026-02-11 | 13F | Group One Trading, L.p. | 0 | -100,00 | 0 | |||||
| 2026-02-17 | 13F | Alliancebernstein L.p. | 52.085 | 30,64 | 2.841 | 22,67 | ||||
| 2026-02-13 | 13F | Schroder Investment Management Group | 307.296 | -2,73 | 16.987 | -4,52 | ||||
| 2026-02-17 | 13F | Price T Rowe Associates Inc /md/ | 21.285 | 18,84 | 1 | 0,00 | ||||
| 2026-02-12 | 13F | Earnest Partners Llc | 117.761 | -4,69 | 6.424 | -10,51 | ||||
| 2026-02-02 | 13F | Highland Capital Management, Llc | 5.176 | -11,19 | 282 | -16,57 | ||||
| 2026-02-12 | 13F | Moneta Group Investment Advisors Llc | 28.160 | -45,77 | 1.536 | -49,07 | ||||
| 2026-02-13 | 13F | Aip, Llc | 5.017.286 | -40,75 | 273.693 | -44,36 | ||||
| 2025-11-14 | 13F | Pentwater Capital Management LP | 0 | -100,00 | 0 | -100,00 | ||||
| 2026-02-10 | 13F | Acadian Asset Management Llc | 0 | -100,00 | 0 | |||||
| 2025-11-14 | 13F | Pentwater Capital Management LP | Put | 0 | -100,00 | 0 | -100,00 | |||
| 2026-01-13 | 13F | Matrix Trust Co | 324 | -1,52 | 0 | |||||
| 2026-02-11 | 13F | Ameritas Investment Partners, Inc. | 1.757 | 96 | ||||||
| 2026-01-23 | 13F | Financial Connections Group, Inc. | 6 | 0,00 | 0 | |||||
| 2026-02-06 | 13F | Legato Capital Management LLC | 8.309 | 453 | ||||||
| 2026-02-06 | 13F | Covestor Ltd | 183 | -8,96 | 0 | |||||
| 2026-02-09 | 13F | Hartland & Co., LLC | 1 | 0 | ||||||
| 2026-02-19 | 13F | Invesco Ltd. | 249.786 | -6,17 | 13.626 | -11,89 | ||||
| 2026-02-13 | 13F | American Century Companies Inc | 42.689 | 11,78 | 2.329 | 4,96 | ||||
| 2026-02-12 | 13F | New York State Common Retirement Fund | 6.932 | 17,55 | 378 | 10,53 | ||||
| 2026-02-13 | 13F | Marshall Wace, Llp | 60.315 | 3.290 | ||||||
| 2026-02-17 | 13F | Bridgeway Capital Management Inc | 258.594 | 5,76 | 14.106 | -0,68 | ||||
| 2026-02-17 | 13F | Quantinno Capital Management LP | 6.059 | 331 | ||||||
| 2026-02-17 | 13F | Boothbay Fund Management, Llc | 11.395 | 622 | ||||||
| 2025-09-29 | NP | KCXIX - Knights of Columbus U.S. All Cap Index Fund I Shares | 76 | 7,04 | 4 | 0,00 | ||||
| 2026-02-17 | 13F | LuminArx Capital Management LP | 10.000 | 546 | ||||||
| 2026-02-10 | 13F | MidAtlantic Capital Management, Inc. | 12 | 1 | ||||||
| 2025-11-12 | 13F | Aster Capital Management (DIFC) Ltd | 0 | -100,00 | 0 | -100,00 | ||||
| 2026-02-10 | 13F | Seven Grand Managers, Llc | 100.000 | 0,00 | 5.455 | -6,09 | ||||
| 2026-02-17 | 13F | Optiver Holding B.V. | 0 | -100,00 | 0 | -100,00 | ||||
| 2026-02-13 | 13F | BNP Paribas Asset Management Holding S.A. | 452 | 59,15 | 0 | |||||
| 2025-11-13 | 13F | Vestcor Inc | 0 | -100,00 | 0 | |||||
| 2026-02-18 | 13F | Mackenzie Financial Corp | 18.378 | 24,10 | 1.014 | 17,79 | ||||
| 2026-02-13 | 13F | Parkside Financial Bank & Trust | 21 | 0,00 | 1 | 0,00 | ||||
| 2026-02-10 | 13F | State of Wyoming | 2.409 | 131 | ||||||
| 2026-02-13 | 13F | Y-Intercept (Hong Kong) Ltd | 4.568 | 249 | ||||||
| 2026-01-05 | 13F | GAMMA Investing LLC | 174 | 107,14 | 9 | 125,00 | ||||
| 2026-02-17 | 13F | Cetera Investment Advisers | 19.057 | 17,27 | 1.040 | 10,06 | ||||
| 2026-02-09 | 13F | Fisher Asset Management, LLC | 200.016 | -6,39 | 10.911 | -12,10 | ||||
| 2026-02-24 | 13F/A | Pacer Advisors, Inc. | 132.506 | -5,82 | 7.228 | -11,55 | ||||
| 2025-10-09 | 13F | Voya Investment Management Llc | 0 | -100,00 | 0 | |||||
| 2026-02-13 | 13F | Ubs Asset Management Americas Inc | 44.813 | 8,25 | 2.445 | 1,66 | ||||
| 2026-02-13 | 13F | Pinnacle Wealth Planning Services, Inc. | 4 | 0 | ||||||
| 2026-02-17 | 13F | Millennium Management Llc | 23.448 | -71,91 | 1.279 | -73,62 | ||||
| 2026-02-13 | 13F | Sterling Capital Management LLC | 1.236 | -0,24 | 67 | -5,63 | ||||
| 2025-11-14 | 13F | Two Sigma Advisers, Lp | 0 | -100,00 | 0 | -100,00 | ||||
| 2025-11-14 | 13F | Point72 (DIFC) Ltd | 0 | -100,00 | 0 | -100,00 | ||||
| 2026-02-05 | 13F | Allworth Financial LP | 499 | 15,78 | 27 | 8,00 | ||||
| 2026-02-09 | 13F | Legal & General Group Plc | 39.881 | -2,77 | 2.176 | -8,69 | ||||
| 2026-02-11 | 13F | J.Safra Asset Management Corp | 78 | 9,86 | 4 | 0,00 | ||||
| 2026-02-17 | 13F | MIRAE ASSET GLOBAL ETFS HOLDINGS Ltd. | 10.711 | 19,08 | 584 | 11,88 | ||||
| 2026-02-13 | 13F | Martingale Asset Management L P | 46.832 | 12,64 | 2.555 | 5,76 | ||||
| 2026-02-17 | 13F | Advisor Group Holdings, Inc. | 2.073 | 46,71 | 113 | 39,51 | ||||
| 2026-01-07 | 13F | Massmutual Trust Co Fsb/adv | 90 | 9,76 | 5 | 0,00 | ||||
| 2025-09-29 | NP | SUNAMERICA SERIES TRUST - SA Small Cap Index Portfolio Class 1 | 1.911 | 1,06 | 91 | -4,26 | ||||
| 2026-02-12 | 13F | Federated Hermes, Inc. | 167.982 | 82,08 | 9.163 | 70,98 | ||||
| 2026-01-23 | 13F | Farther Finance Advisors, LLC | 387 | 279,41 | 21 | 320,00 | ||||
| 2026-02-27 | 13F | Strategic Investment Solutions, Inc. /IL | 100 | 0,00 | 5 | 0,00 | ||||
| 2025-09-29 | NP | YOVAX - YORKTOWN SMALL-CAP FUND Class A | 5.400 | 54,29 | 256 | 46,55 | ||||
| 2026-02-12 | 13F | Loomis Sayles & Co L P | 280.518 | 3,46 | 15.302 | -2,84 | ||||
| 2026-02-17 | 13F | Bank Of America Corp /de/ | 408.939 | -12,41 | 22.308 | -17,75 | ||||
| 2026-02-13 | 13F | Victory Capital Management Inc | 745.763 | -1,00 | 40.681 | -7,03 | ||||
| 2026-02-17 | 13F | Canada Pension Plan Investment Board | 6.600 | 500,00 | 360 | 471,43 | ||||
| 2026-02-05 | 13F | Gabelli Funds Llc | 8.500 | 0,00 | 464 | -6,09 | ||||
| 2026-01-26 | 13F | Lakewood Asset Management LLC | 6.701 | 7,91 | 366 | 1,39 | ||||
| 2026-02-03 | 13F | SBI Securities Co., Ltd. | 15 | -80,00 | 1 | -100,00 | ||||
| 2026-02-17 | 13F | State Of Wisconsin Investment Board | 32.490 | -1,49 | 1.772 | -7,47 | ||||
| 2026-02-05 | 13F | Cambridge Investment Research Advisors, Inc. | 18.774 | 1 | ||||||
| 2026-02-09 | 13F | William Blair Investment Management, Llc | 470.846 | 25.685 | ||||||
| 2026-02-13 | 13F | Rice Hall James & Associates, Llc | 41.234 | -0,26 | 2.249 | -6,33 | ||||
| 2026-02-13 | 13F | Glen Eagle Advisors, LLC | 40 | 0,00 | 2 | 0,00 | ||||
| 2026-02-17 | 13F | Man Group plc | 16.200 | 267,76 | 884 | 246,27 | ||||
| 2026-02-10 | 13F | Hillsdale Investment Management Inc. | 100 | 0,00 | 5 | 0,00 | ||||
| 2026-01-26 | 13F | Cwm, Llc | 3.242 | 212,63 | 0 | |||||
| 2026-03-06 | 13F | Hsbc Holdings Plc | 9.091 | -48,28 | 496 | -51,08 | ||||
| 2026-02-06 | 13F | Pnc Financial Services Group, Inc. | 3.986 | 4,32 | 217 | -1,81 | ||||
| 2026-02-02 | 13F | CX Institutional | 472 | 0,00 | 0 | |||||
| 2026-02-17 | 13F | Mirabella Financial Services Llp | 5.261 | 287 | ||||||
| 2025-09-29 | NP | CALF - Pacer US Small Cap Cash Cows 100 ETF | 138.782 | -10,66 | 6.575 | -14,93 | ||||
| 2026-02-10 | 13F | Quantbot Technologies LP | 8.626 | 471 | ||||||
| 2025-10-30 | 13F | Teacher Retirement System Of Texas | 0 | -100,00 | 0 | |||||
| 2026-02-13 | 13F | Charles Schwab Investment Management Inc | 262.892 | 11,82 | 14.341 | 5,00 | ||||
| 2026-02-11 | 13F | First Command Advisory Services, Inc. | 13 | 1 | ||||||
| 2026-02-13 | 13F | Barclays Plc | 100.485 | -21,34 | 5.481 | -26,13 | ||||
| 2026-01-28 | 13F | Klp Kapitalforvaltning As | 12.400 | 3,33 | 676 | -3,01 | ||||
| 2026-01-29 | 13F | Polaris Capital Management, LLC | 33.800 | 0,00 | 1.844 | -6,11 | ||||
| 2026-02-13 | 13F | Mariner, LLC | 12.353 | 15,13 | 674 | 8,03 | ||||
| 2026-02-17 | 13F | New Vernon Capital Holdings II LLC | 0 | -100,00 | 0 | -100,00 | ||||
| 2026-02-12 | 13F | Swiss National Bank | 46.700 | 17,04 | 2.547 | 9,93 | ||||
| 2026-02-17 | 13F | Fmr Llc | 4.730.262 | 1,01 | 258.036 | -5,14 | ||||
| 2025-11-07 | 13F | Shell Asset Management Co | 1.622 | -59,65 | 0 | |||||
| 2026-02-10 | 13F | Exit Wealth Advisors, LLC. | 22.761 | 1.242 | ||||||
| 2026-02-17 | 13F | Qube Research & Technologies Ltd | 104.034 | -38,83 | 5.675 | -42,55 | ||||
| 2026-01-15 | 13F | Nisa Investment Advisors, Llc | 226 | 0,00 | 12 | -7,69 | ||||
| 2026-02-11 | 13F | CenterBook Partners LP | 0 | -100,00 | 0 | -100,00 | ||||
| 2026-02-12 | 13F | Integrated Quantitative Investments LLC | 27.988 | 1.527 | ||||||
| 2026-01-23 | 13F | State of Alaska, Department of Revenue | 1.817 | 0,00 | 0 | |||||
| 2026-02-10 | 13F | Ellevest, Inc. | 6.020 | -5,91 | 328 | -11,59 | ||||
| 2026-02-17 | 13F | Lighthouse Investment Partners, LLC | 6.631 | 362 | ||||||
| 2026-02-17 | 13F | Covalis Capital Llp | 23.684 | 1.292 | ||||||
| 2026-02-13 | 13F | Toroso Investments, LLC | 0 | -100,00 | 0 | |||||
| 2026-02-13 | 13F | Virtus ETF Advisers LLC | 17.295 | 0,00 | 943 | -6,08 | ||||
| 2026-02-17 | 13F | Cooper Creek Partners Management Llc | 66.252 | 4 | ||||||
| 2026-02-10 | 13F | Goldman Sachs Group Inc | 225.117 | -13,80 | 12.280 | -19,06 | ||||
| 2026-02-17 | 13F | Jain Global LLC | 0 | -100,00 | 0 | |||||
| 2026-01-30 | 13F | North Star Investment Management Corp. | 13.000 | 0,00 | 709 | -6,09 | ||||
| 2026-02-17 | 13F | Public Employees Retirement System Of Ohio | 292 | -27,00 | 16 | -34,78 | ||||
| 2026-01-08 | 13F | Versant Capital Management, Inc | 89 | 0,00 | 5 | -20,00 | ||||
| 2026-02-04 | 13F | LRI Investments, LLC | 1.933 | 95,45 | 105 | 84,21 | ||||
| 2025-10-07 | 13F/A | Ransom Advisory, Ltd | 0 | -100,00 | 0 | |||||
| 2025-11-14 | 13F | Aigen Investment Management, Lp | 0 | -100,00 | 0 | -100,00 | ||||
| 2026-02-17 | 13F | Bayesian Capital Management, LP | 0 | -100,00 | 0 | -100,00 | ||||
| 2026-02-17 | 13F | Polymer Capital Management (US) LLC | 5.555 | 303 | ||||||
| 2026-02-09 | 13F | Jackson Creek Investment Advisors LLC | 7.404 | 0 | ||||||
| 2026-02-12 | 13F | Quadrant Capital Group Llc | 23 | 0,00 | 1 | 0,00 | ||||
| 2026-02-06 | 13F | Addison Advisors LLC | 7 | 0,00 | 0 | |||||
| 2026-02-13 | 13F | Kennedy Capital Management, Inc. | 158.093 | -0,13 | 8.624 | -6,22 | ||||
| 2026-02-17 | 13F | Balyasny Asset Management Llc | 84.380 | 55,11 | 4.603 | 45,63 | ||||
| 2026-02-17 | 13F | Tower Research Capital LLC (TRC) | 1.734 | -37,17 | 95 | -41,25 | ||||
| 2026-02-06 | 13F | IFP Advisors, Inc | 73 | 508,33 | 4 | -40,00 | ||||
| 2026-02-06 | 13F | Larson Financial Group LLC | 793 | 4,48 | 43 | -2,27 | ||||
| 2025-09-29 | NP | PRFZ - Invesco FTSE RAFI US 1500 Small-Mid ETF This fund is a listed as child fund of Invesco Ltd. and if that institution has disclosed ownership in this security, then these positions will not be double counted when calculating total shares and total value | 29.913 | 3,03 | 1.417 | -1,87 | ||||
| 2026-02-12 | 13F | Oak Associates Ltd /oh/ | 16.252 | -4,69 | 887 | |||||
| 2026-02-12 | 13F | Steward Partners Investment Advisory, Llc | 87 | 0,00 | 5 | -20,00 | ||||
| 2026-02-13 | 13F | Rafferty Asset Management, LLC | 4.712 | -5,76 | 257 | -11,38 | ||||
| 2026-02-13 | 13F | Stifel Financial Corp | 4.644 | -11,31 | 253 | -16,78 | ||||
| 2026-02-17 | 13F | Hilltop Holdings Inc. | 11.894 | 649 | ||||||
| 2026-02-09 | 13F | Smithfield Trust Co | 22 | 0,00 | 0 | |||||
| 2026-01-27 | 13F | Zurcher Kantonalbank (Zurich Cantonalbank) | 4.607 | -69,90 | 251 | -71,77 | ||||
| 2026-02-17 | 13F | Voloridge Investment Management, Llc | 36.406 | 78,69 | 1.986 | 67,79 | ||||
| 2026-02-09 | 13F | Geode Capital Management, Llc | 518.487 | 11,27 | 28.288 | 4,50 | ||||
| 2026-02-12 | 13F | Brinker Capital Investments, LLC | 30.484 | 1,36 | 1.663 | -4,87 | ||||
| 2026-02-13 | 13F | Soros Fund Management Llc | 92.800 | -13,19 | 5.062 | -18,47 | ||||
| 2026-02-17 | 13F | Gotham Asset Management, LLC | 16.323 | -39,41 | 890 | -43,09 | ||||
| 2026-02-03 | 13F | Harel Insurance Investments & Financial Services Ltd. | 4.195 | -13,43 | 0 | |||||
| 2026-02-05 | 13F | Amalgamated Bank | 726 | 26,70 | 0 | |||||
| 2026-02-10 | 13F | Rothschild Investment Llc | 60 | 50,00 | 3 | 50,00 | ||||
| 2026-02-17 | 13F | Aqr Capital Management Llc | 126.211 | 54,42 | 6.885 | 45,02 | ||||
| 2026-02-17 | 13F | Russell Investments Group, Ltd. | 198.788 | 15,30 | 10.844 | 8,27 | ||||
| 2026-02-17 | 13F | Wiley Bros.-aintree Capital, Llc | 14.549 | 37,44 | 794 | 29,15 | ||||
| 2026-02-17 | 13F | XTX Topco Ltd | 5.782 | 315 | ||||||
| 2026-02-06 | 13F | BOK Financial Private Wealth, Inc. | 4.463 | 0,00 | 243 | -6,18 | ||||
| 2026-02-11 | 13F | Jpmorgan Chase & Co | 87.789 | -6,70 | 4.789 | -12,39 | ||||
| 2026-02-13 | 13F | First Trust Advisors Lp | 28.093 | -4,18 | 1.532 | -10,04 | ||||
| 2025-09-29 | NP | RSSL - Global X Russell 2000 ETF | 8.782 | -12,87 | 416 | -16,97 | ||||
| 2026-01-15 | 13F | Allspring Global Investments Holdings, LLC | 206.747 | 1.157,20 | 11.487 | 1.102,72 | ||||
| 2026-02-13 | 13F | Prudential Financial Inc | 50.146 | -6,93 | 2.735 | -12,59 | ||||
| 2026-02-12 | 13F | EntryPoint Capital, LLC | 7.263 | 20,45 | 396 | 13,14 | ||||
| 2026-02-13 | 13F | Pitcairn Wealth Advisors LLC | 36.149 | 1.972 | ||||||
| 2026-01-09 | 13F | Assenagon Asset Management S.A. | 15.278 | -65,65 | 833 | -67,75 | ||||
| 2026-02-11 | 13F | Prestige Wealth Management Group LLC | 33 | 0,00 | 2 | 0,00 | ||||
| 2026-02-13 | 13F | Bullseye Asset Management LLC | 57.100 | 0,00 | 3 | 0,00 | ||||
| 2026-02-12 | 13F | McMillan Office, Inc. | 8 | 0 | ||||||
| 2026-02-17 | 13F | Aquatic Capital Management LLC | 8.507 | -40,03 | 464 | -43,69 | ||||
| 2026-02-13 | 13F | SRS Capital Advisors, Inc. | 410 | -59,65 | 22 | -62,71 | ||||
| 2026-02-13 | 13F | Mml Investors Services, Llc | 5.325 | 290 | ||||||
| 2026-02-17 | 13F | Two Sigma Investments, Lp | 4.600 | -76,70 | 251 | -78,18 | ||||
| 2025-09-29 | NP | DFEN - Direxion Daily Aerospace & Defense Bull 3X Shares | 3.140 | 14,39 | 149 | 8,82 | ||||
| 2026-02-17 | 13F | Ancora Advisors, LLC | 99.833 | 28,31 | 5.446 | 20,49 | ||||
| 2026-02-11 | 13F | CLARET ASSET MANAGEMENT Corp | 7.615 | -14,10 | 0 | |||||
| 2026-02-17 | 13F | Raymond James Financial Inc | 32.638 | 61,11 | 1.780 | 51,36 | ||||
| 2026-02-20 | 13F | Sunbelt Securities, Inc. | 7 | 250,00 | 0 | |||||
| 2026-02-13 | 13F | Citigroup Inc | 17.711 | -1,01 | 966 | -7,03 | ||||
| 2026-02-18 | 13F | Vident Advisory, LLC | 10.778 | 2,48 | 588 | -3,77 | ||||
| 2026-01-28 | 13F | Universal- Beteiligungs- und Servicegesellschaft mbH | 6.888 | 0,00 | 376 | -6,25 | ||||
| 2026-02-06 | 13F | ProShare Advisors LLC | 4.223 | 230 | ||||||
| 2026-02-11 | 13F | Deutsche Bank Ag\ | 17.442 | 37,21 | 951 | 28,86 | ||||
| 2026-01-29 | 13F | Ashton Thomas Private Wealth, LLC | 7.389 | 3,88 | 403 | -2,42 | ||||
| 2026-01-23 | 13F | Private Wealth Management Group, LLC | 41 | 0,00 | 2 | 0,00 | ||||
| 2026-02-17 | 13F | Susquehanna Portfolio Strategies, LLC | 8.104 | 0,00 | 442 | -5,96 | ||||
| 2026-01-16 | 13F | Kendall Capital Management | 31.115 | 45,33 | 1.697 | 36,52 | ||||
| 2026-02-17 | 13F | Prelude Capital Management, Llc | 3.880 | 212 | ||||||
| 2026-02-10 | 13F | Envestnet Asset Management Inc | 114.119 | 13,82 | 6.225 | 6,89 | ||||
| 2026-02-13 | 13F | Diametric Capital, LP | 11.359 | 620 | ||||||
| 2026-02-17 | 13F | Dark Forest Capital Management Lp | 8.207 | 448 | ||||||
| 2026-02-03 | 13F | Costello Asset Management, INC | 10 | 0,00 | 1 | |||||
| 2026-02-17 | 13F | Advisory Services Network, LLC | 0 | -100,00 | 0 | |||||
| 2026-02-17 | 13F | California State Teachers Retirement System | 22.239 | 17,06 | 1.213 | 9,97 | ||||
| 2026-01-08 | 13F | Tompkins Financial Corp | 19 | 1.800,00 | 1 | |||||
| 2026-01-28 | 13F | Peregrine Capital Management Llc | 92.569 | -4,69 | 5.050 | -10,51 | ||||
| 2026-02-10 | 13F | Bank of New York Mellon Corp | 93.036 | 16,47 | 5.075 | 9,38 | ||||
| 2026-02-17 | 13F | Ophir Asset Management Pty Ltd | 912.274 | 10,94 | 49.765 | 4,18 | ||||
| 2026-02-17 | 13F | Wellington Management Group Llp | 871.143 | 8,42 | 47.521 | 1,81 | ||||
| 2026-02-11 | 13F | Franklin Resources Inc | 112.692 | 17,31 | 6.147 | 10,16 | ||||
| 2025-11-24 | 13F | Penn Capital Management Co Inc | 0 | -100,00 | 0 | |||||
| 2026-02-13 | 13F | Walleye Capital LLC | 0 | -100,00 | 0 | |||||
| 2026-02-14 | 13F | Rockefeller Capital Management L.P. | 1.025 | -2,84 | 56 | -9,84 | ||||
| 2026-02-12 | 13F | Federation des caisses Desjardins du Quebec | 250 | 0,00 | 14 | -7,14 | ||||
| 2026-02-06 | 13F | Prescott Group Capital Management, L.l.c. | 99.705 | 0,00 | 5.439 | -6,10 | ||||
| 2026-02-10 | 13F | Reinhart Partners, Inc. | 1.429.211 | 60,59 | 77.964 | 50,80 | ||||
| 2026-02-13 | 13F | State Street Corp | 1.192.058 | 23,62 | 65.027 | 16,09 | ||||
| 2026-02-17 | 13F | Manatuck Hill Partners, LLC | 40.000 | 0,00 | 2.182 | -6,07 | ||||
| 2026-01-23 | 13F | Yorktown Management & Research Co Inc | 5.400 | 0,00 | 295 | -6,07 | ||||
| 2026-02-09 | 13F | Coldstream Capital Management Inc | 5.244 | -22,31 | 286 | -27,04 | ||||
| 2026-02-10 | 13F | ESL Trust Services, LLC | 22 | 0,00 | 1 | 0,00 | ||||
| 2026-02-11 | 13F | Winton Capital Group Ltd | 0 | -100,00 | 0 | |||||
| 2026-02-17 | 13F | Algert Global Llc | 53.730 | 3 | ||||||
| 2026-02-13 | 13F | C M Bidwell & Associates Ltd | 15 | 1 | ||||||
| 2026-02-17 | 13F | Susquehanna International Group, Llp | 39.087 | 43,96 | 2.132 | 35,19 | ||||
| 2025-10-16 | 13F | Signature Resources Capital Management, LLC | 0 | -100,00 | 0 | |||||
| 2026-02-12 | 13F | Campbell & CO Investment Adviser LLC | 6.633 | 362 | ||||||
| 2026-02-17 | 13F | Susquehanna International Group, Llp | Call | 4.900 | -58,47 | 267 | -61,02 | |||
| 2025-11-14 | 13F | Ghisallo Capital Management LLC | 0 | -100,00 | 0 | -100,00 | ||||
| 2026-02-11 | 13F | Simplex Trading, Llc | 0 | -100,00 | 0 | |||||
| 2026-02-10 | 13F | Intech Investment Management Llc | 7.755 | 0,00 | 423 | -6,00 | ||||
| 2026-02-17 | 13F | Susquehanna Fundamental Investments, Llc | 27.421 | 175,28 | 1.496 | 158,65 |
Other Listings
| DE:1V1 | 58,00 € |