Grundlæggende statistik
| Institutionelle ejere | 121 total, 121 long only, 0 short only, 0 long/short - change of 2,52% MRQ |
| Gennemsnitlig porteføljeallokering | 0.4970 % - change of 4,56% MRQ |
| Institutionelle aktier (lange) | 16.253.526 (ex 13D/G) - change of -0,51MM shares -3,03% MRQ |
| Institutionel værdi (lang) | $ 278.012 USD ($1000) |
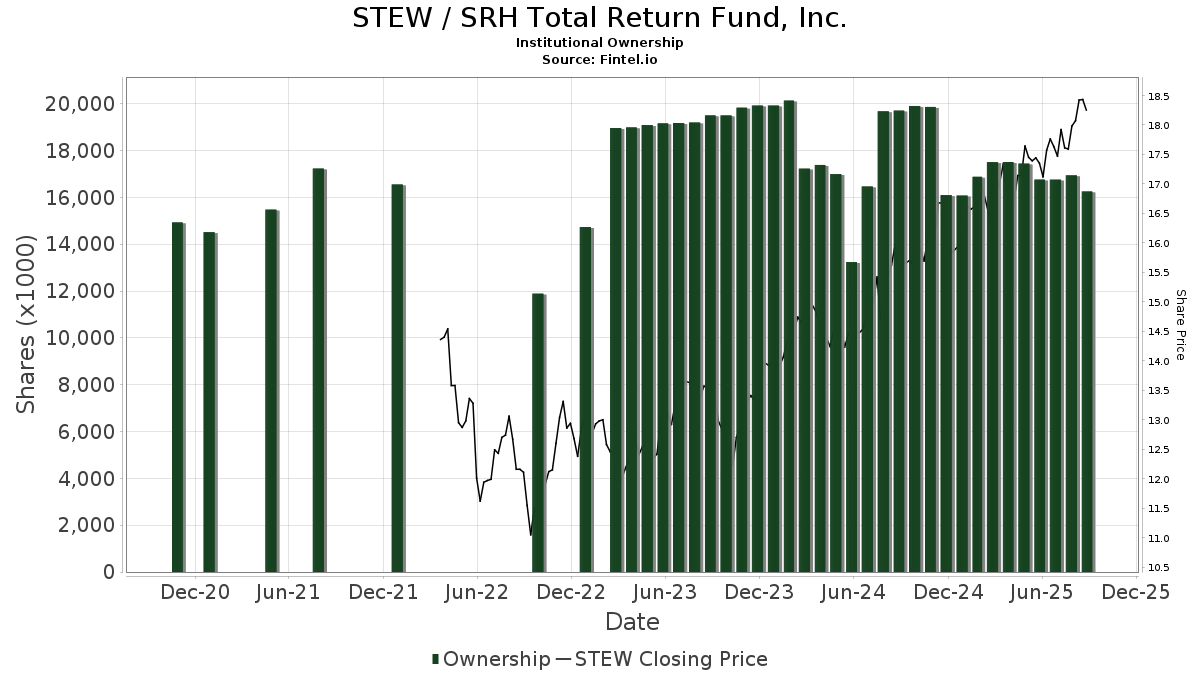
Institutionelt ejerskab og aktionærer
SRH Total Return Fund, Inc. (US:STEW) har 121 institutionelle ejere og aktionærer, der har indsendt 13D/G- eller 13F-formularer til Securities Exchange Commission (SEC). Disse institutioner har i alt 16,253,526 aktier. Største aktionærer omfatter Morgan Stanley, JP Wealth Management, Inc., Bulldog Investors, LLP, Special Opportunities Fund, Inc., Pathstone Holdings, LLC, 1607 Capital Partners, LLC, Allspring Global Investments Holdings, LLC, Css Llc/il, National Asset Management, Inc., and Karpus Management, Inc. .
SRH Total Return Fund, Inc. (NYSE:STEW) institutionel ejerskabsstruktur viser aktuelle positioner i virksomheden efter institutioner og fonde, samt seneste ændringer i positionsstørrelse. Større aktionærer kan omfatte individuelle investorer, investeringsforeninger, hedgefonde eller institutioner. Skema 13D angiver, at investoren besidder (eller besidder) mere end 5 % af virksomheden og har til hensigt (eller har til hensigt at) aktivt at forfølge en ændring i forretningsstrategi. Skema 13G indikerer en passiv investering på over 5%.
The share price as of September 5, 2025 is 18,47 / share. Previously, on September 9, 2024, the share price was 15,58 / share. This represents an increase of 18,55% over that period.
Fondens stemningsscore
Fund Sentiment Score (fka Ownership Accumulation Score) finder de aktier, der bliver mest købt af fonde. Det er resultatet af en sofistikeret, multi-faktor kvantitativ model, der identificerer virksomheder med de højeste niveauer af institutionel akkumulering. Scoringsmodellen bruger en kombination af den samlede stigning i oplyste ejere, ændringerne i porteføljeallokeringer i disse ejere og andre målinger. Tallet går fra 0 til 100, hvor højere tal indikerer et højere niveau af akkumulering for sine jævnaldrende, og 50 er gennemsnittet.
Opdateringsfrekvens: Dagligt
Se Ownership Explorer, som giver en liste over højest rangerende virksomheder.
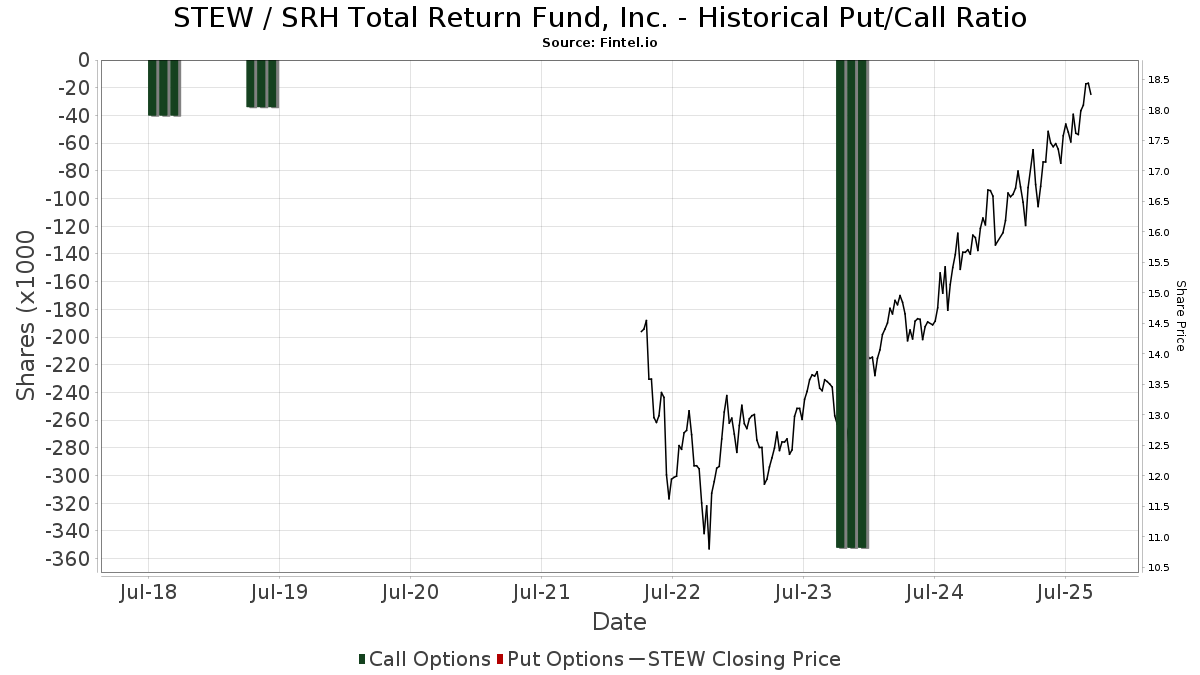
Institutionel Put/Call-forhold
Ud over at indberette standardaktie- og gældsudstedelser skal institutter med mere end 100 mill. aktiver under forvaltning også oplyse deres put- og call-optionsbeholdninger. Da salgsoptioner generelt indikerer negativ stemning, og købsoptioner indikerer positiv stemning, kan vi få en fornemmelse af den overordnede institutionelle stemning ved at plotte forholdet mellem put og kald. Diagrammet til højre viser det historiske put/call-forhold for dette instrument.
Brug af Put/Call Ratio som en indikator for investorernes stemning overvinder en af de vigtigste mangler ved at bruge totalt institutionelt ejerskab, som er, at en betydelig mængde af aktiver under forvaltning investeres passivt for at spore indekser. Passivt forvaltede fonde køber typisk ikke optioner, så indikatoren for put/call-forholdet følger mere nøje følelsen af aktivt forvaltede fonde.
13F og NPORT arkivering
Detaljer om 13F-arkivering er gratis. Detaljer om NP-ansøgninger kræver et premium-medlemskab. Grønne rækker angiver nye positioner. Røde rækker angiver lukkede positioner. Klik på linket ikon for at se den fulde transaktionshistorik.
Opgrader
for at låse premium-data op og eksportere til Excel ![]() .
.
| Fil dato | Kilde | Investor | Type | Gennemsnitlig pris (Øst) |
Aktier | Δ Aktier (%) |
Rapporteret Værdi ($1000) |
Δ Værdi (%) |
Port Alloc (%) |
|
|---|---|---|---|---|---|---|---|---|---|---|
| 2025-08-13 | 13F | Walleye Capital LLC | 11.433 | -74,34 | 202 | -73,70 | ||||
| 2025-08-14 | 13F | Jane Street Group, Llc | 10.781 | 191 | ||||||
| 2025-07-17 | 13F | Clean Yield Group | 0 | 0 | ||||||
| 2025-08-12 | 13F | Hanover Advisors Inc | 13.976 | 0,00 | 247 | 2,49 | ||||
| 2025-07-29 | 13F | Uhlmann Price Securities, Llc | 68.666 | 2,85 | 1.214 | 5,47 | ||||
| 2025-08-15 | 13F | Kestra Advisory Services, LLC | 17.505 | 309 | ||||||
| 2025-07-23 | 13F | Matisse Capital | 180.000 | 0,00 | 3.182 | 2,48 | ||||
| 2025-07-17 | 13F | Camelot Portfolios, LLC | 10.851 | 0,00 | 192 | 2,14 | ||||
| 2025-07-22 | 13F | Rocky Mountain Advisers, Llc | 187.837 | 0,45 | 3.321 | 2,95 | ||||
| 2025-08-01 | 13F | Envestnet Asset Management Inc | 102.649 | 15,96 | 1.815 | 18,80 | ||||
| 2025-08-04 | 13F | Wolverine Asset Management Llc | 39.958 | -74,40 | 706 | -73,77 | ||||
| 2025-08-14 | 13F | Comerica Bank | 4.124 | 0,00 | 73 | 1,41 | ||||
| 2025-07-24 | 13F | Game Plan Financial Advisors, LLC | 6.000 | 0,00 | 106 | 2,91 | ||||
| 2025-08-27 | NP | RYMSX - Guggenheim Multi-Hedge Strategies Fund Class P | 1.168 | -44,30 | 21 | -44,44 | ||||
| 2025-08-14 | 13F | Stifel Financial Corp | 40.935 | 0,99 | 724 | 3,43 | ||||
| 2025-08-25 | NP | MDCEX - Matisse Discounted Closed-End Fund Strategy Institutional Class Shares | 110.000 | 0,00 | 1.945 | 2,48 | ||||
| 2025-05-29 | NP | MCTOX - Modern Capital Tactical Opportunities Fund Class A Shares | 14.429 | 249 | ||||||
| 2025-08-14 | 13F | Bank Of America Corp /de/ | 281.567 | 12,32 | 4.978 | 15,12 | ||||
| 2025-08-14 | 13F | Wiley Bros.-aintree Capital, Llc | 23.564 | -1,04 | 417 | 1,71 | ||||
| 2025-08-27 | NP | RYDEX VARIABLE TRUST - Multi-Hedge Strategies Fund Variable Annuity | 1.959 | -28,16 | 35 | -27,66 | ||||
| 2025-07-24 | 13F | Grace & White Inc /ny | 36.560 | 0,00 | 646 | 2,54 | ||||
| 2025-08-14 | 13F | Royal Bank Of Canada | 196.417 | 5,26 | 3.473 | 7,92 | ||||
| 2025-08-11 | 13F | Blue Bell Private Wealth Management, Llc | 277.869 | 2,70 | 4.913 | 5,25 | ||||
| 2025-07-18 | 13F | Consolidated Portfolio Review Corp | 204.998 | 1,50 | 3.624 | 4,02 | ||||
| 2025-07-16 | 13F | Strategic Investment Solutions, Inc. /IL | 100 | 2 | ||||||
| 2025-08-19 | 13F | Asset Dedication, LLC | 184 | 0,00 | 3 | 0,00 | ||||
| 2025-08-14 | 13F | Heritage Wealth Management, Inc. | 23.408 | -20,76 | 414 | -18,86 | ||||
| 2025-08-14 | 13F | Ancora Advisors, LLC | 19.581 | 0,00 | 346 | 2,67 | ||||
| 2025-07-23 | 13F | Joel Isaacson & Co., LLC | 24.867 | -4,68 | 440 | -2,44 | ||||
| 2025-07-29 | 13F | Stratos Wealth Partners, LTD. | 14.591 | 0,59 | 258 | 2,80 | ||||
| 2025-07-18 | 13F | Hudson Value Partners, LLC | 0 | -100,00 | 0 | |||||
| 2025-08-14 | 13F | Cnh Partners Llc | 316.222 | -28,90 | 5.581 | -26,65 | ||||
| 2025-08-13 | 13F | Thomas J. Herzfeld Advisors, Inc. | 325.726 | 90.128,81 | 5.759 | 95.866,67 | ||||
| 2025-07-29 | 13F | Beverly Hills Private Wealth, LLC | 24.766 | 9,38 | 438 | 12,05 | ||||
| 2025-08-13 | 13F | Level Four Advisory Services, Llc | 19.951 | 2,52 | 353 | 5,07 | ||||
| 2025-08-18 | 13F | Geneos Wealth Management Inc. | 1.358 | -1,16 | 24 | 4,35 | ||||
| 2025-08-12 | 13F | Global Retirement Partners, LLC | 5.743 | 1,65 | 102 | 12,22 | ||||
| 2025-08-04 | 13F | Horizon Wealth Management, LLC | 12.503 | 0,00 | 221 | 2,79 | ||||
| 2025-08-12 | 13F | NWF Advisory Services Inc. | 17.800 | 307 | ||||||
| 2025-08-14 | 13F | GWM Advisors LLC | 69.123 | 1,86 | 1.222 | 4,44 | ||||
| 2025-04-29 | 13F | Absolute Investment Advisers Llc | 0 | -100,00 | 0 | |||||
| 2025-08-11 | 13F | Rpo Llc | 168.990 | -0,18 | 2.988 | 2,29 | ||||
| 2025-08-13 | 13F/A | StoneX Group Inc. | 14.691 | 187 | ||||||
| 2025-08-04 | 13F | Flagship Harbor Advisors, Llc | 206.955 | 2,94 | 3.659 | 5,48 | ||||
| 2025-08-13 | 13F | WealthTrust Axiom LLC | 36.120 | 0,00 | 639 | 2,41 | ||||
| 2025-07-28 | 13F | BRYN MAWR TRUST Co | 62.500 | 0,00 | 1.105 | 2,50 | ||||
| 2025-08-14 | 13F | Capstone Investment Advisors, Llc | 111.819 | 0,00 | 1.977 | 2,49 | ||||
| 2025-08-05 | 13F | Shaker Financial Services, LLC | 69.216 | -75,36 | 1.224 | -74,76 | ||||
| 2025-07-25 | 13F | Integrated Capital Management, Inc. | 15.889 | 11,71 | 281 | 14,29 | ||||
| 2025-07-08 | 13F | Nbc Securities, Inc. | 9.570 | 0,41 | 0 | |||||
| 2025-08-14 | 13F | 1607 Capital Partners, LLC | 773.575 | -1,51 | 13.677 | 0,94 | ||||
| 2025-07-10 | 13F | Stolper Co | 17.912 | 0,00 | 0 | |||||
| 2025-07-22 | 13F | JP Wealth Management, Inc. | 1.286.433 | 32,83 | 22.744 | 36,15 | ||||
| 2025-08-12 | 13F | DCF Advisers, LLC | 50.000 | 0,00 | 884 | 2,55 | ||||
| 2025-08-06 | 13F | Commonwealth Equity Services, Llc | 21.219 | 2,11 | 0 | |||||
| 2025-08-14 | 13F | Cohen & Steers, Inc. | 164.158 | 0,00 | 3 | 0,00 | ||||
| 2025-08-13 | 13F | Jones Financial Companies Lllp | 11.285 | 14,56 | 198 | 17,16 | ||||
| 2025-08-14 | 13F | Wells Fargo & Company/mn | 209.039 | 4,54 | 3.696 | 7,13 | ||||
| 2025-05-14 | 13F | Landscape Capital Management, L.l.c. | 0 | -100,00 | 0 | |||||
| 2025-08-14 | 13F | Mml Investors Services, Llc | 83.893 | 12,21 | 1 | 0,00 | ||||
| 2025-04-17 | 13F | Janney Montgomery Scott LLC | 0 | -100,00 | 0 | |||||
| 2025-07-29 | 13F | Stephens Inc /ar/ | 11.583 | 0,00 | 205 | 2,51 | ||||
| 2025-08-26 | 13F/A | Thrivent Financial For Lutherans | 0 | -100,00 | 0 | |||||
| 2025-08-14 | 13F | Millennium Management Llc | 0 | -100,00 | 0 | |||||
| 2025-08-12 | 13F | CIBC Private Wealth Group, LLC | 0 | -100,00 | 0 | |||||
| 2025-04-23 | 13F | Bessemer Group Inc | 0 | -100,00 | 0 | |||||
| 2025-08-14 | 13F | Warren Averett Asset Management, LLC | 15.119 | 0,27 | 267 | 2,69 | ||||
| 2025-08-08 | 13F | Calamos Advisors LLC | 15.040 | -8,00 | 266 | -6,03 | ||||
| 2025-08-14 | 13F | Css Llc/il | 461.785 | -26,07 | 8.164 | -24,23 | ||||
| 2025-08-04 | 13F | Creekmur Asset Management LLC | 7.058 | 0,87 | 125 | 3,33 | ||||
| 2025-08-18 | 13F | Tactive Advisors, LLC | 0 | -100,00 | 0 | |||||
| 2025-08-08 | 13F | Pnc Financial Services Group, Inc. | 6.925 | -48,61 | 122 | -47,41 | ||||
| 2025-08-11 | 13F | Principal Securities, Inc. | 93.940 | -7,16 | 1.661 | 2,41 | ||||
| 2025-06-27 | NP | Calamos ETF Trust - Calamos CEF Income & Arbitrage ETF | 15.040 | -11,54 | 258 | -8,54 | ||||
| 2025-07-14 | 13F | Park Avenue Securities Llc | 95.541 | 15,56 | 2 | 0,00 | ||||
| 2025-08-11 | 13F | HighTower Advisors, LLC | 121.019 | 22,65 | 2.140 | 25,68 | ||||
| 2025-08-27 | NP | Special Opportunities Fund, Inc. | 1.116.522 | 0,00 | 19.740 | 2,49 | ||||
| 2025-07-16 | 13F | Dakota Wealth Management | 17.455 | -11,71 | 309 | -9,68 | ||||
| 2025-07-23 | 13F | Roundview Capital LLC | 21.708 | 0,04 | 384 | 2,41 | ||||
| 2025-08-15 | 13F | Tower Research Capital LLC (TRC) | 27 | 0 | ||||||
| 2025-08-14 | 13F | Mariner, LLC | 12.621 | 223 | ||||||
| 2025-08-06 | 13F | Carnegie Lake Advisors LLC | 14.307 | -11,30 | 0 | |||||
| 2025-08-07 | 13F | Allworth Financial LP | 8 | 0,00 | 0 | |||||
| 2025-08-06 | 13F | SOUTH STATE Corp | 100.000 | 0,00 | 1.768 | 2,49 | ||||
| 2025-08-14 | 13F | Raymond James Financial Inc | 240.942 | 8,83 | 4.260 | 11,52 | ||||
| 2025-07-23 | 13F | Kingswood Wealth Advisors, Llc | 78.375 | 0,00 | 1.386 | 2,52 | ||||
| 2025-07-11 | 13F | Caldwell Securities, Inc | 10.709 | 0,00 | 189 | 2,72 | ||||
| 2025-08-20 | NP | ADANX - AQR Diversified Arbitrage Fund Class N | 59.349 | -27,64 | 1.049 | -25,81 | ||||
| 2025-08-07 | 13F/A | Tortoise Investment Management, LLC | 0 | -100,00 | 0 | -100,00 | ||||
| 2025-05-12 | 13F | Independent Advisor Alliance | 0 | -100,00 | 0 | |||||
| 2025-08-29 | 13F | Total Investment Management Inc | 1.500 | 27 | ||||||
| 2025-07-31 | 13F | Cambridge Investment Research Advisors, Inc. | 107.281 | -6,02 | 2 | 0,00 | ||||
| 2025-08-11 | 13F | WPG Advisers, LLC | 576 | -12,86 | 10 | -9,09 | ||||
| 2025-08-11 | 13F | Elequin Capital Lp | 10.885 | 192 | ||||||
| 2025-04-28 | 13F | Buffington Mohr McNeal | 10.703 | 0,00 | 185 | 7,60 | ||||
| 2025-08-11 | 13F | Nations Financial Group Inc, /ia/ /adv | 12.000 | 0,00 | 212 | 2,42 | ||||
| 2025-07-14 | 13F | AdvisorNet Financial, Inc | 500 | 0,00 | 9 | 0,00 | ||||
| 2025-07-24 | 13F | Costello Asset Management, INC | 9.042 | 1,24 | 160 | 3,25 | ||||
| 2025-07-15 | 13F | MCF Advisors LLC | 1.060 | 0,00 | 19 | 0,00 | ||||
| 2025-08-11 | 13F | Private Advisor Group, LLC | 33.213 | 44,27 | 587 | 47,86 | ||||
| 2025-08-12 | 13F | Nemes Rush Group LLC | 3.712 | 0,95 | 66 | 3,17 | ||||
| 2025-08-07 | 13F | Readystate Asset Management Lp | 59.121 | -9,60 | 1.045 | -7,36 | ||||
| 2025-08-12 | 13F | LPL Financial LLC | 236.409 | 26,31 | 4.180 | 29,46 | ||||
| 2025-08-14 | 13F | Boothbay Fund Management, Llc | 56.297 | -0,18 | 995 | 2,37 | ||||
| 2025-07-09 | 13F | Taddei, Ludwig & Associates, Inc. | 16.168 | 0,00 | 286 | 2,52 | ||||
| 2025-04-29 | 13F | Concurrent Investment Advisors, LLC | 0 | -100,00 | 0 | |||||
| 2025-08-14 | 13F | Karpus Management, Inc. | 372.566 | -26,84 | 6.587 | -25,01 | ||||
| 2025-08-19 | 13F | National Asset Management, Inc. | 401.868 | -0,02 | 7.105 | 10,33 | ||||
| 2025-08-08 | 13F | Cetera Investment Advisers | 29.306 | -7,72 | 518 | -5,30 | ||||
| 2025-08-14 | 13F | Quantedge Capital Pte Ltd | 200.303 | 1,57 | 3.541 | 4,12 | ||||
| 2025-07-31 | 13F | Oppenheimer & Co Inc | 95.080 | -1,03 | 1.681 | 1,45 | ||||
| 2025-07-25 | 13F | Cwm, Llc | 5.767 | 0,00 | 0 | |||||
| 2025-08-11 | 13F | Wealthspire Advisors, LLC | 14.678 | 0,00 | 260 | 2,37 | ||||
| 2025-07-25 | 13F | Atria Wealth Solutions, Inc. | 0 | -100,00 | 0 | |||||
| 2025-08-12 | 13F | Jpmorgan Chase & Co | 6.320 | 0,00 | 112 | 1,83 | ||||
| 2025-07-25 | 13F | Allspring Global Investments Holdings, LLC | 612.949 | 13,21 | 10.837 | 16,03 | ||||
| 2025-08-14 | 13F | Two Sigma Investments, Lp | 135.174 | 2.390 | ||||||
| 2025-07-23 | 13F | Clear Creek Financial Management, LLC | 47.800 | -1,85 | 845 | 0,60 | ||||
| 2025-08-12 | 13F | Pathstone Holdings, LLC | 969.356 | -16,77 | 17.138 | -12,30 | ||||
| 2025-07-25 | 13F | Sather Financial Group Inc | 19.710 | 2,88 | 348 | 5,45 | ||||
| 2025-08-12 | 13F | Steward Partners Investment Advisory, Llc | 10.364 | 37,27 | 183 | 40,77 | ||||
| 2025-08-14 | 13F | UBS Group AG | 138.329 | 15,74 | 2.446 | 18,63 | ||||
| 2025-08-13 | 13F | Northwestern Mutual Wealth Management Co | 9.639 | 22,57 | 170 | 25,93 | ||||
| 2025-08-15 | 13F | Morgan Stanley | 2.429.593 | -2,39 | 42.955 | 0,04 | ||||
| 2025-04-09 | 13F | American National Bank | 0 | -100,00 | 0 | -100,00 | ||||
| 2025-07-07 | 13F | Thurston, Springer, Miller, Herd & Titak, Inc. | 1.700 | 142,86 | 30 | 150,00 | ||||
| 2025-08-04 | 13F | IFG Advisory, LLC | 161.447 | 2.854 | ||||||
| 2025-08-14 | 13F | Bulldog Investors, LLP | 1.117.582 | -8,00 | 19.759 | -5,70 | ||||
| 2025-07-11 | 13F | Farther Finance Advisors, LLC | 18 | 0,00 | 0 | |||||
| 2025-08-04 | 13F | Assetmark, Inc | 167 | 0,00 | 3 | 0,00 | ||||
| 2025-08-14 | 13F | Monetary Management Group Inc | 27.900 | 0,00 | 493 | 2,49 | ||||
| 2025-09-04 | 13F/A | Advisor Group Holdings, Inc. | 36.329 | 5,91 | 642 | 8,63 | ||||
| 2025-07-30 | 13F | D.a. Davidson & Co. | 82.969 | 0,06 | 1.467 | 2,52 | ||||
| 2025-08-28 | NP | Cohen & Steers Closed-end Opportunity Fund, Inc. | 164.158 | 0,00 | 2.902 | 2,51 | ||||
| 2025-08-14 | 13F | Almitas Capital LLC | 0 | -100,00 | 0 | |||||
| 2025-08-12 | 13F | Proequities, Inc. | 0 | 0 | ||||||
| 2025-08-15 | 13F | High Falls Advisors, Inc | 12.994 | 0,96 | 230 | 3,15 | ||||
| 2025-08-12 | 13F | Twin Focus Capital Partners, Llc | 43.487 | -20,96 | 769 | -19,07 |