Grundlæggende statistik
| Institutionelle ejere | 187 total, 187 long only, 0 short only, 0 long/short - change of 3,31% MRQ |
| Gennemsnitlig porteføljeallokering | 0.3432 % - change of 30,06% MRQ |
| Institutionelle aktier (lange) | 16.727.701 (ex 13D/G) - change of -1,14MM shares -6,37% MRQ |
| Institutionel værdi (lang) | $ 804.611 USD ($1000) |
Institutionelt ejerskab og aktionærer
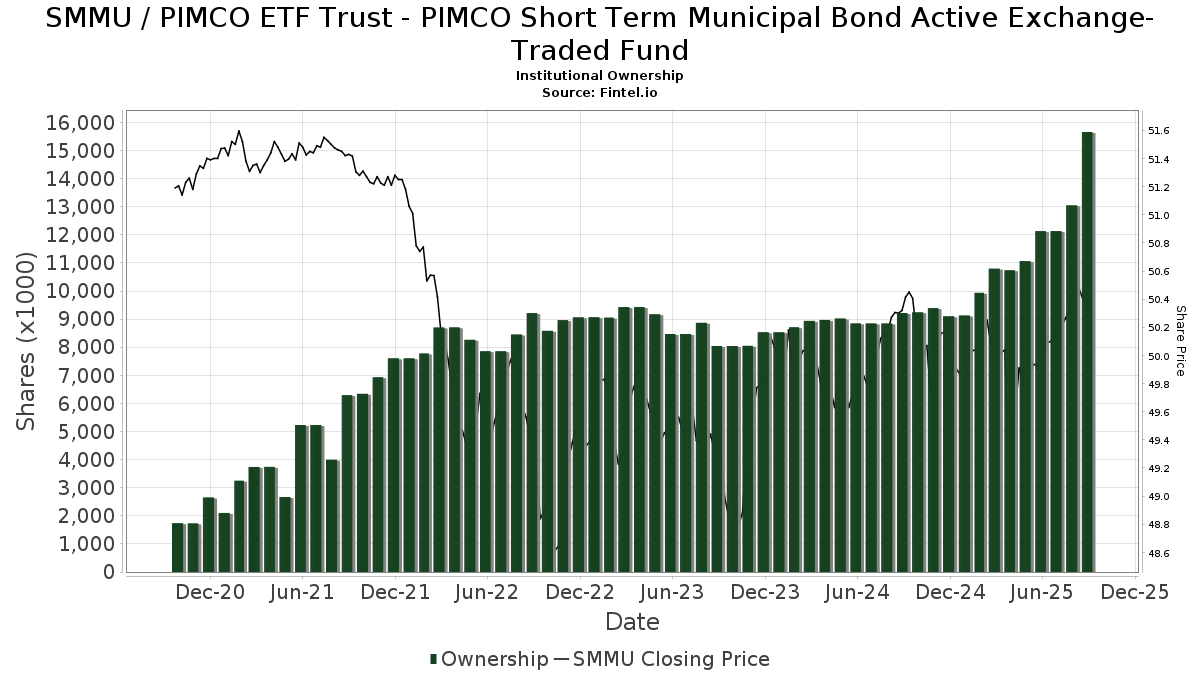
PIMCO ETF Trust - PIMCO Short Term Municipal Bond Active Exchange-Traded Fund (US:SMMU) har 187 institutionelle ejere og aktionærer, der har indsendt 13D/G- eller 13F-formularer til Securities Exchange Commission (SEC). Disse institutioner har i alt 16,727,701 aktier. Største aktionærer omfatter Morgan Stanley, Bank Of America Corp /de/, Stonebridge Financial Group, LLC, Captrust Financial Advisors, Jpmorgan Chase & Co, Cwm, Llc, Cetera Investment Advisers, LPL Financial LLC, Wealth Enhancement Advisory Services, Llc, and John A. Wolfe & Associates, Inc. .
PIMCO ETF Trust - PIMCO Short Term Municipal Bond Active Exchange-Traded Fund (ARCA:SMMU) institutionel ejerskabsstruktur viser aktuelle positioner i virksomheden efter institutioner og fonde, samt seneste ændringer i positionsstørrelse. Større aktionærer kan omfatte individuelle investorer, investeringsforeninger, hedgefonde eller institutioner. Skema 13D angiver, at investoren besidder (eller besidder) mere end 5 % af virksomheden og har til hensigt (eller har til hensigt at) aktivt at forfølge en ændring i forretningsstrategi. Skema 13G indikerer en passiv investering på over 5%.
The share price as of April 30, 2026 is 50,49 / share. Previously, on May 2, 2025, the share price was 49,77 / share. This represents an increase of 1,45% over that period.
Fondens stemningsscore
Fund Sentiment Score (fka Ownership Accumulation Score) finder de aktier, der bliver mest købt af fonde. Det er resultatet af en sofistikeret, multi-faktor kvantitativ model, der identificerer virksomheder med de højeste niveauer af institutionel akkumulering. Scoringsmodellen bruger en kombination af den samlede stigning i oplyste ejere, ændringerne i porteføljeallokeringer i disse ejere og andre målinger. Tallet går fra 0 til 100, hvor højere tal indikerer et højere niveau af akkumulering for sine jævnaldrende, og 50 er gennemsnittet.
Opdateringsfrekvens: Dagligt
Se Ownership Explorer, som giver en liste over højest rangerende virksomheder.
AI+ Ask Fintel’s AI assistant about PIMCO ETF Trust - PIMCO Short Term Municipal Bond Active Exchange-Traded Fund.
Select a question to share a public post with an AI-crafted answer.
Thinking of good questions…
Institutionel Put/Call-forhold
Ud over at indberette standardaktie- og gældsudstedelser skal institutter med mere end 100 mill. aktiver under forvaltning også oplyse deres put- og call-optionsbeholdninger. Da salgsoptioner generelt indikerer negativ stemning, og købsoptioner indikerer positiv stemning, kan vi få en fornemmelse af den overordnede institutionelle stemning ved at plotte forholdet mellem put og kald. Diagrammet til højre viser det historiske put/call-forhold for dette instrument.
Brug af Put/Call Ratio som en indikator for investorernes stemning overvinder en af de vigtigste mangler ved at bruge totalt institutionelt ejerskab, som er, at en betydelig mængde af aktiver under forvaltning investeres passivt for at spore indekser. Passivt forvaltede fonde køber typisk ikke optioner, så indikatoren for put/call-forholdet følger mere nøje følelsen af aktivt forvaltede fonde.
13F og NPORT arkivering
Detaljer om 13F-arkivering er gratis. Detaljer om NP-ansøgninger kræver et premium-medlemskab. Grønne rækker angiver nye positioner. Røde rækker angiver lukkede positioner. Klik på linket ikon for at se den fulde transaktionshistorik.
Opgrader
for at låse premium-data op og eksportere til Excel ![]() .
.
| Fil dato | Kilde | Investor | Type | Gennemsnitlig pris (Øst) |
Aktier | Δ Aktier (%) |
Rapporteret Værdi ($1000) |
Δ Værdi (%) |
Port Alloc (%) |
|
|---|---|---|---|---|---|---|---|---|---|---|
| 2026-04-28 | 13F | MBL Wealth, LLC | 21.762 | -3,59 | 1.098 | -3,60 | ||||
| 2026-04-29 | 13F | Cambridge Capital Management, Llc | 9.610 | 1,45 | 485 | 1,47 | ||||
| 2026-04-30 | 13F | Private Trust Co Na | 708 | 0,00 | 36 | 0,00 | ||||
| 2026-04-08 | 13F | Ehrlich Financial Group | 33.097 | -8,31 | 1.670 | -8,30 | ||||
| 2026-04-15 | 13F | Founders Grove Wealth Partners, Llc | 31.970 | 1,27 | 1.613 | 1,26 | ||||
| 2026-02-13 | 13F | Integrated Wealth Concepts LLC | 26.651 | -72,68 | 1.344 | -72,75 | ||||
| 2026-02-17 | 13F | Equitable Holdings, Inc. | 37.153 | 23,84 | 1.874 | 23,47 | ||||
| 2026-01-08 | 13F | Signet Financial Management, Llc | 29.824 | -12,59 | 1.504 | -12,81 | ||||
| 2026-04-17 | 13F | Certified Advisory Corp | 55.105 | 8,83 | 2.780 | 8,89 | ||||
| 2026-02-10 | 13F/A | Northwestern Mutual Wealth Management Co | 30.026 | -21,52 | 1.514 | -21,72 | ||||
| 2026-02-24 | 13F | Barnes Wealth Management Group, Inc | 7.074 | -1,57 | 357 | -1,93 | ||||
| 2026-02-13 | 13F | Morgan Stanley | 2.922.726 | -20,19 | 147.393 | -20,41 | ||||
| 2026-04-08 | 13F | Stonebridge Financial Group, LLC | 1.056.265 | -0,71 | 53.289 | -0,67 | ||||
| 2026-04-28 | 13F | Sage Rhino Capital Llc | 0 | -100,00 | 0 | |||||
| 2026-02-13 | 13F | Resources Investment Advisors, LLC. | 31.183 | -4,31 | 1.573 | -4,61 | ||||
| 2026-04-15 | 13F | DecisionMap Wealth Management, LLC | 6.426 | -14,14 | 324 | -14,06 | ||||
| 2026-04-29 | 13F | Clear Point Advisors Inc. | 6.887 | -7,67 | 347 | -7,71 | ||||
| 2026-04-30 | 13F | CarsonAllaria Wealth Management, Ltd. | 94.839 | -2,34 | 4.785 | -2,31 | ||||
| 2025-11-25 | 13F | Briaud Financial Planning, Inc | 0 | -100,00 | 0 | |||||
| 2026-04-22 | 13F | Janney Montgomery Scott LLC | 13.875 | 0,00 | 1 | |||||
| 2026-01-23 | 13F | Westside Investment Management, Inc. | 64.890 | -6,80 | 3.273 | -7,02 | ||||
| 2026-04-24 | 13F | Swmg, Llc | 10.327 | 74,83 | 521 | 74,25 | ||||
| 2026-02-12 | 13F | Davis R M Inc | 39.331 | -45,76 | 1.983 | -45,92 | ||||
| 2026-04-20 | 13F | Kestra Private Wealth Services, Llc | 4.770 | 0,17 | 241 | 0,00 | ||||
| 2026-04-20 | 13F | LifeWealth Investments, LLC | 35.056 | 0,00 | 1.769 | 0,06 | ||||
| 2026-04-09 | 13F | TruWealth Advisors, LLC | 11.635 | 5,43 | 587 | 5,40 | ||||
| 2026-04-13 | 13F | Gradient Investments LLC | 5.801 | -32,94 | 293 | -33,03 | ||||
| 2026-02-17 | 13F | Hyundai Investments Co., Ltd. | 9.399 | 475 | ||||||
| 2025-11-12 | 13F | Ameriflex Group, Inc. | 0 | -100,00 | 0 | |||||
| 2026-02-13 | 13F | Flow Traders U.s. Llc | 0 | -100,00 | 0 | |||||
| 2026-02-17 | 13F | Family Management Corp | 0 | -100,00 | 0 | |||||
| 2026-01-15 | 13F | Wright Fund Managment, LLC | 0 | -100,00 | 0 | |||||
| 2026-02-11 | 13F | Allianz Asset Management GmbH | 271 | 1,12 | 14 | 0,00 | ||||
| 2026-04-10 | 13F | Marshall Financial Group LLC | 5.100 | 0,00 | 257 | 0,00 | ||||
| 2026-02-17 | 13F | Cetera Investment Advisers | 695.625 | -5,44 | 35.080 | -5,70 | ||||
| 2026-02-06 | 13F | Condor Capital Management | 260.714 | 0,51 | 13.148 | 0,23 | ||||
| 2026-04-27 | 13F | Evolution Wealth Management Inc. | 0 | -100,00 | 0 | |||||
| 2026-04-20 | 13F | MBM Wealth Consultants, LLC | 79.635 | 11,44 | 4.018 | 11,49 | ||||
| 2026-04-17 | 13F | Total Clarity Wealth Management, Inc. | 4.913 | 0,00 | 248 | 0,00 | ||||
| 2026-02-04 | 13F | Hallmark Capital Management Inc | 237 | 0,00 | 12 | 0,00 | ||||
| 2026-01-21 | 13F | Capital Investment Advisory Services, LLC | 100 | 5 | ||||||
| 2026-01-23 | 13F | Optima Capital Llc | 891 | 45 | ||||||
| 2026-02-09 | 13F | Kuhn & Co Investment Counsel | 15.132 | 17,57 | 763 | 17,38 | ||||
| 2026-04-24 | 13F | American Institute for Advanced Investment Management, LLP | 4.200 | -6,67 | 212 | -6,64 | ||||
| 2026-02-17 | 13F | Captrust Financial Advisors | 1.047.846 | 9,51 | 52.843 | 9,20 | ||||
| 2026-04-10 | 13F | IAM Advisory, LLC | 34.481 | 2,56 | 1.740 | 2,60 | ||||
| 2026-02-17 | 13F | Susquehanna International Group, Llp | 19.505 | -22,29 | 984 | -22,54 | ||||
| 2026-02-11 | 13F | Milestone Investment Advisors LLC | 43.796 | 13,33 | 2.209 | 13,00 | ||||
| 2026-04-21 | 13F | VCI Wealth Management LLC | 0 | -100,00 | 0 | |||||
| 2025-11-21 | 13F | Watts Gwilliam & Co., LLC | 4.013 | 0,00 | 203 | -0,49 | ||||
| 2026-02-11 | 13F | Cedar Point Capital Partners, LLC | 56.387 | -10,59 | 2.844 | -10,85 | ||||
| 2025-11-04 | 13F | Sollinda Capital Management LLC | 0 | -100,00 | 0 | |||||
| 2026-01-21 | 13F | Prime Capital Investment Advisors, LLC | 34.065 | 89,46 | 1.718 | 88,89 | ||||
| 2026-01-23 | 13F | Assetmark, Inc | 514 | -30,54 | 26 | -32,43 | ||||
| 2026-02-05 | 13F | Thrivent Financial For Lutherans | 23.391 | -1,65 | 1 | 0,00 | ||||
| 2026-01-29 | 13F | Atlas Legacy Advisors, LLC | 5.204 | -8,41 | 262 | -8,71 | ||||
| 2026-02-18 | 13F | GWM Advisors LLC | 0 | -100,00 | 0 | |||||
| 2026-04-17 | 13F | Worth Asset Management, LLC | 4.800 | 242 | ||||||
| 2026-01-29 | 13F | Ashton Thomas Private Wealth, LLC | 9.495 | 92,64 | 480 | 92,37 | ||||
| 2026-02-06 | 13F | Global Retirement Partners, LLC | 15.533 | -2,09 | 783 | -2,37 | ||||
| 2026-04-30 | 13F | Kestra Advisory Services, LLC | 20.962 | 6,93 | 1.058 | 6,98 | ||||
| 2026-04-17 | 13F | Krilogy Financial LLC | 0 | -100,00 | 0 | |||||
| 2026-04-20 | 13F | ABLE Financial Group, LLC | 61.186 | -0,28 | 3.087 | -0,26 | ||||
| 2026-01-27 | 13F | PFG Advisors | 7.569 | -29,51 | 382 | -29,83 | ||||
| 2026-02-04 | 13F | Objective Capital Management, LLC | 5.223 | 263 | ||||||
| 2026-02-12 | 13F | Commonwealth Equity Services, Llc | 56.011 | 10,39 | 2.825 | 141.100,00 | ||||
| 2026-01-28 | 13F | Bedel Financial Consulting, Inc. | 13.184 | 0,00 | 665 | -0,30 | ||||
| 2026-02-23 | 13F | Beaird Harris Wealth Management, LLC | 2.752 | -79,60 | 139 | -79,77 | ||||
| 2026-04-29 | 13F | IAG Wealth Partners, LLC | 6.909 | 349 | ||||||
| 2026-04-08 | 13F | Inspirion Wealth Advisors, Llc | 41.508 | 0,00 | 2.094 | 0,05 | ||||
| 2026-04-17 | 13F | RFG Advisory, LLC | 22.067 | 35,27 | 1.113 | 35,40 | ||||
| 2026-04-28 | 13F | Canvas Wealth Advisors, LLC | 14.740 | 744 | ||||||
| 2026-02-11 | 13F | Cerity Partners LLC | 65.041 | -11,15 | 3.280 | -11,40 | ||||
| 2026-02-17 | 13F | SageView Advisory Group, LLC | 9.854 | 0,73 | 497 | 0,40 | ||||
| 2026-02-26 | 13F | Anchor Investment Management, LLC | 8.000 | 0,00 | 403 | -0,25 | ||||
| 2026-02-17 | 13F | Blair William & Co/il | 810 | 0,00 | 41 | 0,00 | ||||
| 2026-02-05 | 13F | Allworth Financial LP | 122.334 | 9,59 | 6.169 | 9,28 | ||||
| 2026-02-14 | 13F | Rockefeller Capital Management L.P. | 41.909 | 39,04 | 2.113 | 38,65 | ||||
| 2026-04-22 | 13F | Harbor Asset Planning, Inc. | 705 | 0,71 | 36 | 0,00 | ||||
| 2026-04-20 | 13F | Apella Capital, LLC | 10.347 | -2,80 | 523 | -2,61 | ||||
| 2026-04-27 | 13F | Wbh Advisory Inc | 8.552 | 0,00 | 431 | -0,23 | ||||
| 2026-02-04 | 13F | Atlantic Union Bankshares Corp | 2.430 | 2,62 | 123 | 2,52 | ||||
| 2026-04-08 | 13F | Lakeridge Wealth Management LLC | 31.610 | 1.595 | ||||||
| 2026-02-13 | 13F | Beacon Capital Management, LLC | 8.033 | 405 | ||||||
| 2026-02-12 | 13F | Great Valley Advisor Group, Inc. | 38.421 | 9,65 | 1.938 | 9,37 | ||||
| 2026-02-13 | 13F | Advyzon Investment Management, LLC | 10.694 | 8,23 | 539 | 8,02 | ||||
| 2026-01-28 | 13F | G&S Capital LLC | 0 | -100,00 | 0 | |||||
| 2026-02-13 | 13F | Stifel Financial Corp | 150.020 | 10,65 | 7.565 | 10,34 | ||||
| 2026-01-22 | 13F | Rodgers & Associates, LTD | 10.487 | 2,89 | 529 | 2,52 | ||||
| 2026-02-06 | 13F | HighTower Advisors, LLC | 27.152 | -3,35 | 1.369 | -3,59 | ||||
| 2026-04-30 | 13F | Whipplewood Advisors, LLC | 7.565 | 1,78 | 382 | 1,87 | ||||
| 2026-04-27 | 13F | Mount Yale Investment Advisors, LLC | 31.601 | 28,42 | 1.594 | 28,24 | ||||
| 2026-04-24 | 13F | United Community Bank | 2.110 | 106 | ||||||
| 2026-02-13 | 13F | Inspire Advisors, LLC | 36.692 | 12,97 | 1.850 | 12,67 | ||||
| 2026-02-09 | 13F | Harbour Investments, Inc. | 5.668 | -7,85 | 286 | -8,36 | ||||
| 2026-02-12 | 13F | Steward Partners Investment Advisory, Llc | 2.600 | -21,21 | 131 | -21,08 | ||||
| 2026-02-17 | 13F | Bank Of America Corp /de/ | 1.091.756 | -0,59 | 55.057 | -0,86 | ||||
| 2026-04-07 | 13F | Farther Finance Advisors, LLC | 34.557 | 45,97 | 1.740 | 45,85 | ||||
| 2026-02-11 | 13F | LPL Financial LLC | 504.530 | 9,49 | 25.443 | 9,18 | ||||
| 2026-02-13 | 13F | Pathstone Holdings, LLC | 8.281 | 0,00 | 418 | -0,24 | ||||
| 2026-04-21 | 13F | Kooman & Associates | 14.713 | 3,68 | 742 | 3,78 | ||||
| 2026-04-21 | 13F | Vise Technologies, Inc. | 147.634 | 0,00 | 7.445 | 0,00 | ||||
| 2026-02-06 | 13F | Watchman Group, Inc. | 0 | -100,00 | 0 | |||||
| 2026-02-17 | 13F | Elequin Capital Lp | 29.419 | 307,35 | 1.484 | 306,30 | ||||
| 2026-04-23 | 13F | J.w. Cole Advisors, Inc. | 7.678 | 12,35 | 387 | 12,50 | ||||
| 2026-02-06 | 13F | Vestmark Advisory Solutions, Inc. | 24.608 | 0,03 | 1.241 | -0,32 | ||||
| 2026-04-21 | 13F | Main Line Retirement Advisors, LLC | 23.291 | 0,45 | 1.175 | 0,51 | ||||
| 2025-11-12 | 13F | Aptus Capital Advisors, LLC | 0 | -100,00 | 0 | |||||
| 2025-11-13 | 13F | Crewe Advisors LLC | 0 | -100,00 | 0 | |||||
| 2026-04-02 | 13F | Crumly & Associates Inc. | 105.091 | 15,66 | 5.302 | 15,69 | ||||
| 2026-02-05 | 13F | Boulder Wealth Advisors, LLC | 9.492 | 479 | ||||||
| 2026-04-23 | 13F/A | Private Wealth Group, LLC | 5.588 | 1,66 | 282 | 1,44 | ||||
| 2026-04-15 | 13F | LongView Wealth Management | 12.154 | -62,20 | 614 | -62,32 | ||||
| 2026-04-24 | 13F | Capital Asset Advisory Services LLC | 168.800 | 16,12 | 8.534 | 16,13 | ||||
| 2026-02-17 | 13F | NewSquare Capital LLC | 24.237 | -12,14 | 1.222 | -12,40 | ||||
| 2026-04-21 | 13F | Stokes Capital Advisors, LLC | 40.000 | 2.018 | ||||||
| 2025-11-06 | 13F | Financial Advocates Investment Management | 0 | -100,00 | 0 | -100,00 | ||||
| 2026-04-22 | 13F | Onyx Bridge Wealth Group LLC | 10.884 | 0,69 | 549 | 0,73 | ||||
| 2026-03-16 | 13F | John A. Wolfe & Associates, Inc. | 486.884 | 24.554 | ||||||
| 2026-02-04 | 13F | Fourth Dimension Wealth, LLC | 101 | -13,68 | 5 | 0,00 | ||||
| 2026-02-12 | 13F | Brinker Capital Investments, LLC | 7.214 | -40,74 | 364 | -40,98 | ||||
| 2026-02-17 | 13F | Advisor Group Holdings, Inc. | 316.925 | 5,08 | 15.983 | 4,81 | ||||
| 2026-04-30 | 13F | Madison Wealth Partners, Inc | 4.514 | 0,40 | 228 | 0,44 | ||||
| 2026-04-17 | 13F | Essex Savings Bank | 5.950 | 0,00 | 300 | 0,00 | ||||
| 2026-02-03 | 13F | Crossmark Global Holdings, Inc. | 0 | -100,00 | 0 | |||||
| 2026-01-29 | 13F | Comerica Bank | 16.769 | -37,86 | 846 | -38,05 | ||||
| 2026-02-04 | 13F | AIFG Consultants Ltd. | 49.332 | 3,40 | 2.488 | 3,11 | ||||
| 2026-04-06 | 13F | GAMMA Investing LLC | 115 | 9,52 | 6 | 0,00 | ||||
| 2026-02-17 | 13F | Wiley Bros.-aintree Capital, Llc | 6.930 | 0,70 | 349 | 0,29 | ||||
| 2026-04-27 | 13F | PAX Financial Group, LLC | 40.111 | 0,21 | 2.024 | 0,25 | ||||
| 2026-01-22 | 13F | Premier Path Wealth Partners, LLC | 21.023 | -12,27 | 1.060 | -12,47 | ||||
| 2026-02-17 | 13F | Raymond James Financial Inc | 299.620 | 3,99 | 15.110 | 3,70 | ||||
| 2026-04-17 | 13F | AdvisorNet Financial, Inc | 11.968 | -0,03 | 604 | 0,00 | ||||
| 2026-02-10 | 13F | Sittner & Nelson, Llc | 86.441 | 144,92 | 4.387 | 145,85 | ||||
| 2026-04-13 | 13F | IFP Advisors, Inc | 2.863 | 0,00 | 144 | 0,00 | ||||
| 2026-01-29 | 13F | UBS Group AG | 54.097 | -19,17 | 2.728 | -19,39 | ||||
| 2026-04-30 | 13F | Titleist Asset Management, Llc | 18.285 | 52,77 | 922 | 52,90 | ||||
| 2026-04-29 | 13F | Skopos Labs, Inc. | 5.187 | 262 | ||||||
| 2026-04-10 | 13F | Novem Group | 6.153 | 0,46 | 310 | 0,65 | ||||
| 2026-04-13 | 13F | Creative Financial Designs Inc /adv | 696 | 0,58 | 35 | 2,94 | ||||
| 2026-04-24 | 13F | Peoples Bank /oh | 4.001 | 202 | ||||||
| 2026-02-12 | 13F | Principal Securities, Inc. | 0 | -100,00 | 0 | -100,00 | ||||
| 2026-02-10 | 13F | Envestnet Asset Management Inc | 93.778 | 3,89 | 4.729 | 3,62 | ||||
| 2026-04-15 | 13F | Archford Capital Strategies, LLC | 4.571 | 231 | ||||||
| 2026-01-07 | 13F | BCGM Wealth Management, LLC | 22.459 | 1,56 | 1.133 | 1,25 | ||||
| 2025-11-13 | 13F | Parallel Advisors, LLC | 0 | -100,00 | 0 | -100,00 | ||||
| 2026-04-27 | 13F | Sierra Ocean, Llc | 14.136 | -0,50 | 713 | -0,42 | ||||
| 2026-04-15 | 13F | DAVENPORT & Co LLC | 44.660 | 8,16 | 2.253 | 8,21 | ||||
| 2026-04-28 | 13F | Stratos Wealth Partners, LTD. | 21.020 | 3,85 | 1.060 | 3,92 | ||||
| 2026-01-28 | 13F | Geneos Wealth Management Inc. | 2.880 | 99,86 | 145 | 101,39 | ||||
| 2026-02-12 | 13F | Hollencrest Capital Management | 21.145 | 1.378,67 | 1.066 | 1.380,56 | ||||
| 2026-02-17 | 13F | Mercer Global Advisors Inc /adv | 12.912 | 0,00 | 651 | -0,15 | ||||
| 2026-04-14 | 13F | William Mack & Associates, Inc. | 4.170 | -45,10 | 210 | -45,17 | ||||
| 2026-02-17 | 13F | Royal Bank Of Canada | 21.454 | 279,11 | 1.082 | 278,32 | ||||
| 2026-01-07 | 13F | Sagespring Wealth Partners, Llc | 472.897 | -15,32 | 23.848 | -15,55 | ||||
| 2025-11-14 | 13F | Strategic Wealth Partners, Ltd. | 11.501 | 582 | ||||||
| 2026-04-20 | 13F | L.K. Benson & Company, P.C. | 14.148 | 0,28 | 714 | 0,28 | ||||
| 2026-04-08 | 13F | Wealth Enhancement Advisory Services, Llc | 497.057 | -31,38 | 25.067 | -31,55 | ||||
| 2026-02-17 | 13F | Warren Averett Asset Management, LLC | 48.063 | -0,52 | 2.424 | -0,82 | ||||
| 2026-04-28 | 13F | Golden State Wealth Management, LLC | 15.608 | 0,11 | 787 | 0,13 | ||||
| 2026-01-07 | 13F | Cyndeo Wealth Partners, LLC | 0 | -100,00 | 0 | |||||
| 2026-04-21 | 13F | Biltmore Wealth Management, LLC | 418.529 | 3,57 | 21.115 | 3,61 | ||||
| 2026-04-08 | 13F | Dynamic Advisor Solutions LLC | 35.628 | 11,33 | 1.797 | 11,41 | ||||
| 2026-02-11 | 13F | Jpmorgan Chase & Co | 827.420 | -13,70 | 41.727 | -13,94 | ||||
| 2026-04-21 | 13F | Unique Wealth, Llc | 29.746 | -37,84 | 1.501 | -37,84 | ||||
| 2026-01-26 | 13F | Cwm, Llc | 711.164 | 3,45 | 36 | 2,94 | ||||
| 2026-04-20 | 13F | Skyline Advisors, Inc. | 18.125 | -17,95 | 914 | -17,88 | ||||
| 2026-02-13 | 13F | MAI Capital Management | 96.778 | 6,60 | 4.881 | 6,29 | ||||
| 2026-04-14 | 13F | Wealthcare Advisory Partners LLC | 11.632 | -0,13 | 587 | -0,17 | ||||
| 2026-04-16 | 13F | Capital Advisors, Ltd. LLC | 6.600 | 0,00 | 0 | |||||
| 2026-02-13 | 13F | Change Path, LLC | 12.295 | 14,60 | 620 | 14,39 | ||||
| 2026-02-13 | 13F | Centaurus Financial, Inc. | 3.443 | 0,73 | 0 | |||||
| 2026-04-29 | 13F | Envestnet Portfolio Solutions, Inc. | 5.241 | 1,93 | 264 | 1,93 | ||||
| 2026-02-06 | 13F | Rockport Wealth LLC | 19.391 | 287,82 | 978 | 287,70 | ||||
| 2026-02-11 | 13F | Gateway Wealth Partners, LLC | 77.366 | 10,86 | 3.902 | 10,54 | ||||
| 2026-04-29 | 13F | Axxcess Wealth Management, Llc | 0 | -100,00 | 0 | |||||
| 2026-02-11 | 13F | Mattson Financial Services, LLC | 4.030 | 0,52 | 203 | 0,50 | ||||
| 2026-04-10 | 13F | YHB Investment Advisors, Inc. | 57.687 | 19,37 | 2.910 | 19,41 | ||||
| 2026-04-16 | 13F | Quotient Wealth Partners, LLC | 133.748 | -2,88 | 6.748 | -2,85 | ||||
| 2026-02-13 | 13F | Smith Partners Wealth Management, LLC | 9.089 | 458 | ||||||
| 2026-02-13 | 13F | Baird Financial Group, Inc. | 8.038 | -1,70 | 405 | -1,94 | ||||
| 2026-02-12 | 13F | Summit Financial, LLC | 22.262 | 5,01 | 1.125 | 4,94 | ||||
| 2026-04-29 | 13F | CFS Investment Advisory Services, LLC | 56.963 | -3,70 | 2.879 | -3,52 | ||||
| 2026-01-29 | 13F | Sanctuary Advisors, LLC | 22.533 | 0,00 | 1.136 | -0,26 | ||||
| 2026-01-26 | 13F | AE Wealth Management LLC | 1.601 | 1.094,78 | 81 | 1.233,33 | ||||
| 2026-04-24 | 13F | Private Advisor Group, LLC | 5.635 | -29,82 | 284 | -29,70 | ||||
| 2026-04-27 | 13F | Kelman-Lazarov, Inc. | 161.103 | 16,58 | 8.128 | 16,63 | ||||
| 2026-04-10 | 13F | Summit Financial Consulting LLC | 15.252 | 4,49 | 769 | 4,48 | ||||
| 2026-02-05 | 13F | Evergreen Wealth Partners LLC | 10.843 | 547 | ||||||
| 2026-04-17 | 13F | Morris Financial Concepts, Inc. | 4.746 | 75,78 | 239 | 75,74 | ||||
| 2026-04-30 | 13F | Equitable Trust Co | 5.651 | -0,48 | 285 | -0,35 | ||||
| 2026-02-10 | 13F | Dynasty Wealth Management, Llc | 0 | -100,00 | 0 | |||||
| 2026-02-17 | 13F | Citadel Advisors Llc | 65.152 | 254,90 | 3.286 | 253,99 | ||||
| 2026-02-26 | 13F | TD Capital Management LLC | 382.953 | 5,11 | 19.312 | 4,82 | ||||
| 2026-04-08 | 13F | StoneCrest Wealth Management, Inc. | 26.707 | 0,00 | 1.347 | 0,07 | ||||
| 2026-04-15 | 13F | Merit Financial Group, LLC | 6.082 | -4,46 | 307 | -4,67 | ||||
| 2026-02-13 | 13F | Wells Fargo & Company/mn | 264.974 | -1,02 | 13.363 | -1,30 | ||||
| 2026-04-20 | 13F | Ronald Blue Trust, Inc. | 2.511 | 0,00 | 127 | 0,00 | ||||
| 2026-02-20 | 13F | Sunbelt Securities, Inc. | 150 | 0,00 | 8 | 0,00 | ||||
| 2026-04-30 | 13F | Cambridge Investment Research Advisors, Inc. | 15.649 | -46,06 | 1 | -100,00 | ||||
| 2026-02-12 | 13F | Jane Street Group, Llc | 20.440 | 1.031 | ||||||
| 2026-04-15 | 13F | Websterrogers Financial Advisors, Llc | 160.943 | 5,65 | 8.120 | 5,69 | ||||
| 2026-04-24 | 13F | Key FInancial Inc | 989 | 0,00 | 50 | 0,00 | ||||
| 2026-01-30 | 13F | Us Bancorp \de\ | 110 | 0,00 | 6 | 0,00 | ||||
| 2026-02-13 | 13F | Mml Investors Services, Llc | 32.140 | 11,18 | 1.621 | 10,88 | ||||
| 2026-02-11 | 13F | O'shaughnessy Asset Management, Llc | 560 | 1,63 | 28 | 3,70 | ||||
| 2026-02-17 | 13F | Jones Financial Companies Lllp | 27.913 | 19,27 | 1.408 | 18,83 | ||||
| 2026-04-21 | 13F | Oak Wealth Advisors LLC | 17.795 | 13,91 | 898 | 13,98 | ||||
| 2026-01-21 | 13F | Newbridge Financial Services Group, Inc. | 0 | -100,00 | 0 | |||||
| 2026-01-27 | 13F | Summit Financial Strategies, Inc. | 32.759 | 12,25 | 1.652 | 12,00 |