Grundlæggende statistik
| Institutionelle ejere | 471 total, 467 long only, 0 short only, 4 long/short - change of 13,22% MRQ |
| Gennemsnitlig porteføljeallokering | 0.4360 % - change of -2,96% MRQ |
| Institutionelle aktier (lange) | 61.255.255 (ex 13D/G) - change of 0,71MM shares 1,17% MRQ |
| Institutionel værdi (lang) | $ 2.441.572 USD ($1000) |
Institutionelt ejerskab og aktionærer
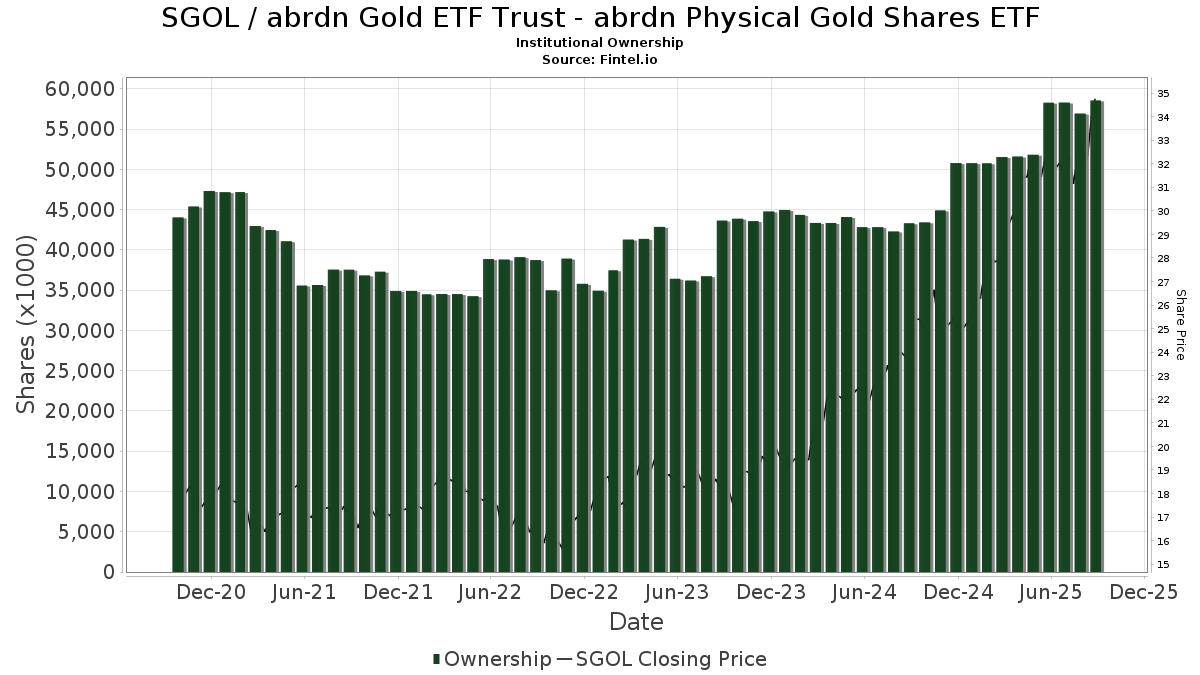
abrdn Gold ETF Trust - abrdn Physical Gold Shares ETF (US:SGOL) har 471 institutionelle ejere og aktionærer, der har indsendt 13D/G- eller 13F-formularer til Securities Exchange Commission (SEC). Disse institutioner har i alt 61,255,255 aktier. Største aktionærer omfatter Metis Global Partners, LLC, Jpmorgan Chase & Co, Bank Of America Corp /de/, Wells Fargo & Company/mn, Morgan Stanley, LPL Financial LLC, HighTower Advisors, LLC, UBS Group AG, Guardian Point Capital, Lp, and Pure Portfolios Holdings Llc .
abrdn Gold ETF Trust - abrdn Physical Gold Shares ETF (ARCA:SGOL) institutionel ejerskabsstruktur viser aktuelle positioner i virksomheden efter institutioner og fonde, samt seneste ændringer i positionsstørrelse. Større aktionærer kan omfatte individuelle investorer, investeringsforeninger, hedgefonde eller institutioner. Skema 13D angiver, at investoren besidder (eller besidder) mere end 5 % af virksomheden og har til hensigt (eller har til hensigt at) aktivt at forfølge en ændring i forretningsstrategi. Skema 13G indikerer en passiv investering på over 5%.
The share price as of April 14, 2026 is 46,16 / share. Previously, on April 15, 2025, the share price was 30,83 / share. This represents an increase of 49,72% over that period.
Fondens stemningsscore
Fund Sentiment Score (fka Ownership Accumulation Score) finder de aktier, der bliver mest købt af fonde. Det er resultatet af en sofistikeret, multi-faktor kvantitativ model, der identificerer virksomheder med de højeste niveauer af institutionel akkumulering. Scoringsmodellen bruger en kombination af den samlede stigning i oplyste ejere, ændringerne i porteføljeallokeringer i disse ejere og andre målinger. Tallet går fra 0 til 100, hvor højere tal indikerer et højere niveau af akkumulering for sine jævnaldrende, og 50 er gennemsnittet.
Opdateringsfrekvens: Dagligt
Se Ownership Explorer, som giver en liste over højest rangerende virksomheder.
AI+ Ask Fintel’s AI assistant about abrdn Gold ETF Trust - abrdn Physical Gold Shares ETF.
Select a question to share a public post with an AI-crafted answer.
Thinking of good questions…
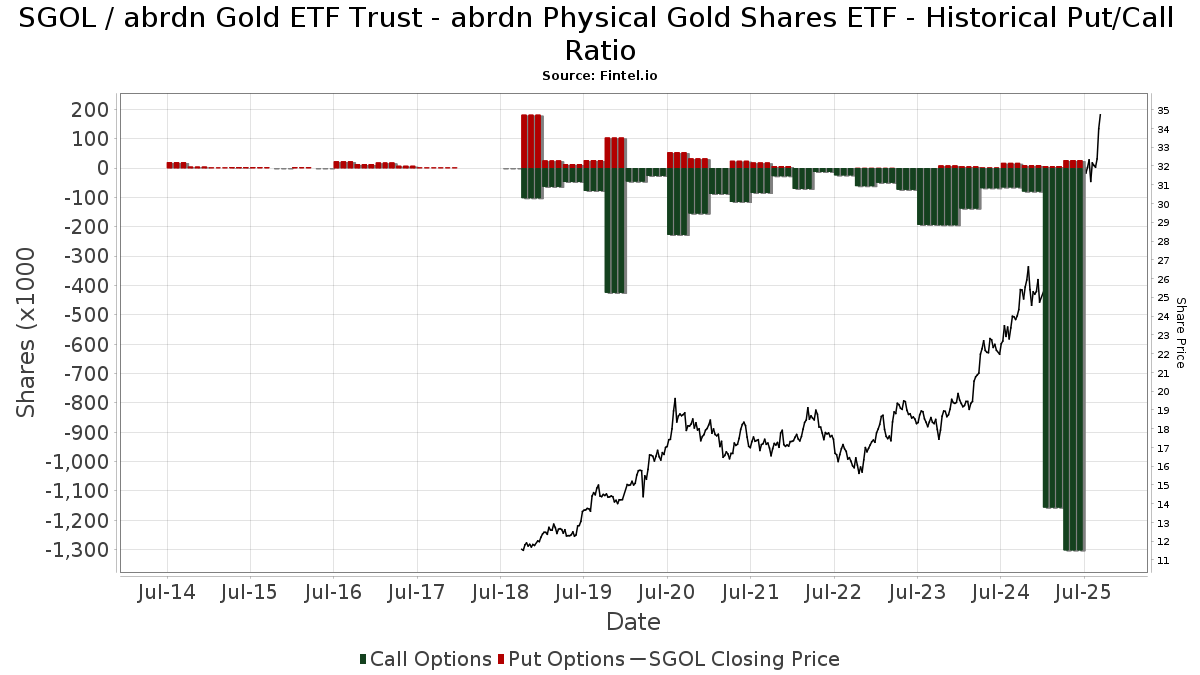
Institutionel Put/Call-forhold
Ud over at indberette standardaktie- og gældsudstedelser skal institutter med mere end 100 mill. aktiver under forvaltning også oplyse deres put- og call-optionsbeholdninger. Da salgsoptioner generelt indikerer negativ stemning, og købsoptioner indikerer positiv stemning, kan vi få en fornemmelse af den overordnede institutionelle stemning ved at plotte forholdet mellem put og kald. Diagrammet til højre viser det historiske put/call-forhold for dette instrument.
Brug af Put/Call Ratio som en indikator for investorernes stemning overvinder en af de vigtigste mangler ved at bruge totalt institutionelt ejerskab, som er, at en betydelig mængde af aktiver under forvaltning investeres passivt for at spore indekser. Passivt forvaltede fonde køber typisk ikke optioner, så indikatoren for put/call-forholdet følger mere nøje følelsen af aktivt forvaltede fonde.
13F og NPORT arkivering
Detaljer om 13F-arkivering er gratis. Detaljer om NP-ansøgninger kræver et premium-medlemskab. Grønne rækker angiver nye positioner. Røde rækker angiver lukkede positioner. Klik på linket ikon for at se den fulde transaktionshistorik.
Opgrader
for at låse premium-data op og eksportere til Excel ![]() .
.
| Fil dato | Kilde | Investor | Type | Gennemsnitlig pris (Øst) |
Aktier | Δ Aktier (%) |
Rapporteret Værdi ($1000) |
Δ Værdi (%) |
Port Alloc (%) |
|
|---|---|---|---|---|---|---|---|---|---|---|
| 2026-02-12 | 13F | Hudock, Inc. | 7.705 | 0,00 | 317 | 11,66 | ||||
| 2026-02-17 | 13F | Cambria Investment Management, L.P. | 12.597 | -5,81 | 517 | 5,08 | ||||
| 2026-02-04 | 13F | Tsfg, Llc | 200 | 0,00 | 0 | |||||
| 2026-02-17 | 13F | Quadrature Capital Ltd | 7.360 | -97,80 | 302 | -97,54 | ||||
| 2026-01-20 | 13F | Stratos Wealth Partners, LTD. | 41.960 | -6,69 | 1.724 | 4,11 | ||||
| 2026-01-29 | 13F | D.a. Davidson & Co. | 16.628 | -5,73 | 683 | 5,24 | ||||
| 2026-02-11 | 13F | Metis Global Partners, LLC | 6.150.494 | -9,67 | 252.662 | 0,81 | ||||
| 2026-01-23 | 13F | Bellevue Asset Management, Llc | 419 | 0,00 | 17 | 13,33 | ||||
| 2026-01-26 | 13F | Chicago Capital, LLC | 24.740 | 0,00 | 1.016 | 11,65 | ||||
| 2026-02-03 | 13F | Encompass More Asset Management | 371.305 | 1,84 | 15.253 | 13,66 | ||||
| 2026-01-26 | 13F | Independent Wealth Network Inc. | 7.457 | 0,00 | 306 | 11,68 | ||||
| 2026-01-29 | 13F | UBS Group AG | 1.736.674 | 2,61 | 71.343 | 14,51 | ||||
| 2026-01-23 | 13F | Timber Creek Capital Management LLC | 231.721 | 0,46 | 9.519 | 12,12 | ||||
| 2026-04-08 | 13F | Stonebridge Financial Group, LLC | 390.730 | -9,09 | 17.434 | -1,25 | ||||
| 2026-02-18 | 13F | Garton & Associates Financial Advisors LLC | 2.536 | 104 | ||||||
| 2026-02-06 | 13F | Marble Harbor Investment Counsel, LLC | 54.600 | 0,00 | 2.243 | 11,60 | ||||
| 2026-02-17 | 13F | Equitable Holdings, Inc. | 122.575 | -11,11 | 5.035 | -0,79 | ||||
| 2025-11-14 | 13F | Pureheart Capital Pte Ltd. | 0 | -100,00 | 0 | |||||
| 2026-01-30 | 13F | North Star Investment Management Corp. | 0 | -100,00 | 0 | |||||
| 2026-02-12 | 13F | Renaissance Technologies Llc | 49.500 | -87,80 | 2.033 | -86,39 | ||||
| 2026-02-20 | 13F | Sunbelt Securities, Inc. | 4.660 | 0,00 | 191 | 11,70 | ||||
| 2026-01-29 | 13F | Concurrent Investment Advisors, LLC | 11.952 | 0,00 | 491 | 11,62 | ||||
| 2026-04-10 | 13F | Armstrong Advisory Group, Inc | 1.350 | 0,00 | 60 | 9,09 | ||||
| 2025-11-14 | 13F | Bnp Paribas | 0 | -100,00 | 0 | |||||
| 2026-01-22 | 13F | Vicus Capital | 9.430 | -2,90 | 387 | 8,40 | ||||
| 2026-01-14 | 13F | A. D. Beadell Investment Counsel, Inc. | 72.400 | -1,43 | 3 | 0,00 | ||||
| 2026-01-23 | 13F | Natural Investments, Llc | 5.154 | -7,20 | 0 | |||||
| 2026-02-09 | 13F | Leavell Investment Management, Inc. | 26.301 | 34,44 | 1.080 | 50,00 | ||||
| 2026-02-17 | 13F | Snowden Capital Advisors LLC | 15.635 | 2,98 | 642 | 15,05 | ||||
| 2026-02-10 | 13F | Avestar Capital, LLC | 227.857 | 25,81 | 9.360 | 40,41 | ||||
| 2026-01-14 | 13F | Global View Capital Management LLC | 85.421 | -82,66 | 3.509 | -80,65 | ||||
| 2026-01-26 | 13F | Whittier Trust Co | 30.300 | 0,00 | 1.298 | 15,60 | ||||
| 2026-02-11 | 13F | J.w. Cole Advisors, Inc. | 20.940 | 40,42 | 824 | 50,18 | ||||
| 2026-01-26 | 13F | Roman Butler Fullerton & Co | 25.420 | -1,27 | 1.179 | 21,69 | ||||
| 2026-02-11 | 13F | Janney Montgomery Scott LLC | 22.772 | -5,16 | 1 | |||||
| 2026-04-13 | 13F | Plan Group Financial, LLC | 51.600 | -1,90 | 2.302 | 6,57 | ||||
| 2026-02-13 | 13F | Commerce Bank | 47.097 | 0,00 | 1.935 | 11,60 | ||||
| 2026-01-20 | 13F | Arta Finance Wealth Management LLC | 33.175 | 1.363 | ||||||
| 2026-04-10 | 13F | Centurion Wealth Management LLC | 93.555 | -1,32 | 4.174 | 7,19 | ||||
| 2026-01-23 | 13F | Assetmark, Inc | 439 | 0,00 | 18 | 12,50 | ||||
| 2026-01-12 | 13F | Skyline Advisors, Inc. | 9.000 | 0,00 | 370 | 11,48 | ||||
| 2026-01-21 | 13F | Sound Income Strategies, LLC | 420 | -52,81 | 18 | -45,45 | ||||
| 2026-01-22 | 13F | True North Advisors, LLC | 83.816 | 2,57 | 3.443 | 14,50 | ||||
| 2026-02-19 | 13F | Claris Financial LLC | 20.139 | -11,21 | 827 | -0,84 | ||||
| 2026-02-06 | 13F | Pnc Financial Services Group, Inc. | 4.619 | 0,00 | 190 | 11,18 | ||||
| 2026-02-17 | 13F | Glenmede Trust Co Na | 6.928 | -10,61 | 285 | 22,94 | ||||
| 2026-02-13 | 13F | Brown Advisory Inc | 11.592 | -27,30 | 476 | -18,77 | ||||
| 2026-02-12 | 13F | Fortress Private Ledger, Llc | 7.930 | 44,18 | 326 | 60,89 | ||||
| 2026-01-12 | 13F | Optivise Advisory Services LLC | 5.385 | 221 | ||||||
| 2026-01-26 | 13F | Asset Dedication, LLC | 2.561 | 0,00 | 105 | 11,70 | ||||
| 2026-02-04 | 13F | Ameritas Advisory Services, LLC | 0 | -100,00 | 0 | |||||
| 2026-02-11 | 13F | Modus Advisors, LLC | 370 | 15 | ||||||
| 2026-02-12 | 13F | Steward Partners Investment Advisory, Llc | 13.853 | -4,88 | 569 | 6,16 | ||||
| 2026-01-30 | 13F | Us Bancorp \de\ | 268.556 | 0,00 | 11.032 | 11,60 | ||||
| 2026-01-20 | 13F | Trust Co Of Toledo Na /oh/ | 24.665 | -33,47 | 1.013 | -25,73 | ||||
| 2025-10-17 | 13F | Warren Street Wealth Advisors, LLC | 0 | -100,00 | 0 | -100,00 | ||||
| 2026-02-10 | 13F | American Money Management, LLC | 18.123 | 4,17 | 744 | 16,25 | ||||
| 2026-01-23 | 13F | Eagle Bay Advisors LLC | 16.751 | 688 | ||||||
| 2026-01-20 | 13F | Savvy Advisors, Inc. | 460.111 | -4,07 | 18.901 | 7,06 | ||||
| 2026-01-29 | 13F | Kestra Private Wealth Services, Llc | 7.922 | 11,53 | 325 | 24,52 | ||||
| 2026-02-05 | 13F | Cambridge Investment Research Advisors, Inc. | 326.352 | -6,94 | 13 | 8,33 | ||||
| 2026-02-13 | 13F | Stifel Financial Corp | 147.788 | 10,35 | 6.071 | 23,17 | ||||
| 2026-02-10 | 13F | Meramec Financial Planners, LLC | 5 | 0 | ||||||
| 2026-01-23 | 13F | Fifth Third Securities, Inc. | 9.508 | 391 | ||||||
| 2026-02-10 | 13F | Evolution Wealth Management Inc. | 183 | 0,00 | 8 | 16,67 | ||||
| 2026-01-30 | 13F | Sage Rhino Capital Llc | 6.425 | 264 | ||||||
| 2026-02-17 | 13F | Capital Wealth Alliance, LLC | 9.645 | -7,90 | 467 | 21,04 | ||||
| 2026-02-17 | 13F | Aqr Capital Management Llc | 293.747 | 0,27 | 12.067 | 11,91 | ||||
| 2026-02-17 | 13F | Pinnacle Financial Partners, Inc. | 107.937 | 4.434 | ||||||
| 2026-01-30 | 13F | Pekin Hardy Strauss, Inc. | 85.085 | 5,58 | 3.495 | 17,84 | ||||
| 2026-02-13 | 13F | Cape Cod Five Cents Savings Bank | 100.068 | 0,00 | 2.515 | 0,00 | ||||
| 2026-02-12 | 13F | Proficio Capital Partners LLC | 120.423 | 0,00 | 4.947 | 11,60 | ||||
| 2026-01-23 | 13F | Asset Advisors Investment Management, LLC | 13.800 | -3,02 | 567 | 8,22 | ||||
| 2026-02-24 | 13F | Tru Independence Asset Management 2, Llc | 14.000 | 0,00 | 575 | 11,65 | ||||
| 2026-02-13 | 13F | Change Path, LLC | 13.559 | 50,32 | 557 | 67,47 | ||||
| 2026-01-30 | 13F | Strategic Blueprint, LLC | 7.598 | -0,48 | 312 | 11,03 | ||||
| 2026-02-13 | 13F | Luminist Capital LLC | 133.097 | -3,75 | 5.467 | 7,22 | ||||
| 2026-01-20 | 13F | Sheets Smith Wealth Management | 57.286 | -3,08 | 2.353 | 8,18 | ||||
| 2026-02-11 | 13F | Ameritas Investment Partners, Inc. | 75 | 3 | ||||||
| 2026-01-21 | 13F | Mayfair Advisory Group, LLC | 11.000 | -8,33 | 454 | 2,95 | ||||
| 2026-02-11 | 13F | SlateStone Wealth, LLC | 11.220 | -22,99 | 0 | |||||
| 2025-11-10 | 13F | Colonial Trust Advisors | 0 | -100,00 | 0 | |||||
| 2026-02-10 | 13F | Sfmg, Llc | 10.000 | 0,00 | 411 | 11,41 | ||||
| 2026-01-23 | 13F | Elevate Capital Advisors, LLC | 49.663 | -12,41 | 2.040 | -2,25 | ||||
| 2026-02-11 | 13F | Tradition Wealth Management, LLC | 22.247 | -6,58 | 914 | 4,22 | ||||
| 2026-01-12 | 13F | Castleview Partners, Llc | 14.130 | 580 | ||||||
| 2026-01-22 | 13F | Iron Financial, LLC | 7.667 | 2,66 | 315 | 14,60 | ||||
| 2026-03-16 | 13F | Osbon Capital Management Llc | 26.658 | 154,06 | 1.095 | -23,27 | ||||
| 2026-04-13 | 13F | IFP Advisors, Inc | 49.315 | 2,44 | 2.200 | 11,28 | ||||
| 2026-04-13 | 13F | Cypress Point Wealth Management, LLC | 10.318 | 0,00 | 460 | 8,75 | ||||
| 2026-02-17 | 13F | Ancora Advisors, LLC | 330 | 0,00 | 14 | 8,33 | ||||
| 2026-04-10 | 13F | Perigon Wealth Management, LLC | 24.464 | 0,00 | 1.092 | 8,67 | ||||
| 2026-01-20 | 13F | AdvisorNet Financial, Inc | 14.784 | 7,06 | 607 | 19,49 | ||||
| 2026-01-27 | 13F | Elevated Capital Advisors, LLC | 6.140 | 0,00 | 252 | 11,50 | ||||
| 2026-02-06 | 13F | Empirical Asset Management, LLC | 205.971 | 21,59 | 8.461 | 35,70 | ||||
| 2026-01-15 | 13F | Brookstone Capital Management | 91.589 | 2,87 | 3.762 | 14,80 | ||||
| 2026-02-05 | 13F | Atria Investments Llc | 46.287 | 23,34 | 1.901 | 37,65 | ||||
| 2026-02-13 | 13F | Kensington Asset Management, LLC | 278.002 | 62,88 | 11.501 | 83,06 | ||||
| 2026-02-17 | 13F | Tudor Investment Corp Et Al | 392.008 | 16.104 | ||||||
| 2026-02-12 | 13F | Callan Family Office, LLC | 9.663 | 0,37 | 397 | 11,86 | ||||
| 2026-01-20 | 13F | Aspiriant, Llc | 5.213 | 214 | ||||||
| 2026-01-23 | 13F | Financial Designs Corp | 12.997 | 5,91 | 534 | 14,13 | ||||
| 2026-02-13 | 13F | Centerpoint Advisors, LLC | 3.224 | 0,00 | 0 | |||||
| 2026-02-06 | 13F | Mjp Associates Inc /adv | 7.598 | 33,25 | 312 | 49,28 | ||||
| 2026-01-15 | 13F | SILVER OAK SECURITIES, Inc | 43.018 | 0,18 | 1.780 | 12,59 | ||||
| 2025-11-14 | 13F | Capitolis Liquid Global Markets LLC | 0 | -100,00 | 0 | |||||
| 2026-02-12 | 13F | Hrt Financial Lp | 27.939 | -39,86 | 1 | 0,00 | ||||
| 2026-01-21 | 13F | MBA Advisors LLC | 4.970 | 204 | ||||||
| 2026-02-09 | 13F | White Lighthouse Investment Management Inc. | 34.590 | -6,37 | 1.421 | 4,49 | ||||
| 2026-02-13 | 13F | Tcfg Wealth Management, Llc | 8.801 | -8,97 | 362 | 1,69 | ||||
| 2026-02-06 | 13F | Larson Financial Group LLC | 7.823 | -4,86 | 321 | 6,29 | ||||
| 2026-01-26 | 13F | Merit Financial Group, LLC | 376.004 | -2,27 | 15.446 | 9,07 | ||||
| 2026-01-14 | 13F | Cushing Capital Partners, LLC | 7.992 | -1,54 | 328 | 10,07 | ||||
| 2026-01-30 | 13F | Caldwell Securities, Inc | 11.561 | -10,87 | 475 | -0,63 | ||||
| 2026-01-27 | 13F | Belpointe Asset Management LLC | 47.058 | 43,74 | 1.933 | 60,41 | ||||
| 2026-04-07 | 13F | Fragasso Group Inc. | 0 | -100,00 | 0 | |||||
| 2026-02-17 | 13F | Mountain Lake Investment Management LLC | 0 | -100,00 | 0 | |||||
| 2026-01-14 | 13F/A | TABR Capital Management, LLC | 7.717 | 317 | ||||||
| 2026-04-07 | 13F | Farther Finance Advisors, LLC | 24.514 | 191,07 | 1.113 | 222,32 | ||||
| 2026-02-12 | 13F | Brinker Capital Investments, LLC | 11.004 | 18,89 | 452 | 32,94 | ||||
| 2026-02-17 | 13F | Waverton Investment Management Ltd | 0 | -100,00 | 0 | -100,00 | ||||
| 2026-01-30 | 13F | Towneley Capital Management, Inc / DE | 584.802 | -3,71 | 24.024 | 7,46 | ||||
| 2026-02-06 | 13F | BOK Financial Private Wealth, Inc. | 400 | 16 | ||||||
| 2026-01-21 | 13F | Flagship Harbor Advisors, Llc | 6.147 | 11,22 | 253 | 24,14 | ||||
| 2026-02-10 | 13F | DT Investment Partners, LLC | 55 | 2 | ||||||
| 2026-02-17 | 13F | GeoWealth Management, LLC | 8.433 | -85,96 | 346 | -84,35 | ||||
| 2026-04-15 | 13F | Seacrest Wealth Management, Llc | 5.116 | 0,00 | 228 | 5,07 | ||||
| 2026-02-13 | 13F | Headlands Technologies LLC | 51.571 | 553,21 | 2.119 | 630,34 | ||||
| 2026-02-03 | 13F | Amara Financial, Llc. | 81.712 | -3,32 | 3.357 | 7,88 | ||||
| 2026-02-12 | 13F | Federation des caisses Desjardins du Quebec | 1.100 | 0,00 | 45 | 12,50 | ||||
| 2026-02-17 | 13F | Main Street Financial Solutions, LLC | 7.888 | 324 | ||||||
| 2026-02-17 | 13F | Boothbay Fund Management, Llc | 29.200 | 5,04 | 1.200 | 17,20 | ||||
| 2025-11-14 | 13F | Wolverine Trading, Llc | 41.476 | 4,84 | 1.514 | 22,79 | ||||
| 2026-01-21 | 13F | Stapp Wealth Management, Pllc | 29.776 | -27,01 | 1.223 | -18,52 | ||||
| 2025-11-14 | 13F | Wolverine Trading, Llc | Call | 42.600 | 3,15 | 1.555 | 20,73 | |||
| 2026-02-02 | 13F | New England Capital Financial Advisors LLC | 413 | 0,00 | 17 | 6,67 | ||||
| 2026-02-17 | 13F | Mercer Global Advisors Inc /adv | 30.030 | 134,92 | 1.234 | 162,34 | ||||
| 2025-11-14 | 13F | Wolverine Trading, Llc | Put | 10.200 | 8,51 | 372 | 26,96 | |||
| 2026-02-13 | 13F | MAI Capital Management | 549.620 | -0,35 | 22.578 | 11,21 | ||||
| 2026-04-14 | 13F | Beacon Investment Advisory Services, Inc. | 4.661 | 208 | ||||||
| 2026-01-15 | 13F | Jamison Private Wealth Management, Inc. | 15.302 | 0,00 | 629 | 11,55 | ||||
| 2026-02-06 | 13F | Vestmark Advisory Solutions, Inc. | 6.545 | 269 | ||||||
| 2026-02-06 | 13F | Cypress Capital, LLC | 319.126 | -0,47 | 13.110 | 11,08 | ||||
| 2026-02-17 | 13F | Wiley Bros.-aintree Capital, Llc | 8.681 | 0,00 | 357 | 11,60 | ||||
| 2026-02-18 | 13F | Kastel Capital Advisors, LLC | 103.347 | 4.245 | ||||||
| 2026-04-08 | 13F | Holos Integrated Wealth LLC | 300 | 13 | ||||||
| 2025-11-06 | 13F | Financial Advocates Investment Management | 0 | -100,00 | 0 | |||||
| 2026-04-13 | 13F | Nvest Wealth Strategies, Inc. | 1.250 | 0,00 | 56 | 7,84 | ||||
| 2026-02-13 | 13F | B & T Capital Management DBA Alpha Capital Management | 8.443 | 0,00 | 347 | 11,61 | ||||
| 2026-04-08 | 13F | BOS Asset Management, LLC | 70.675 | -0,56 | 3.154 | 8,02 | ||||
| 2026-01-21 | 13F | New Wave Wealth Advisors Llc | 6.145 | 0,00 | 252 | 11,50 | ||||
| 2026-04-13 | 13F | Trust Co | 1.250 | 0,00 | 56 | 7,84 | ||||
| 2026-01-14 | 13F | Net Worth Advisory Group | 7.902 | 41,41 | 325 | 58,05 | ||||
| 2026-02-02 | 13F | Avidian Wealth Solutions, LLC | 14.128 | -32,56 | 580 | -24,77 | ||||
| 2025-11-14 | 13F | Flow Traders U.s. Llc | 0 | -100,00 | 0 | |||||
| 2026-02-17 | 13F | WFA of San Diego, LLC | 0 | -100,00 | 0 | |||||
| 2026-01-14 | 13F | Jfs Wealth Advisors, Llc | 114 | 0,00 | 5 | 0,00 | ||||
| 2026-01-28 | 13F | Geneos Wealth Management Inc. | 2.712 | 0,00 | 111 | 12,12 | ||||
| 2026-01-21 | 13F | Ameliora Wealth Management Ltd. | 588.218 | 15,76 | 24.160 | 29,18 | ||||
| 2025-11-13 | 13F | Total Investment Management Inc | 0 | -100,00 | 0 | |||||
| 2026-02-11 | 13F | Cooper/haims Advisors, Llc | 9.669 | 397 | ||||||
| 2026-01-30 | 13F | AMG National Trust Bank | 15.000 | 0,00 | 616 | 11,59 | ||||
| 2026-02-13 | 13F | Evelyn Partners Investment Management Services Ltd | 61.980 | 28,41 | 2.546 | 43,36 | ||||
| 2026-02-10 | 13F | Lido Advisors, LLC | 18.623 | 0,00 | 686 | 0,00 | ||||
| 2026-01-23 | 13F | Northland Securities, Inc. | 7.696 | 316 | ||||||
| 2026-02-17 | 13F | Citadel Advisors Llc | Put | 24.300 | 998 | |||||
| 2026-02-09 | 13F | Harbour Investments, Inc. | 133.037 | 6,56 | 5.465 | 18,93 | ||||
| 2026-02-17 | 13F | Citadel Advisors Llc | 231.136 | -7,86 | 9.495 | 2,83 | ||||
| 2026-02-17 | 13F | Scarborough Advisors, LLC | 93 | 19,23 | 4 | 50,00 | ||||
| 2026-02-17 | 13F | Citadel Advisors Llc | Call | 39.200 | -43,60 | 1.610 | -37,06 | |||
| 2025-11-12 | 13F | CIBC Bancorp USA Inc. | 22.479 | 827 | ||||||
| 2026-02-10 | 13F | SCS Capital Management LLC | 17.572 | 0,00 | 722 | 11,61 | ||||
| 2026-04-14 | 13F | Focus Financial Network, Inc. | 358.416 | 0,08 | 15.993 | 8,70 | ||||
| 2026-02-11 | 13F | Group One Trading, L.p. | 38.626 | 96,99 | 1.587 | 119,97 | ||||
| 2026-02-23 | 13F | Blue Capital, Inc. | 27.645 | -33,05 | 1.136 | -25,28 | ||||
| 2026-01-20 | 13F | Sanibel Captiva Trust Company, Inc. | 5.071 | 208 | ||||||
| 2026-02-04 | 13F | Timonier Family Office, LTD. | 12.084 | 0,00 | 496 | 11,71 | ||||
| 2026-02-17 | 13F | Amussen Hunsaker Associates Llc | 7.790 | -13,23 | 320 | -3,03 | ||||
| 2026-01-09 | 13F | 180 Wealth Advisors, Llc | 302.007 | 1,43 | 12.406 | 13,20 | ||||
| 2026-02-12 | 13F | First Financial Bankshares Inc | 5.100 | 210 | ||||||
| 2026-02-12 | 13F | Tocqueville Asset Management L.p. | 48.150 | 0,00 | 1.978 | 11,63 | ||||
| 2026-01-28 | 13F | HB Wealth Management, LLC | 31.310 | 0,00 | 1.286 | 11,63 | ||||
| 2026-01-16 | 13F | Bay Capital Advisors, LLC | 26.068 | -0,88 | 1.071 | 10,54 | ||||
| 2026-02-12 | 13F | Wedbush Securities Inc | 17.729 | 1,29 | 1 | |||||
| 2026-02-11 | 13F | LPL Financial LLC | 2.059.659 | 17,10 | 84.611 | 30,68 | ||||
| 2026-02-06 | 13F | HighTower Advisors, LLC | 1.833.770 | -1,69 | 75.331 | 9,72 | ||||
| 2026-04-08 | 13F | Legacy Wealth Asset Management, LLC | 54.254 | -6,06 | 2.421 | 2,02 | ||||
| 2026-01-22 | 13F | Castle Wealth Management Llc | 21.000 | 863 | ||||||
| 2026-04-07 | 13F | Investment Partners Asset Management, Inc. | 39.463 | -18,04 | 1.761 | -10,98 | ||||
| 2026-01-27 | 13F | GHP Investment Advisors, Inc. | 2.647 | 0,00 | 109 | 11,34 | ||||
| 2026-02-05 | 13F | Allworth Financial LP | 14.524 | -14,55 | 597 | -4,64 | ||||
| 2026-01-27 | 13F | Hedges Asset Management LLC | 8.000 | 0,00 | 329 | 11,56 | ||||
| 2026-02-12 | 13F | StoneX Group Inc. | 10.052 | 413 | ||||||
| 2026-02-13 | 13F | Ausdal Financial Partners, Inc. | 17.460 | -17,22 | 717 | -7,60 | ||||
| 2026-02-11 | 13F | Franklin Resources Inc | 258.247 | -0,03 | 10.609 | 11,56 | ||||
| 2026-01-28 | 13F | Nadler Financial Group, Inc. | 0 | -100,00 | 0 | -100,00 | ||||
| 2026-02-02 | 13F | JDM Financial Group LLC | 0 | -100,00 | 0 | |||||
| 2026-02-05 | 13F | Cardinal Point Capital Management, ULC | 11.742 | 0,00 | 482 | 4,78 | ||||
| 2026-04-08 | 13F | Ervin Investment Management, LLC | 144.420 | -1,67 | 6.444 | 6,81 | ||||
| 2026-01-21 | 13F | Capital Management Associates, Inc | 284.253 | -3,19 | 11.677 | 8,04 | ||||
| 2026-01-29 | 13F | Comerica Bank | 35.982 | -9,00 | 1.478 | 1,58 | ||||
| 2026-01-20 | 13F | Ethos Financial Group, LLC | 997.325 | 2,46 | 40.970 | 14,34 | ||||
| 2026-02-04 | 13F | Nwam Llc | 13.176 | -9,86 | 635 | 3,93 | ||||
| 2026-02-13 | 13F | Mml Investors Services, Llc | 460.084 | -2,14 | 18.900 | 9,21 | ||||
| 2026-02-17 | 13F | LB Partners LLC | 11.000 | 0,00 | 452 | 11,63 | ||||
| 2026-01-30 | 13F | Urban Wealth Management, LLC | 6.337 | -24,24 | 260 | 79,31 | ||||
| 2026-03-25 | 13F | Mission Financial Group, LLC | 21.212 | 871 | ||||||
| 2026-01-20 | 13F | Jackson Wealth Management, LLC | 5.317 | -14,83 | 218 | -5,22 | ||||
| 2026-02-06 | 13F | Axxcess Wealth Management, Llc | 28.920 | 1.188 | ||||||
| 2026-02-03 | 13F | Costello Asset Management, INC | 2.651 | 3,92 | 109 | 16,13 | ||||
| 2026-02-18 | 13F | Vident Advisory, LLC | 38.939 | 9,67 | 1.600 | 22,43 | ||||
| 2026-02-13 | 13F | Cozad Asset Management Inc | 12.200 | 5,17 | 501 | 17,61 | ||||
| 2026-01-14 | 13F | Worth Asset Management, LLC | 109.648 | 56,40 | 4.504 | 74,57 | ||||
| 2026-02-04 | 13F | Atlantic Union Bankshares Corp | 30 | 0,00 | 1 | 0,00 | ||||
| 2026-04-10 | 13F | Abound Wealth Management | 209 | 9 | ||||||
| 2026-04-08 | 13F | Castle Rock Wealth Management, LLC | 7.596 | -87,55 | 338 | -88,14 | ||||
| 2026-02-06 | 13F | Cascade Financial Partners, LLC | 12.370 | 0,00 | 508 | 11,65 | ||||
| 2026-04-07 | 13F | City Center Advisors, LLC | 11.249 | -16,33 | 502 | -9,24 | ||||
| 2026-04-02 | 13F | Aspect Partners, LLC | 78.781 | -0,49 | 3.515 | 8,09 | ||||
| 2026-01-30 | 13F | Narwhal Capital Management | 116.026 | 0,02 | 4.766 | 11,64 | ||||
| 2026-02-09 | 13F | Choate Investment Advisors | 346.383 | 13,18 | 14.229 | 26,31 | ||||
| 2026-04-14 | 13F | Foresight Capital Management Advisors, Inc. | 0 | -100,00 | 0 | |||||
| 2025-11-10 | 13F | Tableaux Llc | 0 | -100,00 | 0 | |||||
| 2026-01-22 | 13F | Fiduciary Alliance LLC | 257.637 | 22,82 | 10.584 | 37,07 | ||||
| 2026-02-13 | 13F | Cordoba Advisory Partners LLC | 22.758 | 935 | ||||||
| 2026-01-20 | 13F | Princeton Global Asset Management LLC | 250 | 0,00 | 10 | 11,11 | ||||
| 2026-02-10 | 13F/A | Northwestern Mutual Wealth Management Co | 128.572 | 60,39 | 5.282 | 79,02 | ||||
| 2026-01-15 | 13F | J. Safra Sarasin Holding AG | 5.665 | 0,00 | 234 | 13,59 | ||||
| 2026-02-17 | 13F | Ameriprise Financial Inc | 355.082 | 44,09 | 14.587 | 61,39 | ||||
| 2026-01-26 | 13F | Mirae Asset Global Investments Co., Ltd. | 621.550 | 5,97 | 25.533 | 18,26 | ||||
| 2026-01-14 | 13F | Kraft, Davis & Associates, LLC | 13.197 | 0,00 | 577 | 15,66 | ||||
| 2025-10-15 | 13F | Hanson & Doremus Investment Management | 0 | -100,00 | 0 | |||||
| 2026-02-11 | 13F | Madden Advisory Services, Inc. | 20.500 | -0,94 | 842 | 10,64 | ||||
| 2026-02-17 | 13F | Pacific Financial Group Inc | 17.117 | -23,98 | 703 | -15,10 | ||||
| 2026-04-13 | 13F | Mather Group, Llc. | 39.660 | -2,13 | 1.770 | 6,31 | ||||
| 2026-02-05 | 13F | Security National Bank | 2.750 | 0,00 | 113 | 10,89 | ||||
| 2026-02-13 | 13F | Aptus Capital Advisors, LLC | 5.851 | 240 | ||||||
| 2026-04-08 | 13F | Wealth Enhancement Advisory Services, Llc | 90.491 | -26,60 | 4.028 | -23,72 | ||||
| 2026-01-21 | 13F | Sowell Financial Services LLC | 66.806 | -23,23 | 2.744 | -14,33 | ||||
| 2026-02-03 | 13F | Farmers & Merchants Investments Inc | 1.255 | 0,00 | 52 | 10,87 | ||||
| 2026-01-16 | 13F | Mirabaud & Cie SA | 57.964 | 0,00 | 2.381 | 11,58 | ||||
| 2026-01-15 | 13F | Alpine Bank Wealth Management | 28.000 | 0,00 | 1.150 | 11,65 | ||||
| 2026-02-13 | 13F | Mariner, LLC | 277.396 | 1,25 | 11.395 | 13,00 | ||||
| 2026-02-13 | 13F | LGT Financial Advisors LLC | 4.000 | 0,00 | 164 | 11,56 | ||||
| 2026-02-05 | 13F | Cauble & Harre Wealth Management, Inc. | 38.393 | 1.577 | ||||||
| 2026-02-05 | 13F | Western Wealth Management, LLC | 24.417 | 81,70 | 1.003 | 103,04 | ||||
| 2026-02-12 | 13F | Wealthspire Advisors, LLC | 0 | -100,00 | 0 | |||||
| 2026-02-10 | 13F | Savant Capital, LLC | 10.766 | 14,03 | 442 | 27,38 | ||||
| 2026-01-30 | 13F | Wealthfront Advisers Llc | 34.759 | 92,90 | 1.428 | 115,23 | ||||
| 2026-02-05 | 13F | AlphaCore Capital LLC | 5.170 | 212 | ||||||
| 2026-02-11 | 13F | Paragon Private Wealth Management, LLC | 32.122 | -5,79 | 1.320 | 5,10 | ||||
| 2026-04-07 | 13F | Cooper Financial Group | 31.526 | 1.407 | ||||||
| 2026-01-26 | 13F | Cwm, Llc | 408.709 | -2,45 | 17 | 6,67 | ||||
| 2026-02-03 | 13F | Crestwood Advisors Group LLC | 4.952 | 203 | ||||||
| 2026-01-26 | 13F | Cypress Capital Advisors, LLC | 340.345 | -4,29 | 13.981 | 6,81 | ||||
| 2026-04-13 | 13F | E Fund Management Co., Ltd. | 306.890 | -59,26 | 13.693 | -42,36 | ||||
| 2026-04-10 | 13F | Client First Investment Management LLC | 0 | -100,00 | 0 | |||||
| 2026-02-05 | 13F | Stephens Inc /ar/ | 7.100 | 292 | ||||||
| 2026-01-23 | 13F | Legacy Bridge, LLC | 8.117 | 0,00 | 333 | 11,74 | ||||
| 2026-02-13 | 13F | Safeguard Investment Advisory Group, LLC | 21.915 | -1,49 | 900 | 10,02 | ||||
| 2026-02-02 | 13F | Pittenger & Anderson Inc | 350 | 0,00 | 14 | 16,67 | ||||
| 2026-02-02 | 13F | Oppenheimer & Co Inc | 21.854 | -3,98 | 898 | 7,17 | ||||
| 2026-01-30 | 13F | Pacific Park Financial, Inc. | 11.400 | 468 | ||||||
| 2026-02-11 | 13F | Syon Capital Llc | 115.136 | 4.730 | ||||||
| 2026-02-13 | 13F | Citigroup Inc | 14.289 | 587 | ||||||
| 2025-10-21 | 13F | Wagner Wealth Management, Llc | 0 | -100,00 | 0 | |||||
| 2026-01-07 | 13F | Sovereign Financial Group, Inc. | 13.685 | -5,41 | 562 | 5,64 | ||||
| 2026-04-09 | 13F | Wedmont Private Capital | 5.253 | 0,00 | 237 | 6,31 | ||||
| 2026-01-21 | 13F | Albion Financial Group /ut | 4.220 | 0,00 | 173 | 11,61 | ||||
| 2026-02-05 | 13F | Everstar Asset Management, LLC | 6.273 | -4,02 | 258 | 7,08 | ||||
| 2026-02-17 | 13F | Wealth Watch Advisors, INC | 99.193 | 77,68 | 4.075 | 98,34 | ||||
| 2026-04-08 | 13F | High Point Wealth Management, LLC | 2.000 | 0,00 | 89 | 8,54 | ||||
| 2026-02-12 | 13F | Great Valley Advisor Group, Inc. | 5.849 | 240 | ||||||
| 2026-02-17 | 13F | Warren Averett Asset Management, LLC | 26.975 | 276,59 | 1.108 | 321,29 | ||||
| 2026-01-21 | 13F | Financial & Tax Architects, LLC | 39.384 | -18,76 | 1.618 | -9,36 | ||||
| 2026-01-27 | 13F | Meritage Portfolio Management | 5.280 | 217 | ||||||
| 2026-04-13 | 13F | Fiduciary Financial Group, Llc | 70.980 | -5,90 | 3.167 | 2,23 | ||||
| 2026-01-20 | 13F | Cypress Advisory Group LLC | 12.875 | 0,00 | 529 | 11,63 | ||||
| 2026-02-03 | 13F | Koshinski Asset Management, Inc. | 7.831 | -0,89 | 322 | 10,69 | ||||
| 2026-02-23 | 13F | Virtu Financial LLC | 100.320 | 4 | ||||||
| 2026-04-09 | 13F | Wealth Alliance Advisory Group, LLC | 62.017 | 0,00 | 2.767 | 8,64 | ||||
| 2026-02-06 | 13F | EverSource Wealth Advisors, LLC | 26.191 | -1,33 | 1.076 | 10,03 | ||||
| 2026-02-17 | 13F | Tower Research Capital LLC (TRC) | 123 | 5 | ||||||
| 2026-02-02 | 13F | Truist Financial Corp | 10.161 | 20,39 | 417 | 34,52 | ||||
| 2026-02-10 | 13F | Bearing Point Capital, Llc | 5.007 | 206 | ||||||
| 2026-02-17 | 13F | Argyle Capital Partners, LLC | 14.095 | 5,75 | 579 | 18,16 | ||||
| 2026-02-13 | 13F | Pathstone Holdings, LLC | 46.874 | 0,00 | 1.926 | 11,59 | ||||
| 2026-04-09 | 13F | Pinkerton Retirement Specialists, LLC | 12.812 | -5,49 | 526 | -5,40 | ||||
| 2026-02-06 | 13F | GPS Wealth Strategies Group, LLC | 0 | -100,00 | 0 | |||||
| 2026-01-16 | 13F | Balboa Wealth Partners | 28.147 | 0,16 | 1.156 | 11,80 | ||||
| 2026-02-17 | 13F | Captrust Financial Advisors | 149.387 | -0,36 | 6.137 | 11,20 | ||||
| 2026-01-22 | 13F | Upper Left Wealth Management, LLC | 15.065 | -2,93 | 619 | 8,23 | ||||
| 2026-02-18 | 13F | Financial Advisory Service, Inc. | 17.164 | 0,67 | 705 | 12,44 | ||||
| 2026-02-13 | 13F | Smartleaf Asset Management LLC | 642 | 27 | ||||||
| 2026-02-12 | 13F | Mount Yale Investment Advisors, LLC | 6.545 | 0,00 | 269 | 11,67 | ||||
| 2026-02-12 | 13F | Harbour Investment Management Llc | 34.550 | 0,00 | 1.419 | 11,64 | ||||
| 2026-02-20 | 13F | Kovitz Investment Group Partners, LLC | 0 | -100,00 | 0 | |||||
| 2026-02-06 | 13F | Global Retirement Partners, LLC | 8.476 | 0,00 | 348 | 11,54 | ||||
| 2026-02-10 | 13F | Syntegra Private Wealth Group, LLC | 13.018 | 0,00 | 535 | 11,48 | ||||
| 2025-11-14 | 13F | Walleye Capital LLC | 0 | -100,00 | 0 | |||||
| 2026-02-19 | 13F | Atomi Financial Group, Inc. | 85.044 | 1,74 | 3.494 | 13,52 | ||||
| 2026-01-28 | 13F | Leelyn Smith, LLC | 17.129 | 10,99 | 704 | 23,77 | ||||
| 2026-04-13 | 13F | Creative Financial Designs Inc /adv | 197 | 0,00 | 9 | 0,00 | ||||
| 2026-02-17 | 13F | Sherman Porfolios, Llc | 7.349 | 302 | ||||||
| 2026-02-04 | 13F | MONECO Advisors, LLC | 152.806 | -0,05 | 6.277 | 11,55 | ||||
| 2026-02-12 | 13F | Elite Financial, Inc. | 40.851 | 2,51 | 2 | 0,00 | ||||
| 2026-02-13 | 13F | National Bank Of Canada /fi/ | 1.020 | 0,00 | 42 | 10,81 | ||||
| 2026-02-13 | 13F | Kestra Advisory Services, LLC | 0 | -100,00 | 0 | |||||
| 2026-04-09 | 13F | DHJJ Financial Advisors, Ltd. | 1.802 | -14,64 | 80 | -6,98 | ||||
| 2026-02-03 | 13F | Coston, McIsaac & Partners | 2.414 | -64,73 | 0 | |||||
| 2026-02-12 | 13F | Empower Advisory Group, LLC | 14.000 | 0,00 | 575 | 11,65 | ||||
| 2026-02-04 | 13F | Advisor OS, LLC | 7.598 | 33,25 | 312 | 49,28 | ||||
| 2026-02-13 | 13F | LFG Wealth Partners, LLC | 21.665 | 890 | ||||||
| 2026-01-22 | 13F | Harwood Advisory Group, LLC | 8.421 | 2,43 | 346 | 14,24 | ||||
| 2026-01-16 | 13F | Matauro, Llc | 80.366 | 0,10 | 3.301 | 11,71 | ||||
| 2026-01-30 | 13F | American Capital Advisory, LLC | 27 | 0,00 | 1 | |||||
| 2026-02-05 | 13F | Center for Financial Planning, Inc. | 2.100 | 0,00 | 86 | 11,69 | ||||
| 2026-04-02 | 13F/A | Soltis Investment Advisors LLC | 5.430 | 223 | ||||||
| 2026-04-13 | 13F | Newman Dignan & Sheerar, Inc. | 330.772 | -12,91 | 14.759 | -5,40 | ||||
| 2026-02-13 | 13F | Evelyn Partners Asset Management Ltd | 202.330 | -3,17 | 8.312 | 8,06 | ||||
| 2026-02-13 | 13F | Kcm Investment Advisors Llc | 8.850 | 0,00 | 364 | 11,69 | ||||
| 2026-02-24 | 13F | Barnes Wealth Management Group, Inc | 9.550 | -3,30 | 392 | 7,99 | ||||
| 2025-11-04 | 13F | Guerra Advisors Inc | 20 | 1 | ||||||
| 2026-02-11 | 13F | Patron Partners Advisors, Llc | 5.655 | 232 | ||||||
| 2026-02-10 | 13F | Bnp Paribas Arbitrage, Sa | 21.736 | -91,63 | 893 | -90,67 | ||||
| 2026-01-29 | 13F | China Universal Asset Management Co., Ltd. | 203.500 | 39,38 | 8.360 | 55,55 | ||||
| 2026-02-02 | 13F | Mutual Advisors, LLC | 61.259 | -10,26 | 2.517 | -6,05 | ||||
| 2026-02-13 | 13F | Ingalls & Snyder Llc | 32.440 | 0,00 | 1 | 0,00 | ||||
| 2026-01-30 | 13F/A | M&t Bank Corp | 12.924 | 0,00 | 531 | 11,58 | ||||
| 2026-02-10 | 13F | Principia Wealth Advisory, LLC | 7.695 | -10,99 | 316 | -0,63 | ||||
| 2026-04-13 | 13F | Wolff Wiese Magana Llc | 24.020 | 0,00 | 1.072 | 8,62 | ||||
| 2026-02-05 | 13F | Thrivent Financial For Lutherans | 7.952 | 0 | ||||||
| 2026-02-17 | 13F | Creative Planning | 78.951 | 1,78 | 3.243 | 13,59 | ||||
| 2026-01-26 | 13F | Consolidated Portfolio Review Corp | 0 | -100,00 | 0 | |||||
| 2026-01-30 | 13F | Pure Portfolios Holdings Llc | 1.013.425 | -0,16 | 41.631 | 11,42 | ||||
| 2026-01-30 | 13F | Verity Asset Management, Inc. | 5.115 | 210 | ||||||
| 2026-02-02 | 13F | Pegasus Asset Management, Inc. | 14.938 | 614 | ||||||
| 2026-02-17 | 13F | Advisor Group Holdings, Inc. | 296.657 | -4,73 | 12.187 | 12,90 | ||||
| 2026-01-15 | 13F | Lodestone Wealth Management LLC | 539 | 22 | ||||||
| 2026-01-23 | 13F | Curtis Advisory Group, LLC | 9.760 | 0,00 | 401 | 11,42 | ||||
| 2026-02-12 | 13F | Cutler Investment Counsel Llc | 16.586 | 0,00 | 681 | 11,64 | ||||
| 2026-04-01 | 13F | Financial Insights, Inc. | 10.318 | 31,79 | 424 | 71,95 | ||||
| 2026-01-16 | 13F | Beaumont Financial Advisors, LLC | 16.175 | 0,00 | 664 | 11,60 | ||||
| 2026-04-14 | 13F | Prospera Financial Services Inc | 10.059 | 0,00 | 449 | 8,47 | ||||
| 2026-02-12 | 13F | Commonwealth Equity Services, Llc | 496.382 | 6,80 | 20.391 | 119.847,06 | ||||
| 2026-04-14 | 13F | Tradewinds Capital Management, LLC | 3.820 | 0,00 | 170 | 8,97 | ||||
| 2026-02-09 | 13F | Northstar Financial Companies, Inc. | 0 | -100,00 | 0 | -100,00 | ||||
| 2026-02-10 | 13F | Foundations Investment Advisors, LLC | 8.402 | -9,33 | 345 | 1,17 | ||||
| 2026-02-17 | 13F | Jain Global LLC | 644.220 | 26.465 | ||||||
| 2026-02-17 | 13F | Private Advisor Group, LLC | 30.729 | 6,35 | 1.262 | 18,72 | ||||
| 2026-01-26 | 13F | Main Street Group, LTD | 0 | -100,00 | 0 | |||||
| 2026-01-16 | 13F | First Pacific Financial | 2.396 | -29,28 | 98 | -20,97 | ||||
| 2026-01-27 | 13F | Family Capital Trust Co | 12.100 | -33,70 | 497 | -26,08 | ||||
| 2026-02-14 | 13F | American Trust | 5.107 | 210 | ||||||
| 2026-02-17 | 13F | Northeast Financial Group, Inc. | 8.953 | -1,55 | 368 | 9,88 | ||||
| 2026-02-13 | 13F | SRS Capital Advisors, Inc. | 7.800 | 75,28 | 320 | 96,32 | ||||
| 2026-01-29 | 13F | Sanctuary Advisors, LLC | 10.511 | -25,76 | 432 | -17,27 | ||||
| 2026-02-12 | 13F | Jane Street Group, Llc | Call | 51.900 | 33,76 | 2.132 | 49,30 | |||
| 2026-02-12 | 13F | CIBC Private Wealth Group, LLC | 36.479 | 62,28 | 1.499 | 81,14 | ||||
| 2026-02-13 | 13F | Baird Financial Group, Inc. | 431.346 | 3,39 | 17.720 | 15,38 | ||||
| 2026-02-12 | 13F | Jane Street Group, Llc | 315.536 | 2.813,00 | 12.962 | 3.156,78 | ||||
| 2026-02-12 | 13F | Jane Street Group, Llc | Put | 103.300 | 1.419,12 | 4.244 | 1.597,20 | |||
| 2026-04-07 | 13F | Signaturefd, Llc | 108 | -81,54 | 5 | -83,33 | ||||
| 2026-02-17 | 13F | Raymond James Financial Inc | 591.665 | 17,74 | 24.306 | 31,40 | ||||
| 2026-01-28 | 13F | EPG Wealth Management LLC | 25.208 | 0,00 | 1.036 | 11,65 | ||||
| 2026-02-03 | 13F | We Are One Seven, LLC | 5.666 | 233 | ||||||
| 2026-02-13 | 13F | Morgan Stanley | 2.319.730 | 5,67 | 95.295 | 17,92 | ||||
| 2026-02-17 | 13F | Cape Investment Advisory, Inc. | 30 | 1 | ||||||
| 2026-02-12 | 13F | Scotia Capital Inc. | 25.801 | -0,31 | 1.060 | 11,24 | ||||
| 2026-01-09 | 13F | Silver Lake Advisory, LLC | 7.717 | 0,00 | 317 | 11,62 | ||||
| 2026-02-14 | 13F | Rockefeller Capital Management L.P. | 177.254 | 121,57 | 7.306 | 148,17 | ||||
| 2026-02-17 | 13F | Cresset Asset Management, LLC | 109.062 | -9,25 | 4.480 | 1,29 | ||||
| 2026-02-13 | 13F | Avos Capital Management, LLC | 188.530 | -5,73 | 7.745 | 5,20 | ||||
| 2026-01-26 | 13F | AE Wealth Management LLC | 17.090 | 165,21 | 702 | 196,20 | ||||
| 2026-02-11 | 13F | Parallel Advisors, LLC | 11.331 | -0,87 | 465 | 10,71 | ||||
| 2026-02-10 | 13F | Goldman Sachs Group Inc | 15.768 | 648 | ||||||
| 2026-02-18 | 13F | GWM Advisors LLC | 231.133 | -23,61 | 9.495 | -14,75 | ||||
| 2026-01-14 | 13F | Advisors Management Group Inc /adv | 428.993 | -0,85 | 18 | 13,33 | ||||
| 2026-02-05 | 13F | Plante Moran Financial Advisors, LLC | 758 | 0,00 | 31 | 14,81 | ||||
| 2026-02-13 | 13F | Lifeworks Advisors, LLC | 58.243 | -33,26 | 2.393 | -25,53 | ||||
| 2026-02-04 | 13F | Pensionmark Financial Group, Llc | 32.012 | -0,82 | 1.304 | 9,68 | ||||
| 2026-01-29 | 13F | Finhabits Advisors LLC | 12.831 | 527 | ||||||
| 2026-02-04 | 13F | Pensionmark Financial Group, Llc | Put | 12 | ||||||
| 2025-11-13 | 13F | Promus Capital, LLC | 18.712 | 0,00 | 689 | 16,61 | ||||
| 2026-02-18 | 13F | Beacon Pointe Advisors, LLC | 42.275 | -1,75 | 1.737 | 9,67 | ||||
| 2026-02-04 | 13F | Pensionmark Financial Group, Llc | Call | 25 | 118,18 | |||||
| 2026-02-10 | 13F | Channing Global Advisors, Llc | 47.220 | -38,31 | 1.940 | -31,17 | ||||
| 2026-02-11 | 13F | TCTC Holdings, LLC | 13 | 0,00 | 1 | |||||
| 2026-02-17 | 13F | Fmr Llc | 10.366 | 22,21 | 426 | 36,22 | ||||
| 2026-01-16 | 13F | Crewe Advisors LLC | 992 | 14,81 | 41 | 29,03 | ||||
| 2026-01-26 | 13F | PFG Investments, LLC | 25.773 | 5,35 | 1.059 | 17,56 | ||||
| 2026-02-17 | 13F | Tolleson Wealth Management, Inc. | 9.875 | 406 | ||||||
| 2026-01-06 | 13F | Penbrook Management LLC | 17.155 | -4,40 | 705 | 6,67 | ||||
| 2026-01-21 | 13F | Capital Advisory Group Advisory Services, LLC | 142.555 | 51,08 | 5.856 | 68,62 | ||||
| 2026-02-11 | 13F | Premier Private Wealth Management LLC | 27.970 | 1.240 | ||||||
| 2026-02-12 | 13F | Principal Securities, Inc. | 45.334 | 3,04 | 1.862 | 15,01 | ||||
| 2026-04-02 | 13F | Collective Family Office Llc | 6.174 | -9,83 | 275 | -2,14 | ||||
| 2026-02-17 | 13F | Guardian Point Capital, Lp | 1.300.000 | 8,33 | 53.404 | 20,90 | ||||
| 2025-11-14 | 13F | Eqis Capital Management, Inc. | 0 | -100,00 | 0 | -100,00 | ||||
| 2026-01-26 | 13F | Whittier Trust Co Of Nevada Inc | 209 | 0,00 | 9 | 14,29 | ||||
| 2026-01-29 | 13F | Resonant Capital Advisors, LLC | 53.010 | -0,11 | 2.178 | 11,47 | ||||
| 2026-02-13 | 13F | Sofos Investments, Inc. | 19 | 375,00 | 1 | |||||
| 2025-11-07 | 13F | Synovus Financial Corp | 107.937 | -0,29 | 3.973 | 16,37 | ||||
| 2026-02-17 | 13F | Jones Financial Companies Lllp | 180.370 | 33,82 | 7.410 | 53,05 | ||||
| 2026-02-10 | 13F | Essex Financial Services, Inc. | 11.301 | -2,54 | 464 | 8,92 | ||||
| 2026-02-13 | 13F | Integrated Wealth Concepts LLC | 0 | -100,00 | 0 | |||||
| 2026-02-13 | 13F | Parker Investment Management, LLC | 7.991 | 21,17 | 328 | 35,54 | ||||
| 2026-02-13 | 13F | Arkadios Wealth Advisors | 104.477 | 3,34 | 4.292 | 15,32 | ||||
| 2025-10-27 | 13F | Kiker Wealth Management, LLC | 0 | -100,00 | 0 | -100,00 | ||||
| 2026-04-14 | 13F | West Branch Capital LLC | 10.859 | 0,00 | 485 | 8,52 | ||||
| 2026-01-30 | 13F | RCW Management, LLC | 5.417 | 223 | ||||||
| 2026-02-03 | 13F | Alpha Cubed Investments, LLC | 9.618 | 14,26 | 395 | 27,83 | ||||
| 2026-02-17 | 13F | Signature Equity Partners, LLC | 1.198 | 49 | ||||||
| 2026-02-09 | 13F | Allen Capital Group, LLC | 464.245 | -20,97 | 19.071 | -11,80 | ||||
| 2026-02-13 | 13F | Journey Strategic Wealth Llc | 5.801 | -1,59 | 238 | 10,19 | ||||
| 2026-02-04 | 13F | Summit Wealth Group Llc / Co | 0 | -100,00 | 0 | -100,00 | ||||
| 2026-03-24 | 13F | Armis Advisers, LLC | 78.413 | -45,35 | 3.362 | -38,68 | ||||
| 2026-04-07 | 13F | CoreCap Advisors, LLC | 29.010 | -27,80 | 1.294 | -21,58 | ||||
| 2026-02-17 | 13F | Cetera Investment Advisers | 580.336 | 2,49 | 23.840 | 14,38 | ||||
| 2026-04-14 | 13F | Nbc Securities, Inc. | 645 | 0,00 | 29 | 7,69 | ||||
| 2026-02-17 | 13F | SageView Advisory Group, LLC | 2.893 | 119 | ||||||
| 2026-01-26 | 13F | WorthPointe, LLC | 49.593 | 2.037 | ||||||
| 2026-02-03 | 13F | Anfield Capital Management, LLC | 1.000 | 0,00 | 41 | 13,89 | ||||
| 2026-02-17 | 13F | Advisory Services Network, LLC | 14.689 | 227,30 | 603 | 265,45 | ||||
| 2026-01-30 | 13F | Simplicity Wealth,LLC | 6.649 | 273 | ||||||
| 2026-02-11 | 13F | Capital Analysts, Inc. | 25.861 | 0,00 | 1 | |||||
| 2025-11-12 | 13F | Creekmur Asset Management LLC | 6.586 | 1.680,00 | 242 | 2.100,00 | ||||
| 2026-01-28 | 13F | Milestone Asset Management, Llc | 0 | -100,00 | 0 | |||||
| 2026-02-17 | 13F | Greenline Partners, LLC | 7.056 | 0,00 | 290 | 11,58 | ||||
| 2026-01-22 | 13F | Bfsg, Llc | 497.349 | -1,14 | 20.431 | 10,33 | ||||
| 2026-01-26 | 13F | Xcel Wealth Management, LLC | 55.529 | 0,00 | 2.281 | 11,59 | ||||
| 2026-02-10 | 13F | Envestnet Asset Management Inc | 1.007.320 | -4,03 | 41.381 | 7,10 | ||||
| 2026-01-12 | 13F | Perkins Coie Trust Co | 100 | 0,00 | 4 | 33,33 | ||||
| 2026-02-12 | 13F | Brown Brothers Harriman & Co | 16.468 | 0,00 | 677 | 11,55 | ||||
| 2026-01-23 | 13F | Nbt Bank N A /ny | 41 | 10,81 | 74 | 12,12 | ||||
| 2026-01-14 | 13F | Terra Nova Asset Management LLC | 133.807 | -4,15 | 5.497 | 6,97 | ||||
| 2025-11-14 | 13F | Point72 Asia (Singapore) Pte. Ltd. | 16.800 | 618 | ||||||
| 2026-02-13 | 13F | Colony Group, LLC | 128.748 | 30,34 | 5.286 | 45,35 | ||||
| 2026-01-16 | 13F | Empirical Financial Services, LLC d.b.a. Empirical Wealth Management | 0 | -100,00 | 0 | |||||
| 2026-02-02 | 13F | WT Wealth Management | 452.444 | -3,49 | 18.586 | 7,74 | ||||
| 2026-01-22 | 13F | Glass Jacobson Investment Advisors llc | 2.062 | 106,20 | 85 | 133,33 | ||||
| 2026-01-26 | 13F | Decker Retirement Planning Inc. | 20.602 | 192,02 | 846 | 226,64 | ||||
| 2026-02-10 | 13F | Root Financial Partners, LLC | 1.500 | 0,00 | 62 | 10,91 | ||||
| 2026-01-22 | 13F | ETF Store, Inc. | 12.681 | -1,28 | 521 | 10,17 | ||||
| 2026-01-29 | 13F | Ashton Thomas Private Wealth, LLC | 10.583 | -3,25 | 435 | 7,96 | ||||
| 2026-04-07 | 13F | Park Avenue Securities Llc | 5.806 | 0 | ||||||
| 2026-01-29 | 13F | Seven Post Investment Office LP | 15.487 | 0,00 | 636 | 11,58 | ||||
| 2026-02-17 | 13F | Modern Wealth Management, LLC | 9.519 | 391 | ||||||
| 2026-02-17 | 13F | Susquehanna International Group, Llp | Call | 108.400 | -11,07 | 4.453 | -0,76 | |||
| 2026-02-03 | 13F | Cassaday & Co Wealth Management LLC | 11.843 | 487 | ||||||
| 2026-02-17 | 13F | Two Sigma Securities, Llc | 47.340 | 1.945 | ||||||
| 2026-02-17 | 13F | IHT Wealth Management, LLC | 54.002 | 8,00 | 2.218 | 20,54 | ||||
| 2026-02-05 | 13F | Berkeley Capital Partners, LLC | 12.383 | 0,00 | 509 | 11,65 | ||||
| 2026-02-13 | 13F | Resources Investment Advisors, LLC. | 93.950 | 84,43 | 3.859 | 105,81 | ||||
| 2025-11-14 | 13F | Wetherby Asset Management Inc | 26.294 | 2,40 | 968 | 19,53 | ||||
| 2026-02-10 | 13F | WCG Wealth Advisors LLC | 96.121 | 1,19 | 3.949 | 12,93 | ||||
| 2026-02-13 | 13F | Evelyn Partners Investment Management LLP | 10.540 | 5,40 | 433 | 17,39 | ||||
| 2026-02-13 | 13F | Apriem Advisors | 10.229 | -0,97 | 420 | 10,53 | ||||
| 2026-02-02 | 13F | Sachetta, LLC | 2.925 | -7,87 | 120 | 3,45 | ||||
| 2026-02-23 | 13F | Clear Retirement Advice LLC | 119.652 | 5.632 | ||||||
| 2026-02-09 | 13F | Hartland & Co., LLC | 6.655 | 0,00 | 273 | 11,89 | ||||
| 2026-02-02 | 13F | Fulcrum Wealth Advisors, Llc | 282.368 | 11.600 | ||||||
| 2026-04-07 | 13F | Eastern Bank | 1.145 | 0,00 | 51 | 8,51 | ||||
| 2026-04-09 | 13F | Key Client Fiduciary Advisors, LLC | 13.796 | 5,92 | 616 | 14,95 | ||||
| 2026-02-09 | 13F | Strategic Financial Concepts, LLC | 12.346 | 507 | ||||||
| 2026-04-14 | 13F | Thurston, Springer, Miller, Herd & Titak, Inc. | 500 | 0,00 | 22 | 10,00 | ||||
| 2026-02-04 | 13F | Valeo Financial Advisors, LLC | 7.561 | -29,65 | 311 | -21,52 | ||||
| 2026-02-09 | 13F | Global Assets Advisory, LLC | 82.804 | 4,52 | 3.402 | 16,63 | ||||
| 2026-02-17 | 13F | Susquehanna International Group, Llp | 67.696 | -11,58 | 2.781 | -1,35 | ||||
| 2026-02-11 | 13F | Nemes Rush Group LLC | 7.184 | 0,00 | 295 | 11,74 | ||||
| 2026-02-17 | 13F | Susquehanna International Group, Llp | Put | 26.800 | 243,59 | 1.101 | 283,28 | |||
| 2026-02-05 | 13F | WealthPlan Investment Management, LLC | 13.783 | -18,61 | 566 | -9,15 | ||||
| 2026-02-06 | 13F | Envestnet Portfolio Solutions, Inc. | 11.630 | 5,45 | 478 | 17,78 | ||||
| 2026-02-17 | 13F | Bank Of America Corp /de/ | 3.819.302 | 2,02 | 156.897 | 13,86 | ||||
| 2026-02-11 | 13F | SOUTH STATE Corp | 4.899 | 8,87 | 201 | 21,82 | ||||
| 2026-02-11 | 13F | XML Financial, LLC | 21.900 | 10,05 | 900 | 22,81 | ||||
| 2026-02-17 | 13F | Hilltop Holdings Inc. | 42.869 | 4,13 | 1.761 | 16,24 | ||||
| 2026-01-30 | 13F | Sigma Planning Corp | 27.559 | 0,10 | 1.128 | 11,25 | ||||
| 2026-01-16 | 13F | Ronald Blue Trust, Inc. | 413.380 | -3,53 | 16.982 | 7,66 | ||||
| 2026-01-26 | 13F | Bcm Advisors, Llc | 171.267 | -2,66 | 8.130 | 22,44 | ||||
| 2026-02-09 | 13F | Blue Bell Private Wealth Management, Llc | 58.945 | -1,05 | 2.421 | 10,45 | ||||
| 2026-02-13 | 13F | Towarzystwo Funduszy Inwestycyjnych Pzu Sa | 0 | -100,00 | 0 | |||||
| 2026-02-13 | 13F | Umb Bank N A/mo | 1.303 | 0,00 | 54 | 12,77 | ||||
| 2026-02-17 | 13F | London & Capital Asset Management Ltd | 616.575 | 25.326 | ||||||
| 2026-01-26 | 13F | CWC Advisors, LLC. | 14.547 | -3,42 | 598 | 7,76 | ||||
| 2026-02-11 | 13F | Cerity Partners LLC | 47.029 | 4,20 | 1.963 | 16,30 | ||||
| 2026-02-12 | 13F | BlackRock, Inc. | 27.320 | -33,49 | 1.122 | -25,74 | ||||
| 2026-02-12 | 13F | Resurgent Financial Advisors LLC | 26.073 | 24,57 | 1.071 | 39,09 | ||||
| 2026-01-26 | 13F | Valmark Advisers, Inc. | 12.910 | 0,00 | 530 | 11,58 | ||||
| 2026-01-29 | 13F | Almanack Investment Partners, LLC. | 1.005.236 | -4,42 | 41.295 | 6,67 | ||||
| 2026-01-23 | 13F | Rsm Us Wealth Management Llc | 144.752 | -5,93 | 5.988 | 5,72 | ||||
| 2026-02-17 | 13F | XTX Topco Ltd | 8.045 | -33,00 | 330 | -25,17 | ||||
| 2026-02-03 | 13F | Sequoia Financial Advisors, LLC | 27.385 | 1.125 | ||||||
| 2026-02-05 | 13F | Bessemer Group Inc | 94.241 | 4 | ||||||
| 2026-02-12 | 13F | Betterment LLC | 29.472 | 64,37 | 1 | |||||
| 2026-02-13 | 13F | Inspire Advisors, LLC | 270.661 | 21,44 | 11.119 | 35,52 | ||||
| 2026-02-11 | 13F | Swan Global Investments, LLC | 17.912 | -48,88 | 736 | -42,98 | ||||
| 2026-02-11 | 13F | Harvest Fund Management Co., Ltd | 247.904 | 2,77 | 10 | 25,00 | ||||
| 2026-01-12 | 13F | Paragon Advisors, LLC | 7.845 | -0,04 | 322 | 11,81 | ||||
| 2026-02-04 | 13F | Anson Capital, Inc. | 48.520 | 11,08 | 1.993 | 24,02 | ||||
| 2026-02-19 | 13F | CI Private Wealth, LLC | 28.523 | 6,62 | 1.157 | 17,48 | ||||
| 2026-02-10 | 13F | Acorn Wealth Advisors, LLC | 17.907 | -10,77 | 736 | -0,41 | ||||
| 2026-02-13 | 13F | Barclays Plc | 10.000 | 13,74 | 411 | 26,93 | ||||
| 2026-02-17 | 13F | Royal Bank Of Canada | 628.244 | 1,14 | 25.809 | 12,88 | ||||
| 2026-01-28 | 13F | Southern Capital Advisors, Llc | 6.400 | 0,00 | 263 | 11,49 | ||||
| 2026-02-13 | 13F | Arete Wealth Advisors, LLC | 114.989 | 2,83 | 5 | 0,00 | ||||
| 2026-02-13 | 13F | Fortitude Advisory Group L.L.C. | 6.075 | 0,00 | 250 | 11,66 | ||||
| 2026-03-04 | 13F | Rehmann Capital Advisory Group | 12.037 | 0,00 | 494 | 11,51 | ||||
| 2026-02-11 | 13F | Jpmorgan Chase & Co | 4.367.518 | 5,78 | 179.418 | 18,05 | ||||
| 2026-02-10 | 13F | Fielder Capital Group LLC | 30.098 | -2,92 | 1.236 | 8,33 | ||||
| 2025-11-13 | 13F | Glenmede Investment Management, LP | 6.928 | -10,61 | 255 | 4,51 | ||||
| 2026-03-02 | 13F | Cfo Capital Management Llc | 10.350 | 425 | ||||||
| 2026-02-17 | 13F | RMB Capital Management, LLC | 5.515 | 0,00 | 227 | 11,33 | ||||
| 2025-11-10 | 13F | Efficient Advisors, LLC | 0 | -100,00 | 0 | |||||
| 2026-02-17 | 13F | Jump Financial, LLC | 78.641 | 3.231 | ||||||
| 2026-02-17 | 13F | Awm Capital, Llc | 12.794 | 0,00 | 526 | 11,70 | ||||
| 2026-02-11 | 13F | Simplex Trading, Llc | 0 | -100,00 | 0 | |||||
| 2026-02-13 | 13F | Wells Fargo & Company/mn | 3.026.827 | 2,62 | 124.342 | 14,52 | ||||
| 2026-02-13 | 13F | GM Advisory Group, Inc. | 11.904 | 42,07 | 489 | 58,77 |