Grundlæggende statistik
| Institutionelle aktier (lange) | 161.222.531 - 103,05% (ex 13D/G) - change of -41,17MM shares -20,34% MRQ |
| Institutionel værdi (lang) | $ 4.992.051 USD ($1000) |
Institutionelt ejerskab og aktionærer
Option Care Health, Inc. (US:OPCH) har 367 institutionelle ejere og aktionærer, der har indsendt 13D/G- eller 13F-formularer til Securities Exchange Commission (SEC). Disse institutioner har i alt 161,222,531 aktier. Største aktionærer omfatter BlackRock, Inc., Vanguard Group Inc, Wellington Management Group Llp, Fmr Llc, Durable Capital Partners LP, Fuller & Thaler Asset Management, Inc., State Street Corp, Arrowstreet Capital, Limited Partnership, Geode Capital Management, Llc, and Dimensional Fund Advisors Lp .
Option Care Health, Inc. (NasdaqGS:OPCH) institutionel ejerskabsstruktur viser aktuelle positioner i virksomheden efter institutioner og fonde, samt seneste ændringer i positionsstørrelse. Større aktionærer kan omfatte individuelle investorer, investeringsforeninger, hedgefonde eller institutioner. Skema 13D angiver, at investoren besidder (eller besidder) mere end 5 % af virksomheden og har til hensigt (eller har til hensigt at) aktivt at forfølge en ændring i forretningsstrategi. Skema 13G indikerer en passiv investering på over 5%.
The share price as of April 10, 2026 is 29,00 / share. Previously, on April 11, 2025, the share price was 31,55 / share. This represents a decline of 8,08% over that period.

Fondens stemningsscore
Fund Sentiment Score (fka Ownership Accumulation Score) finder de aktier, der bliver mest købt af fonde. Det er resultatet af en sofistikeret, multi-faktor kvantitativ model, der identificerer virksomheder med de højeste niveauer af institutionel akkumulering. Scoringsmodellen bruger en kombination af den samlede stigning i oplyste ejere, ændringerne i porteføljeallokeringer i disse ejere og andre målinger. Tallet går fra 0 til 100, hvor højere tal indikerer et højere niveau af akkumulering for sine jævnaldrende, og 50 er gennemsnittet.
Opdateringsfrekvens: Dagligt
Se Ownership Explorer, som giver en liste over højest rangerende virksomheder.
AI+ Ask Fintel’s AI assistant about Option Care Health, Inc..
Select a question to share a public post with an AI-crafted answer.
Thinking of good questions…
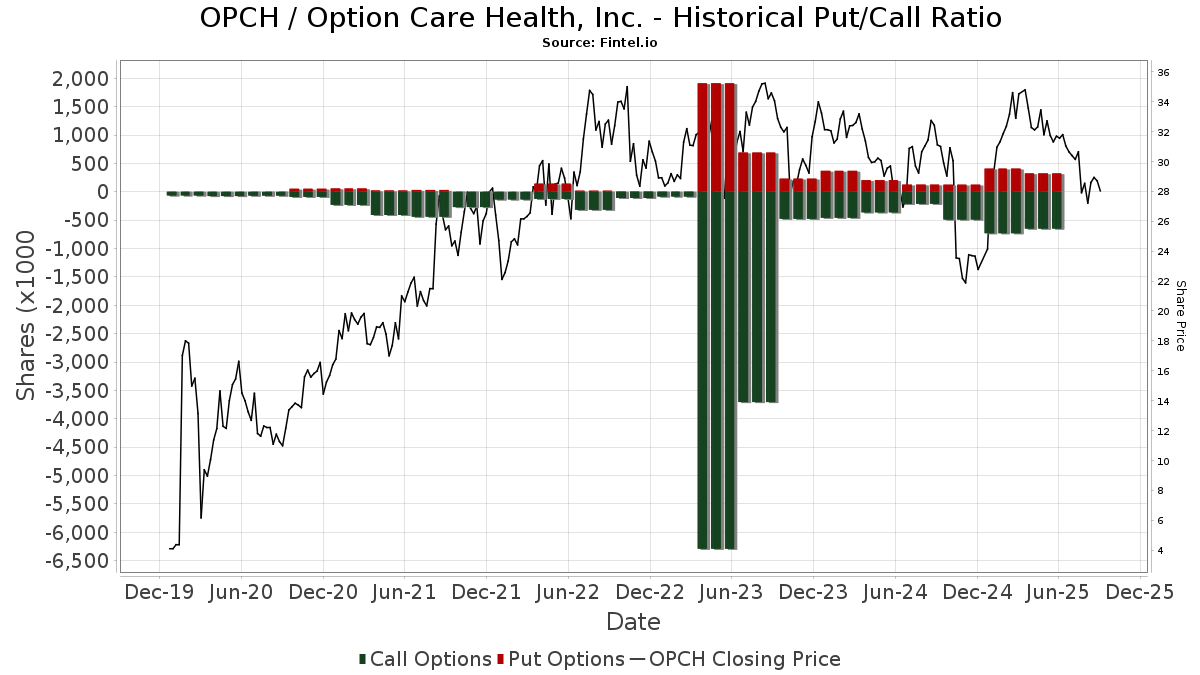
Institutionel Put/Call-forhold
Ud over at indberette standardaktie- og gældsudstedelser skal institutter med mere end 100 mill. aktiver under forvaltning også oplyse deres put- og call-optionsbeholdninger. Da salgsoptioner generelt indikerer negativ stemning, og købsoptioner indikerer positiv stemning, kan vi få en fornemmelse af den overordnede institutionelle stemning ved at plotte forholdet mellem put og kald. Diagrammet til højre viser det historiske put/call-forhold for dette instrument.
Brug af Put/Call Ratio som en indikator for investorernes stemning overvinder en af de vigtigste mangler ved at bruge totalt institutionelt ejerskab, som er, at en betydelig mængde af aktiver under forvaltning investeres passivt for at spore indekser. Passivt forvaltede fonde køber typisk ikke optioner, så indikatoren for put/call-forholdet følger mere nøje følelsen af aktivt forvaltede fonde.
13D/G-arkivering
Vi præsenterer 13D/G ansøgninger separat fra 13F ansøgninger på grund af den forskellige behandling af SEC. 13D/G-ansøgninger kan indgives af grupper af investorer (med én ledende), hvorimod 13F-ansøgninger ikke kan. Dette resulterer i situationer, hvor en investor kan indsende en 13D/G, der rapporterer én værdi for de samlede aktier (der repræsenterer alle de aktier, der ejes af investorgruppen), men derefter indsender en 13F, der rapporterer en anden værdi for de samlede aktier (der udelukkende repræsenterer deres egne) ejendomsret). Det betyder, at aktieejerskab af 13D/G-arkiver og 13F-arkiveringer ofte ikke er direkte sammenlignelige, så vi præsenterer dem separat.
Bemærk: Fra den 16. maj 2021 viser vi ikke længere ejere, der ikke har indsendt en 13D/G inden for det seneste år. Tidligere viste vi den fulde historie af 13D/G-arkiver. Generelt skal enheder, der er forpligtet til at indgive 13D/G-ansøgninger, indgive mindst årligt, før de indsender en afsluttende ansøgning. Dog forlader fonde nogle gange positioner uden at indsende en afsluttende ansøgning (dvs. de afvikler), så visning af den fulde historie resulterede nogle gange i forvirring om det nuværende ejerskab. For at undgå forvirring viser vi nu kun 'aktuelle' ejere - det vil sige - ejere, der har anmeldt inden for det seneste år.
Upgrade to unlock premium data.
| Fil dato | Form | Investor | Forrige Aktier |
Seneste Aktier |
Δ Aktier (Procent) |
Ejendomsret (Procent) |
Δ Ejerskab (Procent) |
|
|---|---|---|---|---|---|---|---|---|
| 2026-03-27 | VANGUARD GROUP INC | 19,626,205 | 0 | -100.00 | 0.00 | -100.00 | ||
| 2025-11-05 | FMR LLC | 5,438,269 | 8,658,743 | 59.22 | 5.30 | 75.21 | ||
| 2025-08-12 | WELLINGTON MANAGEMENT GROUP LLP | 17,075,799 | 13,332,168 | -21.92 | 8.10 | -19.00 | ||
| 2025-06-13 | Durable Capital Partners LP | 8,237,577 | 5.00 |
13F og NPORT arkivering
Detaljer om 13F-arkivering er gratis. Detaljer om NP-ansøgninger kræver et premium-medlemskab. Grønne rækker angiver nye positioner. Røde rækker angiver lukkede positioner. Klik på linket ikon for at se den fulde transaktionshistorik.
Opgrader
for at låse premium-data op og eksportere til Excel ![]() .
.
| Fil dato | Kilde | Investor | Type | Gennemsnitlig pris (Øst) |
Aktier | Δ Aktier (%) |
Rapporteret Værdi ($1000) |
Δ Værdi (%) |
Port Alloc (%) |
|
|---|---|---|---|---|---|---|---|---|---|---|
| 2026-02-05 | 13F | Leeward Investments, LLC - MA | 488.416 | 15,32 | 15.561 | 32,35 | ||||
| 2026-01-28 | 13F | Villere St Denis J & Co Llc | 831.125 | -4,08 | 26.480 | 10,08 | ||||
| 2025-10-28 | 13F | Csenge Advisory Group | 0 | -100,00 | 0 | -100,00 | ||||
| 2026-02-03 | 13F | International Assets Investment Management, Llc | 108 | 3 | ||||||
| 2026-02-04 | 13F | Securian Asset Management, Inc | 11.568 | -4,82 | 369 | 9,20 | ||||
| 2026-02-12 | 13F | New York State Common Retirement Fund | 69.719 | 27,95 | 2.221 | 46,89 | ||||
| 2026-02-13 | 13F | Dynamic Technology Lab Private Ltd | 0 | -100,00 | 0 | |||||
| 2026-02-17 | 13F | Advisor Group Holdings, Inc. | 3.593 | -25,86 | 114 | -15,56 | ||||
| 2026-02-17 | 13F | Ameriprise Financial Inc | 193.409 | -40,78 | 6.162 | -32,03 | ||||
| 2025-11-13 | 13F | Empowered Funds, LLC | 0 | -100,00 | 0 | -100,00 | ||||
| 2026-02-17 | 13F | Scientech Research LLC | 0 | -100,00 | 0 | |||||
| 2026-02-09 | 13F | Keating Financial Advisory Services, Inc. | 515 | 16 | ||||||
| 2026-02-17 | 13F | First Manhattan Co | 0 | -100,00 | 0 | |||||
| 2026-02-11 | 13F | Compass Wealth Management LLC | 235.549 | 7.505 | ||||||
| 2026-02-13 | 13F | MAI Capital Management | 27 | -89,33 | 1 | -100,00 | ||||
| 2026-02-13 | 13F | Johnson Investment Counsel Inc | 0 | -100,00 | 0 | |||||
| 2026-02-17 | 13F | Lombard Odier Asset Management (Europe) Ltd | 105.500 | 23,39 | 3.361 | 41,64 | ||||
| 2026-02-09 | 13F | CBIZ Investment Advisory Services, LLC | 114 | 4 | ||||||
| 2026-01-28 | 13F | WPG Advisers, LLC | 108 | -42,86 | 3 | -40,00 | ||||
| 2026-02-02 | 13F | Fifth Third Bancorp | 2.328 | 21,95 | 74 | 42,31 | ||||
| 2026-02-12 | 13F | Aristides Capital LLC | 0 | -100,00 | 0 | |||||
| 2026-02-13 | 13F | Teca Partners, LP | 573.205 | -6,68 | 18.262 | 7,11 | ||||
| 2026-01-29 | 13F | Nippon Life Global Investors Americas, Inc. | 112.890 | 3.597 | ||||||
| 2026-02-06 | 13F | Tredje AP-fonden | 0 | -100,00 | 0 | -100,00 | ||||
| 2026-01-12 | 13F | Abound Wealth Management | 0 | -100,00 | 0 | -100,00 | ||||
| 2026-02-13 | 13F | Sterling Capital Management LLC | 45.485 | 1,44 | 1.449 | 16,48 | ||||
| 2026-02-04 | 13F | Oregon Public Employees Retirement Fund | 31.730 | -3,06 | 1.011 | 11,23 | ||||
| 2026-02-12 | 13F | California Public Employees Retirement System | 288.950 | -7,56 | 9.206 | 6,09 | ||||
| 2026-02-17 | 13F | Occudo Quantitative Strategies Lp | 0 | -100,00 | 0 | |||||
| 2025-11-14 | 13F | Gotham Asset Management, LLC | 0 | -100,00 | 0 | -100,00 | ||||
| 2025-11-13 | 13F | Game Creek Capital, LP | Put | 0 | -100,00 | 0 | -100,00 | |||
| 2026-01-15 | 13F | Brookstone Capital Management | 0 | -100,00 | 0 | -100,00 | ||||
| 2026-02-17 | 13F | Optiver Holding B.V. | 734 | -25,03 | 23 | -14,81 | ||||
| 2026-01-23 | 13F | Optima Capital Llc | 18 | 1 | ||||||
| 2026-02-06 | 13F | ProShare Advisors LLC | 35.533 | 1,27 | 1.132 | 16,22 | ||||
| 2026-01-13 | 13F | Trust Point Inc. | 10.962 | 25,93 | 349 | 44,81 | ||||
| 2026-03-06 | 13F | Hsbc Holdings Plc | 0 | -100,00 | 0 | |||||
| 2026-01-26 | 13F | Cwm, Llc | 2.102 | 9,77 | 0 | |||||
| 2026-02-09 | 13F | Quest Partners LLC | 1.251 | -64,93 | 40 | -60,61 | ||||
| 2025-11-14 | 13F | Nomura Holdings Inc | 0 | -100,00 | 0 | -100,00 | ||||
| 2026-02-19 | 13F | Invesco Ltd. | 534.551 | 19,63 | 17.031 | 37,29 | ||||
| 2026-02-10 | 13F | Commonwealth Of Pennsylvania Public School Empls Retrmt Sys | 39.722 | -4,64 | 1.266 | 9,43 | ||||
| 2026-02-13 | 13F | Victory Capital Management Inc | 245.187 | -36,08 | 7.812 | -26,64 | ||||
| 2026-01-22 | 13F | Massachusetts Financial Services Co /ma/ | 1.284.239 | 3,21 | 40.916 | 18,45 | ||||
| 2026-02-05 | 13F | Gamco Investors, Inc. Et Al | 369.002 | 36,79 | 11.756 | 57,00 | ||||
| 2026-02-17 | 13F | California State Teachers Retirement System | 153.300 | -0,30 | 4.884 | 14,43 | ||||
| 2026-01-14 | 13F | Jfs Wealth Advisors, Llc | 102 | 100,00 | 3 | 200,00 | ||||
| 2026-02-13 | 13F | Quinn Opportunity Partners LLC | 14.000 | 0,00 | 446 | 14,95 | ||||
| 2026-02-11 | 13F | Axiom International Investors Llc /de | 0 | -100,00 | 0 | -100,00 | ||||
| 2025-11-13 | 13F | Twin Tree Management, LP | 0 | -100,00 | 0 | -100,00 | ||||
| 2025-11-13 | 13F | Twin Tree Management, LP | Call | 0 | -100,00 | 0 | -100,00 | |||
| 2025-11-13 | 13F | Twin Tree Management, LP | Put | 0 | -100,00 | 0 | -100,00 | |||
| 2025-11-14 | 13F | Quantessence Capital LLC | 0 | -100,00 | 0 | -100,00 | ||||
| 2026-02-17 | 13F | Durable Capital Partners LP | 8.991.254 | 20,98 | 286.461 | 38,85 | ||||
| 2026-02-02 | 13F | Sachetta, LLC | 53 | 0,00 | 2 | 0,00 | ||||
| 2026-02-12 | 13F | ROSS\JOHNSON & Associates LLC | 3 | 0 | ||||||
| 2026-02-11 | 13F | Capital Analysts, Inc. | 180 | 0,00 | 0 | |||||
| 2026-02-18 | 13F | EP Wealth Advisors, Inc. | 7.067 | 225 | ||||||
| 2026-01-28 | 13F | DekaBank Deutsche Girozentrale | 6.380 | 0,00 | 0 | |||||
| 2025-10-16 | 13F | Ellsworth Advisors, LLC | 0 | -100,00 | 0 | -100,00 | ||||
| 2026-01-22 | 13F | V-Square Quantitative Management LLC | 788 | 25 | ||||||
| 2026-02-11 | 13F | Westfield Capital Management Co Lp | 2.765.305 | 0,27 | 88.103 | 15,08 | ||||
| 2026-02-18 | 13F/A | Fuller & Thaler Asset Management, Inc. | 6.958.800 | 12,12 | 221.707 | 28,68 | ||||
| 2026-01-21 | 13F | SJS Investment Consulting Inc. | 10 | -37,50 | 0 | |||||
| 2026-02-10 | 13F | State of Wyoming | 26.705 | 40,33 | 851 | 60,98 | ||||
| 2026-02-10 | 13F | Root Financial Partners, LLC | 408 | 22,89 | 13 | 33,33 | ||||
| 2026-02-17 | 13F | Boothbay Fund Management, Llc | 0 | -100,00 | 0 | |||||
| 2026-02-12 | 13F | Voya Investment Management Llc | 194.371 | -9,22 | 6.193 | 4,19 | ||||
| 2026-02-11 | 13F | Erste Asset Management GmbH | 0 | 0 | ||||||
| 2026-02-17 | 13F | Public Employees Retirement System Of Ohio | 2.299 | -3,44 | 73 | 10,61 | ||||
| 2026-02-17 | 13F | Aster Capital Management (DIFC) Ltd | 0 | -100,00 | 0 | |||||
| 2026-02-17 | 13F | Voloridge Investment Management, Llc | 366.744 | -40,49 | 11.684 | -31,70 | ||||
| 2026-01-21 | 13F | Yousif Capital Management, Llc | 50.692 | -3,68 | 1.814 | 24,25 | ||||
| 2026-02-11 | 13F | Ameritas Investment Partners, Inc. | 42.061 | 1.340 | ||||||
| 2026-02-03 | 13F | Mitsubishi UFJ Kokusai Asset Management Co., Ltd. | 911 | 0,00 | 29 | 16,00 | ||||
| 2026-02-13 | 13F | Y-Intercept (Hong Kong) Ltd | 96.076 | -31,31 | 3.061 | -21,17 | ||||
| 2026-02-12 | 13F | Cloud Capital Management, LLC | 0 | -100,00 | 0 | |||||
| 2026-02-13 | 13F | Walleye Trading LLC | Put | 9.200 | 293 | |||||
| 2025-11-17 | 13F | Castleark Management Llc | 0 | -100,00 | 0 | |||||
| 2026-02-06 | 13F | Gsa Capital Partners Llp | 0 | -100,00 | 0 | |||||
| 2026-02-13 | 13F | Walleye Trading LLC | Call | 129.900 | 233,08 | 4.139 | 282,44 | |||
| 2026-02-10 | 13F | Acadian Asset Management Llc | 4.735 | -23,07 | 0 | |||||
| 2025-11-21 | 13F | Nebula Research & Development LLC | 0 | -100,00 | 0 | -100,00 | ||||
| 2026-02-09 | 13F | MQS Management LLC | 0 | -100,00 | 0 | |||||
| 2026-02-13 | 13F | Caxton Associates Llp | 0 | -100,00 | 0 | |||||
| 2026-02-10 | 13F/A | Northwestern Mutual Wealth Management Co | 1.792 | 1,19 | 57 | 16,33 | ||||
| 2026-02-06 | 13F | Summit Creek Advisors LLC | 463.516 | -4,55 | 14.768 | 9,55 | ||||
| 2026-01-16 | 13F | Ronald Blue Trust, Inc. | 9.187 | 7,98 | 293 | 23,73 | ||||
| 2026-01-30 | 13F | Activest Wealth Management | 0 | -100,00 | 0 | |||||
| 2025-11-04 | 13F | Convergence Investment Partners, LLC | 0 | -100,00 | 0 | -100,00 | ||||
| 2026-02-10 | 13F | Rothschild Investment Llc | 184 | 2,22 | 6 | 25,00 | ||||
| 2026-01-08 | 13F | Sanders Morris Harris Llc | 0 | -100,00 | 0 | -100,00 | ||||
| 2026-02-17 | 13F | Spears Abacus Advisors LLC | 44.711 | -0,22 | 1.424 | 14,56 | ||||
| 2026-02-14 | 13F | Rockefeller Capital Management L.P. | 4.069 | -1,76 | 130 | 13,16 | ||||
| 2025-10-22 | 13F | Geneos Wealth Management Inc. | 0 | -100,00 | 0 | -100,00 | ||||
| 2026-02-17 | 13F | Dauntless Investment Group, LLC | 0 | -100,00 | 0 | |||||
| 2026-01-26 | 13F/A | Phocas Financial Corp. | 130.667 | 4.163 | ||||||
| 2026-02-09 | 13F | Huntington National Bank | 184 | -45,88 | 6 | -44,44 | ||||
| 2026-02-11 | 13F | Financiere des Professionnels - Fonds d,investissement inc. | 0 | -100,00 | 0 | |||||
| 2026-01-29 | 13F | UBS Group AG | 928.910 | -20,30 | 29.595 | -8,53 | ||||
| 2026-02-17 | 13F | Sciencast Management LP | 53.556 | 1.706 | ||||||
| 2026-02-11 | 13F | Allianz Asset Management GmbH | 722.691 | 1.603,82 | 23.025 | 1.856,16 | ||||
| 2026-02-13 | 13F | Rhumbline Advisers | 467.513 | -13,19 | 14.895 | -0,37 | ||||
| 2026-02-11 | 13F | Clearbridge Investments, LLC | 18.500 | 0,00 | 589 | 14,81 | ||||
| 2026-02-11 | 13F | Los Angeles Capital Management Llc | 17.682 | -29,20 | 463 | -33,19 | ||||
| 2026-01-30 | 13F | Mitsubishi UFJ Trust & Banking Corp | 0 | -100,00 | 0 | |||||
| 2026-02-14 | 13F | Adalta Capital Management LLC | 20.880 | 665 | ||||||
| 2026-02-12 | 13F | Xponance, Inc. | 19.506 | -16,13 | 621 | -3,72 | ||||
| 2026-02-12 | 13F | Colonial Trust Co / SC | 2.000 | 0,00 | 64 | 14,55 | ||||
| 2025-11-12 | 13F | Principal Securities, Inc. | 0 | -100,00 | 0 | -100,00 | ||||
| 2025-10-30 | 13F | Twin Peaks Wealth Advisors, LLC | 0 | -100,00 | 0 | -100,00 | ||||
| 2026-01-21 | 13F | Future Financial Wealth Managment LLC | 0 | -100,00 | 0 | |||||
| 2025-11-14 | 13F | Texas Permanent School Fund | 0 | -100,00 | 0 | -100,00 | ||||
| 2026-02-18 | 13F | Vident Advisory, LLC | 0 | -100,00 | 0 | |||||
| 2026-02-17 | 13F | Prelude Capital Management, Llc | 7.495 | 239 | ||||||
| 2026-01-30 | 13F | Keybank National Association/oh | 6.426 | 205 | ||||||
| 2026-02-17 | 13F | Blair William & Co/il | 72.022 | 0,01 | 2.295 | 14,76 | ||||
| 2025-11-07 | 13F | Fiera Capital Corp | 0 | -100,00 | 0 | |||||
| 2026-01-22 | 13F | Advantage Alpha Capital Partners LP | 0 | -100,00 | 0 | -100,00 | ||||
| 2026-02-17 | 13F | Millennium Management Llc | 480.962 | -35,10 | 15.323 | -25,51 | ||||
| 2026-02-17 | 13F | State Of Wisconsin Investment Board | 103.708 | -17,60 | 3.304 | -5,41 | ||||
| 2026-02-03 | 13F | Crossmark Global Holdings, Inc. | 10.694 | 0,88 | 341 | 15,65 | ||||
| 2026-01-29 | 13F | Teachers Retirement System Of The State Of Kentucky | 48.325 | 0,00 | 2 | 0,00 | ||||
| 2026-01-29 | 13F | Dunhill Financial, LLC | 3 | 0 | ||||||
| 2026-02-17 | 13F | Royal Bank Of Canada | 39.744 | -87,82 | 1.266 | -86,03 | ||||
| 2026-02-13 | 13F | Mariner, LLC | 10.060 | 7,06 | 321 | 23,08 | ||||
| 2026-02-17 | 13F | Signature Equity Partners, LLC | 129 | 4 | ||||||
| 2026-02-04 | 13F | Virginia Retirement Systems Et Al | 31.650 | 47,21 | 1.008 | 69,13 | ||||
| 2026-02-17 | 13F | Aqr Capital Management Llc | 47.118 | -78,21 | 1.501 | -74,89 | ||||
| 2026-02-13 | 13F | Pathstone Holdings, LLC | 59.210 | 1,62 | 1.886 | 16,64 | ||||
| 2026-01-23 | 13F | Assetmark, Inc | 3.839 | -3,28 | 122 | 10,91 | ||||
| 2026-02-12 | 13F | Federated Hermes, Inc. | 13.753 | -14,38 | 438 | -1,57 | ||||
| 2026-02-17 | 13F | Fred Alger Management, Llc | 6.345 | 202 | ||||||
| 2026-02-03 | 13F | Sequoia Financial Advisors, LLC | 10.641 | 339 | ||||||
| 2026-02-04 | 13F | Swiss Life Asset Management Ltd | 7.815 | 0,00 | 249 | 14,81 | ||||
| 2025-11-06 | 13F | Cookson Peirce & Co Inc | 0 | -100,00 | 0 | -100,00 | ||||
| 2026-02-12 | 13F | Jane Street Group, Llc | 135.264 | -68,37 | 4.310 | -63,70 | ||||
| 2026-02-12 | 13F | Jane Street Group, Llc | Put | 58.700 | 1.870 | |||||
| 2026-02-24 | 13F | Bell Investment Advisors, Inc | 38 | 2,70 | 1 | 0,00 | ||||
| 2026-02-12 | 13F | Jane Street Group, Llc | Call | 85.900 | 27,64 | 2.737 | 46,47 | |||
| 2025-11-14 | 13F | Adage Capital Partners Gp, L.l.c. | 0 | -100,00 | 0 | -100,00 | ||||
| 2026-02-13 | 13F | Sei Investments Co | 245.893 | -57,26 | 7.834 | -50,95 | ||||
| 2026-04-10 | 13F/A | OP Asset Management Ltd | 21.948 | 591 | ||||||
| 2026-02-05 | 13F | Td Private Client Wealth Llc | 12.099 | 14,23 | 385 | 30,95 | ||||
| 2026-01-26 | 13F | Whittier Trust Co Of Nevada Inc | 1.446 | 0,00 | 47 | 20,51 | ||||
| 2026-02-17 | 13F | Point72 Asset Management, L.P. | 273.400 | 8.711 | ||||||
| 2026-02-03 | 13F | Legacy Wealth Managment, LLC/ID | 23 | 0,00 | 1 | |||||
| 2025-11-12 | 13F | GABELLI & Co INVESTMENT ADVISERS, INC. | 0 | -100,00 | 0 | |||||
| 2026-02-17 | 13F | D. E. Shaw & Co., Inc. | 432.973 | -68,90 | 13.795 | -64,30 | ||||
| 2026-02-11 | 13F | J.Safra Asset Management Corp | 90 | 0,00 | 3 | 0,00 | ||||
| 2026-02-11 | 13F | Simplex Trading, Llc | Put | 21.900 | 51,03 | 698 | ||||
| 2026-02-02 | 13F | Cornerstone Planning Group LLC | 14 | -98,70 | 0 | -100,00 | ||||
| 2026-02-11 | 13F | Simplex Trading, Llc | 10.191 | 11,47 | 325 | |||||
| 2026-01-29 | 13F | State Of Michigan Retirement System | 37.559 | -2,85 | 1.197 | 11,46 | ||||
| 2026-02-10 | 13F | Godfrey Financial Associates, Inc. | 74 | 0 | ||||||
| 2026-02-05 | 13F | Bessemer Group Inc | 929 | 6,41 | 0 | |||||
| 2026-01-20 | 13F | Whalen Wealth Management Inc. | 0 | -100,00 | 0 | -100,00 | ||||
| 2026-02-10 | 13F | Principia Wealth Advisory, LLC | 4 | 0,00 | 0 | |||||
| 2026-01-23 | 13F | Private Wealth Management Group, LLC | 18 | 0,00 | 1 | |||||
| 2026-01-15 | 13F | Fortitude Family Office, LLC | 50 | -16,67 | 2 | 0,00 | ||||
| 2026-02-10 | 13F | Jupiter Asset Management Ltd | 708.742 | 35,28 | 22.581 | 55,26 | ||||
| 2025-10-30 | 13F | Bailard, Inc. | 0 | -100,00 | 0 | -100,00 | ||||
| 2026-02-04 | 13F | Versor Investments LP | 0 | -100,00 | 0 | |||||
| 2026-02-06 | 13F | Profund Advisors Llc | 6.645 | 212 | ||||||
| 2026-02-13 | 13F | Cynosure Management, Llc | 16.404 | 523 | ||||||
| 2025-11-14 | 13F | Snowden Capital Advisors LLC | 0 | -100,00 | 0 | |||||
| 2026-01-28 | 13F | Klp Kapitalforvaltning As | 34.675 | 1,46 | 1.105 | 16,46 | ||||
| 2026-02-05 | 13F | Amalgamated Bank | 66.873 | -6,20 | 2 | 100,00 | ||||
| 2026-02-09 | 13F | Employees Retirement System of Texas | 1.404 | 0 | ||||||
| 2026-02-17 | 13F | Millennium Management Llc | Put | 0 | -100,00 | 0 | ||||
| 2026-02-06 | 13F | Cullen/frost Bankers, Inc. | 18 | -97,42 | 1 | -100,00 | ||||
| 2025-12-09 | 13F/A | Tudor Investment Corp Et Al | 175.344 | -38,27 | 4.868 | -47,25 | ||||
| 2026-02-12 | 13F | MetLife Investment Management, LLC | 162.957 | -7,99 | 5.192 | 5,59 | ||||
| 2026-02-02 | 13F | Kornitzer Capital Management Inc /ks | 424.620 | 0,03 | 13.528 | 14,81 | ||||
| 2026-02-17 | 13F | Abel Hall, LLC | 12.881 | 410 | ||||||
| 2026-02-10 | 13F | Connor, Clark & Lunn Investment Management Ltd. | 61.648 | -91,02 | 1.964 | -89,69 | ||||
| 2026-02-13 | 13F | SRS Capital Advisors, Inc. | 248 | -0,40 | 8 | 16,67 | ||||
| 2026-01-15 | 13F | Retirement Systems of Alabama | 190.506 | -2,91 | 6.070 | 11,42 | ||||
| 2026-02-13 | 13F | Verition Fund Management LLC | 65.105 | -29,18 | 2.074 | -18,70 | ||||
| 2026-02-06 | 13F | Global Retirement Partners, LLC | 2.874 | 5.648,00 | 92 | 9.000,00 | ||||
| 2026-02-10 | 13F | Natixis Advisors, L.p. | 61.642 | 9,28 | 2 | 0,00 | ||||
| 2026-02-13 | 13F | Bridgefront Capital, LLC | 0 | -100,00 | 0 | |||||
| 2026-02-26 | 13F | Anchor Investment Management, LLC | 2.000 | 0,00 | 64 | 14,55 | ||||
| 2026-02-10 | 13F | Private Wealth Asset Management, LLC | 6 | 0,00 | 0 | |||||
| 2026-02-09 | 13F | Jackson Creek Investment Advisors LLC | 0 | -100,00 | 0 | |||||
| 2026-02-12 | 13F | Rossby Financial, LCC | 7 | 0 | ||||||
| 2026-02-17 | 13F | Atom Investors LP | 0 | -100,00 | 0 | |||||
| 2026-02-12 | 13F | Renaissance Technologies Llc | 483.826 | -58,45 | 15.415 | -52,32 | ||||
| 2026-02-17 | 13F | Tudor Investment Corp Et Al | Call | 27.600 | 879 | |||||
| 2026-01-20 | 13F | Harbor Capital Advisors, Inc. | 25.404 | -2,13 | 1 | |||||
| 2025-11-14 | 13F | Wolverine Trading, Llc | Call | 7.500 | -1,32 | 207 | -15,92 | |||
| 2026-02-11 | 13F | Simplex Trading, Llc | Call | 22.800 | 10,14 | 726 | ||||
| 2025-11-21 | 13F/A | CIBC Bancorp USA Inc. | 17.571 | 488 | ||||||
| 2026-01-07 | 13F | Massmutual Trust Co Fsb/adv | 276 | 6,98 | 9 | 14,29 | ||||
| 2026-02-11 | 13F | Winnow Wealth Llc | 1.898 | -23,13 | 61 | -13,04 | ||||
| 2026-02-13 | 13F | Bridgewater Associates, LP | 0 | -100,00 | 0 | |||||
| 2026-02-17 | 13F | Tower Research Capital LLC (TRC) | 8.531 | -50,91 | 272 | -43,78 | ||||
| 2026-01-21 | 13F | Clayton Financial Group LLC | 100 | 0,00 | 3 | 50,00 | ||||
| 2026-02-13 | 13F | Arvin Capital Management LP | 488.572 | -34,19 | 15.566 | -24,47 | ||||
| 2026-02-10 | 13F | Nomura Asset Management Co Ltd | 1.060 | 0,00 | 34 | 13,79 | ||||
| 2026-02-13 | 13F | Arvin Capital Management LP | Call | 0 | -100,00 | 0 | -100,00 | |||
| 2026-02-05 | 13F | Allworth Financial LP | 2.344 | -20,22 | 75 | -8,64 | ||||
| 2026-02-03 | 13F | Farmers & Merchants Investments Inc | 238 | 72,46 | 8 | 133,33 | ||||
| 2026-01-29 | 13F | Live Oak Investment Partners | 48.861 | 48,59 | 1.557 | 70,61 | ||||
| 2026-02-10 | 13F | Meramec Financial Planners, LLC | 204 | 7 | ||||||
| 2026-02-13 | 13F | Prudential Financial Inc | 26.141 | -93,32 | 833 | -92,35 | ||||
| 2026-02-09 | 13F | Geode Capital Management, Llc | 4.117.393 | -2,00 | 131.200 | 12,48 | ||||
| 2026-02-10 | 13F | Bank of New York Mellon Corp | 1.097.917 | -6,78 | 34.980 | 6,98 | ||||
| 2026-02-10 | 13F | Eurizon Capital SGR S.p.A. | 4.467 | 143 | ||||||
| 2026-02-17 | 13F | Wellington Management Group Llp | 11.965.561 | -6,35 | 381.223 | 7,48 | ||||
| 2025-11-17 | 13F | Jacobs Levy Equity Management, Inc | 0 | -100,00 | 0 | -100,00 | ||||
| 2026-01-27 | 13F | Zurcher Kantonalbank (Zurich Cantonalbank) | 53.188 | 3,10 | 1.695 | 18,30 | ||||
| 2026-01-29 | 13F | Quent Capital, LLC | 7 | 75,00 | 0 | |||||
| 2025-11-13 | 13F | Change Path, LLC | 0 | -100,00 | 0 | -100,00 | ||||
| 2026-01-20 | 13F | Sheets Smith Wealth Management | 26.167 | 1,26 | 834 | 16,18 | ||||
| 2026-02-17 | 13F | Delaware Management Holdings, Inc. | 15.904 | 507 | ||||||
| 2026-02-13 | 13F | Police & Firemen's Retirement System of New Jersey | 43.681 | -6,58 | 1.392 | 7,25 | ||||
| 2026-02-17 | 13F | Susquehanna International Group, Llp | Call | 662.500 | 377,65 | 21.107 | 448,23 | |||
| 2026-02-05 | 13F | Atria Investments Llc | 14.958 | 3,14 | 477 | 18,41 | ||||
| 2026-04-09 | 13F | Park Place Capital Corp | 825 | 0,00 | 22 | -15,38 | ||||
| 2026-02-06 | 13F | Creative Financial Designs Inc /adv | 699 | 22 | ||||||
| 2026-02-17 | 13F | Susquehanna International Group, Llp | 27.457 | -46,84 | 875 | -39,01 | ||||
| 2025-11-12 | 13F | Group One Trading, L.p. | 0 | -100,00 | 0 | -100,00 | ||||
| 2026-02-06 | 13F | Covestor Ltd | 294 | 0,00 | 0 | |||||
| 2026-02-17 | 13F | Susquehanna International Group, Llp | Put | 477.000 | 173,51 | 15.197 | 213,92 | |||
| 2026-01-29 | 13F | Cornerstone National Bank & Trust Co | 2.000 | 0,00 | 64 | 14,55 | ||||
| 2026-02-12 | 13F | Swiss National Bank | 320.000 | 0,79 | 10.195 | 15,68 | ||||
| 2025-11-12 | 13F | Neo Ivy Capital Management | 0 | -100,00 | 0 | -100,00 | ||||
| 2026-02-11 | 13F | Fox Run Management, L.l.c. | 0 | -100,00 | 0 | |||||
| 2026-02-05 | 13F | Teton Advisors, LLC | 13.000 | -25,15 | 414 | -14,11 | ||||
| 2026-02-10 | 13F | Bridges Investment Management Inc | 63.343 | 5,18 | 2.018 | 20,77 | ||||
| 2026-02-17 | 13F | Capstone Investment Advisors, Llc | 0 | -100,00 | 0 | -100,00 | ||||
| 2026-02-17 | 13F | Gilder Gagnon Howe & Co Llc | 808.608 | -1,81 | 25.762 | 12,70 | ||||
| 2026-02-13 | 13F | Caitong International Asset Management Co., Ltd | 418 | -69,15 | 13 | -64,86 | ||||
| 2026-02-12 | 13F | Loomis Sayles & Co L P | 1.247.423 | 3,02 | 39.743 | 18,23 | ||||
| 2026-02-02 | 13F | Bay Harbor Wealth Management, LLC | 12 | 50,00 | 0 | |||||
| 2026-02-13 | 13F | Edgestream Partners, L.P. | 0 | -100,00 | 0 | |||||
| 2026-02-13 | 13F | Charles Schwab Investment Management Inc | 2.425.369 | -4,54 | 77.272 | 9,57 | ||||
| 2026-02-17 | 13F | Canada Pension Plan Investment Board | 34.900 | -29,21 | 1.112 | -18,79 | ||||
| 2026-02-17 | 13F | Ancora Advisors, LLC | 23 | -43,90 | 1 | -100,00 | ||||
| 2026-02-13 | 13F | First Trust Advisors Lp | 81.379 | 39,48 | 2.593 | 60,10 | ||||
| 2026-02-17 | 13F | Amundi | 748.132 | 18,75 | 23.835 | 38,43 | ||||
| 2026-02-17 | 13F | Guggenheim Capital Llc | 30.160 | 81,48 | 961 | 108,24 | ||||
| 2026-02-02 | 13F | Horizon Investments, LLC | 21.981 | -12,79 | 700 | 0,14 | ||||
| 2025-10-27 | 13F | Stephens Inc /ar/ | 0 | -100,00 | 0 | -100,00 | ||||
| 2025-11-12 | 13F | Integrated Quantitative Investments LLC | 0 | -100,00 | 0 | -100,00 | ||||
| 2026-04-09 | 13F | Nelson, Van Denburg & Campbell Wealth Management Group, LLC | 0 | -100,00 | 0 | |||||
| 2026-02-13 | 13F | Alyeska Investment Group, L.P. | 1.210.248 | 38.559 | ||||||
| 2026-02-17 | 13F | Southpoint Capital Advisors LP | 3.000.000 | 95.580 | ||||||
| 2026-02-17 | 13F | Zacks Investment Management | 26.461 | -59,80 | 843 | -53,86 | ||||
| 2026-01-14 | 13F | Wedge Capital Management L L P/nc | 153.356 | 7,75 | 4.886 | 23,67 | ||||
| 2026-02-17 | 13F | Raymond James Financial Inc | 245.588 | 8,38 | 7.824 | 24,39 | ||||
| 2026-01-30 | 13F | Rachor Investment Advisory Services, LLC | 37 | 1 | ||||||
| 2026-01-09 | 13F | SG Americas Securities, LLC | 57.113 | 317,74 | 2 | |||||
| 2026-02-18 | 13F | Mackenzie Financial Corp | 44.330 | -49,20 | 1.423 | -41,29 | ||||
| 2026-02-13 | 13F | Segall Bryant & Hamill, Llc | 361.494 | 4,23 | 11.517 | 19,63 | ||||
| 2026-02-12 | 13F | Nuveen, LLC | 1.564.790 | 0,24 | 49.854 | 15,05 | ||||
| 2026-02-12 | 13F | Ensign Peak Advisors, Inc | 11.483 | -67,36 | 366 | -62,60 | ||||
| 2026-02-04 | 13F | Nicholas Company, Inc. | 214.720 | -14,48 | 6.841 | -1,87 | ||||
| 2026-02-06 | 13F | Sierra Summit Advisors Llc | 0 | -100,00 | 0 | |||||
| 2026-02-13 | 13F | Ubs Asset Management Americas Inc | 510.745 | -3,68 | 16.272 | 10,54 | ||||
| 2025-10-27 | 13F | Bogart Wealth, LLC | 0 | -100,00 | 0 | |||||
| 2026-02-10 | 13F | Daiwa Securities Group Inc. | 0 | -100,00 | 0 | |||||
| 2026-02-11 | 13F | Vise Technologies, Inc. | 17.151 | 98,48 | 546 | 128,45 | ||||
| 2026-02-13 | 13F | Manufacturers Life Insurance Company, The | 0 | -100,00 | 0 | |||||
| 2026-04-10 | 13F | Country Trust Bank | 0 | -100,00 | 0 | |||||
| 2026-02-17 | 13F | Lombard Odier Asset Management (USA) Corp | 0 | -100,00 | 0 | |||||
| 2026-02-10 | 13F | AdvisorShares Investments LLC | 15.100 | 481 | ||||||
| 2026-02-06 | 13F | EverSource Wealth Advisors, LLC | 1.830 | -25,21 | 58 | -13,43 | ||||
| 2025-11-12 | 13F | Bare Financial Services, Inc | 0 | -100,00 | 0 | |||||
| 2026-02-12 | 13F | Skopos Labs, Inc. | 6.269 | 202 | ||||||
| 2026-01-28 | 13F | Universal- Beteiligungs- und Servicegesellschaft mbH | 88.388 | -43,10 | 2.818 | -34,65 | ||||
| 2026-02-17 | 13F | Brevan Howard Capital Management LP | 0 | -100,00 | 0 | |||||
| 2026-02-17 | 13F | Price T Rowe Associates Inc /md/ | 2.061.494 | -1,66 | 66 | 12,07 | ||||
| 2026-02-17 | 13F | Engineers Gate Manager LP | 0 | -100,00 | 0 | |||||
| 2026-02-18 | 13F | State of Tennessee, Treasury Department | 103.812 | -4,11 | 3.530 | 17,44 | ||||
| 2026-04-06 | 13F | GAMMA Investing LLC | 4.598 | -14,95 | 124 | -28,49 | ||||
| 2026-01-29 | 13F | UMA Financial Services, Inc. | 0 | -100,00 | 0 | |||||
| 2026-01-30 | 13F/A | M&t Bank Corp | 7.287 | 232 | ||||||
| 2026-02-05 | 13F | Staley Capital Advisers Inc | 225.000 | -25,00 | 7.168 | -13,93 | ||||
| 2026-02-10 | 13F | Norges Bank | 1.939.322 | 61.787 | ||||||
| 2026-02-02 | 13F | Principal Financial Group Inc | 476.852 | 5,92 | 15.193 | 21,57 | ||||
| 2026-02-10 | 13F | Globeflex Capital L P | 26 | 0,00 | 1 | |||||
| 2026-02-17 | 13F | Lazard Asset Management Llc | 27.843 | 72,15 | 887 | 97,99 | ||||
| 2026-02-05 | 13F | Gabelli Funds Llc | 503.310 | 2,03 | 16.035 | 17,10 | ||||
| 2025-11-14 | 13F | Hrt Financial Lp | 0 | -100,00 | 0 | -100,00 | ||||
| 2026-02-04 | 13F | Pacer Advisors, Inc. | 0 | -100,00 | 0 | |||||
| 2026-01-26 | 13F | Private Trust Co Na | 0 | -100,00 | 0 | |||||
| 2026-02-13 | 13F | JustInvest LLC | 24.351 | 6,86 | 776 | 22,63 | ||||
| 2026-02-17 | 13F | MIRAE ASSET GLOBAL ETFS HOLDINGS Ltd. | 74.217 | -3,08 | 2.365 | 11,25 | ||||
| 2026-02-12 | 13F | Marex Group plc | 0 | -100,00 | 0 | -100,00 | ||||
| 2026-01-23 | 13F | Retirement Guys Formula Llc | 6.857 | 218 | ||||||
| 2025-11-13 | 13F | Inceptionr Llc | 0 | -100,00 | 0 | -100,00 | ||||
| 2026-01-30 | 13F | New York State Teachers Retirement System | 99.564 | -0,90 | 3 | 50,00 | ||||
| 2026-02-17 | 13F | Susquehanna Fundamental Investments, Llc | 34.821 | -87,59 | 1.109 | -85,77 | ||||
| 2026-01-29 | 13F | Vanguard Group Inc | 16.647.553 | -5,88 | 530.391 | 8,03 | ||||
| 2026-02-13 | 13F | State Street Corp | 5.789.782 | -3,94 | 184.462 | 10,25 | ||||
| 2026-02-13 | 13F | Great West Life Assurance Co /can/ | 92.216 | -22,68 | 3 | -33,33 | ||||
| 2025-11-14 | 13F | Aristeia Capital Llc | 0 | -100,00 | 0 | |||||
| 2026-02-17 | 13F | Jones Financial Companies Lllp | 844 | 171,38 | 27 | 225,00 | ||||
| 2026-01-27 | 13F | First Horizon Corp | 74 | 0,00 | 2 | 0,00 | ||||
| 2026-01-30 | 13F | Us Bancorp \de\ | 4.269 | -40,15 | 136 | -31,31 | ||||
| 2026-02-13 | 13F | Barclays Plc | 378.384 | -11,26 | 12.055 | 1,84 | ||||
| 2026-02-13 | 13F | Umb Bank N A/mo | 1.715 | 23,47 | 55 | 42,11 | ||||
| 2026-02-13 | 13F | Barclays Plc | Call | 99.000 | 3.154 | |||||
| 2026-02-09 | 13F | Legal & General Group Plc | 253.777 | -7,66 | 8.085 | 5,98 | ||||
| 2026-02-17 | 13F | Qube Research & Technologies Ltd | 0 | -100,00 | 0 | |||||
| 2026-01-29 | 13F | IMC-Chicago, LLC | 11.272 | 1,61 | 359 | 16,94 | ||||
| 2025-11-07 | 13F | Shell Asset Management Co | 2.062 | -60,14 | 0 | |||||
| 2026-01-23 | 13F | TFC Financial Management | 4 | 0 | ||||||
| 2026-01-29 | 13F | IMC-Chicago, LLC | Put | 27.400 | 873 | |||||
| 2026-01-29 | 13F | IMC-Chicago, LLC | Call | 27.300 | 15,68 | 870 | 32,67 | |||
| 2026-01-13 | 13F | Fort Washington Investment Advisors Inc /oh/ | 1.437.411 | 13,12 | 45.796 | 29,83 | ||||
| 2026-01-09 | 13F | Assenagon Asset Management S.A. | 37.761 | -87,17 | 1.203 | -85,28 | ||||
| 2025-11-07 | 13F | Sierra Ocean, Llc | 0 | -100,00 | 0 | |||||
| 2026-01-28 | 13F | Teacher Retirement System Of Texas | 71.459 | -13,06 | 2.277 | -0,22 | ||||
| 2026-02-13 | 13F | Prospector Partners Llc | 0 | -100,00 | 0 | |||||
| 2026-02-12 | 13F | State Board Of Administration Of Florida Retirement System | 132.326 | 0,00 | 4.216 | 14,76 | ||||
| 2026-01-15 | 13F | Nisa Investment Advisors, Llc | 5.136 | -1,68 | 164 | 12,41 | ||||
| 2026-01-29 | 13F | Directional Asset Management | 314.450 | 10.018 | ||||||
| 2026-02-13 | 13F | Quarry LP | 115 | -92,58 | 4 | -93,02 | ||||
| 2026-02-09 | 13F | Annis Gardner Whiting Capital Advisors, LLC | 136 | 4 | ||||||
| 2026-02-17 | 13F | Fmr Llc | 9.333.921 | 7,80 | 297.379 | 23,72 | ||||
| 2026-02-11 | 13F | Jpmorgan Chase & Co | 740.848 | -1,85 | 23.603 | 12,64 | ||||
| 2025-12-16 | 13F | Lindenwold Advisors | 8.884 | 1,00 | 247 | -13,68 | ||||
| 2026-02-12 | 13F | Tocqueville Asset Management L.p. | 37.500 | 0,00 | 1.195 | 14,70 | ||||
| 2026-02-17 | 13F | Algert Global Llc | 0 | -100,00 | 0 | |||||
| 2026-02-17 | 13F | Freestone Grove Partners LP | 915.898 | 29.181 | ||||||
| 2026-02-10 | 13F | Intech Investment Management Llc | 213.527 | 13,48 | 6.803 | 30,23 | ||||
| 2026-02-11 | 13F | Janney Capital Management LLC | 9.268 | 1,73 | 0 | |||||
| 2026-02-02 | 13F | Seizert Capital Partners, Llc | 131.860 | 3,40 | 4.201 | 18,67 | ||||
| 2026-02-13 | 13F | Stifel Financial Corp | 23.108 | -3,44 | 736 | 10,84 | ||||
| 2026-02-13 | 13F | Squarepoint Ops LLC | 10.375 | 331 | ||||||
| 2026-02-03 | 13F | SBI Securities Co., Ltd. | 18 | -5,26 | 1 | |||||
| 2026-02-06 | 13F | Handelsbanken Fonder AB | 39.900 | 0,00 | 1 | 0,00 | ||||
| 2026-01-14 | 13F | Exchange Traded Concepts, Llc | 30.153 | 8,65 | 961 | 24,68 | ||||
| 2026-01-30 | 13F | Jennison Associates Llc | 1.163.931 | -8,25 | 37.083 | 5,30 | ||||
| 2026-02-11 | 13F | Vestcor Inc | 26.351 | -35,69 | 1 | -100,00 | ||||
| 2026-02-13 | 13F | Entropy Technologies, LP | 0 | -100,00 | 0 | |||||
| 2026-01-29 | 13F | James Investment Research Inc | 14.610 | 0,00 | 465 | 14,81 | ||||
| 2026-02-17 | 13F | Two Sigma Advisers, Lp | 7.300 | -98,51 | 233 | -98,29 | ||||
| 2026-01-26 | 13F | KBC Group NV | 4.465 | 0,00 | 0 | |||||
| 2026-02-17 | 13F | Northern Trust Corp | 1.972.276 | -8,61 | 62.837 | 4,89 | ||||
| 2026-02-17 | 13F | Leonteq Securities AG | 0 | -100,00 | 0 | |||||
| 2026-02-12 | 13F | Quadrant Capital Group Llc | 8.238 | 151,70 | 262 | 191,11 | ||||
| 2026-02-17 | 13F | Capital Fund Management S.a. | 0 | -100,00 | 0 | |||||
| 2026-02-18 | 13F | Garton & Associates Financial Advisors LLC | 400 | 13 | ||||||
| 2026-02-12 | 13F | Ci Investments Inc. | 0 | -100,00 | 0 | |||||
| 2026-02-13 | 13F | Healthcare Of Ontario Pension Plan Trust Fund | 0 | -100,00 | 0 | |||||
| 2026-02-05 | 13F | Northwestern Mutual Investment Management Company, Llc | 35.514 | -1,82 | 1.131 | 12,65 | ||||
| 2026-02-11 | 13F | O'shaughnessy Asset Management, Llc | 0 | -100,00 | 0 | -100,00 | ||||
| 2026-01-28 | 13F | Arizona State Retirement System | 45.453 | -6,23 | 1.448 | 7,66 | ||||
| 2026-01-13 | 13F | Riverbridge Partners Llc | 1.262.553 | -12,74 | 40.225 | 0,14 | ||||
| 2026-02-17 | 13F | Schonfeld Strategic Advisors LLC | 0 | -100,00 | 0 | |||||
| 2026-01-15 | 13F | Highline Wealth Partners Llc | 0 | -100,00 | 0 | -100,00 | ||||
| 2026-02-17 | 13F | Janus Henderson Group Plc | 69.239 | 0,00 | 2.206 | 14,78 | ||||
| 2026-02-10 | 13F | Axq Capital, Lp | 6.915 | -82,75 | 220 | -80,22 | ||||
| 2025-10-28 | 13F | Thrive Capital Management, LLC | 0 | -100,00 | 0 | |||||
| 2026-02-04 | 13F | Madison Asset Management, LLC | 163.684 | 0,64 | 5.215 | 15,48 | ||||
| 2026-02-11 | 13F | Franklin Resources Inc | 152.633 | -6,22 | 4.863 | 7,61 | ||||
| 2026-02-12 | 13F | Geneva Capital Management Llc | 0 | -100,00 | 0 | |||||
| 2026-02-17 | 13F | Captrust Financial Advisors | 11.713 | 2,03 | 373 | 17,30 | ||||
| 2026-02-05 | 13F | Thrivent Financial For Lutherans | 38.179 | -3,88 | 1 | 0,00 | ||||
| 2026-02-12 | 13F | BRYN MAWR TRUST Co | 420 | 0,00 | 13 | 18,18 | ||||
| 2025-11-12 | 13F | Brinker Capital Investments, LLC | 0 | -100,00 | 0 | |||||
| 2026-02-13 | 13F | Wells Fargo & Company/mn | 207.916 | 42,31 | 6.624 | 63,35 | ||||
| 2026-02-05 | 13F | Cambridge Investment Research Advisors, Inc. | 7.816 | -12,04 | 0 | |||||
| 2026-02-12 | 13F | Andina Capital Management, LLC | 16.320 | 2,64 | 520 | 17,69 | ||||
| 2026-02-11 | 13F | Livforsakringsbolaget Skandia, Omsesidigt | 119.900 | 5,64 | 3.741 | 18,80 | ||||
| 2026-02-12 | 13F | Elo Mutual Pension Insurance Co | 0 | -100,00 | 0 | |||||
| 2026-01-22 | 13F/A | Cresset Asset Management, LLC | 0 | -100,00 | 0 | -100,00 | ||||
| 2026-02-17 | 13F | Summit Trail Advisors, Llc | 20.613 | 1,62 | 657 | 16,52 | ||||
| 2026-02-13 | 13F | Walleye Capital LLC | Put | 29.500 | 940 | |||||
| 2026-02-13 | 13F | Landscape Capital Management, L.l.c. | 0 | -100,00 | 0 | |||||
| 2026-02-13 | 13F | Walleye Capital LLC | 16.173 | 515 | ||||||
| 2026-02-12 | 13F | Wealthspire Advisors, LLC | 11.172 | 6,16 | 356 | 21,58 | ||||
| 2026-02-13 | 13F | Walleye Capital LLC | Call | 78.500 | 2.501 | |||||
| 2025-11-14 | 13F | Teza Capital Management LLC | 0 | -100,00 | 0 | |||||
| 2026-01-08 | 13F | Nordea Investment Management Ab | 86.851 | -10,53 | 2.776 | 3,78 | ||||
| 2026-02-17 | 13F | Jump Financial, LLC | 0 | -100,00 | 0 | |||||
| 2026-02-12 | 13F | Counterpoint Mutual Funds LLC | 37.351 | 1.305 | ||||||
| 2026-01-12 | 13F | Rialto Wealth Management, LLC | 14 | 250,00 | 0 | |||||
| 2026-02-17 | 13F | Cetera Investment Advisers | 21.835 | -6,30 | 696 | 7,59 | ||||
| 2026-02-13 | 13F | Motiv8 Investments LLC | 152 | 0 | ||||||
| 2026-02-13 | 13F | Kilter Group LLC | 147 | 406,90 | 5 | |||||
| 2026-02-13 | 13F | BNP Paribas Asset Management Holding S.A. | 2.685 | 35,06 | 0 | |||||
| 2026-02-05 | 13F | HFM Investment Advisors, LLC | 10 | 42,86 | 0 | |||||
| 2026-02-06 | 13F | HighTower Advisors, LLC | 452.598 | 3,77 | 14.420 | 19,10 | ||||
| 2026-04-07 | 13F | Central Pacific Bank - Trust Division | 11.629 | -2,97 | 313 | -17,85 | ||||
| 2026-02-05 | 13F | HighMark Wealth Management LLC | 383 | 0,00 | 12 | 20,00 | ||||
| 2026-02-09 | 13F/A | Swedbank AB | 1.726.000 | -3,12 | 54.990 | 11,19 | ||||
| 2026-01-13 | 13F | Dakota Wealth Management | 6.808 | 217 | ||||||
| 2026-02-12 | 13F | Cibc World Markets Corp | 10.571 | -47,95 | 337 | -49,01 | ||||
| 2026-02-17 | 13F | Game Creek Capital, LP | 60.000 | 9,09 | 1.912 | 25,23 | ||||
| 2026-02-11 | 13F | Parallel Advisors, LLC | 806 | -5,62 | 26 | 8,70 | ||||
| 2026-02-17 | 13F | Crawford Fund Management, LLC | 367.000 | 11.693 | ||||||
| 2025-12-29 | 13F | Cape Investment Advisory, Inc. | 0 | -100,00 | 0 | |||||
| 2026-02-05 | 13F | Isthmus Partners, Llc | 118.169 | 0,64 | 3.765 | 15,50 | ||||
| 2026-02-17 | 13F | SageView Advisory Group, LLC | 238 | 8 | ||||||
| 2025-11-14 | 13F | Point72 (DIFC) Ltd | 391.700 | 69,32 | 10.874 | 44,72 | ||||
| 2026-02-17 | 13F | Crawford Fund Management, LLC | Call | 22.000 | 83,33 | 701 | 110,21 | |||
| 2026-02-17 | 13F | Jain Global LLC | 26.196 | 835 | ||||||
| 2026-02-17 | 13F | Kemnay Advisory Services Inc. | 404 | 13 | ||||||
| 2026-01-16 | 13F | Louisiana State Employees Retirement System | 43.900 | -2,88 | 1.399 | 11,48 | ||||
| 2025-10-31 | 13F | Estate Counselors, LLC | 0 | -100,00 | 0 | -100,00 | ||||
| 2025-10-30 | 13F | CVA Family Office, LLC | 0 | -100,00 | 0 | |||||
| 2026-02-18 | 13F | GWM Advisors LLC | 0 | -100,00 | 0 | |||||
| 2026-02-09 | 13F | Hartland & Co., LLC | 13.755 | 43,43 | 438 | 64,66 | ||||
| 2026-02-11 | 13F | Illinois Municipal Retirement Fund | 0 | -100,00 | 0 | |||||
| 2025-11-14 | 13F | Mount Yale Investment Advisors, LLC | 0 | -100,00 | 0 | -100,00 | ||||
| 2025-11-14 | 13F | Graham Capital Management, L.P. | 0 | -100,00 | 0 | |||||
| 2026-01-15 | 13F | Allspring Global Investments Holdings, LLC | 0 | -100,00 | 0 | -100,00 | ||||
| 2026-02-12 | 13F | Steward Partners Investment Advisory, Llc | 1.755 | 0,00 | 56 | 14,58 | ||||
| 2025-11-14 | 13F | Twinbeech Capital Lp | 0 | -100,00 | 0 | -100,00 | ||||
| 2026-02-03 | 13F | McIlrath & Eck, LLC | 209 | 7 | ||||||
| 2026-02-11 | 13F | Group One Trading, L.p. | Put | 42.600 | 0,24 | 1.357 | 15,10 | |||
| 2026-02-02 | 13F | Strs Ohio | 12.300 | -74,48 | 392 | -70,78 | ||||
| 2026-02-11 | 13F | Group One Trading, L.p. | Call | 77.700 | 5,28 | 2.476 | 20,85 | |||
| 2026-02-17 | 13F | Man Group plc | 264.118 | -29,35 | 8.415 | -18,92 | ||||
| 2026-02-17 | 13F | Sovereign's Capital Management, LLC | 157.308 | -6,69 | 5.012 | 7,10 | ||||
| 2026-02-23 | 13F | Mv Capital Management, Inc. | 25 | 0,00 | 1 | |||||
| 2026-02-12 | 13F | CIBC Private Wealth Group, LLC | 228 | 11.300,00 | 7 | |||||
| 2026-02-12 | 13F | BlackRock, Inc. | 19.869.127 | -1,49 | 633.030 | 13,06 | ||||
| 2026-02-06 | 13F | Pnc Financial Services Group, Inc. | 15.031 | -1,67 | 479 | 12,74 | ||||
| 2026-02-17 | 13F | Silvercrest Asset Management Group Llc | 521.452 | -7,18 | 16.613 | 6,53 | ||||
| 2026-02-10 | 13F | Mutual Of America Capital Management Llc | 142.592 | -6,18 | 4.543 | 7,68 | ||||
| 2026-02-09 | 13F | Atlantic Trust, LLC | 95 | 39,71 | 3 | 200,00 | ||||
| 2026-02-13 | 13F | Boston Partners | 1.451.106 | 21,10 | 46.790 | 40,93 | ||||
| 2026-02-06 | 13F | Larson Financial Group LLC | 465 | 23,02 | 15 | 40,00 | ||||
| 2026-02-13 | 13F | Neuberger Berman Group LLC | 366.224 | -5,94 | 11.668 | 7,96 | ||||
| 2026-02-13 | 13F | Headlands Technologies LLC | 0 | -100,00 | 0 | |||||
| 2026-01-29 | 13F | Cornerstone Investment Partners, LLC | 9.773 | 3,36 | 311 | 18,70 | ||||
| 2026-02-13 | 13F | Morgan Stanley | 3.410.233 | 13,32 | 108.650 | 30,05 | ||||
| 2026-02-06 | 13F | Tortoise Investment Management, LLC | 0 | -100,00 | 0 | |||||
| 2026-02-17 | 13F | Creative Planning | 127.123 | 20,07 | 4.050 | 37,80 | ||||
| 2025-11-06 | 13F | Bryce Point Capital, LLC | 24.737 | 687 | ||||||
| 2026-02-13 | 13F | Toroso Investments, LLC | 16.389 | 97,24 | 522 | 126,96 | ||||
| 2026-02-17 | 13F | Perbak Capital Partners LLP | 8.550 | -55,57 | 272 | -49,06 | ||||
| 2026-02-13 | 13F/A | Ontario Teachers Pension Plan Board | 0 | -100,00 | 0 | -100,00 | ||||
| 2026-01-29 | 13F | Pictet Asset Management Holding SA | 24.199 | 7,51 | 771 | 23,40 | ||||
| 2026-01-30 | 13F | State of New Jersey Common Pension Fund D | 76.268 | -0,18 | 2.430 | 14,58 | ||||
| 2026-02-17 | 13F | PharVision Advisers, LLC | 0 | -100,00 | 0 | |||||
| 2026-02-03 | 13F | Ethic Inc. | 6.399 | 204 | ||||||
| 2026-02-13 | 13F | Arrowstreet Capital, Limited Partnership | 4.248.425 | 6,18 | 135.355 | 21,86 | ||||
| 2026-02-17 | 13F | Citadel Advisors Llc | 1.673.546 | 652,60 | 53.319 | 763,89 | ||||
| 2026-02-17 | 13F | Citadel Advisors Llc | Put | 40.800 | -14,82 | 1.300 | -2,26 | |||
| 2025-10-23 | 13F | Webster Bank, N. A. | 0 | -100,00 | 0 | -100,00 | ||||
| 2026-02-17 | 13F | Citadel Advisors Llc | Call | 22.600 | -73,29 | 720 | -69,34 | |||
| 2026-02-17 | 13F | ISAM Funds (UK) Ltd | 0 | -100,00 | 0 | |||||
| 2026-02-13 | 13F | American Century Companies Inc | 53.718 | 11,66 | 1.711 | 28,16 | ||||
| 2026-01-14 | 13F | MeadowBrook Investment Advisors LLC | 5.730 | 50,79 | 183 | 73,33 | ||||
| 2026-01-27 | 13F | Bayforest Capital Ltd | 1 | 0 | ||||||
| 2026-02-13 | 13F | Marshall Wace, Llp | 9.695 | 309 | ||||||
| 2026-02-11 | 13F | Zions Bancorporation, National Association /ut/ | 38 | 1 | ||||||
| 2026-02-23 | 13F | Virtu Financial LLC | 0 | -100,00 | 0 | |||||
| 2026-02-17 | 13F | XTX Topco Ltd | 0 | -100,00 | 0 | |||||
| 2026-02-11 | 13F | LPL Financial LLC | 102.492 | -1,49 | 3.265 | 13,05 | ||||
| 2026-01-26 | 13F | Merit Financial Group, LLC | 40.177 | 1.280 | ||||||
| 2026-02-10 | 13F | Murphy & Mullick Capital Management Corp | 1.125 | 0,00 | 36 | 12,90 | ||||
| 2026-02-13 | 13F | Citigroup Inc | 165.486 | -51,23 | 5.272 | -44,02 | ||||
| 2026-02-17 | 13F | Praetorian PR LLC | 0 | -100,00 | 0 | |||||
| 2025-10-24 | 13F | Hemington Wealth Management | 170 | 2,41 | 0 | |||||
| 2025-11-05 | 13F | SOUTH STATE Corp | 0 | -100,00 | 0 | -100,00 | ||||
| 2026-04-07 | 13F | Farther Finance Advisors, LLC | 1.110 | -40,48 | 29 | -50,85 | ||||
| 2026-02-17 | 13F | Mubadala Investment Co PJSC | 98.464 | 3.137 | ||||||
| 2025-11-04 | 13F | High Note Wealth, LLC | 0 | -100,00 | 0 | -100,00 | ||||
| 2026-01-23 | 13F | State of Alaska, Department of Revenue | 26.067 | -4,69 | 1 | |||||
| 2026-02-13 | 13F | Smartleaf Asset Management LLC | 980 | 32,43 | 32 | 55,00 | ||||
| 2026-01-08 | 13F | True Wealth Design, LLC | 0 | -100,00 | 0 | |||||
| 2026-04-07 | 13F | Signaturefd, Llc | 2.024 | 61,27 | 54 | 38,46 | ||||
| 2026-02-17 | 13F | Park West Asset Management LLC | 354.425 | -53,64 | 11.292 | -46,80 | ||||
| 2026-02-17 | 13F | Russell Investments Group, Ltd. | 266.003 | 17,73 | 8.475 | 35,11 | ||||
| 2026-02-10 | 13F | New Mexico Educational Retirement Board | 34.200 | 0,00 | 1 | |||||
| 2026-02-11 | 13F | Deutsche Bank Ag\ | 788.205 | 7,90 | 25.112 | 23,84 | ||||
| 2026-02-17 | 13F | ExodusPoint Capital Management, LP | 0 | -100,00 | 0 | -100,00 | ||||
| 2026-02-17 | 13F | Advisory Services Network, LLC | 0 | -100,00 | 0 | |||||
| 2026-01-29 | 13F | Comerica Bank | 92.594 | -84,27 | 2.950 | -81,94 | ||||
| 2026-02-10 | 13F | Goldman Sachs Group Inc | 912.842 | 21,87 | 29.083 | 39,88 | ||||
| 2026-02-11 | 13F | Hughes Financial Services, LLC | 67 | 52,27 | 2 | 100,00 | ||||
| 2026-02-11 | 13F | Rise Advisors, LLC | 0 | -100,00 | 0 | |||||
| 2026-02-13 | 13F | Parkside Financial Bank & Trust | 8.718 | 9,11 | 278 | 25,34 | ||||
| 2026-02-17 | 13F | Magnetar Financial LLC | 0 | -100,00 | 0 | |||||
| 2025-11-04 | 13F | Peak Retirement Planning, Inc. | 0 | -100,00 | 0 | -100,00 | ||||
| 2026-02-09 | 13F | Hantz Financial Services, Inc. | 3.987 | 181,97 | 0 | |||||
| 2026-02-17 | 13F | Two Sigma Securities, Llc | 24.780 | 789 | ||||||
| 2025-10-22 | 13F | Cerity Partners LLC | 0 | -100,00 | 0 | |||||
| 2026-02-17 | 13F | Bank Of America Corp /de/ | 1.697.249 | -0,48 | 54.074 | 14,22 | ||||
| 2026-02-12 | 13F | Bank Of Montreal /can/ | 14.230 | -18,47 | 453 | -6,40 | ||||
| 2026-02-10 | 13F | Quantbot Technologies LP | 0 | -100,00 | 0 | |||||
| 2026-01-23 | 13F | Avion Wealth | 34 | 0,00 | 0 | |||||
| 2025-11-12 | 13F | 111 Capital | 10.110 | 281 | ||||||
| 2026-04-08 | 13F | DiNuzzo Private Wealth, Inc. | 25 | 0,00 | 1 | |||||
| 2026-02-06 | 13F | IFP Advisors, Inc | 94 | -96,01 | 3 | -96,92 | ||||
| 2026-02-19 | 13F | CI Private Wealth, LLC | 29.896 | -84,05 | 953 | -81,70 | ||||
| 2026-02-02 | 13F | Oppenheimer Asset Management Inc. | 53.191 | -4,04 | 1.695 | 10,14 | ||||
| 2026-02-17 | 13F | Expect Equity LLC | 70.861 | 0,00 | 2.258 | 14,74 | ||||
| 2026-02-13 | 13F | Schroder Investment Management Group | 1.310.062 | 32,56 | 42.132 | 54,80 | ||||
| 2026-02-17 | 13F | Trexquant Investment LP | 15.254 | 31,27 | 486 | 50,62 | ||||
| 2026-02-13 | 13F | Public Employees Retirement Association Of Colorado | 18.215 | 0,00 | 1 | |||||
| 2026-01-30 | 13F | Torren Management, LLC | 129 | 4 | ||||||
| 2026-02-10 | 13F | Bnp Paribas Arbitrage, Sa | 68.058 | 14,87 | 2.168 | 31,87 | ||||
| 2026-02-10 | 13F | Bruce G. Allen Investments, LLC | 29 | 20,83 | 1 | |||||
| 2026-02-13 | 13F | Glen Eagle Advisors, LLC | 32 | 0,00 | 1 | |||||
| 2025-11-14 | 13F | Manchester Capital Management LLC | 0 | -100,00 | 0 | |||||
| 2026-04-06 | 13F | Versant Capital Management, Inc | 147 | 5,00 | 4 | -25,00 | ||||
| 2026-02-17 | 13F | Duquesne Family Office LLC | 1.745.950 | 78,58 | 56 | 103,70 | ||||
| 2026-02-13 | 13F | Martingale Asset Management L P | 18.957 | -66,76 | 604 | -61,91 | ||||
| 2026-02-17 | 13F | Quantinno Capital Management LP | 20.524 | 8,76 | 654 | 24,86 | ||||
| 2025-11-13 | 13F/A | Peak6 Llc | Call | 0 | -100,00 | 0 | -100,00 | |||
| 2026-04-08 | 13F | Wealth Enhancement Advisory Services, Llc | 8.948 | -14,59 | 246 | -28,57 | ||||
| 2026-02-12 | 13F | Dimensional Fund Advisors Lp | 3.840.648 | 1,17 | 122.367 | 16,12 | ||||
| 2026-02-03 | 13F | Bokf, Na | 0 | -100,00 | 0 | |||||
| 2026-02-05 | 13F | Pinnacle Associates Ltd | 21.996 | 0,25 | 701 | 14,94 | ||||
| 2026-02-10 | 13F | Envestnet Asset Management Inc | 162.462 | -10,28 | 5.176 | 2,98 | ||||
| 2026-02-17 | 13F | Two Sigma Investments, Lp | 273.901 | -75,74 | 8.726 | -72,16 | ||||
| 2026-02-17 | 13F | Mirabella Financial Services Llp | 10.152 | -22,83 | 323 | -11,51 | ||||
| 2026-02-02 | 13F | Danske Bank A/s | 700 | -97,86 | 22 | -97,58 | ||||
| 2026-02-17 | 13F | Alliancebernstein L.p. | 1.350.178 | 3,96 | 43.017 | 19,32 |