Grundlæggende statistik
| Institutionelle ejere | 275 total, 275 long only, 0 short only, 0 long/short - change of 0,73% MRQ |
| Gennemsnitlig porteføljeallokering | 0.9919 % - change of -1,57% MRQ |
| Institutionelle aktier (lange) | 86.379.251 (ex 13D/G) - change of 2,36MM shares 2,80% MRQ |
| Institutionel værdi (lang) | $ 4.846.997 USD ($1000) |
Institutionelt ejerskab og aktionærer
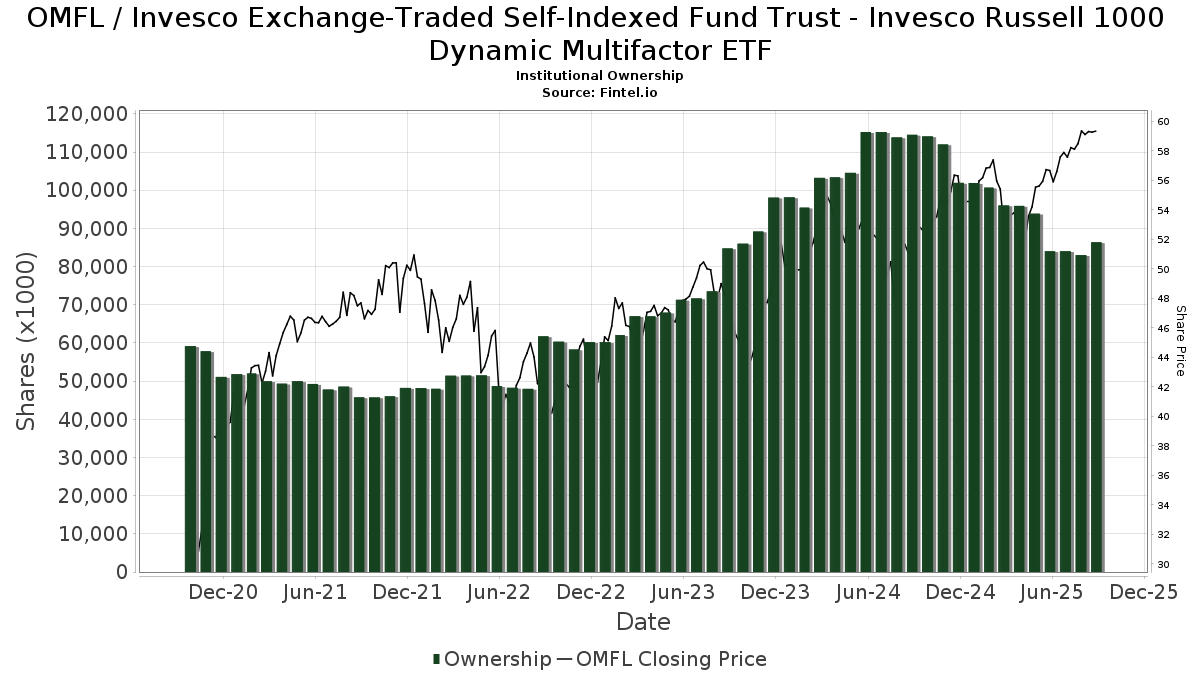
Invesco Exchange-Traded Self-Indexed Fund Trust - Invesco Russell 1000 Dynamic Multifactor ETF (US:OMFL) har 275 institutionelle ejere og aktionærer, der har indsendt 13D/G- eller 13F-formularer til Securities Exchange Commission (SEC). Disse institutioner har i alt 86,379,251 aktier. Største aktionærer omfatter Invesco Ltd., Balentine LLC, Arizona PSPRS Trust, Morgan Stanley, AIM GROWTH SERIES (INVESCO GROWTH SERIES) - Invesco Oppenheimer Portfolio Series: Active Allocation Fund Class R5, AIM INVESTMENT FUNDS (INVESCO INVESTMENT FUNDS) - Invesco Oppenheimer Global Allocation Fund Class R, AIM GROWTH SERIES (INVESCO GROWTH SERIES) - Invesco Oppenheimer Portfolio Series: Moderate Investor Fund Class C, LPL Financial LLC, Bank of New York Mellon Corp, and AADAX - INVESCO Growth Allocation Fund Class A .
Invesco Exchange-Traded Self-Indexed Fund Trust - Invesco Russell 1000 Dynamic Multifactor ETF (BATS:OMFL) institutionel ejerskabsstruktur viser aktuelle positioner i virksomheden efter institutioner og fonde, samt seneste ændringer i positionsstørrelse. Større aktionærer kan omfatte individuelle investorer, investeringsforeninger, hedgefonde eller institutioner. Skema 13D angiver, at investoren besidder (eller besidder) mere end 5 % af virksomheden og har til hensigt (eller har til hensigt at) aktivt at forfølge en ændring i forretningsstrategi. Skema 13G indikerer en passiv investering på over 5%.
The share price as of September 16, 2025 is 59,87 / share. Previously, on September 17, 2024, the share price was 52,18 / share. This represents an increase of 14,73% over that period.
Fondens stemningsscore
Fund Sentiment Score (fka Ownership Accumulation Score) finder de aktier, der bliver mest købt af fonde. Det er resultatet af en sofistikeret, multi-faktor kvantitativ model, der identificerer virksomheder med de højeste niveauer af institutionel akkumulering. Scoringsmodellen bruger en kombination af den samlede stigning i oplyste ejere, ændringerne i porteføljeallokeringer i disse ejere og andre målinger. Tallet går fra 0 til 100, hvor højere tal indikerer et højere niveau af akkumulering for sine jævnaldrende, og 50 er gennemsnittet.
Opdateringsfrekvens: Dagligt
Se Ownership Explorer, som giver en liste over højest rangerende virksomheder.
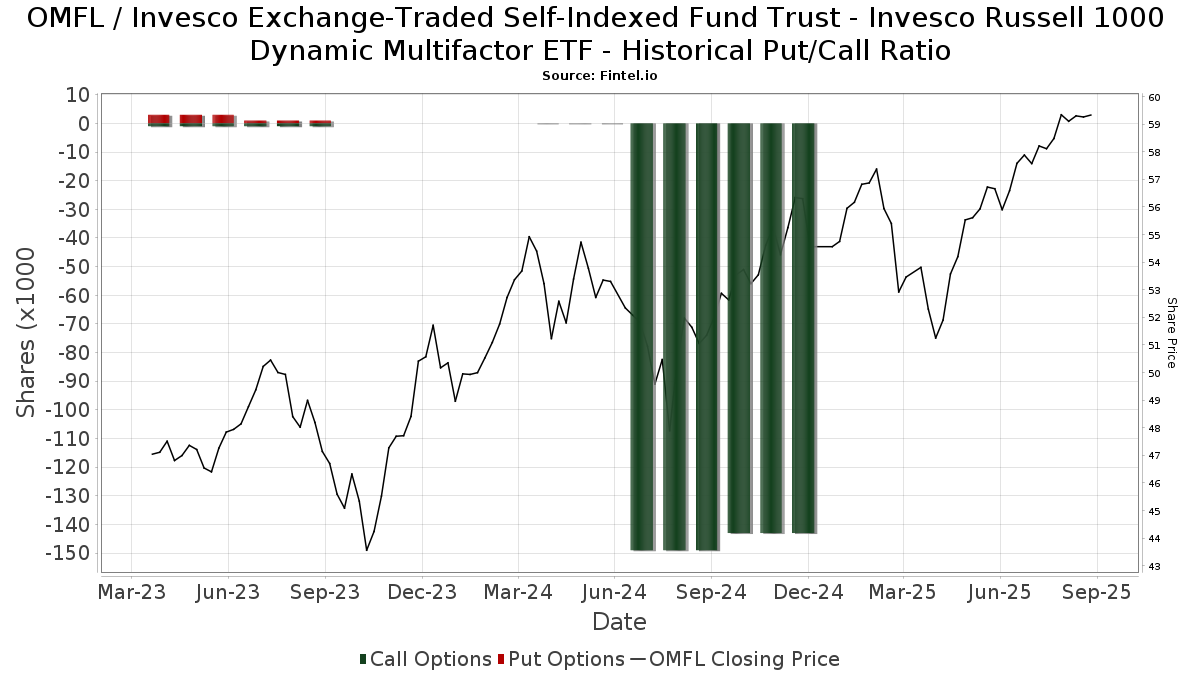
Institutionel Put/Call-forhold
Ud over at indberette standardaktie- og gældsudstedelser skal institutter med mere end 100 mill. aktiver under forvaltning også oplyse deres put- og call-optionsbeholdninger. Da salgsoptioner generelt indikerer negativ stemning, og købsoptioner indikerer positiv stemning, kan vi få en fornemmelse af den overordnede institutionelle stemning ved at plotte forholdet mellem put og kald. Diagrammet til højre viser det historiske put/call-forhold for dette instrument.
Brug af Put/Call Ratio som en indikator for investorernes stemning overvinder en af de vigtigste mangler ved at bruge totalt institutionelt ejerskab, som er, at en betydelig mængde af aktiver under forvaltning investeres passivt for at spore indekser. Passivt forvaltede fonde køber typisk ikke optioner, så indikatoren for put/call-forholdet følger mere nøje følelsen af aktivt forvaltede fonde.
13D/G-arkivering
Vi præsenterer 13D/G ansøgninger separat fra 13F ansøgninger på grund af den forskellige behandling af SEC. 13D/G-ansøgninger kan indgives af grupper af investorer (med én ledende), hvorimod 13F-ansøgninger ikke kan. Dette resulterer i situationer, hvor en investor kan indsende en 13D/G, der rapporterer én værdi for de samlede aktier (der repræsenterer alle de aktier, der ejes af investorgruppen), men derefter indsender en 13F, der rapporterer en anden værdi for de samlede aktier (der udelukkende repræsenterer deres egne) ejendomsret). Det betyder, at aktieejerskab af 13D/G-arkiver og 13F-arkiveringer ofte ikke er direkte sammenlignelige, så vi præsenterer dem separat.
Bemærk: Fra den 16. maj 2021 viser vi ikke længere ejere, der ikke har indsendt en 13D/G inden for det seneste år. Tidligere viste vi den fulde historie af 13D/G-arkiver. Generelt skal enheder, der er forpligtet til at indgive 13D/G-ansøgninger, indgive mindst årligt, før de indsender en afsluttende ansøgning. Dog forlader fonde nogle gange positioner uden at indsende en afsluttende ansøgning (dvs. de afvikler), så visning af den fulde historie resulterede nogle gange i forvirring om det nuværende ejerskab. For at undgå forvirring viser vi nu kun 'aktuelle' ejere - det vil sige - ejere, der har anmeldt inden for det seneste år.
Upgrade to unlock premium data.
| Fil dato | Form | Investor | Forrige Aktier |
Seneste Aktier |
Δ Aktier (Procent) |
Ejendomsret (Procent) |
Δ Ejerskab (Procent) |
|
|---|---|---|---|---|---|---|---|---|
| 2025-08-07 | Invesco Ltd. | 18,974,344 | 20,645,448 | 8.81 | 24.10 | 9.55 |
13F og NPORT arkivering
Detaljer om 13F-arkivering er gratis. Detaljer om NP-ansøgninger kræver et premium-medlemskab. Grønne rækker angiver nye positioner. Røde rækker angiver lukkede positioner. Klik på linket ikon for at se den fulde transaktionshistorik.
Opgrader
for at låse premium-data op og eksportere til Excel ![]() .
.
| Fil dato | Kilde | Investor | Type | Gennemsnitlig pris (Øst) |
Aktier | Δ Aktier (%) |
Rapporteret Værdi ($1000) |
Δ Værdi (%) |
Port Alloc (%) |
|
|---|---|---|---|---|---|---|---|---|---|---|
| 2025-08-08 | 13F | Gts Securities Llc | 0 | -100,00 | 0 | |||||
| 2025-07-16 | 13F | Moisand Fitzgerald Tamayo, LLC | 0 | -100,00 | 0 | |||||
| 2025-07-10 | 13F | Stewardship Advisors, LLC | 12.990 | -22,66 | 751 | -16,20 | ||||
| 2025-08-08 | 13F | Fortis Group Advisors, LLC | 0 | -100,00 | 0 | |||||
| 2025-08-12 | 13F | Solano Wealth Investment Advisors LLC | 155.576 | -2,30 | 8.989 | 5,90 | ||||
| 2025-08-06 | 13F | AE Wealth Management LLC | 2.459 | -15,21 | 142 | -7,79 | ||||
| 2025-08-04 | 13F | Creative Financial Designs Inc /adv | 78 | 0,00 | 5 | 0,00 | ||||
| 2025-08-12 | 13F | Proequities, Inc. | 0 | 0 | ||||||
| 2025-08-14 | 13F | Federation des caisses Desjardins du Quebec | 1.895 | 0,00 | 109 | 9,00 | ||||
| 2025-08-04 | 13F | Spinnaker Trust | 4.631 | 0,00 | 268 | 8,54 | ||||
| 2025-08-14 | 13F | Herold Advisors, Inc. | 10.990 | -8,34 | 635 | -0,63 | ||||
| 2025-07-28 | 13F | Harbour Investments, Inc. | 792 | 58,08 | 46 | 73,08 | ||||
| 2025-08-12 | 13F | Change Path, LLC | 18.003 | 2,09 | 1.040 | 10,64 | ||||
| 2025-08-14 | 13F | Ausdal Financial Partners, Inc. | 10.755 | 84,16 | 621 | 99,68 | ||||
| 2025-08-15 | 13F | Kestra Advisory Services, LLC | 255.347 | 66,23 | 14.754 | 80,16 | ||||
| 2025-08-07 | 13F | Kestra Private Wealth Services, Llc | 8.052 | 0,01 | 465 | 8,39 | ||||
| 2025-07-22 | 13F | Wealthcare Advisory Partners LLC | 42.823 | -1,59 | 2.474 | 6,68 | ||||
| 2025-08-01 | 13F | First National Trust Co | 26.382 | -0,13 | 1.524 | 8,24 | ||||
| 2025-08-14 | 13F | Wiley Bros.-aintree Capital, Llc | 63.781 | -2,60 | 3.672 | 7,06 | ||||
| 2025-08-04 | 13F | HBK Sorce Advisory LLC | 873.283 | -6,12 | 50.458 | 1,75 | ||||
| 2025-08-13 | 13F | MONECO Advisors, LLC | 17.048 | 0,02 | 985 | 8,48 | ||||
| 2025-08-06 | 13F | Able Wealth Management LLC | 0 | -100,00 | 0 | |||||
| 2025-07-25 | 13F | Muirfield Wealth Advisors Llc | 25.756 | 20,12 | 1.488 | 30,18 | ||||
| 2025-08-06 | 13F | Centerpoint Advisory Group | 74.506 | -0,97 | 4.305 | 7,33 | ||||
| 2025-08-11 | 13F | Aptus Capital Advisors, LLC | 1.764 | -4,60 | 102 | 3,06 | ||||
| 2025-08-13 | 13F | VestGen Advisors, LLC | 88.497 | -4,75 | 5.113 | 3,25 | ||||
| 2025-05-15 | 13F | Cambria Investment Management, L.P. | 0 | -100,00 | 0 | |||||
| 2025-07-30 | 13F | Paul Damon & Associates, Inc. | 4.423 | 0,00 | 256 | 8,51 | ||||
| 2025-08-15 | 13F | CI Private Wealth, LLC | 366.161 | 21.157 | ||||||
| 2025-08-04 | 13F | Cottage Street Advisors LLC | 4.001 | -4,74 | 231 | 3,59 | ||||
| 2025-08-15 | 13F | WFA of San Diego, LLC | 68 | 0,00 | 4 | 0,00 | ||||
| 2025-07-09 | 13F | Burt Wealth Advisors | 360.719 | 3,03 | 20.842 | 11,67 | ||||
| 2025-08-08 | 13F | Cetera Investment Advisers | 100.781 | 4,28 | 5.823 | 13,05 | ||||
| 2025-07-22 | 13F | Merit Financial Group, LLC | 55.496 | -12,15 | 3.207 | -4,78 | ||||
| 2025-07-17 | 13F | Financial Designs Corp | 219.670 | -6,87 | 12.693 | 0,94 | ||||
| 2025-08-14 | 13F | Integrated Wealth Concepts LLC | 216.793 | 2,71 | 12.526 | 11,32 | ||||
| 2025-07-30 | 13F | Cullen/frost Bankers, Inc. | 24.263 | 0,83 | 1.402 | 9,28 | ||||
| 2025-08-13 | 13F | Valued Retirements, Inc. | 35.678 | 0,00 | 2.061 | 8,42 | ||||
| 2025-08-11 | 13F | HighTower Advisors, LLC | 40.360 | -0,14 | 2.332 | 8,22 | ||||
| 2025-08-12 | 13F | Archer Investment Corp | 559 | 0,18 | 32 | 10,34 | ||||
| 2025-07-25 | 13F | Concord Asset Management, LLC/VA | 3.915 | 226 | ||||||
| 2025-08-08 | 13F | MTM Investment Management, LLC | 114 | 7 | ||||||
| 2025-08-12 | 13F | SRS Capital Advisors, Inc. | 2.493 | -0,99 | 144 | 7,46 | ||||
| 2025-07-17 | 13F | Janney Montgomery Scott LLC | 146.299 | -51,79 | 8 | -50,00 | ||||
| 2025-07-29 | 13F | Elevation Capital Advisory, LLC | 26.584 | 4,07 | 1.536 | 12,86 | ||||
| 2025-07-31 | 13F | Glass Jacobson Investment Advisors llc | 7.359 | -25,07 | 425 | -20,11 | ||||
| 2025-05-08 | 13F | Bank of Jackson Hole Trust | 0 | -100,00 | 0 | |||||
| 2025-07-18 | 13F | Consolidated Planning Corp | 69.016 | 3.988 | ||||||
| 2025-07-21 | 13F | Ameritas Advisory Services, LLC | 183 | 11 | ||||||
| 2025-04-25 | 13F | Smith, Salley & Associates | 0 | -100,00 | 0 | |||||
| 2025-05-14 | 13F | Eqis Capital Management, Inc. | 0 | -100,00 | 0 | -100,00 | ||||
| 2025-08-08 | 13F | Good Life Advisors, LLC | 5.111 | -33,19 | 295 | -27,52 | ||||
| 2025-08-12 | 13F | O'shaughnessy Asset Management, Llc | 350 | 20 | ||||||
| 2025-05-12 | 13F | Independent Advisor Alliance | 0 | -100,00 | 0 | |||||
| 2025-07-25 | 13F | Apollon Wealth Management, LLC | 22.655 | -17,56 | 1.309 | -10,59 | ||||
| 2025-08-11 | 13F | Perennial Investment Advisors, LLC | 94.850 | -26,81 | 5.480 | -20,67 | ||||
| 2025-08-13 | 13F | Northwestern Mutual Wealth Management Co | 136.883 | -36,02 | 7.909 | -30,65 | ||||
| 2025-07-14 | 13F | Abound Wealth Management | 317 | 0,00 | 18 | 12,50 | ||||
| 2025-07-31 | 13F | CAP Partners, LLC | 11.797 | -0,14 | 682 | 8,27 | ||||
| 2025-07-17 | 13F | HB Wealth Management, LLC | 3.631 | -51,05 | 210 | -47,09 | ||||
| 2025-08-28 | NP | AIM GROWTH SERIES (INVESCO GROWTH SERIES) - Invesco Oppenheimer Portfolio Series: Active Allocation Fund Class R5 | 4.646.943 | 15,97 | 268.500 | 25,69 | ||||
| 2025-05-29 | 13F/A | Modern Wealth Management, LLC | 5.532 | 0,00 | 290 | -2,68 | ||||
| 2025-07-23 | 13F | Kingswood Wealth Advisors, Llc | 5.070 | -6,90 | 293 | 0,69 | ||||
| 2025-08-11 | 13F | PAX Financial Group, LLC | 122.806 | 0,02 | 7.096 | 8,40 | ||||
| 2025-08-12 | 13F/A | Cozad Asset Management Inc | 51.914 | -7,58 | 3.000 | 0,17 | ||||
| 2025-05-09 | 13F | North Ridge Wealth Advisors, Inc. | 0 | -100,00 | 0 | |||||
| 2025-08-14 | 13F | Ameriprise Financial Inc | 154.289 | -13,18 | 8.950 | -5,53 | ||||
| 2025-08-14 | 13F | Hamilton Capital, LLC | 0 | -100,00 | 0 | |||||
| 2025-08-14 | 13F | Quantinno Capital Management LP | 85.753 | -12,25 | 4.955 | -4,90 | ||||
| 2025-08-14 | 13F | Money Concepts Capital Corp | 3.633 | -97,72 | 210 | -97,53 | ||||
| 2025-07-08 | 13F | Beacon Wealthcare LLC | 4.210 | 0,00 | 243 | 8,48 | ||||
| 2025-08-12 | 13F | Jpmorgan Chase & Co | 177.616 | -10,63 | 10.263 | -3,14 | ||||
| 2025-07-09 | 13F | Dynamic Advisor Solutions LLC | 261.811 | 1,28 | 15.127 | 9,78 | ||||
| 2025-07-31 | 13F | Waldron Private Wealth LLC | 11.526 | -98,82 | 666 | -98,73 | ||||
| 2025-08-04 | 13F | Elite Life Management LLC | 5.267 | -35,27 | 304 | -29,79 | ||||
| 2025-08-12 | 13F | J.w. Cole Advisors, Inc. | 7.683 | -14,50 | 444 | -7,52 | ||||
| 2025-07-11 | 13F | SILVER OAK SECURITIES, Inc | 139.399 | 0,57 | 8.054 | 10,10 | ||||
| 2025-07-30 | 13F | WESPAC Advisors SoCal, LLC | 5.945 | 0,00 | 344 | 8,54 | ||||
| 2025-08-14 | 13F | Susquehanna International Group, Llp | 38.988 | 63,77 | 2.253 | 77,46 | ||||
| 2025-04-23 | 13F | Embree Financial Group | 0 | -100,00 | 0 | |||||
| 2025-08-13 | 13F | Cerity Partners LLC | 27.618 | -39,15 | 1.596 | -34,06 | ||||
| 2025-07-21 | 13F | Ameriflex Group, Inc. | 882 | 0,00 | 50 | 6,38 | ||||
| 2025-07-29 | 13F | Empirical Asset Management, LLC | 7.345 | 15,45 | 424 | 25,07 | ||||
| 2025-08-01 | 13F | Gwn Securities Inc. | 0 | -100,00 | 0 | |||||
| 2025-08-12 | 13F | PSI Advisors, LLC | 0 | -100,00 | 0 | |||||
| 2025-07-25 | 13F | Retirement Planning Group, Llc / Ny | 22.542 | -7,36 | 1.302 | 0,39 | ||||
| 2025-04-28 | 13F | Oregon Pacific Wealth Management, LLC | 0 | -100,00 | 0 | |||||
| 2025-07-22 | 13F | Mascoma Wealth Management LLC | 0 | -100,00 | 0 | |||||
| 2025-08-01 | 13F | Envestnet Asset Management Inc | 481.456 | -7,79 | 27.817 | -0,07 | ||||
| 2025-08-05 | 13F | Landmark Wealth Management, Inc. | 12.596 | -59,52 | 728 | -56,15 | ||||
| 2025-07-11 | 13F | Farther Finance Advisors, LLC | 6.646 | 124,60 | 384 | 143,04 | ||||
| 2025-08-14 | 13F | Comerica Bank | 6.329 | -65,52 | 366 | -62,68 | ||||
| 2025-07-10 | 13F | Sovran Advisors, LLC | 4.493 | 259 | ||||||
| 2025-08-13 | 13F | Capital Analysts, Inc. | 1.067 | 68,83 | 0 | |||||
| 2025-08-14 | 13F | EP Wealth Advisors, Inc. | 10.328 | -23,37 | 597 | -16,99 | ||||
| 2025-07-25 | 13F | Atria Wealth Solutions, Inc. | 8.264 | -5,95 | 477 | 1,92 | ||||
| 2025-07-15 | 13F | ACT Advisors, LLC. | 8.603 | -46,41 | 497 | -41,87 | ||||
| 2025-07-10 | 13F | Signal Advisors Wealth, LLC | 53.284 | 87,07 | 3.079 | 102,77 | ||||
| 2025-05-14 | 13F | Flow Traders U.s. Llc | 0 | -100,00 | 0 | |||||
| 2025-07-16 | 13F | Perigon Wealth Management, LLC | 7.969 | 0,04 | 460 | 8,49 | ||||
| 2025-07-25 | 13F | Concurrent Investment Advisors, LLC | 71.733 | 154,46 | 4.145 | 175,90 | ||||
| 2025-08-14 | 13F | UBS Group AG | 1.232.585 | 2,16 | 71.219 | 10,73 | ||||
| 2025-08-04 | 13F | Arkadios Wealth Advisors | 671.995 | 0,86 | 38.828 | 9,32 | ||||
| 2025-08-14 | 13F | Arizona PSPRS Trust | 5.402.688 | 0,19 | 312.167 | 8,59 | ||||
| 2025-08-13 | 13F | WCG Wealth Advisors LLC | 35.044 | -11,08 | 2.025 | -3,62 | ||||
| 2025-08-11 | 13F | SFI Advisors, LLC | 5.494 | 317 | ||||||
| 2025-08-08 | 13F | Pnc Financial Services Group, Inc. | 300 | 17 | ||||||
| 2025-08-11 | 13F | Principal Securities, Inc. | 28.571 | 11,25 | 1.651 | 18,53 | ||||
| 2025-07-17 | 13F | White Pine Investment CO | 109.709 | -4,44 | 6 | 0,00 | ||||
| 2025-08-14 | 13F | Coppell Advisory Solutions LLC | 0 | -100,00 | 0 | |||||
| 2025-07-16 | 13F | ORG Partners LLC | 27.933 | -29,81 | 1.610 | -27,84 | ||||
| 2025-07-09 | 13F | Channel Wealth Llc | 11.883 | -11,34 | 687 | -3,92 | ||||
| 2025-07-24 | 13F | IFP Advisors, Inc | 40.117 | -27,79 | 2.318 | -21,75 | ||||
| 2025-07-23 | 13F | Richardson Capital Management LLC | 0 | -100,00 | 0 | |||||
| 2025-05-14 | 13F | Level Four Advisory Services, Llc | 0 | -100,00 | 0 | |||||
| 2025-08-13 | 13F | Colonial Trust Advisors | 0 | -100,00 | 0 | |||||
| 2025-07-11 | 13F | Orrstown Financial Services Inc | 999.063 | 1,23 | 57.726 | 9,72 | ||||
| 2025-08-05 | 13F | Tsfg, Llc | 28 | 0,00 | 0 | |||||
| 2025-07-07 | 13F | Thurston, Springer, Miller, Herd & Titak, Inc. | 125 | 0,00 | 7 | 16,67 | ||||
| 2025-06-30 | NP | AIM INVESTMENT FUNDS (INVESCO INVESTMENT FUNDS) - Invesco Oppenheimer Global Allocation Fund Class R | 4.151.760 | 0,00 | 222.410 | -4,82 | ||||
| 2025-07-14 | 13F | Rooted Wealth Advisors, Inc. | 89.724 | 8,11 | 5.158 | 26,61 | ||||
| 2025-07-28 | 13F | BRYN MAWR TRUST Co | 41.149 | 0,00 | 2.378 | 8,39 | ||||
| 2025-08-13 | 13F | Milestone Investment Advisors LLC | 30.330 | -26,08 | 1.752 | -19,89 | ||||
| 2025-08-28 | NP | AIM GROWTH SERIES (INVESCO GROWTH SERIES) - Invesco Oppenheimer Portfolio Series: Moderate Investor Fund Class C | 3.479.632 | 16,42 | 201.053 | 26,18 | ||||
| 2025-07-15 | 13F | Axis Wealth Partners, LLC | 9.338 | 0,59 | 540 | 9,11 | ||||
| 2025-08-12 | 13F | Running Point Capital Advisors, LLC | 59.540 | 4,62 | 3.440 | 13,42 | ||||
| 2025-08-14 | 13F | LWM Advisory Services, LLC | 4.305 | -7,72 | 249 | 0,00 | ||||
| 2025-08-18 | 13F | Arq Wealth Advisors, Llc | 5.545 | 0,00 | 296 | 0,00 | ||||
| 2025-04-22 | 13F | Denver Wealth Management, Inc. | 0 | -100,00 | 0 | |||||
| 2025-07-14 | 13F | Golden State Equity Partners | 7.160 | 0,00 | 414 | 8,40 | ||||
| 2025-07-08 | 13F | Nbc Securities, Inc. | 68 | 0,00 | 0 | |||||
| 2025-08-13 | 13F | Jones Financial Companies Lllp | 289.214 | 5,25 | 16.604 | 14,48 | ||||
| 2025-07-28 | 13F | Copia Wealth Management | 130 | 0,00 | 8 | 16,67 | ||||
| 2025-08-07 | 13F | PFG Advisors | 55.075 | 7,10 | 3.182 | 16,09 | ||||
| 2025-08-28 | NP | CMAIX - Invesco Conservative Allocation Fund CLASS R5 | 318.428 | 10,83 | 18.399 | 20,11 | ||||
| 2025-07-17 | 13F | San Luis Wealth Advisors LLC | 98.351 | 1,01 | 6 | 0,00 | ||||
| 2025-08-11 | 13F | TD Waterhouse Canada Inc. | 36.396 | 42,88 | 2.100 | 55,02 | ||||
| 2025-08-13 | 13F | Advocacy Wealth Management Services, LLC | 46.803 | 0,00 | 2.704 | 8,38 | ||||
| 2025-08-14 | 13F | Old Mission Capital Llc | 4.221 | 244 | ||||||
| 2025-07-17 | 13F | Wolff Wiese Magana Llc | 71 | 0,00 | 4 | 33,33 | ||||
| 2025-07-14 | 13F | Signature Securities Group Corporation | 14.512 | 0,84 | 838 | 9,26 | ||||
| 2025-08-11 | 13F | Private Advisor Group, LLC | 264.593 | -57,42 | 15.288 | -53,85 | ||||
| 2025-08-28 | NP | AIM GROWTH SERIES (INVESCO GROWTH SERIES) - Invesco Oppenheimer Portfolio Series: Growth Investor Fund Class R6 | 2.384.561 | 17,76 | 137.780 | 27,63 | ||||
| 2025-08-14 | 13F | Two Sigma Securities, Llc | 6.027 | 348 | ||||||
| 2025-08-14 | 13F | Hrt Financial Lp | 0 | -100,00 | 0 | |||||
| 2025-08-13 | 13F | Marshall Wace, Llp | 3.775 | 218 | ||||||
| 2025-08-11 | 13F | GW&K Investment Management, LLC | 364 | 0 | ||||||
| 2025-07-31 | 13F | Daido Life Insurance Co | 403.056 | 0,00 | 23 | 9,52 | ||||
| 2025-08-04 | 13F | NBZ Investment Advisors LLC | 63.936 | -31,25 | 3.694 | -25,48 | ||||
| 2025-08-14 | 13F | Catalyst Financial Partners Llc | 13.855 | 801 | ||||||
| 2025-07-15 | 13F | Colonial River Wealth Management, LLC | 26.653 | 27,95 | 1.542 | 38,83 | ||||
| 2025-08-08 | 13F | Petix & Botte Co | 15.190 | -18,68 | 878 | -11,86 | ||||
| 2025-08-27 | 13F/A | Brinker Capital Investments, LLC | 7.196 | -20,71 | 416 | -14,08 | ||||
| 2025-05-15 | 13F | Squarepoint Ops LLC | Call | 0 | -100,00 | 0 | ||||
| 2025-08-13 | 13F | Baird Financial Group, Inc. | 7.736 | 447 | ||||||
| 2025-04-22 | 13F | Synergy Financial Management, LLC | 0 | -100,00 | 0 | |||||
| 2025-07-31 | 13F | Longview Financial Advisors, Inc. | 26.570 | -13,20 | 1.535 | -5,89 | ||||
| 2025-07-16 | 13F | John W. Brooker & Co., CPAs | 5.841 | -90,41 | 338 | -89,62 | ||||
| 2025-08-08 | 13F | Avantax Advisory Services, Inc. | 41.385 | 3,59 | 2.391 | 12,31 | ||||
| 2025-08-28 | NP | AIM GROWTH SERIES (INVESCO GROWTH SERIES) - Invesco Oppenheimer Portfolio Series: Conservative Investor Fund Class R6 | 195.355 | 18,87 | 11.288 | 28,83 | ||||
| 2025-08-15 | 13F | Equitable Holdings, Inc. | 69.803 | 2,22 | 4.033 | 10,80 | ||||
| 2025-07-25 | 13F | Cwm, Llc | 4.134 | 4,13 | 0 | |||||
| 2025-08-14 | 13F | Paces Ferry Wealth Advisors, Llc | 3.948 | -9,66 | 228 | -1,72 | ||||
| 2025-07-29 | 13F | Private Trust Co Na | 1.824 | -30,57 | 105 | -25,00 | ||||
| 2025-07-08 | 13F | Apella Capital, LLC | 32.548 | -1,87 | 1.884 | 8,59 | ||||
| 2025-07-25 | 13F | Apollon Financial, LLC | 16.247 | -11,45 | 939 | -4,09 | ||||
| 2025-08-26 | 13F/A | Thrivent Financial For Lutherans | 3.999 | -88,73 | 0 | -100,00 | ||||
| 2025-08-14 | 13F | Graney & King, LLC | 8.047 | -1,91 | 465 | 6,18 | ||||
| 2025-07-11 | 13F | Diversified Trust Co | 6.538 | -3,68 | 378 | 4,43 | ||||
| 2025-07-17 | 13F | Beacon Capital Management, LLC | 0 | -100,00 | 0 | |||||
| 2025-08-04 | 13F | Assetmark, Inc | 10.839 | 19,60 | 626 | 29,61 | ||||
| 2025-08-11 | 13F | Advisor Resource Council | 0 | -100,00 | 0 | |||||
| 2025-08-07 | 13F | Fox Financial, Inc | 14.963 | -0,41 | 865 | 8,00 | ||||
| 2025-07-22 | 13F | Clarius Group, LLC | 193.360 | -4,34 | 11.172 | 3,68 | ||||
| 2025-08-01 | 13F | Bessemer Group Inc | 0 | -100,00 | 0 | |||||
| 2025-07-24 | 13F | Baldwin Brothers Inc/ma | 449.830 | 1,33 | 25.991 | 9,83 | ||||
| 2025-08-13 | 13F/A | StoneX Group Inc. | 0 | -100,00 | 0 | -100,00 | ||||
| 2025-08-14 | 13F | Mariner, LLC | 867.759 | -4,69 | 50.139 | 3,31 | ||||
| 2025-08-11 | 13F | Western Wealth Management, LLC | 31.749 | -0,75 | 1.834 | 7,57 | ||||
| 2025-05-15 | 13F/A | Orion Portfolio Solutions, LLC | 9.075 | 484 | ||||||
| 2025-07-10 | 13F | Focus Financial Network, Inc. | 54.856 | 125,49 | 3.170 | 144,52 | ||||
| 2025-05-15 | 13F | Citadel Advisors Llc | Call | 0 | -100,00 | 0 | -100,00 | |||
| 2025-04-23 | 13F | Alpha Financial Advisors, LLC | 0 | -100,00 | 0 | |||||
| 2025-07-21 | 13F | Seros Financial, LLC | 13.173 | 0,00 | 761 | 8,40 | ||||
| 2025-07-25 | 13F | Concord Wealth Partners | 3.915 | 1,08 | 226 | 9,71 | ||||
| 2025-08-14 | 13F | Sunbelt Securities, Inc. | 369 | -20,65 | 20 | -16,67 | ||||
| 2025-07-25 | 13F | We Are One Seven, LLC | 59.585 | -2,55 | 3.443 | 5,62 | ||||
| 2025-08-14 | 13F | Goldman Sachs Group Inc | 231.184 | 43,81 | 13.358 | 55,88 | ||||
| 2025-08-25 | 13F/A | Neuberger Berman Group LLC | 4.436 | 0,00 | 256 | 8,47 | ||||
| 2025-08-12 | 13F | Global Retirement Partners, LLC | 8.941 | 8,86 | 517 | 15,96 | ||||
| 2025-08-14 | 13F | Qube Research & Technologies Ltd | 51.334 | -0,41 | 2.966 | 7,97 | ||||
| 2025-08-12 | 13F | BlackRock, Inc. | 3.326 | 0,00 | 192 | 8,47 | ||||
| 2025-08-13 | 13F | EverSource Wealth Advisors, LLC | 2.596 | -16,69 | 150 | -10,24 | ||||
| 2025-08-18 | 13F | Goodman Advisory Group, LLC | 0 | -100,00 | 0 | |||||
| 2025-07-18 | 13F | Truist Financial Corp | 197.976 | -31,51 | 11.439 | -25,76 | ||||
| 2025-08-13 | 13F | Elios Financial Group Inc. | 46.093 | 15,01 | 2.663 | 24,67 | ||||
| 2025-08-15 | 13F | Morgan Stanley | 4.876.451 | -1,01 | 281.761 | 7,30 | ||||
| 2025-06-30 | NP | Northern Lights Fund Trust - PFG Invesco(R) Thematic ESG Strategy Class R Shares | 219.600 | 1,71 | 11.764 | -3,19 | ||||
| 2025-08-08 | 13F | Capital Investment Advisory Services, LLC | 920 | 0,11 | 53 | 8,16 | ||||
| 2025-04-23 | 13F | GHP Investment Advisors, Inc. | 0 | -100,00 | 0 | |||||
| 2025-08-14 | 13F | Royal Bank Of Canada | 152.384 | -48,52 | 8.806 | -44,20 | ||||
| 2025-05-16 | 13F | Arete Wealth Advisors, LLC | 0 | -100,00 | 0 | |||||
| 2025-08-06 | 13F | ORBA Wealth Advisors, L.L.C. | 23.378 | -50,65 | 1.351 | -46,53 | ||||
| 2025-08-14 | 13F | Aqr Capital Management Llc | 30.105 | -16,87 | 1.739 | -9,90 | ||||
| 2025-08-15 | 13F | Tower Research Capital LLC (TRC) | 4.120 | -90,60 | 238 | -89,81 | ||||
| 2025-07-18 | 13F | Bartlett & Co. Wealth Management Llc | 23 | 0,00 | 1 | 0,00 | ||||
| 2025-07-30 | 13F | Retirement Planning Group | 44.151 | 6,34 | 2.551 | 15,27 | ||||
| 2025-08-14 | 13F | Citadel Advisors Llc | 24.172 | 22,38 | 1.397 | 32,70 | ||||
| 2025-07-29 | NP | MVFG - Monarch Volume Factor Global Unconstrained Index ETF | 66.052 | 3.718 | ||||||
| 2025-08-04 | 13F | Atria Investments Llc | 5.980 | 346 | ||||||
| 2025-08-27 | NP | ALAAX - INVESCO Income Allocation Fund Class A | 154.129 | -4,10 | 8.906 | 3,95 | ||||
| 2025-08-13 | 13F | GeoWealth Management, LLC | 6.779 | -5,31 | 392 | 2,62 | ||||
| 2025-04-23 | 13F | International Assets Investment Management, Llc | 0 | -100,00 | 0 | -100,00 | ||||
| 2025-05-16 | 13F | Empowered Funds, LLC | 0 | -100,00 | 0 | |||||
| 2025-07-10 | 13F | Wealth Enhancement Advisory Services, Llc | 1.049.713 | -2,91 | 61.020 | 5,86 | ||||
| 2025-08-08 | 13F | TD Capital Management LLC | 1.225 | 0,00 | 71 | 7,69 | ||||
| 2025-08-14 | 13F | Jane Street Group, Llc | 16.970 | 232,35 | 981 | 260,29 | ||||
| 2025-08-07 | 13F | 49 Wealth Management, Llc | 6.232 | -20,95 | 360 | -14,29 | ||||
| 2025-07-14 | 13F | Sowell Financial Services LLC | 18.712 | 1,48 | 1.081 | 9,97 | ||||
| 2025-08-12 | 13F | PKS Advisory Services, LLC | 5.503 | -0,31 | 318 | 7,82 | ||||
| 2025-07-31 | 13F | Oppenheimer & Co Inc | 55.791 | -0,63 | 3.224 | 7,72 | ||||
| 2025-07-02 | 13F | Waller Financial Planning Group, Inc | 592.265 | 19,22 | 34.221 | 29,21 | ||||
| 2025-08-14 | 13F | CoreCap Advisors, LLC | 857 | 29,65 | 50 | 40,00 | ||||
| 2025-08-14 | 13F | GWM Advisors LLC | 15.859 | -9,20 | 916 | -1,61 | ||||
| 2025-08-14 | 13F | NCM Capital Management, LLC | 6.250 | -0,79 | 361 | 7,76 | ||||
| 2025-08-14 | 13F | Wells Fargo & Company/mn | 912.056 | -25,10 | 52.699 | -18,82 | ||||
| 2025-08-12 | 13F | Steward Partners Investment Advisory, Llc | 3.444 | 0,67 | 199 | 8,79 | ||||
| 2025-07-22 | 13F | Cedar Mountain Advisors, LLC | 1 | 0,00 | 0 | |||||
| 2025-07-17 | 13F | ERn Financial, LLC | 264.060 | -1,32 | 15.257 | 6,95 | ||||
| 2025-05-15 | 13F | MAI Capital Management | 0 | -100,00 | 0 | |||||
| 2025-07-14 | 13F | Financial Enhancement Group LLC | 334.900 | 1,62 | 19.253 | 13,91 | ||||
| 2025-08-14 | 13F | Sequent Planning LLC | 26.764 | 12,33 | 1.546 | 21,73 | ||||
| 2025-08-04 | 13F | Integrity Alliance, Llc. | 36.165 | 2.090 | ||||||
| 2025-04-02 | 13F/A | Industrial Alliance Investment Management Inc. | 0 | -100,00 | 0 | |||||
| 2025-08-13 | 13F | RPg Family Wealth Advisory, LLC | 64.798 | -2,52 | 3.744 | 5,67 | ||||
| 2025-07-16 | 13F | Signaturefd, Llc | 22 | 0,00 | 1 | 0,00 | ||||
| 2025-07-16 | 13F | EdgeRock Capital LLC | 4.955 | 0,08 | 286 | 8,75 | ||||
| 2025-08-12 | 13F | Journey Strategic Wealth Llc | 279.548 | 1,55 | 16.152 | 10,06 | ||||
| 2025-08-05 | 13F | Bank of New York Mellon Corp | 2.680.538 | 1,82 | 154.882 | 10,36 | ||||
| 2025-07-08 | 13F | Goldstone Financial Group, LLC | 14.823 | 4,08 | 862 | 13,44 | ||||
| 2025-08-11 | 13F | Citigroup Inc | 0 | -100,00 | 0 | |||||
| 2025-05-19 | 13F/A | Jane Street Group, Llc | Call | 0 | -100,00 | 0 | -100,00 | |||
| 2025-08-13 | 13F | Avestar Capital, LLC | 90.401 | 28,57 | 5.223 | 39,35 | ||||
| 2025-08-14 | 13F | Great Valley Advisor Group, Inc. | 71.634 | -7,65 | 4.139 | 0,10 | ||||
| 2025-07-30 | 13F | Brookstone Capital Management | 449.356 | 8,86 | 25.964 | 17,99 | ||||
| 2025-08-06 | 13F | Commonwealth Equity Services, Llc | 145.806 | -15,71 | 8 | -11,11 | ||||
| 2025-08-28 | NP | AADAX - INVESCO Growth Allocation Fund Class A | 2.405.926 | 16,21 | 139.014 | 25,96 | ||||
| 2025-08-13 | 13F | Daner Wealth Management, LLC | 244.574 | -14,77 | 14.491 | -10,63 | ||||
| 2025-08-12 | 13F | Financial Advocates Investment Management | 3.757 | 217 | ||||||
| 2025-08-14 | 13F | Mpwm Advisory Solutions, Llc | 0 | -100,00 | 0 | |||||
| 2025-04-09 | 13F | Roxbury Financial LLC | 0 | -100,00 | 0 | |||||
| 2025-08-06 | 13F | Atlas Legacy Advisors, LLC | 26.391 | 30,00 | 1.525 | 38,55 | ||||
| 2025-08-05 | 13F | Key FInancial Inc | 456 | 0,00 | 26 | 8,33 | ||||
| 2025-08-05 | 13F | GPS Wealth Strategies Group, LLC | 2.100 | -1,36 | 121 | 7,08 | ||||
| 2025-07-31 | 13F | Cambridge Investment Research Advisors, Inc. | 506.359 | 5,08 | 29 | 16,00 | ||||
| 2025-07-16 | 13F | ORG Wealth Partners, LLC | 256 | 0,00 | 15 | 7,69 | ||||
| 2025-08-12 | 13F | Wood Tarver Financial Group, LLC | 13.258 | -7,17 | 1 | -100,00 | ||||
| 2025-08-14 | 13F | Fmr Llc | 9.348 | 21,47 | 540 | 31,71 | ||||
| 2025-05-01 | 13F | Freedom Day Solutions, LLC | 0 | -100,00 | 0 | -100,00 | ||||
| 2025-08-04 | 13F | IFG Advisory, LLC | 381.412 | -13,43 | 22.038 | -6,17 | ||||
| 2025-08-14 | 13F | LM Advisors LLC | 627.898 | -0,73 | 36 | 9,09 | ||||
| 2025-08-18 | 13F/A | National Bank Of Canada /fi/ | 16.035 | -25,09 | 925 | -18,57 | ||||
| 2025-07-29 | 13F | Stratos Wealth Partners, LTD. | 4.045 | -14,54 | 234 | -7,54 | ||||
| 2025-08-01 | 13F | Ashton Thomas Private Wealth, LLC | 25.393 | 2,64 | 1.467 | 11,31 | ||||
| 2025-07-08 | 13F | Parallel Advisors, LLC | 560 | 0,00 | 32 | 10,34 | ||||
| 2025-07-30 | 13F | Bogart Wealth, LLC | 17 | 0,00 | 1 | |||||
| 2025-07-31 | 13F | Richards, Merrill & Peterson, Inc. | 2.875 | 9,03 | 166 | 18,57 | ||||
| 2025-07-31 | 13F | Moloney Securities Asset Management, LLC | 13.486 | 3,48 | 779 | 12,25 | ||||
| 2025-08-01 | 13F | First Command Advisory Services, Inc. | 4.767 | -23,09 | 275 | -16,67 | ||||
| 2025-08-13 | 13F | Transce3nd, LLC | 234 | 0,00 | 14 | 8,33 | ||||
| 2025-08-14 | 13F | Colony Group, LLC | 3.639 | 210 | ||||||
| 2025-07-15 | 13F | Mather Group, Llc. | 0 | -100,00 | 0 | |||||
| 2025-07-21 | 13F | Triad Wealth Partners, LLC | 31.441 | -19,69 | 1.817 | -12,99 | ||||
| 2025-08-05 | 13F | Bank Of Montreal /can/ | 7.021 | 55,99 | 406 | 69,46 | ||||
| 2025-08-19 | 13F | Advisory Services Network, LLC | 4.095 | -21,88 | 238 | -14,70 | ||||
| 2025-08-07 | 13F | Sierra Ocean, Llc | 4.301 | 0,00 | 249 | 8,30 | ||||
| 2025-08-15 | 13F | Captrust Financial Advisors | 990.079 | -1,62 | 57.207 | 6,63 | ||||
| 2025-08-13 | 13F | Proactive Wealth Strategies LLC | 25.939 | -50,36 | 1 | -50,00 | ||||
| 2025-08-15 | 13F | Asset Allocation Strategies LLC | 153.146 | -42,24 | 8.849 | -37,40 | ||||
| 2025-08-14 | 13F | Bank Of America Corp /de/ | 2.143.686 | 36,51 | 123.862 | 47,96 | ||||
| 2025-08-14 | 13F | Stifel Financial Corp | 98.156 | -18,05 | 5.671 | -11,18 | ||||
| 2025-07-28 | 13F | Kiker Wealth Management, LLC | 0 | -100,00 | 0 | |||||
| 2025-04-15 | 13F | Capital Advisors, Ltd. LLC | 0 | -100,00 | 0 | |||||
| 2025-07-21 | 13F | Ashton Thomas Securities, Llc | 151.936 | -20,11 | 8.779 | -13,41 | ||||
| 2025-07-22 | 13F | Foguth Wealth Management, LLC. | 54.982 | 78,35 | 3.177 | 93,30 | ||||
| 2025-08-07 | 13F | Meeder Advisory Services, Inc. | 0 | -100,00 | 0 | |||||
| 2025-09-04 | 13F/A | Advisor Group Holdings, Inc. | 336.948 | -9,32 | 19.470 | -1,74 | ||||
| 2025-07-29 | 13F | Activest Wealth Management | 0 | 0 | ||||||
| 2025-08-14 | 13F | Cubist Systematic Strategies, LLC | 13.082 | 756 | ||||||
| 2025-08-05 | 13F | Sigma Planning Corp | 10.505 | -2,32 | 607 | 5,76 | ||||
| 2025-04-29 | 13F | Callan Capital, LLC | 58.415 | 0,00 | 3.114 | -1,67 | ||||
| 2025-08-05 | 13F | Huntington National Bank | 15 | 7,69 | ||||||
| 2025-08-14 | 13F | Mml Investors Services, Llc | 81.673 | -2,30 | 5 | 0,00 | ||||
| 2025-08-04 | 13F | Spire Wealth Management | 16.330 | 0,00 | 944 | 8,39 | ||||
| 2025-08-08 | 13F | Thoroughbred Financial Services, Llc | 6.665 | 0,00 | 0 | |||||
| 2025-07-30 | 13F | Lionsbridge Wealth Management LLC | 29.246 | -2,20 | 1.690 | 5,96 | ||||
| 2025-08-04 | 13F | Balentine LLC | 5.619.451 | 0,18 | 324.692 | 8,58 | ||||
| 2025-07-28 | 13F | Frazier Financial Advisors, LLC | 13 | 0,00 | 1 | |||||
| 2025-04-24 | 13F | Transcend Wealth Collective, Llc | 0 | -100,00 | 0 | |||||
| 2025-07-02 | 13F | HBW Advisory Services LLC | 4.287 | 0,19 | 248 | 8,33 | ||||
| 2025-07-17 | 13F | Camelot Portfolios, LLC | 19.705 | -5,03 | 1.139 | 2,89 | ||||
| 2025-08-12 | 13F | Up Strategic Wealth Investment Advisors Llc | 11.488 | -10,05 | 664 | -2,50 | ||||
| 2025-07-09 | 13F | Defined Wealth Management, Llc | 41.995 | 2,21 | 2.426 | 10,78 | ||||
| 2025-08-06 | 13F | Golden State Wealth Management, LLC | 76 | 0,00 | 4 | 0,00 | ||||
| 2025-08-14 | 13F | CIBC World Markets Inc. | 27.128 | -3,57 | 1.567 | 4,54 | ||||
| 2025-07-28 | 13F | Axxcess Wealth Management, Llc | 52.215 | 11,47 | 3.017 | 20,78 | ||||
| 2025-08-11 | 13F | Alteri Wealth LLC | 13.559 | 19,15 | 783 | 29,21 | ||||
| 2025-08-14 | 13F | IHT Wealth Management, LLC | 540.620 | 4,19 | 31.237 | 12,93 | ||||
| 2025-08-18 | 13F | Geneos Wealth Management Inc. | 1.645 | 0,00 | 95 | 9,20 | ||||
| 2025-08-12 | 13F | LPL Financial LLC | 2.741.828 | -2,94 | 158.423 | 5,20 | ||||
| 2025-08-14 | 13F | Two Sigma Investments, Lp | 232.200 | 13.417 | ||||||
| 2025-04-23 | 13F | Mascagni Wealth Management, Inc. | 0 | -100,00 | 0 | -100,00 | ||||
| 2025-08-08 | 13F | Kingsview Wealth Management, LLC | 182.632 | 207,50 | 10.552 | 233,29 | ||||
| 2025-08-13 | 13F | Invesco Ltd. | 20.645.448 | 8,81 | 1.192.894 | 17,93 | ||||
| 2025-08-04 | 13F | Deseret Mutual Benefit Administrators | 792.983 | 0,00 | 45.819 | 8,39 | ||||
| 2025-07-24 | 13F | Us Bancorp \de\ | 5.130 | -14,40 | 296 | -7,21 | ||||
| 2025-07-25 | 13F | Envestnet Portfolio Solutions, Inc. | 6.436 | -32,00 | 372 | -26,39 | ||||
| 2025-08-14 | 13F | Raymond James Financial Inc | 575.217 | 19,01 | 33.236 | 28,99 | ||||
| 2025-08-14 | 13F | Bnp Paribas Arbitrage, Sa | 0 | -100,00 | 0 | |||||
| 2025-07-31 | 13F | Briaud Financial Planning, Inc | 17 | 0 | ||||||
| 2025-08-01 | 13F | Y-Intercept (Hong Kong) Ltd | 5.487 | 317 | ||||||
| 2025-08-12 | 13F | Gladstone Institutional Advisory LLC | 252.580 | 12,45 | 14.594 | 21,88 | ||||
| 2025-07-22 | 13F | Simplicity Wealth,LLC | 7.204 | 61,24 | 416 | 74,79 | ||||
| 2025-08-11 | 13F | Rothschild Investment Llc | 1 | 0,00 | 0 | |||||
| 2025-08-14 | 13F | Ancora Advisors, LLC | 160 | 0,00 | 9 | 12,50 | ||||
| 2025-08-14 | 13F | Beaird Harris Wealth Management, LLC | 2.051 | 0,00 | 119 | 8,26 | ||||
| 2025-08-11 | 13F | United Advisor Group, LLC | 5.344 | 0,00 | 309 | 8,45 | ||||
| 2025-07-17 | 13F | Archford Capital Strategies, LLC | 33.723 | -6,53 | 1.949 | 1,30 |