Grundlæggende statistik
| Institutionelle aktier (lange) | 62.227.939 - 101,19% (ex 13D/G) - change of -15,68MM shares -19,94% MRQ |
| Institutionel værdi (lang) | $ 3.859.241 USD ($1000) |
Institutionelt ejerskab og aktionærer
NorthWestern Energy Group, Inc. (US:NWE) har 411 institutionelle ejere og aktionærer, der har indsendt 13D/G- eller 13F-formularer til Securities Exchange Commission (SEC). Disse institutioner har i alt 62,227,939 aktier. Største aktionærer omfatter BlackRock, Inc., Vanguard Group Inc, State Street Corp, American Century Companies Inc, Geode Capital Management, Llc, Franklin Resources Inc, River Road Asset Management, LLC, Neuberger Berman Group LLC, Systematic Financial Management Lp, and Fmr Llc .
NorthWestern Energy Group, Inc. (NasdaqGS:NWE) institutionel ejerskabsstruktur viser aktuelle positioner i virksomheden efter institutioner og fonde, samt seneste ændringer i positionsstørrelse. Større aktionærer kan omfatte individuelle investorer, investeringsforeninger, hedgefonde eller institutioner. Skema 13D angiver, at investoren besidder (eller besidder) mere end 5 % af virksomheden og har til hensigt (eller har til hensigt at) aktivt at forfølge en ændring i forretningsstrategi. Skema 13G indikerer en passiv investering på over 5%.
The share price as of March 25, 2026 is 65,36 / share. Previously, on March 27, 2025, the share price was 55,67 / share. This represents an increase of 17,41% over that period.

Fondens stemningsscore
Fund Sentiment Score (fka Ownership Accumulation Score) finder de aktier, der bliver mest købt af fonde. Det er resultatet af en sofistikeret, multi-faktor kvantitativ model, der identificerer virksomheder med de højeste niveauer af institutionel akkumulering. Scoringsmodellen bruger en kombination af den samlede stigning i oplyste ejere, ændringerne i porteføljeallokeringer i disse ejere og andre målinger. Tallet går fra 0 til 100, hvor højere tal indikerer et højere niveau af akkumulering for sine jævnaldrende, og 50 er gennemsnittet.
Opdateringsfrekvens: Dagligt
Se Ownership Explorer, som giver en liste over højest rangerende virksomheder.
AI+ Ask Fintel’s AI assistant about NorthWestern Energy Group, Inc..
Select a question to share a public post with an AI-crafted answer.
Thinking of good questions…
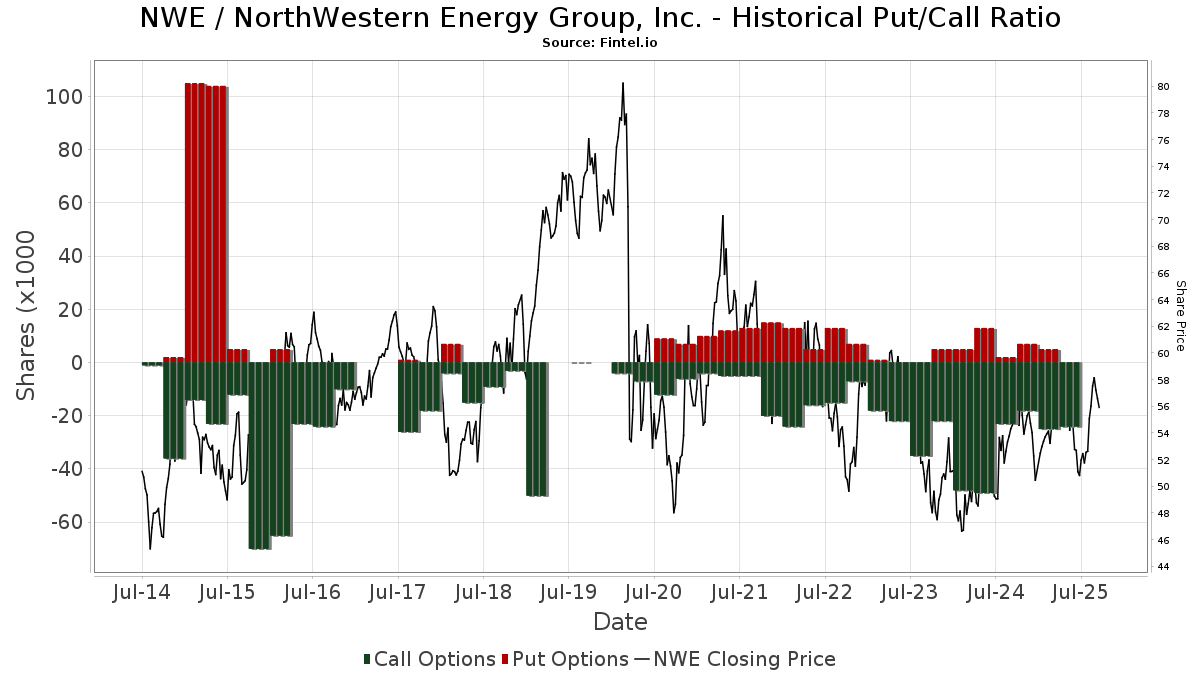
Institutionel Put/Call-forhold
Ud over at indberette standardaktie- og gældsudstedelser skal institutter med mere end 100 mill. aktiver under forvaltning også oplyse deres put- og call-optionsbeholdninger. Da salgsoptioner generelt indikerer negativ stemning, og købsoptioner indikerer positiv stemning, kan vi få en fornemmelse af den overordnede institutionelle stemning ved at plotte forholdet mellem put og kald. Diagrammet til højre viser det historiske put/call-forhold for dette instrument.
Brug af Put/Call Ratio som en indikator for investorernes stemning overvinder en af de vigtigste mangler ved at bruge totalt institutionelt ejerskab, som er, at en betydelig mængde af aktiver under forvaltning investeres passivt for at spore indekser. Passivt forvaltede fonde køber typisk ikke optioner, så indikatoren for put/call-forholdet følger mere nøje følelsen af aktivt forvaltede fonde.
13D/G-arkivering
Vi præsenterer 13D/G ansøgninger separat fra 13F ansøgninger på grund af den forskellige behandling af SEC. 13D/G-ansøgninger kan indgives af grupper af investorer (med én ledende), hvorimod 13F-ansøgninger ikke kan. Dette resulterer i situationer, hvor en investor kan indsende en 13D/G, der rapporterer én værdi for de samlede aktier (der repræsenterer alle de aktier, der ejes af investorgruppen), men derefter indsender en 13F, der rapporterer en anden værdi for de samlede aktier (der udelukkende repræsenterer deres egne) ejendomsret). Det betyder, at aktieejerskab af 13D/G-arkiver og 13F-arkiveringer ofte ikke er direkte sammenlignelige, så vi præsenterer dem separat.
Bemærk: Fra den 16. maj 2021 viser vi ikke længere ejere, der ikke har indsendt en 13D/G inden for det seneste år. Tidligere viste vi den fulde historie af 13D/G-arkiver. Generelt skal enheder, der er forpligtet til at indgive 13D/G-ansøgninger, indgive mindst årligt, før de indsender en afsluttende ansøgning. Dog forlader fonde nogle gange positioner uden at indsende en afsluttende ansøgning (dvs. de afvikler), så visning af den fulde historie resulterede nogle gange i forvirring om det nuværende ejerskab. For at undgå forvirring viser vi nu kun 'aktuelle' ejere - det vil sige - ejere, der har anmeldt inden for det seneste år.
Upgrade to unlock premium data.
| Fil dato | Form | Investor | Forrige Aktier |
Seneste Aktier |
Δ Aktier (Procent) |
Ejendomsret (Procent) |
Δ Ejerskab (Procent) |
|
|---|---|---|---|---|---|---|---|---|
| 2025-08-14 | AMERICAN CENTURY INVESTMENT MANAGEMENT INC | 3,610,095 | 2,952,214 | -18.22 | 4.80 | -18.64 | ||
| 2025-04-03 | BlackRock, Inc. | 11,098,837 | 7,977,494 | -28.12 | 13.00 | -28.18 |
13F og NPORT arkivering
Detaljer om 13F-arkivering er gratis. Detaljer om NP-ansøgninger kræver et premium-medlemskab. Grønne rækker angiver nye positioner. Røde rækker angiver lukkede positioner. Klik på linket ikon for at se den fulde transaktionshistorik.
Opgrader
for at låse premium-data op og eksportere til Excel ![]() .
.
| Fil dato | Kilde | Investor | Type | Gennemsnitlig pris (Øst) |
Aktier | Δ Aktier (%) |
Rapporteret Værdi ($1000) |
Δ Værdi (%) |
Port Alloc (%) |
|
|---|---|---|---|---|---|---|---|---|---|---|
| 2026-02-02 | 13F | Fifth Third Bancorp | 578 | 2,66 | 37 | 15,63 | ||||
| 2026-01-13 | 13F | Mather Group, Llc. | 0 | -100,00 | 0 | |||||
| 2026-02-17 | 13F | Price T Rowe Associates Inc /md/ | 58.684 | 2,87 | 4 | 0,00 | ||||
| 2026-02-17 | 13F | Tower Research Capital LLC (TRC) | 5.743 | -5,42 | 371 | 4,23 | ||||
| 2025-09-29 | NP | AFAVX - AMG River Road Focused Absolute Value Fund CLASS I SHARES | 34.539 | 0,00 | 1.855 | -7,81 | ||||
| 2026-02-10 | 13F | Td Asset Management Inc | 8.100 | 523 | ||||||
| 2026-02-12 | 13F | South Dakota Investment Council | 102.711 | -13,77 | 7 | 0,00 | ||||
| 2026-02-13 | 13F | Police & Firemen's Retirement System of New Jersey | 112.843 | 6,36 | 1.054 | 12,38 | ||||
| 2026-02-13 | 13F | Bridgefront Capital, LLC | 0 | -100,00 | 0 | |||||
| 2026-01-27 | 13F | Zurcher Kantonalbank (Zurich Cantonalbank) | 16.452 | 14,40 | 1.062 | 26,01 | ||||
| 2026-02-13 | 13F | Prudential Financial Inc | 4.881 | -48,79 | 315 | -43,55 | ||||
| 2026-01-27 | 13F | Jeppson Wealth Management, Llc | 6.857 | -1,44 | 443 | 8,60 | ||||
| 2026-02-06 | 13F | Covestor Ltd | 3 | -99,93 | 0 | |||||
| 2026-02-12 | 13F | Swiss National Bank | 121.083 | 1,76 | 7.815 | 12,06 | ||||
| 2026-02-10 | 13F | Eurizon Capital SGR S.p.A. | 198 | 13 | ||||||
| 2025-11-14 | 13F | Trexquant Investment LP | 0 | -100,00 | 0 | |||||
| 2025-11-07 | 13F | HighTower Advisors, LLC | 0 | -100,00 | 0 | |||||
| 2025-09-29 | NP | ARSMX - AMG River Road Small-Mid Cap Value Fund CLASS N SHARES | 103.628 | 6,95 | 5.565 | -1,38 | ||||
| 2026-02-05 | 13F | Allworth Financial LP | 868 | 99,08 | 56 | 124,00 | ||||
| 2026-02-11 | 13F | Hughes Financial Services, LLC | 2 | 0 | ||||||
| 2025-11-13 | 13F | Dynamic Technology Lab Private Ltd | 0 | -100,00 | 0 | |||||
| 2026-02-09 | 13F | Geode Capital Management, Llc | 1.628.750 | 0,18 | 105.141 | 10,32 | ||||
| 2026-02-10 | 13F | Bank of New York Mellon Corp | 774.920 | -10,03 | 50.013 | -0,93 | ||||
| 2025-11-13 | 13F | Blueshift Asset Management, LLC | 0 | -100,00 | 0 | |||||
| 2025-11-14 | 13F | Cubist Systematic Strategies, LLC | 0 | -100,00 | 0 | |||||
| 2026-01-15 | 13F | Fortitude Family Office, LLC | 28 | 0,00 | 2 | 0,00 | ||||
| 2026-02-17 | 13F | Clear Street Markets Llc | 0 | -100,00 | 0 | |||||
| 2026-02-09 | 13F | Keating Financial Advisory Services, Inc. | 20 | 1 | ||||||
| 2026-02-13 | 13F | Headlands Technologies LLC | 5.480 | -14,68 | 354 | -6,12 | ||||
| 2026-01-28 | 13F | DekaBank Deutsche Girozentrale | 33.664 | 0,00 | 2 | 0,00 | ||||
| 2026-02-13 | 13F | Cornerstone Financial Management LLC | 17 | 1 | ||||||
| 2026-01-16 | 13F | Longboard Asset Management, LP | 0 | -100,00 | 0 | |||||
| 2025-09-26 | NP | REBYX - U.S. Small Cap Equity Fund Class Y | 10.424 | -27,22 | 560 | -32,89 | ||||
| 2025-09-29 | NP | PAMC - Pacer Lunt MidCap Multi-Factor Alternator ETF | 2.992 | -73,70 | 161 | -75,83 | ||||
| 2026-02-12 | 13F | Jane Street Group, Llc | 348.670 | 94,51 | 22.503 | 114,19 | ||||
| 2026-02-03 | 13F | International Assets Investment Management, Llc | 10 | 1 | ||||||
| 2026-02-13 | 13F | Boston Partners | 0 | -100,00 | 0 | |||||
| 2026-01-28 | 13F | WPG Advisers, LLC | 9 | 0,00 | 1 | |||||
| 2025-11-12 | 13F | Arete Wealth Advisors, LLC | 0 | -100,00 | 0 | |||||
| 2026-02-17 | 13F | Royal Bank Of Canada | 15.100 | -97,54 | 975 | -97,29 | ||||
| 2026-02-13 | 13F | Neo Ivy Capital Management | 11.230 | 725 | ||||||
| 2026-01-22 | 13F | V-Square Quantitative Management LLC | 1.345 | 87 | ||||||
| 2026-02-05 | 13F | Amalgamated Bank | 25.868 | -4,01 | 2 | 0,00 | ||||
| 2026-01-08 | 13F | Wealth Enhancement Advisory Services, Llc | 17.663 | 25,95 | 1.148 | 39,03 | ||||
| 2026-02-17 | 13F | Advisory Services Network, LLC | 5.780 | -14,53 | 373 | -5,81 | ||||
| 2025-11-10 | 13F | Axq Capital, Lp | 0 | -100,00 | 0 | |||||
| 2026-02-12 | 13F | Front Row Advisors LLC | 1.135 | 0,00 | 73 | 10,61 | ||||
| 2026-02-13 | 13F | Ieq Capital, Llc | 76.430 | 33,18 | 4.933 | 46,65 | ||||
| 2025-09-26 | NP | PFM - Invesco Dividend Achievers ETF | 1.765 | -1,07 | 95 | -8,74 | ||||
| 2026-02-11 | 13F | Los Angeles Capital Management Llc | 330 | 20 | ||||||
| 2025-09-29 | NP | CFSLX - Column Small Cap Fund | 27.377 | 11,89 | 1.574 | 16,33 | ||||
| 2026-02-04 | 13F | Securian Asset Management, Inc | 4.449 | -2,20 | 287 | 7,89 | ||||
| 2026-02-17 | 13F | Aristotle Capital Boston, LLC | 0 | -100,00 | 0 | |||||
| 2025-09-26 | NP | MDPIX - Mid-cap Profund Investor Class | 99 | -56,00 | 5 | -61,54 | ||||
| 2026-01-21 | 13F | Yousif Capital Management, Llc | 18.952 | -1,95 | 1.286 | 13,52 | ||||
| 2025-09-26 | NP | RFV - Invesco S&P MidCap 400 Pure Value ETF This fund is a listed as child fund of Invesco Ltd. and if that institution has disclosed ownership in this security, then these positions will not be double counted when calculating total shares and total value | 34.242 | 6,80 | 1.839 | -1,55 | ||||
| 2025-09-26 | NP | TSMOX - TIAA-CREF Quant Small/Mid-Cap Equity Fund Retirement Class | 0 | -100,00 | 0 | -100,00 | ||||
| 2026-02-05 | 13F | New York Life Investment Management Llc | 137.843 | 6,79 | 8.896 | 17,59 | ||||
| 2026-02-17 | 13F | Ameriprise Financial Inc | 117.261 | -3,80 | 7.568 | 5,94 | ||||
| 2026-02-09 | 13F | Quest Partners LLC | 44.761 | 74,45 | 2.889 | 92,15 | ||||
| 2026-01-29 | 13F | Dunhill Financial, LLC | 1 | 0 | ||||||
| 2026-01-27 | 13F | GHP Investment Advisors, Inc. | 223 | 0,00 | 14 | 7,69 | ||||
| 2026-02-10 | 13F | Sivia Capital Partners, LLC | 8.167 | 33,12 | 527 | 46,80 | ||||
| 2026-02-12 | 13F | Alps Advisors Inc | 26.705 | -6,06 | 1.724 | 3,42 | ||||
| 2026-02-05 | 13F | Conning Inc. | 77.076 | 0,00 | 4.974 | 10,12 | ||||
| 2026-02-17 | 13F | Optiver Holding B.V. | 691 | 85,25 | 45 | 109,52 | ||||
| 2026-01-28 | 13F | VAUGHAN & Co SECURITIES, INC. | 9.696 | -5,73 | 626 | 3,82 | ||||
| 2026-01-08 | 13F | Versant Capital Management, Inc | 403 | 10,41 | 26 | 23,81 | ||||
| 2026-02-13 | 13F | Sterling Capital Management LLC | 3.573 | -16,42 | 231 | -8,00 | ||||
| 2025-11-12 | 13F | Operose Advisors LLC | 0 | -100,00 | 0 | |||||
| 2026-02-05 | 13F | Gamco Investors, Inc. Et Al | 274.350 | 0,37 | 17.707 | 10,52 | ||||
| 2026-02-11 | 13F | GW&K Investment Management, LLC | 593.888 | 38 | ||||||
| 2026-02-12 | 13F | Renaissance Technologies Llc | 0 | -100,00 | 0 | |||||
| 2026-02-12 | 13F | New York State Common Retirement Fund | 19.420 | 0,52 | 1.253 | 10,69 | ||||
| 2026-02-20 | 13F | Sunbelt Securities, Inc. | 83 | 10,67 | 5 | 25,00 | ||||
| 2026-02-09 | 13F | Mathes Company, Inc. | 54.655 | -1,49 | 4 | 0,00 | ||||
| 2026-02-13 | 13F | MAI Capital Management | 5.798 | 7,19 | 374 | 17,98 | ||||
| 2026-02-13 | 13F | Caxton Associates Llp | 0 | -100,00 | 0 | |||||
| 2026-02-17 | 13F | Public Employees Retirement System Of Ohio | 29.695 | -16,99 | 1.917 | -8,59 | ||||
| 2026-01-22 | 13F | Bfsg, Llc | 77 | 0,00 | 5 | 0,00 | ||||
| 2026-02-13 | 13F | Capula Management Ltd | 46.512 | 30,00 | 3.002 | 43,18 | ||||
| 2026-02-19 | 13F | Invesco Ltd. | 584.723 | -28,50 | 37.738 | -21,27 | ||||
| 2026-01-14 | 13F | Jfs Wealth Advisors, Llc | 23 | 155,56 | 1 | |||||
| 2026-02-10 | 13F | Commonwealth Of Pennsylvania Public School Empls Retrmt Sys | 132.201 | 13,71 | 8.532 | 25,21 | ||||
| 2026-02-11 | 13F | J.w. Cole Advisors, Inc. | 4.313 | 0,89 | 278 | 11,20 | ||||
| 2026-01-22 | 13F | Massachusetts Financial Services Co /ma/ | 569.334 | -11,99 | 36.745 | -3,09 | ||||
| 2025-09-29 | NP | PEY - Invesco High Yield Equity Dividend Achievers ETF This fund is a listed as child fund of Invesco Ltd. and if that institution has disclosed ownership in this security, then these positions will not be double counted when calculating total shares and total value | 365.694 | -16,13 | 19.638 | -22,65 | ||||
| 2025-09-29 | NP | ARDEX - AMG River Road Dividend All Cap Value Fund CLASS N SHARES | 16.259 | -2,76 | 873 | -10,28 | ||||
| 2026-01-30 | 13F | North Star Investment Management Corp. | 50.998 | 1,12 | 3.291 | 11,37 | ||||
| 2025-11-12 | 13F | Group One Trading, L.p. | Call | 0 | -100,00 | 0 | ||||
| 2026-02-17 | 13F | Polar Asset Management Partners Inc. | 20.987 | 1.355 | ||||||
| 2026-02-10 | 13F | Rothschild Investment Llc | 1.462 | 81,16 | 94 | 100,00 | ||||
| 2026-02-13 | 13F | Victory Capital Management Inc | 417.006 | -34,99 | 26.914 | -28,41 | ||||
| 2026-02-17 | 13F | Weiss Asset Management LP | 30.444 | -32,55 | 1.965 | -25,75 | ||||
| 2026-02-13 | 13F | Y-Intercept (Hong Kong) Ltd | 9.747 | 629 | ||||||
| 2025-11-04 | 13F | Convergence Investment Partners, LLC | 0 | -100,00 | 0 | |||||
| 2026-01-30 | 13F | American Capital Advisory, LLC | 2 | 0 | ||||||
| 2026-02-02 | 13F | Millstone Evans Group, LLC | 35 | 0,00 | 2 | 0,00 | ||||
| 2026-01-21 | 13F | SJS Investment Consulting Inc. | 13 | 160,00 | 1 | |||||
| 2026-01-22 | 13F | Lesa Sroufe & Co | 40.194 | 1,17 | 3 | 0,00 | ||||
| 2026-02-04 | 13F | LRI Investments, LLC | 68 | 0,00 | 4 | 33,33 | ||||
| 2026-02-11 | 13F | Vestcor Inc | 18.496 | 31,21 | 1 | |||||
| 2026-02-12 | 13F | Fuller & Thaler Asset Management, Inc. | 503.220 | -8,55 | 32.478 | 0,70 | ||||
| 2026-02-17 | 13F | Mairs & Power Inc | 81.682 | -8,26 | 5.272 | 1,02 | ||||
| 2025-11-13 | 13F | Capital Fund Management S.a. | 0 | -100,00 | 0 | |||||
| 2026-02-09 | 13F | Systematic Financial Management Lp | 1.159.753 | -1,46 | 74.851 | 8,51 | ||||
| 2026-02-06 | 13F | ProShare Advisors LLC | 645.335 | -18,82 | 41.650 | -10,60 | ||||
| 2026-02-11 | 13F | Brandywine Global Investment Management, LLC | 196.038 | -4,39 | 12.652 | 5,28 | ||||
| 2026-02-12 | 13F | Federation des caisses Desjardins du Quebec | 11.531 | 24,23 | 744 | 36,76 | ||||
| 2026-02-17 | 13F | Strive Financial Group ,LLC | 31 | 2 | ||||||
| 2025-09-26 | NP | USCAX - Small Cap Stock Fund Shares | 71.052 | 41,05 | 3.815 | 30,07 | ||||
| 2026-01-21 | 13F | Sound Income Strategies, LLC | 167 | 60,58 | 12 | 83,33 | ||||
| 2025-09-26 | NP | RAZAX - Multi-Asset Growth Strategy Fund Class A | 16.764 | 900 | ||||||
| 2026-02-13 | 13F | Caitong International Asset Management Co., Ltd | 0 | -100,00 | 0 | |||||
| 2026-02-17 | 13F | Hotchkis & Wiley Capital Management Llc | 225.467 | -2,42 | 14.552 | 7,46 | ||||
| 2026-02-13 | 13F | Squarepoint Ops LLC | 220.364 | 960,67 | 14.222 | 1.068,61 | ||||
| 2025-09-26 | NP | ETTOX - E*TRADE No Fee Total Market Index Fund | 7 | 0,00 | 0 | |||||
| 2026-02-17 | 13F | Water Island Capital Llc | 14.307 | 0,03 | 923 | 10,14 | ||||
| 2025-09-26 | NP | SLPIX - Small-cap Profund Investor Class | 55 | -8,33 | 3 | -33,33 | ||||
| 2026-02-03 | 13F | Crossmark Global Holdings, Inc. | 3.538 | 1,23 | 228 | 11,76 | ||||
| 2025-09-29 | NP | CFMCX - Column Mid Cap Fund | 40.621 | 6,52 | 2.336 | 10,76 | ||||
| 2026-02-12 | 13F | Hrt Financial Lp | 34.340 | 35,01 | 2 | 100,00 | ||||
| 2026-02-03 | 13F | Sequoia Financial Advisors, LLC | 23.198 | 32,17 | 1.497 | 45,62 | ||||
| 2026-02-17 | 13F | California State Teachers Retirement System | 60.825 | -0,09 | 3.926 | 10,01 | ||||
| 2026-01-29 | 13F | Teachers Retirement System Of The State Of Kentucky | 18.922 | 0,00 | 1 | 0,00 | ||||
| 2026-01-29 | 13F | Vanguard Group Inc | 6.667.340 | -0,42 | 430.310 | 9,65 | ||||
| 2026-02-17 | 13F | Magnetar Financial LLC | 197.657 | 1,09 | 12.757 | 11,32 | ||||
| 2026-01-26 | 13F | KBC Group NV | 1.977 | 0,00 | 0 | |||||
| 2026-02-17 | 13F | Janus Henderson Group Plc | 58.904 | 118,86 | 3.802 | 141,09 | ||||
| 2026-02-03 | 13F | SBI Securities Co., Ltd. | 272 | 9,24 | 18 | 21,43 | ||||
| 2026-02-17 | 13F | Northern Trust Corp | 764.406 | -5,83 | 49.335 | 3,70 | ||||
| 2026-01-28 | 13F | Arizona State Retirement System | 17.136 | -5,62 | 1.106 | 3,85 | ||||
| 2026-02-23 | 13F | Wealth Preservation Advisors, LLC | 75 | -11,76 | 5 | 0,00 | ||||
| 2026-02-11 | 13F | Meeder Advisory Services, Inc. | 9.995 | 645 | ||||||
| 2026-02-17 | 13F | Captrust Financial Advisors | 20.879 | 39,96 | 1.348 | 54,12 | ||||
| 2026-02-05 | 13F | Intrua Financial, LLC | 7.061 | -0,70 | 456 | 9,38 | ||||
| 2026-02-11 | 13F | Franklin Resources Inc | 1.436.750 | 7,36 | 92.728 | 18,22 | ||||
| 2026-02-13 | 13F | Morgan Stanley | 846.080 | 7,24 | 54.606 | 18,09 | ||||
| 2026-02-05 | 13F | Thrivent Financial For Lutherans | 489.871 | 0,20 | 32 | 10,71 | ||||
| 2026-02-17 | 13F | Prelude Capital Management, Llc | 28.262 | 261,22 | 1.824 | 298,25 | ||||
| 2026-02-05 | 13F | Tucker Asset Management Llc | 131 | 8 | ||||||
| 2025-11-10 | 13F | Jupiter Asset Management Ltd | 0 | -100,00 | 0 | |||||
| 2026-02-11 | 13F | Jpmorgan Chase & Co | 243.635 | -23,55 | 15.724 | -15,81 | ||||
| 2026-02-12 | 13F | Federated Hermes, Inc. | 4.968 | -93,22 | 321 | -92,55 | ||||
| 2026-02-06 | 13F | Envestnet Portfolio Solutions, Inc. | 19.984 | 1,64 | 1.290 | 11,89 | ||||
| 2026-02-11 | 13F | Winton Capital Group Ltd | 12.073 | 779 | ||||||
| 2026-02-13 | 13F | Pathstone Holdings, LLC | 4.979 | 5,09 | 321 | 15,88 | ||||
| 2025-09-26 | NP | EBIT - Harbor AlphaEdge Small Cap Earners ETF | 331 | 5,75 | 18 | -5,56 | ||||
| 2026-01-23 | 13F | Private Wealth Management Group, LLC | 107 | 0,00 | 7 | 0,00 | ||||
| 2025-09-26 | NP | WHGAX - Westwood Quality SmallCap Fund A Class Shares | 300.385 | 25,39 | 16.131 | 15,64 | ||||
| 2026-02-17 | 13F | PenderFund Capital Management Ltd. | 2.900 | 359,59 | 187 | 419,44 | ||||
| 2026-02-13 | 13F | Sei Investments Co | 41.999 | -25,41 | 2.711 | -17,88 | ||||
| 2026-02-24 | 13F | Bell Investment Advisors, Inc | 126 | -40,85 | 8 | -33,33 | ||||
| 2026-01-23 | 13F | Assetmark, Inc | 1.034 | 0,00 | 67 | 10,00 | ||||
| 2026-01-08 | 13F | Armstrong Advisory Group, Inc | 2.364 | 0,00 | 153 | 10,14 | ||||
| 2025-11-04 | 13F | Guerra Advisors Inc | 15 | 1 | ||||||
| 2026-01-15 | 13F | Nisa Investment Advisors, Llc | 49.566 | 6,85 | 3.199 | 17,66 | ||||
| 2026-02-17 | 13F | Aqr Capital Management Llc | 769.640 | -32,92 | 49.673 | -26,13 | ||||
| 2026-02-10 | 13F | Phillips Wealth Planners LLC | 3.964 | -11,12 | 271 | 4,63 | ||||
| 2026-02-17 | 13F | Citadel Advisors Llc | Call | 0 | -100,00 | 0 | ||||
| 2026-02-12 | 13F | Callan Family Office, LLC | 3.104 | 200 | ||||||
| 2026-02-17 | 13F | State Of Wisconsin Investment Board | 33.621 | -7,36 | 2.170 | 1,97 | ||||
| 2026-02-17 | 13F | SummitTX Capital, L.P. | 6.300 | 407 | ||||||
| 2026-02-03 | 13F | Bokf, Na | 4.968 | -0,54 | 321 | 9,59 | ||||
| 2025-09-26 | NP | USMIX - Extended Market Index Fund | 7.236 | -1,24 | 389 | -8,92 | ||||
| 2026-01-16 | 13F | Ronald Blue Trust, Inc. | 291 | 1,04 | 19 | 12,50 | ||||
| 2026-02-11 | 13F | Simplex Trading, Llc | Call | 0 | -100,00 | 0 | ||||
| 2026-02-11 | 13F | Simplex Trading, Llc | 0 | -100,00 | 0 | |||||
| 2026-02-10 | 13F | Godfrey Financial Associates, Inc. | 4 | 0 | ||||||
| 2026-02-11 | 13F | Simplex Trading, Llc | Put | 0 | -100,00 | 0 | ||||
| 2026-01-21 | 13F | Capital Advisors, Ltd. LLC | 20 | 0,00 | 0 | |||||
| 2026-01-09 | 13F | SG Americas Securities, LLC | 26.325 | 536,64 | 2 | |||||
| 2026-02-04 | 13F | Naples Global Advisors, Llc | 29.762 | -0,34 | 1.921 | 9,71 | ||||
| 2025-09-29 | NP | DIV - Global X SuperDividend U.S. ETF This fund is a listed as child fund of Mirae Asset Global Investments Co., Ltd. and if that institution has disclosed ownership in this security, then these positions will not be double counted when calculating total shares and total value | 261.951 | 3,40 | 14.067 | -4,64 | ||||
| 2026-02-17 | 13F | DV Trading LLC | 499 | 32 | ||||||
| 2026-02-03 | 13F | Farmers & Merchants Investments Inc | 55 | 0,00 | 4 | 0,00 | ||||
| 2026-02-13 | 13F | Manufacturers Life Insurance Company, The | 0 | -100,00 | 0 | |||||
| 2026-02-10 | 13F | Nomura Asset Management Co Ltd | 940 | 0,00 | 61 | 9,09 | ||||
| 2025-11-12 | 13F | Sciencast Management LP | 0 | -100,00 | 0 | |||||
| 2025-11-21 | 13F/A | CIBC Bancorp USA Inc. | 6.581 | 386 | ||||||
| 2026-02-12 | 13F | Quadrant Capital Group Llc | 6.919 | 0,00 | 447 | 10,12 | ||||
| 2026-02-12 | 13F | Commonwealth Equity Services, Llc | 67.634 | 4,92 | 4.365 | 145.400,00 | ||||
| 2026-02-05 | 13F | Bessemer Group Inc | 288 | 62,71 | 0 | |||||
| 2025-10-14 | 13F | Exchange Traded Concepts, Llc | 0 | -100,00 | 0 | -100,00 | ||||
| 2026-01-22 | 13F | Hager Investment Management Services, Llc | 15.518 | 14,68 | 1.002 | 26,23 | ||||
| 2026-02-12 | 13F | MetLife Investment Management, LLC | 288.621 | -0,93 | 18.628 | 9,09 | ||||
| 2026-01-29 | 13F | State Of Michigan Retirement System | 14.528 | -0,68 | 938 | 9,33 | ||||
| 2026-02-13 | 13F | Wells Fargo & Company/mn | 91.621 | 34,97 | 5.913 | 48,64 | ||||
| 2026-02-02 | 13F | Cornerstone Planning Group LLC | 14 | -77,05 | 1 | -100,00 | ||||
| 2026-02-17 | 13F | Wealth Watch Advisors, INC | 84 | 0,00 | 5 | 25,00 | ||||
| 2026-01-08 | 13F | True Wealth Design, LLC | 113 | 48,68 | 7 | 75,00 | ||||
| 2026-02-17 | 13F | Point72 Asset Management, L.P. | 59.406 | 3.834 | ||||||
| 2026-02-04 | 13F | Swiss Life Asset Management Ltd | 5.562 | 359 | ||||||
| 2026-01-08 | 13F | Oliver Luxxe Assets LLC | 79.226 | 2,07 | 5.113 | 12,40 | ||||
| 2026-02-09 | 13F | William Blair Investment Management, Llc | 413.328 | -9,40 | 26.676 | -0,24 | ||||
| 2026-02-10 | 13F | Daiwa Securities Group Inc. | 1.885 | -16,37 | 0 | |||||
| 2025-09-29 | NP | ARSVX - AMG River Road Small Cap Value Fund CLASS N SHARES | 349.102 | -2,03 | 18.747 | -9,65 | ||||
| 2025-09-26 | NP | FXSCX - Fidelity Flex Small Cap Focused Index Fund | 177 | 10 | ||||||
| 2026-01-27 | 13F | Deroy & Devereaux Private Investment Counsel Inc | 60.395 | -2,74 | 4 | 0,00 | ||||
| 2026-02-05 | 13F | Atria Investments Llc | 9.234 | 50,69 | 596 | 65,74 | ||||
| 2025-11-14 | 13F | Prosperity Consulting Group, LLC | 0 | -100,00 | 0 | |||||
| 2026-02-17 | 13F | Millennium Management Llc | 920.554 | 1.214,38 | 59.413 | 1.347,66 | ||||
| 2026-01-30 | 13F | Canandaigua National Bank & Trust Co | 3.702 | -5,08 | 239 | 4,39 | ||||
| 2026-02-17 | 13F | Advisor Group Holdings, Inc. | 2.485 | 17,27 | 160 | 30,08 | ||||
| 2025-09-29 | NP | RSSL - Global X Russell 2000 ETF | 31.548 | -15,74 | 1.694 | -22,29 | ||||
| 2026-02-12 | 13F | Principal Securities, Inc. | 0 | -100,00 | 0 | -100,00 | ||||
| 2026-02-17 | 13F | D. E. Shaw & Co., Inc. | 14.751 | 952 | ||||||
| 2026-01-22 | 13F | Bartlett & Co. Wealth Management Llc | 102 | 0,00 | 7 | 20,00 | ||||
| 2026-02-02 | 13F | Bay Harbor Wealth Management, LLC | 6 | 50,00 | 0 | |||||
| 2026-01-07 | 13F | Massmutual Trust Co Fsb/adv | 58 | 0,00 | 4 | 0,00 | ||||
| 2026-02-12 | 13F | Triumph Capital Management | 1.380 | 0,00 | 89 | 11,25 | ||||
| 2025-11-14 | 13F | Graham Capital Management, L.P. | 0 | -100,00 | 0 | -100,00 | ||||
| 2026-02-14 | 13F | Rockefeller Capital Management L.P. | 1.280 | 418,22 | 83 | 485,71 | ||||
| 2025-11-07 | 13F | Gsa Capital Partners Llp | 0 | -100,00 | 0 | |||||
| 2025-11-14 | 13F | Two Sigma Investments, Lp | 0 | -100,00 | 0 | -100,00 | ||||
| 2025-11-14 | 13F | Jane Street Group, Llc | Call | 0 | -100,00 | 0 | -100,00 | |||
| 2026-02-10 | 13F | Connor, Clark & Lunn Investment Management Ltd. | 5.816 | -91,79 | 375 | -90,96 | ||||
| 2025-09-29 | NP | ZAP - Global X U.S. Electrification ETF | 9.713 | 36,32 | 522 | 25,85 | ||||
| 2026-01-20 | 13F | Harbor Capital Advisors, Inc. | 328 | -1,80 | 0 | |||||
| 2026-02-13 | 13F | Verition Fund Management LLC | 30.711 | -57,06 | 1.982 | -52,71 | ||||
| 2025-09-29 | NP | PTMC - Pacer Trendpilot US Mid Cap ETF | 8.720 | -5,46 | 468 | -5,84 | ||||
| 2026-02-13 | 13F | Pinnacle Wealth Planning Services, Inc. | 81 | 5 | ||||||
| 2025-10-28 | 13F | Campbell & CO Investment Adviser LLC | 0 | -100,00 | 0 | -100,00 | ||||
| 2026-01-15 | 13F | Retirement Systems of Alabama | 73.698 | -0,71 | 4.756 | 9,33 | ||||
| 2026-01-06 | 13F | Ransom Advisory, Ltd | 1.450 | -40,82 | 94 | -34,97 | ||||
| 2026-01-20 | 13F | Signaturefd, Llc | 879 | 28,51 | 57 | 40,00 | ||||
| 2026-01-23 | 13F | Rsm Us Wealth Management Llc | 3.375 | -12,41 | 219 | -2,67 | ||||
| 2026-02-17 | 13F | Delaware Management Holdings, Inc. | 1.025.302 | 66.173 | ||||||
| 2026-02-18 | 13F | First Citizens Bank & Trust Co | 18.156 | 2,19 | 1.172 | 12,49 | ||||
| 2026-02-17 | 13F | Schonfeld Strategic Advisors LLC | 16.196 | 1.045 | ||||||
| 2026-02-11 | 13F | Vise Technologies, Inc. | 4.261 | 22,27 | 275 | 34,80 | ||||
| 2026-02-17 | 13F | Westwood Holdings Group Inc | 787.257 | -19,77 | 50.810 | -11,65 | ||||
| 2026-02-13 | 13F | Citigroup Inc | 482.614 | 12,14 | 31.148 | 23,49 | ||||
| 2025-11-06 | 13F | MQS Management LLC | 0 | -100,00 | 0 | -100,00 | ||||
| 2026-02-17 | 13F | Russell Investments Group, Ltd. | 117.812 | -53,60 | 7.604 | -48,91 | ||||
| 2026-01-14 | 13F | Wedge Capital Management L L P/nc | 74.026 | -2,06 | 4.778 | 7,86 | ||||
| 2026-02-10 | 13F | Envestnet Asset Management Inc | 46.300 | -17,83 | 2.988 | -9,51 | ||||
| 2026-02-03 | 13F | Everence Capital Management Inc | 4.521 | 0,00 | 0 | |||||
| 2025-11-14 | 13F | DZ BANK AG Deutsche Zentral Genossenschafts Bank, Frankfurt am Main | 0 | -100,00 | 0 | |||||
| 2026-01-28 | 13F | Universal- Beteiligungs- und Servicegesellschaft mbH | 4.762 | 24,63 | 307 | 37,67 | ||||
| 2026-02-17 | 13F | LMR Partners LLP | 8.893 | 574 | ||||||
| 2026-02-10 | 13F | Goldman Sachs Group Inc | 657.233 | 171,01 | 42.418 | 198,44 | ||||
| 2026-02-17 | 13F | Cnh Partners Llc | 607.028 | 2.434,88 | 39.178 | 2.692,37 | ||||
| 2026-02-13 | 13F | Natixis | 0 | -100,00 | 0 | |||||
| 2026-02-12 | 13F | Bank Of Montreal /can/ | 33.287 | -9,73 | 2.148 | -0,60 | ||||
| 2026-02-02 | 13F | Hussman Strategic Advisors, Inc. | 1.000 | 0,00 | 65 | 10,34 | ||||
| 2026-02-12 | 13F | Wealthspire Advisors, LLC | 0 | -100,00 | 0 | |||||
| 2026-02-13 | 13F | Martingale Asset Management L P | 49.604 | -1,08 | 3.201 | 8,95 | ||||
| 2026-02-11 | 13F | LPL Financial LLC | 14.012 | -0,38 | 904 | 9,71 | ||||
| 2026-01-30 | 13F | Bogart Wealth, LLC | 5 | 0,00 | 0 | |||||
| 2025-10-17 | 13F | Shaker Investments Llc/oh | 0 | -100,00 | 0 | -100,00 | ||||
| 2026-01-29 | 13F | Quent Capital, LLC | 56 | 80,65 | 4 | 200,00 | ||||
| 2026-02-12 | 13F | Dimensional Fund Advisors Lp | 1.017.415 | 0,70 | 65.664 | 10,89 | ||||
| 2025-09-26 | NP | FLXSX - Fidelity Flex Small Cap Index Fund This fund is a listed as child fund of Fmr Llc and if that institution has disclosed ownership in this security, then these positions will not be double counted when calculating total shares and total value | 13.208 | 9,98 | 709 | 1,43 | ||||
| 2025-09-26 | NP | TASVX - PGIM QMA SMALL-CAP VALUE FUND Class Z | 57.100 | 0,00 | 3.066 | -7,76 | ||||
| 2025-11-12 | 13F | NewSquare Capital LLC | 0 | -100,00 | 0 | |||||
| 2026-02-13 | 13F | Public Employees Retirement Association Of Colorado | 6.157 | 0,00 | 0 | |||||
| 2026-02-17 | 13F | Zacks Investment Management | 10.665 | 0,79 | 688 | 10,97 | ||||
| 2026-02-04 | 13F | Oregon Public Employees Retirement Fund | 12.310 | -0,81 | 794 | 9,22 | ||||
| 2026-01-05 | 13F | GAMMA Investing LLC | 3.528 | 27,32 | 228 | 40,12 | ||||
| 2026-02-02 | 13F | Oppenheimer Asset Management Inc. | 6.975 | -30,36 | 450 | -23,34 | ||||
| 2026-02-17 | 13F | Quantinno Capital Management LP | 17.664 | 93,41 | 1.140 | 113,08 | ||||
| 2026-01-16 | 13F | DiNuzzo Private Wealth, Inc. | 7 | 0,00 | 0 | |||||
| 2026-02-17 | 13F | Alliancebernstein L.p. | 776.126 | 284,66 | 50.091 | 323,60 | ||||
| 2026-02-11 | 13F | CSM Advisors, LLC | 10.589 | -0,44 | 1 | |||||
| 2026-01-30 | 13F | New York State Teachers Retirement System | 74.445 | -1,18 | 5 | 0,00 | ||||
| 2026-02-13 | 13F | C M Bidwell & Associates Ltd | 68 | 0,00 | 4 | 33,33 | ||||
| 2026-02-17 | 13F | Ancora Advisors, LLC | 129.405 | -42,76 | 8.352 | -36,97 | ||||
| 2026-02-18 | 13F | Mackenzie Financial Corp | 4.228 | -0,59 | 273 | 9,24 | ||||
| 2026-01-27 | 13F | First Horizon Corp | 919 | 120,91 | 59 | 145,83 | ||||
| 2026-02-17 | 13F | Polymer Capital Management (US) LLC | 19.491 | 216,57 | 1.258 | 249,17 | ||||
| 2026-02-17 | 13F | Dark Forest Capital Management Lp | 0 | -100,00 | 0 | |||||
| 2026-02-17 | 13F | Mercer Global Advisors Inc /adv | 17.564 | 38,03 | 1.134 | 52,08 | ||||
| 2026-02-13 | 13F | First Trust Advisors Lp | 650.323 | -21,87 | 41.972 | -13,97 | ||||
| 2026-02-26 | 13F | Anchor Investment Management, LLC | 1 | 0,00 | 0 | |||||
| 2026-02-02 | 13F | CENTRAL TRUST Co | 500 | -66,67 | 32 | -63,22 | ||||
| 2026-02-17 | 13F | Infrastructure Capital Advisors, Llc | 7.488 | -15,27 | 483 | -8,35 | ||||
| 2025-09-26 | NP | FZROX - Fidelity ZERO Total Market Index Fund This fund is a listed as child fund of Fmr Llc and if that institution has disclosed ownership in this security, then these positions will not be double counted when calculating total shares and total value | 29.159 | 4,22 | 1.566 | -3,93 | ||||
| 2025-09-26 | NP | MSTQX - Morningstar U.S. Equity Fund | 26.600 | 36,47 | 1.428 | 25,81 | ||||
| 2026-02-17 | 13F | Guggenheim Capital Llc | 6.740 | -57,66 | 435 | -53,38 | ||||
| 2026-01-22 | 13F | Ifrah Financial Services, Inc. | 4.070 | -3,21 | 263 | 6,50 | ||||
| 2026-02-10 | 13F | Bnp Paribas Arbitrage, Sa | 24.731 | 47,82 | 1.596 | 62,86 | ||||
| 2026-02-17 | 13F | Canada Pension Plan Investment Board | 132.400 | 8.545 | ||||||
| 2026-02-06 | 13F | Resona Asset Management Co.,Ltd. | 7.172 | 0,00 | 463 | 10,00 | ||||
| 2025-09-26 | NP | FSSNX - Fidelity Small Cap Index Fund This fund is a listed as child fund of Fmr Llc and if that institution has disclosed ownership in this security, then these positions will not be double counted when calculating total shares and total value | 623.069 | -0,40 | 33.459 | -8,15 | ||||
| 2026-02-13 | 13F | JustInvest LLC | 9.486 | 5,87 | 612 | 16,57 | ||||
| 2025-10-14 | 13F | S.A. Mason LLC | 0 | -100,00 | 0 | |||||
| 2026-02-10 | 13F | Mutual Of America Capital Management Llc | 122.803 | -5,74 | 7.926 | 3,78 | ||||
| 2026-02-12 | 13F | Advisors Asset Management, Inc. | 81.271 | -33,29 | 5.245 | -26,54 | ||||
| 2025-10-20 | 13F | Allspring Global Investments Holdings, LLC | 0 | -100,00 | 0 | |||||
| 2026-02-06 | 13F | IFP Advisors, Inc | 455 | 142,02 | 29 | 163,64 | ||||
| 2026-02-11 | 13F | O'shaughnessy Asset Management, Llc | 4.731 | -8,86 | 305 | 0,33 | ||||
| 2025-11-03 | 13F | Annis Gardner Whiting Capital Advisors, LLC | 0 | -100,00 | 0 | -100,00 | ||||
| 2026-02-12 | 13F | Nuveen, LLC | 502.742 | -23,19 | 32.447 | -15,42 | ||||
| 2025-11-07 | 13F | Shell Asset Management Co | 1.345 | -65,05 | 0 | |||||
| 2025-10-24 | 13F | Hemington Wealth Management | 134 | 5,51 | 0 | |||||
| 2026-02-02 | 13F | Principal Financial Group Inc | 133.030 | -19,32 | 8.586 | -11,17 | ||||
| 2026-02-17 | 13F | Raymond James Financial Inc | 445.575 | -20,71 | 28.757 | -12,68 | ||||
| 2026-02-13 | 13F | Umb Bank N A/mo | 1.592 | 252,21 | 103 | 292,31 | ||||
| 2025-09-29 | NP | KCXIX - Knights of Columbus U.S. All Cap Index Fund I Shares | 272 | 2,64 | 15 | -6,67 | ||||
| 2026-01-23 | 13F | Farther Finance Advisors, LLC | 1.576 | 60,49 | 102 | 77,19 | ||||
| 2026-02-17 | 13F | Private Advisor Group, LLC | 10.280 | 0,00 | 663 | 10,13 | ||||
| 2026-02-17 | 13F | Bank Of America Corp /de/ | 766.720 | -10,39 | 49.484 | -1,32 | ||||
| 2026-02-17 | 13F | MIRAE ASSET GLOBAL ETFS HOLDINGS Ltd. | 320.156 | 2,08 | 20.663 | 12,41 | ||||
| 2025-09-26 | NP | RMYAX - Multi-Strategy Income Fund Class A | 7.342 | 401,50 | 394 | 297,98 | ||||
| 2026-02-09 | 13F | Legal & General Group Plc | 294.648 | -7,69 | 19.017 | 1,65 | ||||
| 2026-02-17 | 13F | Voloridge Investment Management, Llc | 0 | -100,00 | 0 | |||||
| 2026-02-17 | 13F | Keebeck Alpha, LP | 22.848 | 1.475 | ||||||
| 2026-02-18 | 13F | State of Tennessee, Treasury Department | 19.066 | -4,10 | 1.294 | 10,99 | ||||
| 2025-11-13 | 13F | Hsbc Holdings Plc | 0 | -100,00 | 0 | |||||
| 2026-02-11 | 13F | Ameritas Investment Partners, Inc. | 16.265 | 1.050 | ||||||
| 2026-01-14 | 13F | Hennion & Walsh Asset Management, Inc. | 15.144 | 183,86 | 977 | 213,14 | ||||
| 2026-02-17 | 13F | Engineers Gate Manager LP | 15.965 | -0,57 | 1.030 | 9,46 | ||||
| 2026-02-17 | 13F | Citadel Advisors Llc | 288.102 | 448,88 | 18.594 | 504,49 | ||||
| 2026-02-13 | 13F | Fiduciary Trust Co | 4.800 | -0,21 | 310 | 9,96 | ||||
| 2026-02-13 | 13F | Ubs Asset Management Americas Inc | 236.301 | 79,25 | 15.251 | 97,39 | ||||
| 2025-11-14 | 13F | Two Sigma Advisers, Lp | 0 | -100,00 | 0 | |||||
| 2025-10-28 | 13F | Eagle Global Advisors Llc | 0 | -100,00 | 0 | -100,00 | ||||
| 2025-11-14 | 13F | Kempen Capital Management N.v. | 0 | -100,00 | 0 | |||||
| 2025-09-26 | NP | TIEIX - TIAA-CREF Equity Index Fund Institutional Class | 58.124 | 0,00 | 3.121 | -7,77 | ||||
| 2026-01-14 | 13F | Accurate Wealth Management, LLC | 4.502 | 25,06 | 297 | 42,11 | ||||
| 2025-09-26 | NP | PRF - Invesco FTSE RAFI US 1000 ETF This fund is a listed as child fund of Invesco Ltd. and if that institution has disclosed ownership in this security, then these positions will not be double counted when calculating total shares and total value | 21.839 | -8,62 | 1.173 | -15,74 | ||||
| 2026-02-05 | 13F | Gabelli Funds Llc | 548.700 | 0,46 | 35.413 | 10,62 | ||||
| 2025-09-26 | NP | XMVM - Invesco S&P MidCap Value with Momentum ETF This fund is a listed as child fund of Invesco Ltd. and if that institution has disclosed ownership in this security, then these positions will not be double counted when calculating total shares and total value | 53.735 | 51,60 | 2.886 | 61,44 | ||||
| 2025-09-29 | NP | SUNAMERICA SERIES TRUST - SA Mid Cap Index Portfolio Class 1 | 10.371 | 0,28 | 557 | -7,64 | ||||
| 2026-02-13 | 13F | Aigen Investment Management, Lp | 5.729 | 370 | ||||||
| 2026-01-29 | 13F | Sanctuary Advisors, LLC | 3.503 | 226 | ||||||
| 2025-11-12 | 13F | Aster Capital Management (DIFC) Ltd | 0 | -100,00 | 0 | |||||
| 2025-11-14 | 13F | Texas Permanent School Fund | 0 | -100,00 | 0 | |||||
| 2026-02-23 | 13F | Virtu Financial LLC | 27.797 | 531,75 | 2 | |||||
| 2026-02-17 | 13F | Maryland State Retirement & Pension System | 57.615 | 1,24 | 3.718 | 11,48 | ||||
| 2026-02-13 | 13F | Great West Life Assurance Co /can/ | 83.253 | 2,25 | 5 | 25,00 | ||||
| 2026-02-10 | 13F | Norges Bank | 778.958 | 50.274 | ||||||
| 2026-02-11 | 13F | Rise Advisors, LLC | 0 | -100,00 | 0 | |||||
| 2026-02-17 | 13F | Adage Capital Partners Gp, L.l.c. | 812.500 | 52.439 | ||||||
| 2026-02-12 | 13F | Cloud Capital Management, LLC | 0 | -100,00 | 0 | |||||
| 2026-02-17 | 13F | Jones Financial Companies Lllp | 1.197 | 0,00 | 77 | 11,59 | ||||
| 2025-09-29 | NP | CFSSX - Column Small Cap Select Fund | 267.953 | 286,51 | 15.410 | 301,80 | ||||
| 2026-02-05 | 13F | Northwestern Mutual Investment Management Company, Llc | 13.739 | 0,40 | 887 | 10,47 | ||||
| 2026-01-27 | 13F | Bayforest Capital Ltd | 983 | 518,24 | 63 | 600,00 | ||||
| 2025-10-28 | 13F | BRYN MAWR TRUST Co | 354 | -83,13 | 21 | -81,31 | ||||
| 2026-01-28 | 13F | Teacher Retirement System Of Texas | 9.118 | -39,49 | 588 | -33,41 | ||||
| 2026-01-29 | 13F | Schnieders Capital Management, Llc. | 25.948 | 9,49 | 1.675 | 20,61 | ||||
| 2026-01-27 | 13F | Brighton Jones Llc | 0 | -100,00 | 0 | |||||
| 2026-02-12 | 13F | State Board Of Administration Of Florida Retirement System | 16.886 | 0,00 | 1.090 | 10,11 | ||||
| 2025-09-29 | NP | SUNAMERICA SERIES TRUST - SA Small Cap Index Portfolio Class 1 | 7.050 | 0,64 | 379 | -7,13 | ||||
| 2026-02-05 | 13F | Passumpsic Savings Bank | 11.153 | 3,67 | 720 | 25,04 | ||||
| 2026-01-23 | 13F | First PREMIER Bank | 104.567 | -5,79 | 7 | 0,00 | ||||
| 2026-02-17 | 13F | XTX Topco Ltd | 44.258 | 278,92 | 2.856 | 317,54 | ||||
| 2026-02-24 | 13F | River Road Asset Management, LLC | 1.263.967 | -44,84 | 81.576 | -39,26 | ||||
| 2026-01-27 | 13F | Proffitt & Goodson Inc | 0 | -100,00 | 0 | |||||
| 2026-01-09 | 13F | Assenagon Asset Management S.A. | 14.332 | 36,99 | 925 | 50,73 | ||||
| 2026-02-03 | 13F | Costello Asset Management, INC | 1.510 | -12,77 | 97 | -3,96 | ||||
| 2026-02-10 | 13F | Intech Investment Management Llc | 27.796 | 23,40 | 1.794 | 35,83 | ||||
| 2026-02-13 | 13F | DC Investments Management, LLC | 32.976 | 0,00 | 2.128 | 10,14 | ||||
| 2026-02-17 | 13F | Brevan Howard Capital Management LP | 22.423 | 21,69 | 1.447 | 33,98 | ||||
| 2026-02-17 | 13F | Fmr Llc | 1.124.935 | 0,16 | 72.603 | 10,29 | ||||
| 2026-01-30 | 13F | Us Bancorp \de\ | 12.208 | -0,82 | 788 | 9,15 | ||||
| 2026-02-17 | 13F | Balyasny Asset Management Llc | 1.005.886 | 5.851,28 | 64.920 | 6.457,47 | ||||
| 2026-02-13 | 13F | Barclays Plc | 133.107 | -6,32 | 8.591 | 3,15 | ||||
| 2026-02-13 | 13F | State Street Corp | 2.637.718 | 0,56 | 170.238 | 10,74 | ||||
| 2025-09-26 | NP | PESPX - BNY Mellon Midcap Index Fund, Inc. Investor Shares | 28.319 | -4,09 | 1.521 | -11,58 | ||||
| 2026-02-04 | 13F | Bailard, Inc. | 10.600 | 4,95 | 684 | 15,74 | ||||
| 2026-02-17 | 13F | Susquehanna Portfolio Strategies, LLC | 40.876 | 109,03 | 2.638 | 130,19 | ||||
| 2026-02-11 | 13F | Heartland Advisors Inc | 69.627 | 159,75 | 4.494 | 186,00 | ||||
| 2025-09-26 | NP | SMMV - iShares Edge MSCI Min Vol USA Small-Cap ETF | 28.521 | 9,76 | 1.532 | 1,19 | ||||
| 2026-02-09 | 13F | Huntington National Bank | 236 | -3,28 | 15 | 7,14 | ||||
| 2025-11-04 | 13F | State of Wyoming | 0 | -100,00 | 0 | |||||
| 2026-01-12 | 13F | Legacy Wealth Asset Management, LLC | 3.148 | 203 | ||||||
| 2026-02-17 | 13F | Susquehanna International Group, Llp | 86.992 | 1.262,66 | 5.614 | 1.401,07 | ||||
| 2026-02-17 | 13F | Susquehanna International Group, Llp | Call | 7.500 | 484 | |||||
| 2026-02-13 | 13F | Hudson Bay Capital Management LP | 499.509 | 32.238 | ||||||
| 2026-02-13 | 13F | Public Sector Pension Investment Board | 70.176 | 4.529 | ||||||
| 2026-02-17 | 13F | Creative Planning | 34.557 | 46,89 | 2.230 | 61,83 | ||||
| 2026-02-06 | 13F | Bare Financial Services, Inc | 21 | 75,00 | 1 | |||||
| 2026-02-06 | 13F | EverSource Wealth Advisors, LLC | 2.188 | 35,65 | 141 | 50,00 | ||||
| 2026-02-12 | 13F | Xponance, Inc. | 7.432 | -14,36 | 480 | -5,71 | ||||
| 2026-02-13 | 13F | Mariner, LLC | 32.290 | 82,49 | 2.084 | 100,96 | ||||
| 2026-02-17 | 13F | Jump Financial, LLC | 32.531 | 2.100 | ||||||
| 2026-01-16 | 13F | Louisiana State Employees Retirement System | 17.000 | -0,58 | 1.097 | 9,48 | ||||
| 2026-02-18 | 13F | GWM Advisors LLC | 0 | -100,00 | 0 | |||||
| 2026-02-13 | 13F | Jacobi Capital Management LLC | 7.249 | 0,10 | 468 | 10,14 | ||||
| 2026-02-13 | 13F | Van Eck Associates Corp | 23.784 | 6,49 | 2 | 0,00 | ||||
| 2026-02-10 | 13F/A | Northwestern Mutual Wealth Management Co | 174 | 262,50 | 11 | 450,00 | ||||
| 2025-09-26 | NP | MLPIX - Mid-cap Value Profund Investor Class | 90 | -28,57 | 5 | -42,86 | ||||
| 2025-09-26 | NP | UAPIX - Ultrasmall-cap Profund Investor Class | 684 | 8,40 | 37 | 0,00 | ||||
| 2025-09-26 | NP | JHSC - John Hancock Multifactor Small Cap ETF | 12.645 | 2,12 | 679 | -5,83 | ||||
| 2026-02-17 | 13F | Qube Research & Technologies Ltd | 388.665 | -17,45 | 25.084 | -9,10 | ||||
| 2026-02-11 | 13F | Parallel Advisors, LLC | 2.233 | 107,91 | 144 | 132,26 | ||||
| 2026-02-12 | 13F | Cibc World Markets Corp | 4.084 | -46,31 | 264 | -32,56 | ||||
| 2026-01-29 | 13F | Pictet Asset Management Holding SA | 11.087 | -5,82 | 716 | 3,77 | ||||
| 2026-02-17 | 13F | SageView Advisory Group, LLC | 50 | 3 | ||||||
| 2025-11-04 | 13F | Money Concepts Capital Corp | 0 | -100,00 | 0 | -100,00 | ||||
| 2026-01-30 | 13F | State of New Jersey Common Pension Fund D | 32.769 | -12,08 | 2.115 | -3,21 | ||||
| 2026-02-17 | 13F | Moore Capital Management, Lp | 53.470 | 3.451 | ||||||
| 2026-02-12 | 13F | IFM Investors Pty Ltd | 0 | -100,00 | 0 | |||||
| 2026-02-17 | 13F | Jain Global LLC | 5.746 | 371 | ||||||
| 2026-02-13 | 13F | Colony Group, LLC | 5.511 | 350 | ||||||
| 2025-09-26 | NP | TISEX - TIAA-CREF Quant Small-Cap Equity Fund Institutional Class | 79.470 | -66,32 | 4.268 | -68,94 | ||||
| 2025-11-14 | 13F | Skopos Labs, Inc. | 0 | -100,00 | 0 | |||||
| 2026-02-03 | 13F | Ethic Inc. | 3.767 | 3,66 | 243 | 14,62 | ||||
| 2026-02-17 | 13F | Aventail Capital Group, LP | 0 | -100,00 | 0 | |||||
| 2026-02-11 | 13F | Cerity Partners LLC | 57.399 | 59,15 | 3.705 | 75,30 | ||||
| 2026-02-12 | 13F | Voya Investment Management Llc | 25.820 | -0,24 | 1.666 | 9,89 | ||||
| 2026-02-17 | 13F | Cetera Investment Advisers | 11.208 | -0,41 | 723 | 9,71 | ||||
| 2025-11-13 | 13F | Ensign Peak Advisors, Inc | 0 | -100,00 | 0 | |||||
| 2026-02-13 | 13F | Huber Capital Management LLC | 12.062 | 0,00 | 778 | 10,20 | ||||
| 2025-11-14 | 13F | Quarry LP | 0 | -100,00 | 0 | -100,00 | ||||
| 2026-02-17 | 13F | Yaupon Capital Management LP | 100.624 | -13,02 | 6.494 | -4,22 | ||||
| 2026-02-06 | 13F | Larson Financial Group LLC | 245 | 91,41 | 16 | 114,29 | ||||
| 2026-02-17 | 13F | Grantham, Mayo, Van Otterloo & Co. LLC | 483.291 | 723,35 | 31.192 | 806,72 | ||||
| 2026-02-13 | 13F | Neuberger Berman Group LLC | 1.259.921 | -0,67 | 81.324 | 9,43 | ||||
| 2026-02-12 | 13F | Skandinaviska Enskilda Banken AB (publ) | 10.000 | 645 | ||||||
| 2026-01-12 | 13F | Rialto Wealth Management, LLC | 13 | 0,00 | 1 | |||||
| 2026-01-29 | 13F | UMA Financial Services, Inc. | 4.825 | 0,00 | 311 | 10,28 | ||||
| 2026-02-02 | 13F | Strs Ohio | 18.800 | 1,08 | 1.213 | 11,28 | ||||
| 2026-02-04 | 13F | Atlantic Union Bankshares Corp | 33 | 57,14 | 2 | 100,00 | ||||
| 2026-02-13 | 13F | Commerce Bank | 9.043 | -1,04 | 584 | 8,97 | ||||
| 2026-02-13 | 13F | Rhumbline Advisers | 193.573 | -11,05 | 12.493 | -2,05 | ||||
| 2026-02-05 | 13F | HFM Investment Advisors, LLC | 3 | 0,00 | 0 | |||||
| 2025-09-26 | NP | TISBX - TIAA-CREF Small-Cap Blend Index Fund Institutional Class | 79.634 | 2,00 | 4.276 | -5,94 | ||||
| 2026-02-17 | 13F | Kintayl Capital LP | 130.127 | 0,10 | 8.398 | 10,24 | ||||
| 2026-01-30 | 13F | Caldwell Trust Co | 18 | 0,00 | 1 | 0,00 | ||||
| 2026-02-17 | 13F | Credit Agricole S A | 25.415 | 1.640 | ||||||
| 2026-01-20 | 13F | AdvisorNet Financial, Inc | 965 | 5,23 | 62 | 16,98 | ||||
| 2026-02-13 | 13F | Arrowstreet Capital, Limited Partnership | 4.434 | 286 | ||||||
| 2025-09-26 | NP | AVFIX - American Beacon Small Cap Value Fund Institutional Class | 365.674 | 16,24 | 19.637 | 7,20 | ||||
| 2026-02-13 | 13F | Macquarie Group Ltd | 34.419 | -97,10 | 2.221 | -96,80 | ||||
| 2025-10-30 | 13F | Twin Peaks Wealth Advisors, LLC | 0 | -100,00 | 0 | -100,00 | ||||
| 2026-02-10 | 13F | New Mexico Educational Retirement Board | 11.800 | 0,00 | 1 | |||||
| 2025-09-29 | NP | MIDU - Direxion Daily Mid Cap Bull 3X Shares | 1.071 | 1,23 | 58 | -6,56 | ||||
| 2026-02-09 | 13F | Hartland & Co., LLC | 217 | -58,90 | 14 | -53,33 | ||||
| 2026-02-13 | 13F/A | Ontario Teachers Pension Plan Board | 0 | -100,00 | 0 | |||||
| 2025-11-12 | 13F | First Eagle Investment Management, LLC | 0 | -100,00 | 0 | -100,00 | ||||
| 2025-11-14 | 13F | Point72 Asia (Singapore) Pte. Ltd. | 0 | -100,00 | 0 | |||||
| 2025-09-26 | NP | FZIPX - Fidelity ZERO Extended Market Index Fund This fund is a listed as child fund of Fmr Llc and if that institution has disclosed ownership in this security, then these positions will not be double counted when calculating total shares and total value | 18.314 | -0,23 | 983 | -7,96 | ||||
| 2026-02-09 | 13F | Harbour Investments, Inc. | 5.748 | 371 | ||||||
| 2026-02-10 | 13F | Magellan Asset Management Ltd | 52.410 | 4,53 | 3.383 | 15,11 | ||||
| 2025-09-26 | NP | RTSSX - Tax-Managed U.S. Mid & Small Cap Fund Class S | 62.367 | -4,55 | 3.349 | -11,96 | ||||
| 2025-11-14 | 13F | Horizon Investments, LLC | 0 | -100,00 | 0 | -100,00 | ||||
| 2025-11-07 | 13F | Addison Advisors LLC | 0 | -100,00 | 0 | |||||
| 2026-01-21 | 13F | Westfuller Advisors, LLC | 1.165 | -1,10 | 75 | 8,70 | ||||
| 2026-02-12 | 13F | Mint Tower Capital Management B.V. | 2.422 | 0 | ||||||
| 2025-09-26 | NP | ISCV - iShares Morningstar Small-Cap Value ETF | 11.148 | -0,58 | 599 | -8,28 | ||||
| 2026-01-21 | 13F | Sowell Financial Services LLC | 3.495 | -1,10 | 226 | 8,70 | ||||
| 2026-01-27 | 13F | Hennessy Advisors Inc | 14.798 | 0,00 | 955 | 10,15 | ||||
| 2025-10-31 | 13F | Mitsubishi UFJ Trust & Banking Corp | 0 | -100,00 | 0 | |||||
| 2026-02-04 | 13F | Pacer Advisors, Inc. | 0 | -100,00 | 0 | -100,00 | ||||
| 2026-02-06 | 13F | Global Retirement Partners, LLC | 3.451 | 108,52 | 223 | 131,25 | ||||
| 2026-02-17 | 13F | Css Llc/il | 23.600 | 1.523 | ||||||
| 2025-10-10 | 13F | USA Financial Portformulas Corp | 0 | -100,00 | 0 | |||||
| 2026-01-26 | 13F | Cwm, Llc | 30.459 | 16,59 | 2 | 0,00 | ||||
| 2026-01-16 | 13F | Crewe Advisors LLC | 5.855 | 1,02 | 378 | 11,21 | ||||
| 2026-02-10 | 13F | Quantbot Technologies LP | 0 | -100,00 | 0 | |||||
| 2026-02-13 | 13F | Diametric Capital, LP | 21.722 | 8,61 | 1.402 | 19,54 | ||||
| 2025-09-26 | NP | SUNAMERICA SERIES TRUST - SA T. Rowe Price Asset Allocation Growth Portfolio Class 1 | 1.606 | 0,00 | 86 | -7,53 | ||||
| 2026-01-27 | 13F | Meritage Portfolio Management | 85.370 | -2,59 | 5.510 | 7,26 | ||||
| 2026-02-13 | 13F | Marshall Wace, Llp | 0 | -100,00 | 0 | -100,00 | ||||
| 2026-02-12 | 13F | Brinker Capital Investments, LLC | 30.213 | -8,28 | 1.950 | 0,98 | ||||
| 2026-01-26 | 13F | Merit Financial Group, LLC | 5.720 | 369 | ||||||
| 2026-02-06 | 13F | Pnc Financial Services Group, Inc. | 25.115 | -4,61 | 1.621 | 4,99 | ||||
| 2026-02-13 | 13F | SRS Capital Advisors, Inc. | 51 | -99,79 | 3 | -99,79 | ||||
| 2025-09-26 | NP | UMPIX - Ultramid-cap Profund Investor Class | 514 | 5,54 | 28 | -3,57 | ||||
| 2026-01-15 | 13F | Spirit Of America Management Corp/ny | 8.700 | 0,00 | 561 | 10,22 | ||||
| 2026-02-10 | 13F | Savant Capital, LLC | 0 | -100,00 | 0 | |||||
| 2026-02-13 | 13F | Charles Schwab Investment Management Inc | 807.138 | -3,77 | 52.093 | 5,96 | ||||
| 2026-02-12 | 13F | BlackRock, Inc. | 8.613.648 | 2,21 | 555.925 | 12,55 | ||||
| 2026-02-13 | 13F | Bridgewater Associates, LP | 123.781 | -53,14 | 7.989 | -48,40 | ||||
| 2026-01-20 | 13F | Steel Peak Wealth Management LLC | 3.210 | 207 | ||||||
| 2026-02-11 | 13F | Deutsche Bank Ag\ | 210.218 | 102,99 | 13.567 | 123,55 | ||||
| 2026-02-18 | 13F | Caitlin John, LLC | 4.197 | 271 | ||||||
| 2026-02-12 | 13F | Brown Brothers Harriman & Co | 150 | 10 | ||||||
| 2026-01-29 | 13F | Comerica Bank | 76.365 | 21,99 | 4.929 | 34,35 | ||||
| 2026-01-30 | 13F | Torren Management, LLC | 936 | 60 | ||||||
| 2026-01-29 | 13F | UBS Group AG | 707.822 | 479,93 | 45.683 | 538,64 | ||||
| 2026-02-12 | 13F | CIBC Private Wealth Group, LLC | 4.932 | 0,92 | 318 | 11,19 | ||||
| 2026-01-23 | 13F | State of Alaska, Department of Revenue | 7.972 | -5,68 | 1 | |||||
| 2026-02-11 | 13F | Manchester Capital Management LLC | 4 | 0 | ||||||
| 2026-02-10 | 13F | Root Financial Partners, LLC | 122 | 19,61 | 8 | 40,00 | ||||
| 2026-02-13 | 13F | Smartleaf Asset Management LLC | 279 | 72,22 | 18 | 100,00 | ||||
| 2026-02-09 | 13F | Hantz Financial Services, Inc. | 1.145 | 42,59 | 0 | |||||
| 2026-02-17 | 13F | Two Sigma Securities, Llc | 7.510 | 7,95 | 485 | 18,92 | ||||
| 2026-02-12 | 13F | Steward Partners Investment Advisory, Llc | 625 | 0,81 | 40 | 11,11 | ||||
| 2026-02-02 | 13F | VELA Investment Management, LLC | 4.233 | 0,00 | 273 | 10,08 | ||||
| 2025-10-24 | 13F | Avion Wealth | 0 | -100,00 | 0 | |||||
| 2026-02-13 | 13F | American Century Companies Inc | 2.039.629 | -31,30 | 131.638 | -24,35 | ||||
| 2025-11-14 | 13F | ISAM Funds (UK) Ltd | 0 | -100,00 | 0 | |||||
| 2026-02-17 | 13F | First Manhattan Co | 85.765 | -0,79 | 5.535 | 9,26 | ||||
| 2025-09-26 | NP | BKSE - BNY Mellon US Small Cap Core Equity ETF | 2.002 | -39,93 | 108 | -44,85 | ||||
| 2026-02-13 | 13F | Parkside Financial Bank & Trust | 294 | 0,00 | 19 | 5,88 |
Other Listings
| DE:NWZA | 55,50 € |