Grundlæggende statistik
| Institutionelle aktier (lange) | 70.484.535 - 78,69% (ex 13D/G) - change of -12,83MM shares -15,40% MRQ |
| Institutionel værdi (lang) | $ 5.394.289 USD ($1000) |
Institutionelt ejerskab og aktionærer
MakeMyTrip Limited (US:MMYT) har 260 institutionelle ejere og aktionærer, der har indsendt 13D/G- eller 13F-formularer til Securities Exchange Commission (SEC). Disse institutioner har i alt 70,484,535 aktier. Største aktionærer omfatter Schroder Investment Management Group, Baillie Gifford & Co, Jpmorgan Chase & Co, Morgan Stanley, Fmr Llc, Price T Rowe Associates Inc /md/, Wasatch Advisors Inc, Artisan Partners Limited Partnership, Wellington Management Group Llp, and Royal Bank Of Canada .
MakeMyTrip Limited (NasdaqGS:MMYT) institutionel ejerskabsstruktur viser aktuelle positioner i virksomheden efter institutioner og fonde, samt seneste ændringer i positionsstørrelse. Større aktionærer kan omfatte individuelle investorer, investeringsforeninger, hedgefonde eller institutioner. Skema 13D angiver, at investoren besidder (eller besidder) mere end 5 % af virksomheden og har til hensigt (eller har til hensigt at) aktivt at forfølge en ændring i forretningsstrategi. Skema 13G indikerer en passiv investering på over 5%.
The share price as of April 24, 2026 is 46,02 / share. Previously, on April 28, 2025, the share price was 104,60 / share. This represents a decline of 56,00% over that period.

Fondens stemningsscore
Fund Sentiment Score (fka Ownership Accumulation Score) finder de aktier, der bliver mest købt af fonde. Det er resultatet af en sofistikeret, multi-faktor kvantitativ model, der identificerer virksomheder med de højeste niveauer af institutionel akkumulering. Scoringsmodellen bruger en kombination af den samlede stigning i oplyste ejere, ændringerne i porteføljeallokeringer i disse ejere og andre målinger. Tallet går fra 0 til 100, hvor højere tal indikerer et højere niveau af akkumulering for sine jævnaldrende, og 50 er gennemsnittet.
Opdateringsfrekvens: Dagligt
Se Ownership Explorer, som giver en liste over højest rangerende virksomheder.
AI+ Ask Fintel’s AI assistant about MakeMyTrip Limited.
Select a question to share a public post with an AI-crafted answer.
Thinking of good questions…
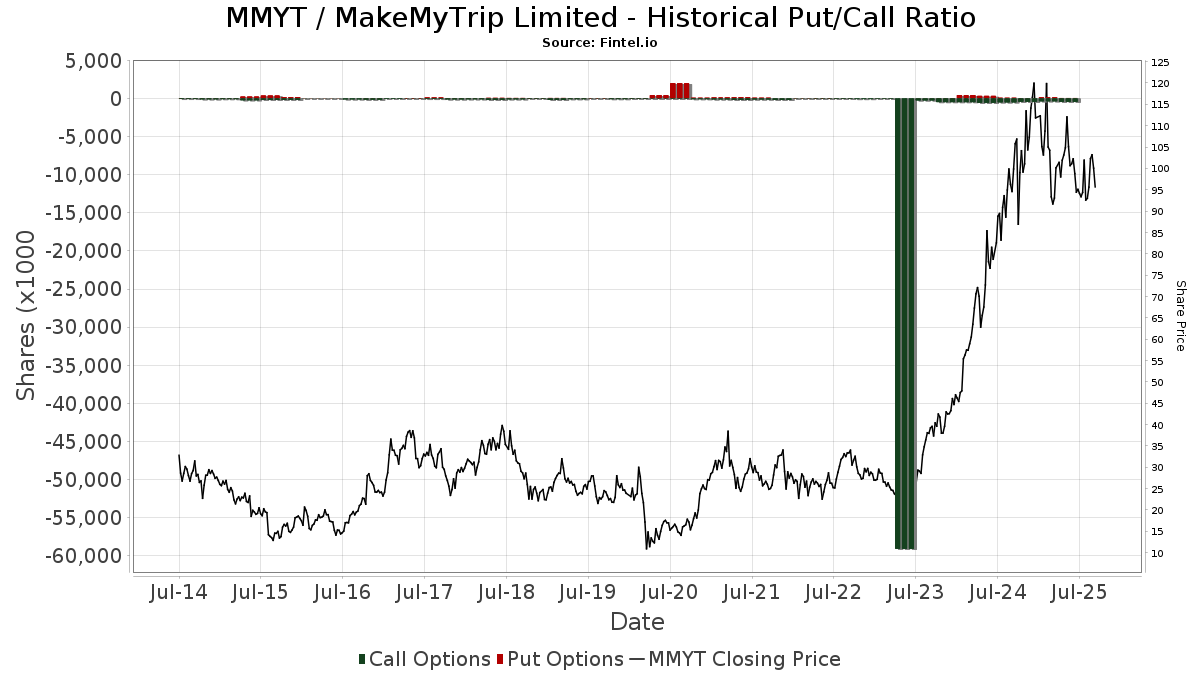
Institutionel Put/Call-forhold
Ud over at indberette standardaktie- og gældsudstedelser skal institutter med mere end 100 mill. aktiver under forvaltning også oplyse deres put- og call-optionsbeholdninger. Da salgsoptioner generelt indikerer negativ stemning, og købsoptioner indikerer positiv stemning, kan vi få en fornemmelse af den overordnede institutionelle stemning ved at plotte forholdet mellem put og kald. Diagrammet til højre viser det historiske put/call-forhold for dette instrument.
Brug af Put/Call Ratio som en indikator for investorernes stemning overvinder en af de vigtigste mangler ved at bruge totalt institutionelt ejerskab, som er, at en betydelig mængde af aktiver under forvaltning investeres passivt for at spore indekser. Passivt forvaltede fonde køber typisk ikke optioner, så indikatoren for put/call-forholdet følger mere nøje følelsen af aktivt forvaltede fonde.
13D/G-arkivering
Vi præsenterer 13D/G ansøgninger separat fra 13F ansøgninger på grund af den forskellige behandling af SEC. 13D/G-ansøgninger kan indgives af grupper af investorer (med én ledende), hvorimod 13F-ansøgninger ikke kan. Dette resulterer i situationer, hvor en investor kan indsende en 13D/G, der rapporterer én værdi for de samlede aktier (der repræsenterer alle de aktier, der ejes af investorgruppen), men derefter indsender en 13F, der rapporterer en anden værdi for de samlede aktier (der udelukkende repræsenterer deres egne) ejendomsret). Det betyder, at aktieejerskab af 13D/G-arkiver og 13F-arkiveringer ofte ikke er direkte sammenlignelige, så vi præsenterer dem separat.
Bemærk: Fra den 16. maj 2021 viser vi ikke længere ejere, der ikke har indsendt en 13D/G inden for det seneste år. Tidligere viste vi den fulde historie af 13D/G-arkiver. Generelt skal enheder, der er forpligtet til at indgive 13D/G-ansøgninger, indgive mindst årligt, før de indsender en afsluttende ansøgning. Dog forlader fonde nogle gange positioner uden at indsende en afsluttende ansøgning (dvs. de afvikler), så visning af den fulde historie resulterede nogle gange i forvirring om det nuværende ejerskab. For at undgå forvirring viser vi nu kun 'aktuelle' ejere - det vil sige - ejere, der har anmeldt inden for det seneste år.
Upgrade to unlock premium data.
| Fil dato | Form | Investor | Forrige Aktier |
Seneste Aktier |
Δ Aktier (Procent) |
Ejendomsret (Procent) |
Δ Ejerskab (Procent) |
|
|---|---|---|---|---|---|---|---|---|
| 2026-04-23 | GIC Private Ltd | 8,989,889 | 4,374,175 | -51.34 | 4.87 | -51.35 | ||
| 2026-03-04 | BAILLIE GIFFORD & CO | 3,949,281 | 14,610,726 | 269.96 | 16.30 | 191.07 | ||
| 2026-02-13 | SCHRODER INVESTMENT MANAGEMENT GROUP | 6,417,766 | 7,450,623 | 16.09 | 8.30 | 16.90 | ||
| 2026-02-06 | Travogue Electronic Travel LLP | 3,678,248 | 3,699,950 | 0.59 | 4.00 | -21.57 | ||
| 2025-11-07 | FMR LLC | 9,011,895 | 4,476,529 | -50.33 | 5.00 | -50.00 | ||
| 2025-06-24 | Trip.com Group Ltd | 19,743,700 | 16,069,384 | -18.61 | 16.90 | -15.46 | ||
| 2025-05-12 | FIL Ltd | 4,429,360 | 1,364,622 | -69.19 | 1.90 | -69.92 |
13F og NPORT arkivering
Detaljer om 13F-arkivering er gratis. Detaljer om NP-ansøgninger kræver et premium-medlemskab. Grønne rækker angiver nye positioner. Røde rækker angiver lukkede positioner. Klik på linket ikon for at se den fulde transaktionshistorik.
Opgrader
for at låse premium-data op og eksportere til Excel ![]() .
.
| Fil dato | Kilde | Investor | Type | Gennemsnitlig pris (Øst) |
Aktier | Δ Aktier (%) |
Rapporteret Værdi ($1000) |
Δ Værdi (%) |
Port Alloc (%) |
|
|---|---|---|---|---|---|---|---|---|---|---|
| 2026-02-17 | 13F | D. E. Shaw & Co., Inc. | 0 | -100,00 | 0 | |||||
| 2026-04-20 | 13F | Amiral Gestion | 0 | -100,00 | 0 | |||||
| 2026-02-09 | 13F | Fisher Asset Management, LLC | 46.325 | -37,83 | 3.804 | -45,45 | ||||
| 2026-02-13 | 13F | Causeway Capital Management Llc | 68.159 | -17,20 | 5.597 | -27,36 | ||||
| 2026-02-17 | 13F | EFG International AG | 11.761 | 966 | ||||||
| 2026-04-02 | 13F | Ares Financial Consulting, LLC | 8 | 0,00 | 0 | |||||
| 2025-10-29 | 13F | Triasima Portfolio Management inc. | 0 | -100,00 | 0 | |||||
| 2026-02-13 | 13F | Dymon Asia Capital (singapore) Pte. Ltd. | 0 | -100,00 | 0 | |||||
| 2026-04-22 | 13F | Stone House Investment Management, LLC | 0 | -100,00 | 0 | |||||
| 2025-11-14 | 13F | Virtu Financial LLC | 0 | -100,00 | 0 | -100,00 | ||||
| 2026-02-05 | 13F | Bessemer Group Inc | 106.410 | 81,34 | 9 | 60,00 | ||||
| 2025-11-14 | 13F | Centiva Capital, LP | 0 | -100,00 | 0 | |||||
| 2025-11-17 | 13F | Oberweis Asset Management Inc/ | 0 | -100,00 | 0 | -100,00 | ||||
| 2026-01-23 | 13F | Assetmark, Inc | 79 | 0,00 | 6 | -14,29 | ||||
| 2026-02-13 | 13F | State Street Corp | 100.898 | 4,66 | 8.286 | -8,18 | ||||
| 2026-02-17 | 13F | Jones Financial Companies Lllp | 71 | -92,15 | 6 | -94,12 | ||||
| 2025-11-14 | 13F | Wolverine Trading, Llc | Call | 8.200 | -41,01 | 771 | -44,41 | |||
| 2025-11-14 | 13F | Wolverine Trading, Llc | Put | 3.300 | -59,76 | 310 | -62,10 | |||
| 2026-02-04 | 13F | LRI Investments, LLC | 1.719 | -38,87 | 141 | -46,39 | ||||
| 2026-02-17 | 13F | Quantessence Capital LLC | 0 | -100,00 | 0 | |||||
| 2026-04-06 | 13F | GAMMA Investing LLC | 0 | -100,00 | 0 | |||||
| 2026-02-13 | 13F | Caitong International Asset Management Co., Ltd | 206 | -9,25 | 17 | -23,81 | ||||
| 2026-02-17 | 13F | Fmr Llc | 2.721.761 | -68,44 | 223.511 | -72,31 | ||||
| 2026-02-12 | 13F | Principal Securities, Inc. | 0 | -100,00 | 0 | |||||
| 2026-02-13 | 13F | Squarepoint Ops LLC | 18.160 | -1,90 | 1.491 | -13,91 | ||||
| 2026-02-13 | 13F | Oxbow Capital Management (HK) Ltd | 0 | -100,00 | 0 | |||||
| 2026-02-12 | 13F | Dalton Investments LLC | 248.883 | 0,00 | 20.438 | -12,26 | ||||
| 2026-01-23 | 13F | Westside Investment Management, Inc. | 19 | 2 | ||||||
| 2026-01-29 | 13F | UBS Group AG | 1.105.383 | 93,73 | 90.774 | 69,97 | ||||
| 2025-11-13 | 13F/A | Ninety One North America, Inc. | 0 | -100,00 | 0 | |||||
| 2026-02-03 | 13F | Ballentine Partners, LLC | 0 | -100,00 | 0 | |||||
| 2026-02-11 | 13F | Group One Trading, L.p. | Put | 400 | 100,00 | 33 | 77,78 | |||
| 2025-11-14 | 13F | Skopos Labs, Inc. | 0 | -100,00 | 0 | |||||
| 2026-02-11 | 13F | Group One Trading, L.p. | 991 | 81 | ||||||
| 2026-02-11 | 13F | Group One Trading, L.p. | Call | 11.300 | -58,76 | 928 | -63,85 | |||
| 2026-02-10 | 13F | Nomura Asset Management Co Ltd | 381.470 | 24,02 | 31.326 | 8,81 | ||||
| 2026-02-13 | 13F | Keystone Investors Pte Ltd | 77.600 | 6.373 | ||||||
| 2025-11-14 | 13F | Point72 Asia (Singapore) Pte. Ltd. | 5.977 | -40,56 | 559 | -43,25 | ||||
| 2026-04-13 | 13F | Loring Wolcott & Coolidge Fiduciary Advisors Llp/ma | 3.075 | -17,23 | 126 | -46,35 | ||||
| 2026-02-12 | 13F | Comgest Global Investors S.a.s. | 484.093 | 3,40 | 39.754 | -9,29 | ||||
| 2026-02-13 | 13F | Stifel Financial Corp | 4.427 | -13,70 | 364 | -24,37 | ||||
| 2026-02-06 | 13F | Handelsbanken Fonder AB | 44.754 | -1,47 | 4 | -25,00 | ||||
| 2026-02-11 | 13F | Invst, LLC | 10.112 | -0,08 | 830 | -12,35 | ||||
| 2026-02-13 | 13F | Barclays Plc | 100 | -93,83 | 8 | -94,70 | ||||
| 2026-02-17 | 13F | Bank Of America Corp /de/ | 450.645 | -28,54 | 37.007 | -37,30 | ||||
| 2026-04-16 | 13F | SG Americas Securities, LLC | 12.731 | 31,04 | 0 | |||||
| 2026-02-10 | 13F | Sustainable Growth Advisers, LP | 90.984 | 51,25 | 7.472 | 32,70 | ||||
| 2026-02-13 | 13F | Mariner, LLC | 0 | -100,00 | 0 | |||||
| 2026-04-24 | 13F | TT International Asset Management LTD | 78.580 | 2.930 | ||||||
| 2026-01-30 | 13F | Us Bancorp \de\ | 1.254 | -5,00 | 103 | -17,07 | ||||
| 2026-02-11 | 13F | OPTIMAS CAPITAL Ltd | 0 | -100,00 | 0 | |||||
| 2026-01-28 | 13F | WPG Advisers, LLC | 117 | -61,39 | 10 | -67,86 | ||||
| 2026-02-13 | 13F | Itau Unibanco Holding S.A. | 0 | -100,00 | 0 | |||||
| 2026-02-17 | 13F | Aperture Investors, LLC | 0 | -100,00 | 0 | |||||
| 2026-02-11 | 13F | Janney Montgomery Scott LLC | 0 | -100,00 | 0 | |||||
| 2026-02-17 | 13F | Lighthouse Investment Partners, LLC | 3.870 | 318 | ||||||
| 2026-01-20 | 13F | AdvisorNet Financial, Inc | 0 | -100,00 | 0 | |||||
| 2026-02-11 | 13F | Axiom International Investors Llc /de | 143.284 | -54,53 | 11.766 | -60,11 | ||||
| 2025-11-21 | 13F | Nebula Research & Development LLC | 0 | -100,00 | 0 | -100,00 | ||||
| 2026-01-21 | 13F | Steadtrust LLC | 0 | -100,00 | 0 | -100,00 | ||||
| 2026-02-13 | 13F | Smartleaf Asset Management LLC | 22 | 2 | ||||||
| 2025-11-12 | 13F | APG Asset Management N.V. | 0 | -100,00 | 0 | -100,00 | ||||
| 2026-02-12 | 13F | California Public Employees Retirement System | 97.355 | -15,30 | 7.995 | -25,69 | ||||
| 2026-02-10 | 13F | Td Asset Management Inc | 26.236 | 500,92 | 2.154 | 427,94 | ||||
| 2026-01-30 | 13F | Mitsubishi UFJ Trust & Banking Corp | 460.293 | -9,74 | 37.811 | -20,78 | ||||
| 2026-02-17 | 13F | Totem Point Management, LLC | 0 | -100,00 | 0 | |||||
| 2026-04-13 | 13F | Massmutual Trust Co Fsb/adv | 102 | -4,67 | 4 | -62,50 | ||||
| 2026-02-17 | 13F | FACT Capital, LP | 0 | -100,00 | 0 | |||||
| 2026-02-13 | 13F | Aigen Investment Management, Lp | 0 | -100,00 | 0 | |||||
| 2026-02-06 | 13F | Pnc Financial Services Group, Inc. | 248 | -58,32 | 20 | -63,64 | ||||
| 2026-04-24 | 13F | UMA Financial Services, Inc. | 26 | 18,18 | 1 | -100,00 | ||||
| 2025-11-10 | 13F | D'Orazio & Associates, Inc. | 0 | -100,00 | 0 | |||||
| 2026-02-17 | 13F | Tiger Pacific Capital LP | 497.923 | 40.889 | ||||||
| 2026-02-06 | 13F | Steadview Capital Management LLC | 123.045 | -36,57 | 10.104 | -44,35 | ||||
| 2025-11-13 | 13F | NINE MASTS CAPITAL Ltd | 0 | -100,00 | 0 | |||||
| 2026-02-13 | 13F | Citigroup Inc | 16.212 | -76,82 | 1.331 | -79,67 | ||||
| 2025-11-13 | 13F | Lord, Abbett & Co. Llc | 0 | -100,00 | 0 | |||||
| 2026-02-17 | 13F | PDT Partners, LLC | 22.285 | -37,08 | 1.830 | -44,80 | ||||
| 2026-02-17 | 13F | Polar Capital Holdings Plc | 519.857 | 42,89 | 42.691 | 25,36 | ||||
| 2026-01-28 | 13F | DekaBank Deutsche Girozentrale | 4.000 | 0,00 | 0 | |||||
| 2025-11-18 | 13F | Dorsey Wright & Associates | 0 | -100,00 | 0 | |||||
| 2026-04-24 | 13F | Deltec Asset Management Llc | 0 | -100,00 | 0 | |||||
| 2026-02-17 | 13F | Prelude Capital Management, Llc | 0 | -100,00 | 0 | |||||
| 2026-02-10 | 13F | Seven Grand Managers, Llc | 0 | -100,00 | 0 | |||||
| 2026-02-17 | 13F | Wellington Management Group Llp | 2.297.858 | 226,32 | 188.700 | 186,30 | ||||
| 2026-02-17 | 13F | Two Sigma Investments, Lp | 4.667 | -96,83 | 383 | -97,22 | ||||
| 2026-02-13 | 13F | Verition Fund Management LLC | 38.092 | 29,77 | 3.128 | 13,87 | ||||
| 2026-02-18 | 13F | Beacon Pointe Advisors, LLC | 7.767 | 0,44 | 638 | -11,89 | ||||
| 2026-01-29 | 13F | Coronation Fund Managers Ltd. | 1.251.279 | 44,63 | 102.755 | 26,89 | ||||
| 2026-04-21 | 13F | Pinnacle Associates Ltd | 0 | -100,00 | 0 | |||||
| 2026-02-13 | 13F | BNP Paribas Asset Management Holding S.A. | 260.539 | 367,81 | 21 | 320,00 | ||||
| 2026-04-15 | 13F | Cranbrook Wealth Management, LLC | 28 | 0,00 | 1 | -50,00 | ||||
| 2025-11-14 | 13F | Prudential Plc | 0 | -100,00 | 0 | -100,00 | ||||
| 2026-02-19 | 13F | Invesco Ltd. | 17.278 | -83,51 | 1.419 | -85,55 | ||||
| 2026-02-06 | 13F | Greenwoods Asset Management Hong Kong Ltd. | 256.900 | 0,00 | 21.097 | -12,26 | ||||
| 2026-02-17 | 13F | Edmond De Rothschild Holding S.a. | 23.475 | 27,06 | 1.928 | 11,45 | ||||
| 2026-02-13 | 13F | JustInvest LLC | 11.595 | 21,15 | 952 | 6,37 | ||||
| 2026-04-21 | 13F | Robeco Institutional Asset Management B.V. | 28.239 | 16,22 | 1.053 | -47,22 | ||||
| 2026-02-13 | 13F | Mml Investors Services, Llc | 2.573 | -58,36 | 211 | -63,49 | ||||
| 2026-02-17 | 13F | Lazard Asset Management Llc | 228.977 | -6,45 | 18.804 | -17,93 | ||||
| 2026-02-12 | 13F | Bank Of Montreal /can/ | 1.087 | 21,86 | 89 | 25,35 | ||||
| 2026-02-12 | 13F | Federation des caisses Desjardins du Quebec | 3.306 | 33,85 | 271 | 17,32 | ||||
| 2026-01-22 | 13F | Massachusetts Financial Services Co /ma/ | 1.563.877 | 111,98 | 128.426 | 85,99 | ||||
| 2026-04-01 | 13F | Bangor Savings Bank | 0 | -100,00 | 0 | |||||
| 2026-01-15 | 13F | J. Safra Sarasin Holding AG | 6.739 | 0,00 | 553 | -12,22 | ||||
| 2026-01-28 | 13F | Paradice Investment Management LLC | 0 | -100,00 | 0 | |||||
| 2026-02-17 | 13F | Engineers Gate Manager LP | 4.243 | -71,74 | 348 | -75,23 | ||||
| 2026-02-12 | 13F | Jane Street Group, Llc | 43.630 | -60,44 | 3.583 | -65,30 | ||||
| 2026-02-10 | 13F | Norges Bank | 1.099.415 | 90.284 | ||||||
| 2026-02-11 | 13F | Deutsche Bank Ag\ | 66.030 | 34,85 | 5.422 | 18,31 | ||||
| 2026-02-12 | 13F | Jane Street Group, Llc | Put | 111.200 | 2.317,39 | 9.132 | 2.023,49 | |||
| 2026-02-12 | 13F | Jane Street Group, Llc | Call | 19.300 | -62,30 | 1.585 | -66,94 | |||
| 2026-02-04 | 13F | C WorldWide Group Holding A/S | 116.215 | -15,13 | 10 | -25,00 | ||||
| 2026-01-28 | 13F | HB Wealth Management, LLC | 0 | -100,00 | 0 | |||||
| 2026-02-10 | 13F | Envestnet Asset Management Inc | 14.728 | -51,62 | 1.209 | -57,56 | ||||
| 2026-02-12 | 13F | Penserra Capital Management LLC | 12.806 | 64,79 | 1 | |||||
| 2026-04-15 | 13F | Bayforest Capital Ltd | 1.098 | 41 | ||||||
| 2026-02-17 | 13F | Russell Investments Group, Ltd. | 239.654 | -3,55 | 19.680 | -15,38 | ||||
| 2026-02-09 | 13F | Coldstream Capital Management Inc | 2.476 | 0,53 | 203 | -11,74 | ||||
| 2026-02-12 | 13F | BlackRock, Inc. | 804.114 | 368,86 | 66.034 | 311,37 | ||||
| 2025-11-14 | 13F | Virtus ETF Advisers LLC | 0 | -100,00 | 0 | -100,00 | ||||
| 2026-02-10 | 13F | State of Wyoming | 2.787 | -14,43 | 229 | -25,00 | ||||
| 2026-02-17 | 13F | Driehaus Capital Management Llc | 0 | -100,00 | 0 | |||||
| 2026-02-17 | 13F | Elequin Capital Lp | 186 | 15 | ||||||
| 2026-02-17 | 13F | Advisory Services Network, LLC | 0 | -100,00 | 0 | |||||
| 2026-04-16 | 13F | Stanley-Laman Group, Ltd. | 0 | -100,00 | 0 | |||||
| 2025-11-06 | 13F | Whipplewood Advisors, LLC | 0 | -100,00 | 0 | -100,00 | ||||
| 2025-11-14 | 13F | Trexquant Investment LP | 0 | -100,00 | 0 | |||||
| 2026-01-26 | 13F | Cwm, Llc | 32 | 0,00 | 0 | |||||
| 2026-02-05 | 13F | Northwestern Mutual Wealth Management Co | 4.000 | 18.947,62 | 89 | 8.700,00 | ||||
| 2026-03-03 | 13F/A | Ovata Capital Management Ltd | 8.400 | 2.373 | ||||||
| 2026-01-29 | 13F | Matthews International Capital Management Llc | 126.471 | -29,79 | 10.386 | -38,40 | ||||
| 2025-11-14 | 13F | Peak6 Llc | Put | 0 | -100,00 | 0 | -100,00 | |||
| 2026-02-17 | 13F | Ghisallo Capital Management LLC | 250.000 | -25,01 | 20.530 | -34,21 | ||||
| 2026-02-06 | 13F | Carrhae Capital LLP | 750.942 | 98,61 | 61.667 | 74,25 | ||||
| 2026-01-29 | 13F | Sanctuary Advisors, LLC | 0 | -100,00 | 0 | -100,00 | ||||
| 2026-02-11 | 13F | Simplex Trading, Llc | Call | 0 | -100,00 | 0 | ||||
| 2026-02-11 | 13F | Simplex Trading, Llc | Put | 0 | -100,00 | 0 | ||||
| 2026-02-13 | 13F | Soros Fund Management Llc | 0 | -100,00 | 0 | -100,00 | ||||
| 2026-01-30 | 13F | Catalytic Wealth RIA, LLC | 4.523 | 20,97 | 371 | 6,30 | ||||
| 2026-02-06 | 13F | Leonteq Securities AG | 350 | 29 | ||||||
| 2026-02-17 | 13F | Burkehill Global Management, LP | 0 | -100,00 | 0 | |||||
| 2026-02-11 | 13F | Capital International Investors | 1.555.556 | -9,44 | 127.742 | -20,55 | ||||
| 2026-02-17 | 13F | Schonfeld Strategic Advisors LLC | 0 | -100,00 | 0 | |||||
| 2026-02-17 | 13F | DZ BANK AG Deutsche Zentral Genossenschafts Bank, Frankfurt am Main | 150.122 | -20,44 | 12.328 | -30,19 | ||||
| 2026-04-16 | 13F | Baron Wealth Management LLC | 0 | -100,00 | 0 | |||||
| 2026-02-13 | 13F | Carmignac Gestion | 21.993 | 1.806 | ||||||
| 2026-02-17 | 13F | Price T Rowe Associates Inc /md/ | 2.448.388 | 17,86 | 201 | 3,61 | ||||
| 2026-02-10 | 13F | Exit Wealth Advisors, LLC. | 0 | -100,00 | 0 | |||||
| 2026-02-13 | 13F | Blueshift Asset Management, LLC | 0 | -100,00 | 0 | |||||
| 2026-01-21 | 13F | Flagship Harbor Advisors, Llc | 8 | 1 | ||||||
| 2026-02-06 | 13F | Larson Financial Group LLC | 43 | 4 | ||||||
| 2026-04-07 | 13F | Farther Finance Advisors, LLC | 1.492 | 15,48 | 57 | -47,17 | ||||
| 2026-02-09 | 13F | Legal & General Group Plc | 90.539 | 14,09 | 7.435 | 0,09 | ||||
| 2026-02-12 | 13F | Haven Private, LLC | 10.681 | 6,16 | 877 | -6,80 | ||||
| 2026-02-12 | 13F | Brown Brothers Harriman & Co | 0 | -100,00 | 0 | |||||
| 2025-11-06 | 13F | Blume Capital Management, Inc. | 0 | -100,00 | 0 | |||||
| 2026-04-14 | 13F | Banque Pictet & Cie Sa | 28.612 | 8,62 | 1.067 | -50,72 | ||||
| 2026-01-30 | 13F | Pekin Hardy Strauss, Inc. | 2.500 | 205 | ||||||
| 2026-02-09 | 13F | William Blair Investment Management, Llc | 49.652 | -93,62 | 4.077 | -94,41 | ||||
| 2026-02-10 | 13F | Westpac Banking Corp | 1.669 | 137 | ||||||
| 2026-02-17 | 13F | Canada Pension Plan Investment Board | 273.590 | 26,08 | 22.467 | 10,61 | ||||
| 2025-11-04 | 13F | IMC-Chicago, LLC | Put | 0 | -100,00 | 0 | -100,00 | |||
| 2026-02-17 | 13F | Raymond James Financial Inc | 3.836 | -14,51 | 315 | -24,82 | ||||
| 2026-02-13 | 13F | Manufacturers Life Insurance Company, The | 0 | -100,00 | 0 | |||||
| 2026-02-11 | 13F | LPL Financial LLC | 4.368 | -68,42 | 359 | -72,33 | ||||
| 2025-11-14 | 13F | Binnacle Investments Inc | 173 | 11,61 | 16 | 6,67 | ||||
| 2026-04-21 | 13F | Maseco Llp | 0 | -100,00 | 0 | |||||
| 2026-02-12 | 13F | Polen Capital Management Llc | 0 | -100,00 | 0 | |||||
| 2026-02-13 | 13F | MayTech Global Investments, LLC | 306.113 | 1,34 | 25.138 | -11,08 | ||||
| 2025-11-05 | 13F | AdvisorShares Investments LLC | 0 | -100,00 | 0 | -100,00 | ||||
| 2026-04-20 | 13F | Banque Cantonale Vaudoise | 25.532 | -0,34 | 952 | -54,75 | ||||
| 2026-01-28 | 13F | U S Global Investors Inc | 50.870 | 30,83 | 4.177 | 14,78 | ||||
| 2026-02-10 | 13F | Triglav Skladi, D.o.o. | 15.099 | 160,33 | 1.240 | 128,60 | ||||
| 2025-11-13 | 13F | Riggs Asset Managment Co. Inc. | 0 | -100,00 | 0 | |||||
| 2026-02-02 | 13F | Kornitzer Capital Management Inc /ks | 80.000 | 23,08 | 6.570 | 7,97 | ||||
| 2026-02-10 | 13F | Goldman Sachs Group Inc | 1.935.142 | 11,51 | 158.914 | -2,17 | ||||
| 2026-02-17 | 13F | Balyasny Asset Management Llc | 371.088 | -5,15 | 30.474 | -16,78 | ||||
| 2025-11-13 | 13F | Quadrature Capital Ltd | 0 | -100,00 | 0 | |||||
| 2026-02-11 | 13F | Franklin Resources Inc | 1.599.763 | 14,45 | 131.373 | 0,42 | ||||
| 2026-02-17 | 13F/A | Northwest & Ethical Investments L.P. | 7.623 | 0,00 | 626 | -12,20 | ||||
| 2026-02-12 | 13F | Federated Hermes, Inc. | 222.239 | -40,75 | 18.250 | -48,02 | ||||
| 2026-02-17 | 13F | Susquehanna International Group, Llp | Call | 25.000 | -48,45 | 2.053 | -54,77 | |||
| 2025-11-13 | 13F | Magnetar Financial LLC | 0 | -100,00 | 0 | |||||
| 2026-02-06 | 13F | EverSource Wealth Advisors, LLC | 568 | -6,43 | 47 | -17,86 | ||||
| 2026-02-17 | 13F | Susquehanna International Group, Llp | 113.164 | 1.391,94 | 9.293 | 1.210,72 | ||||
| 2026-02-12 | 13F | Steward Partners Investment Advisory, Llc | 313 | 16,79 | 26 | 0,00 | ||||
| 2026-02-17 | 13F | Susquehanna International Group, Llp | Put | 78.400 | 111,89 | 6.438 | 85,91 | |||
| 2026-04-14 | 13F | SeaTown Holdings Pte. Ltd. | 0 | -100,00 | 0 | |||||
| 2026-02-11 | 13F | Capital Analysts, Inc. | 85 | 0,00 | 0 | |||||
| 2026-02-17 | 13F | Janus Henderson Group Plc | 95.165 | 95,92 | 7.816 | 71,89 | ||||
| 2026-02-17 | 13F | Two Sigma Advisers, Lp | 28.300 | -31,48 | 2.324 | -39,90 | ||||
| 2025-11-06 | 13F | Atria Investments Llc | 0 | -100,00 | 0 | |||||
| 2026-02-05 | 13F | Cambridge Investment Research Advisors, Inc. | 0 | -100,00 | 0 | |||||
| 2026-01-30 | 13F | Amansa Capital Pte. Ltd. | 1.499.580 | -6,29 | 123.146 | -17,79 | ||||
| 2026-01-29 | 13F | Sava Infond d.o.o. | 8.000 | -39,39 | 657 | -46,88 | ||||
| 2026-02-10 | 13F | Bnp Paribas Arbitrage, Sa | 160.245 | 96,12 | 13.159 | 72,08 | ||||
| 2026-02-05 | 13F | Qsemble Capital Management, LP | 4.537 | 8,62 | 373 | -4,62 | ||||
| 2026-02-12 | 13F | Aviva Plc | 135.182 | 1,46 | 11.101 | -10,98 | ||||
| 2026-02-17 | 13F | Ameriprise Financial Inc | 212.574 | -2,25 | 17.457 | -14,24 | ||||
| 2025-11-12 | 13F | Monashee Investment Management LLC | 0 | -100,00 | 0 | |||||
| 2026-02-17 | 13F | GeoWealth Management, LLC | 4.603 | 19,22 | 378 | 4,43 | ||||
| 2026-04-14 | 13F | Pictet & Cie (Europe) SA | 11.519 | -9,42 | 430 | -58,91 | ||||
| 2026-04-17 | 13F | IFC & Insurance Marketing, Inc. | 0 | -100,00 | 0 | |||||
| 2026-02-12 | 13F | Brinker Capital Investments, LLC | 13.015 | -22,44 | 1.069 | -31,97 | ||||
| 2026-02-17 | 13F | Creative Planning | 2.929 | -3,59 | 241 | -15,49 | ||||
| 2025-11-12 | 13F | Victory Capital Management Inc | 0 | -100,00 | 0 | |||||
| 2026-02-12 | 13F | Lansforsakringar Fondforvaltning AB (publ) | 0 | -100,00 | 0 | |||||
| 2026-03-12 | 13F/A | Peak6 Llc | Call | 42.600 | -2,29 | 3.498 | -14,26 | |||
| 2026-03-12 | 13F/A | Peak6 Llc | 635 | 52 | ||||||
| 2026-02-18 | 13F | Mackenzie Financial Corp | 40.299 | -65,41 | 3.306 | -69,68 | ||||
| 2025-11-14 | 13F | Point72 (DIFC) Ltd | 0 | -100,00 | 0 | |||||
| 2026-02-17 | 13F | ExodusPoint Capital Management, LP | 0 | -100,00 | 0 | -100,00 | ||||
| 2025-11-07 | 13F | CenterBook Partners LP | 0 | -100,00 | 0 | -100,00 | ||||
| 2026-01-28 | 13F | Financial Perspectives, Inc | 261 | 0,00 | 21 | -12,50 | ||||
| 2026-02-13 | 13F | BRITISH COLUMBIA INVESTMENT MANAGEMENT Corp | 187.000 | 15.356 | ||||||
| 2026-02-18 | 13F | Vident Advisory, LLC | 15.646 | -12,67 | 1.285 | -23,39 | ||||
| 2026-02-10 | 13F | Daiwa Securities Group Inc. | 0 | -100,00 | 0 | |||||
| 2026-02-17 | 13F | DV Trading LLC | 3 | 0 | ||||||
| 2026-01-29 | 13F | Vanguard Group Inc | 89.340 | 4,16 | 7.337 | -8,62 | ||||
| 2026-02-12 | 13F | Ci Investments Inc. | 0 | -100,00 | 0 | -100,00 | ||||
| 2026-02-17 | 13F | Fullerton Fund Management Co Ltd | 546.681 | -19,80 | 44.893 | -29,64 | ||||
| 2026-02-10 | 13F | Private Wealth Asset Management, LLC | 10 | 0,00 | 1 | |||||
| 2026-02-11 | 13F | Allianz Asset Management GmbH | 675.837 | 3,17 | 55.500 | -9,49 | ||||
| 2026-01-28 | 13F | CAPROCK Group, Inc. | 2.727 | -6,06 | 224 | -21,68 | ||||
| 2026-02-13 | 13F | National Bank Of Canada /fi/ | 6.333 | 9,78 | 520 | -3,71 | ||||
| 2026-02-13 | 13F | Walleye Trading LLC | Call | 6.500 | 54,76 | 534 | 35,62 | |||
| 2026-02-13 | 13F | Walleye Trading LLC | 2.578 | 292,39 | 212 | 245,90 | ||||
| 2026-02-13 | 13F | Walleye Trading LLC | Put | 14.200 | 330,30 | 1.166 | 278,57 | |||
| 2026-02-13 | 13F | Schroder Investment Management Group | 7.186.704 | 13,77 | 590.172 | -0,19 | ||||
| 2026-02-10 | 13F | Fideuram Asset Management (Ireland) dac | 3.395 | 299 | ||||||
| 2026-02-13 | 13F | Morgan Stanley | 2.970.342 | -13,11 | 243.925 | -23,77 | ||||
| 2025-11-14 | 13F | Point72 Hong Kong Ltd | 6.833 | 640 | ||||||
| 2026-02-13 | 13F | Neuberger Berman Group LLC | 59.344 | -71,27 | 4.874 | -74,80 | ||||
| 2025-11-12 | 13F | Simplex Trading, Llc | 0 | -100,00 | 0 | |||||
| 2026-02-10 | 13F | Eurizon SLJ Capital Ltd | 33.305 | 2.735 | ||||||
| 2026-02-17 | 13F | Voloridge Investment Management, Llc | 0 | -100,00 | 0 | |||||
| 2026-02-17 | 13F | Cetera Investment Advisers | 2.517 | -32,92 | 207 | -41,31 | ||||
| 2026-02-17 | 13F | Imprint Wealth LLC | 0 | -100,00 | 0 | |||||
| 2025-11-12 | 13F | NewSquare Capital LLC | 0 | -100,00 | 0 | |||||
| 2025-11-14 | 13F | Graham Capital Management, L.P. | 0 | -100,00 | 0 | |||||
| 2026-02-09 | 13F | Hantz Financial Services, Inc. | 8.660 | -17,85 | 1 | |||||
| 2026-02-12 | 13F | Quadrant Capital Group Llc | 20.325 | 106,68 | 1.669 | 81,41 | ||||
| 2025-11-14 | 13F | Ubs Asset Management Americas Inc | 0 | -100,00 | 0 | |||||
| 2026-04-24 | 13F | Sumitomo Mitsui DS Asset Management Company, Ltd | 18.502 | -16,94 | 690 | -62,33 | ||||
| 2026-02-17 | 13F | Quantitative Investment Management, LLC | 4.003 | 0 | ||||||
| 2026-02-17 | 13F | Man Group plc | 1.381.728 | 60,61 | 113.468 | 40,91 | ||||
| 2026-03-06 | 13F | Hsbc Holdings Plc | 55.000 | 4.512 | ||||||
| 2026-02-17 | 13F | Voleon Capital Management Lp | 0 | -100,00 | 0 | |||||
| 2026-02-13 | 13F | Thornburg Investment Management Inc | 159.711 | 13.115 | ||||||
| 2026-02-13 | 13F | Quarry LP | 0 | -100,00 | 0 | |||||
| 2026-02-06 | 13F | HighTower Advisors, LLC | 39.510 | -21,71 | 3.245 | -31,31 | ||||
| 2026-02-12 | 13F | Advisors Asset Management, Inc. | 422 | -1,86 | 35 | -15,00 | ||||
| 2026-04-24 | 13F | USS Investment Management Ltd | 196.375 | -17,92 | 7.332 | -62,70 | ||||
| 2026-02-09 | 13F | Huntington National Bank | 1 | 0,00 | 0 | |||||
| 2026-02-13 | 13F | Kestra Advisory Services, LLC | 555 | 46 | ||||||
| 2026-02-17 | 13F | Qube Research & Technologies Ltd | 0 | -100,00 | 0 | |||||
| 2026-02-11 | 13F | Inceptionr Llc | 4.997 | 410 | ||||||
| 2026-01-27 | 13F | Asset Management One Co., Ltd. | 50.534 | -59,99 | 4.166 | -64,75 | ||||
| 2025-11-07 | 13F | Sierra Ocean, Llc | 0 | -100,00 | 0 | |||||
| 2026-02-18 | 13F | GWM Advisors LLC | 2.898 | 0,00 | 238 | -12,55 | ||||
| 2026-01-30 | 13F/A | M&t Bank Corp | 16.685 | 1.370 | ||||||
| 2026-02-10 | 13F | Dumac, Inc. | 40.353 | 0,00 | 3.314 | -16,23 | ||||
| 2025-11-14 | 13F | Mirabella Financial Services Llp | 0 | -100,00 | 0 | |||||
| 2026-02-13 | 13F | Sei Investments Co | 555.594 | 2,49 | 45.625 | -10,08 | ||||
| 2025-10-30 | 13F | Gibbs Wealth Management | 0 | -100,00 | 0 | |||||
| 2026-02-13 | 13F | Y-Intercept (Hong Kong) Ltd | 0 | -100,00 | 0 | -100,00 | ||||
| 2026-02-12 | 13F | Renaissance Technologies Llc | 0 | -100,00 | 0 | |||||
| 2026-01-28 | 13F | Letson Investment Management, Inc. | 0 | -100,00 | 0 | |||||
| 2026-02-17 | 13F | Two Sigma Securities, Llc | 2.558 | -33,90 | 210 | -41,99 | ||||
| 2026-04-09 | 13F | Park Place Capital Corp | 0 | -100,00 | 0 | |||||
| 2026-02-03 | 13F | S-Bank Fund Management Ltd | 34.000 | 36,00 | 2.792 | 19,32 | ||||
| 2026-02-17 | 13F | Amundi | 549.544 | 34,82 | 45.129 | 16,44 | ||||
| 2026-02-13 | 13F | Marshall Wace, Llp | 4.204 | 345 | ||||||
| 2026-02-12 | 13F | CIBC Private Wealth Group, LLC | 123 | -17,45 | 10 | -23,08 | ||||
| 2026-04-20 | 13F | Arta Finance Wealth Management LLC | 12.613 | 70,79 | 470 | -22,44 | ||||
| 2026-02-13 | 13F | Parkside Financial Bank & Trust | 41 | 0,00 | 3 | 0,00 | ||||
| 2026-02-02 | 13F | Fifth Third Bancorp | 4 | 100,00 | 0 | |||||
| 2026-02-06 | 13F | Global Retirement Partners, LLC | 3.795 | 379.400,00 | 312 | |||||
| 2025-11-14 | 13F | Lombard Odier Asset Management (Switzerland) SA | 0 | -100,00 | 0 | |||||
| 2025-11-14 | 13F | Eqis Capital Management, Inc. | 0 | -100,00 | 0 | |||||
| 2026-02-17 | 13F | Tower Research Capital LLC (TRC) | 186 | -58,30 | 15 | -63,41 | ||||
| 2026-02-11 | 13F | O'shaughnessy Asset Management, Llc | 5.518 | -22,16 | 453 | -31,67 | ||||
| 2026-02-13 | 13F | Walleye Capital LLC | Put | 9.500 | 955,56 | 780 | 828,57 | |||
| 2026-02-13 | 13F | Walleye Capital LLC | Call | 6.000 | 361,54 | 493 | 306,61 | |||
| 2026-02-02 | 13F | Your Advocates Ltd., LLP | 6 | 0,00 | 0 | |||||
| 2026-02-17 | 13F | Jain Global LLC | 0 | -100,00 | 0 | |||||
| 2026-02-13 | 13F | Rhumbline Advisers | 2.884 | 45,36 | 237 | 27,57 | ||||
| 2026-02-13 | 13F | Banco Santander, S.A. | 4.259 | 350 | ||||||
| 2026-02-17 | 13F | Advisor Group Holdings, Inc. | 3.609 | -26,24 | 296 | -36,48 | ||||
| 2026-02-13 | 13F | American Century Companies Inc | 159.836 | -81,85 | 13.126 | -84,08 | ||||
| 2025-12-09 | 13F/A | Tudor Investment Corp Et Al | 0 | -100,00 | 0 | -100,00 | ||||
| 2026-02-03 | 13F | Privium Fund Management (UK) Ltd | 7.498 | 616 | ||||||
| 2026-01-29 | 13F | IMC-Chicago, LLC | Call | 0 | -100,00 | 0 | ||||
| 2026-04-07 | 13F | Signaturefd, Llc | 4.747 | 274,07 | 177 | 70,19 | ||||
| 2026-02-11 | 13F | Capital International Sarl | 42.409 | 11,89 | 3.483 | -1,83 | ||||
| 2026-01-30 | 13F | Jennison Associates Llc | 814.722 | -56,24 | 66.905 | -61,60 | ||||
| 2026-02-09 | 13F | Freemont Capital Pte Ltd | 0 | -100,00 | 0 | |||||
| 2026-04-10 | 13F | Quaker Wealth Management, LLC | 0 | -100,00 | 0 | |||||
| 2026-02-11 | 13F | Parallel Advisors, LLC | 542 | 35,50 | 45 | 18,92 | ||||
| 2026-02-03 | 13F | Navellier & Associates Inc | 3.106 | -37,47 | 255 | -45,04 | ||||
| 2025-11-07 | 13F | Gsa Capital Partners Llp | 0 | -100,00 | 0 | |||||
| 2026-02-13 | 13F | Resources Investment Advisors, LLC. | 0 | -100,00 | 0 | |||||
| 2026-02-11 | 13F | Capital Research Global Investors | 1.827.439 | 150.069 | ||||||
| 2026-02-12 | 13F | Ward Ferry Management (BVI) Ltd | 597.600 | 49 | ||||||
| 2026-02-10 | 13F | Natixis Advisors, L.p. | 0 | -100,00 | 0 | |||||
| 2026-02-11 | 13F | Capital World Investors | 1.311.189 | 0,34 | 107.675 | -11,96 | ||||
| 2026-02-03 | 13F | SBI Securities Co., Ltd. | 1.097 | 33,94 | 90 | 18,42 | ||||
| 2026-02-17 | 13F | Royal Bank Of Canada | 2.274.679 | 780,30 | 186.797 | 672,34 | ||||
| 2026-02-17 | 13F | XTX Topco Ltd | 0 | -100,00 | 0 | |||||
| 2026-02-17 | 13F | Artisan Partners Limited Partnership | 2.322.204 | 1,78 | 190.699 | -10,70 | ||||
| 2026-02-17 | 13F | Clough Capital Partners L P | 0 | -100,00 | 0 | |||||
| 2025-11-14 | 13F | Axa S.a. | 0 | -100,00 | 0 | -100,00 | ||||
| 2025-10-30 | 13F | Twin Peaks Wealth Advisors, LLC | 0 | -100,00 | 0 | |||||
| 2026-01-29 | 13F | Rakuten Securities, Inc. | 656 | 893,94 | 54 | 783,33 | ||||
| 2026-02-17 | 13F | Alliancebernstein L.p. | 0 | -100,00 | 0 | |||||
| 2026-01-16 | 13F | Standard Life Aberdeen plc | 260.177 | 20,97 | 21.366 | 4,40 | ||||
| 2026-02-09 | 13F | Genus Capital Management Inc. | 5.613 | 21,68 | 461 | 6,73 | ||||
| 2026-02-12 | 13F | Sit Investment Associates Inc | 0 | -100,00 | 0 | |||||
| 2025-11-10 | 13F | Alliance Wealth Advisors, LLC /UT | 0 | -100,00 | 0 | |||||
| 2026-02-11 | 13F | Jpmorgan Chase & Co | 3.553.356 | 9,92 | 291.802 | -3,56 | ||||
| 2025-12-18 | 13F | Danske Bank A/s | 0 | -100,00 | 0 | |||||
| 2026-02-05 | 13F | Central Asset Investments & Management Holdings (HK) Ltd | 3.000 | 0,00 | 246 | -12,14 | ||||
| 2026-04-14 | 13F | Nbc Securities, Inc. | 0 | -100,00 | 0 | |||||
| 2026-01-23 | 13F | Helios Capital Management Pte. Ltd | 27.500 | 0,00 | 2.258 | -12,28 | ||||
| 2025-10-27 | 13F | First Horizon Corp | 0 | -100,00 | 0 | |||||
| 2025-11-14 | 13F | AXA Investment Managers S.A. | 421.300 | 103.019 | ||||||
| 2026-01-15 | 13F | Allspring Global Investments Holdings, LLC | 952.418 | 140,03 | 77.994 | 112,86 | ||||
| 2026-02-11 | 13F | Clearbridge Investments, LLC | 292.031 | -6,41 | 23.982 | -17,89 | ||||
| 2026-02-10 | 13F | Commonwealth Of Pennsylvania Public School Empls Retrmt Sys | 30.732 | 39,62 | 2.524 | 22,48 | ||||
| 2026-02-13 | 13F | DLD Asset Management, LP | Put | 50.000 | 4.107 | |||||
| 2026-01-27 | 13F | Regions Financial Corp | 0 | -100,00 | 0 | |||||
| 2026-02-13 | 13F | Wells Fargo & Company/mn | 6.541 | -0,46 | 537 | -12,68 | ||||
| 2025-11-14 | 13F | Petrus Trust Company, LTA | 0 | -100,00 | 0 | |||||
| 2026-02-10 | 13F | Acadian Asset Management Llc | 59.407 | -60,93 | 5 | -71,43 | ||||
| 2026-02-13 | 13F | Transamerica Financial Advisors, Inc. | 26 | 2 | ||||||
| 2026-02-17 | 13F | Breakout Capital Partners, LP | 281.808 | 20,38 | 23.142 | 5,61 | ||||
| 2026-04-13 | 13F | IFP Advisors, Inc | 9.061 | 0,91 | 338 | -54,27 | ||||
| 2026-02-13 | 13F | Hudson Bay Capital Management LP | 85.079 | 5,04 | 6.987 | -7,85 | ||||
| 2026-01-07 | 13F | Harbour Capital Advisors, LLC | 19.649 | -2,29 | 1.609 | -14,91 | ||||
| 2026-02-05 | 13F | LGT Group Foundation | 13.985 | -23,66 | 1.150 | -32,05 | ||||
| 2025-11-13 | 13F | Fieldview Capital Management, LLC | 0 | -100,00 | 0 | |||||
| 2026-04-01 | 13F | Confluence Investment Management Llc | 0 | -100,00 | 0 | |||||
| 2026-02-17 | 13F | New Vernon Capital Holdings II LLC | 9.213 | -66,25 | 757 | -70,40 | ||||
| 2026-01-23 | 13F | Baillie Gifford & Co | 5.155.036 | 2,28 | 423.332 | -10,26 | ||||
| 2026-02-17 | 13F | Jump Financial, LLC | 0 | -100,00 | 0 | |||||
| 2025-11-05 | 13F | Portside Wealth Group, LLC | 0 | -100,00 | 0 | |||||
| 2026-02-17 | 13F | Boothbay Fund Management, Llc | 4.711 | 387 | ||||||
| 2026-02-12 | 13F | Campbell & CO Investment Adviser LLC | 2.730 | 224 | ||||||
| 2026-02-05 | 13F | Allworth Financial LP | 323 | 22,35 | 27 | 8,33 | ||||
| 2026-02-17 | 13F/A | RBF Capital, LLC | 218.722 | 0,00 | 17.961 | -12,27 | ||||
| 2026-01-26 | 13F | Mirae Asset Global Investments Co., Ltd. | 104.900 | -34,19 | 8.614 | -42,26 | ||||
| 2026-02-17 | 13F | Millennium Management Llc | 137.023 | -57,56 | 11.252 | -62,77 | ||||
| 2026-04-22 | 13F | Pictet Asset Management Holding SA | 585.369 | -16,90 | 21.828 | -62,27 | ||||
| 2026-02-12 | 13F | Rossby Financial, LCC | 11 | 0,00 | 1 | -100,00 | ||||
| 2025-10-31 | 13F | Whittier Trust Co Of Nevada Inc | 0 | -100,00 | 0 | -100,00 | ||||
| 2026-03-04 | 13F | SHP Wealth Management | 11 | 1 | ||||||
| 2026-02-06 | 13F | Cullen/frost Bankers, Inc. | 0 | -100,00 | 0 | |||||
| 2026-04-20 | 13F | Ronald Blue Trust, Inc. | 5.146 | -11,17 | 192 | -59,79 | ||||
| 2026-02-11 | 13F | Capital International Inc /ca/ | 531.303 | 14,80 | 43.631 | 0,72 | ||||
| 2026-01-30 | 13F | Flossbach Von Storch Ag | 45.000 | 20,00 | 3.695 | 5,27 | ||||
| 2026-02-12 | 13F | Groupe la Francaise | 109.461 | 11,60 | 8.984 | -2,22 | ||||
| 2026-02-17 | 13F | MIRAE ASSET GLOBAL ETFS HOLDINGS Ltd. | 0 | -100,00 | 0 | |||||
| 2026-01-16 | 13F | FNY Investment Advisers, LLC | 0 | -100,00 | 0 | |||||
| 2026-02-13 | 13F | Panview Capital Ltd | 146.452 | 12.027 | ||||||
| 2026-02-17 | 13F | FIL Ltd | 396.576 | -56,19 | 32.567 | -61,56 | ||||
| 2026-02-10 | 13F | Bank of New York Mellon Corp | 139.446 | 2,51 | 11.451 | -10,06 | ||||
| 2026-04-09 | 13F | Zevenbergen Capital Investments Llc | 36.685 | -42,49 | 1.368 | -73,90 | ||||
| 2026-04-22 | 13F | HMS Capital Management, LLC | 0 | -100,00 | 0 | |||||
| 2026-02-17 | 13F | Point72 Asset Management, L.P. | 0 | -100,00 | 0 | |||||
| 2026-02-17 | 13F | Aquatic Capital Management LLC | 66.714 | 42,98 | 5.479 | 25,44 | ||||
| 2026-02-04 | 13F | Mascoma Wealth Management LLC | 55 | 0,00 | 5 | -20,00 | ||||
| 2026-02-12 | 13F | New York State Common Retirement Fund | 42.740 | -31,16 | 3.510 | -39,61 | ||||
| 2026-02-17 | 13F | Signature Equity Partners, LLC | 14 | 1 | ||||||
| 2026-01-30 | 13F | State of New Jersey Common Pension Fund D | 53.647 | 29,65 | 4.405 | 13,77 | ||||
| 2026-02-17 | 13F | Credit Agricole S A | 49.305 | 11,27 | 4.049 | -2,39 | ||||
| 2026-02-17 | 13F | Citadel Advisors Llc | 21.814 | -76,30 | 1.791 | -79,21 | ||||
| 2026-02-17 | 13F | Citadel Advisors Llc | Call | 23.000 | 36,09 | 1.889 | 19,42 | |||
| 2026-02-13 | 13F | Cornerstone Financial Management LLC | 56 | 5 | ||||||
| 2026-01-26 | 13F | La Banque Postale Asset Management SA | 30.802 | -1,25 | 2.529 | -13,36 | ||||
| 2026-01-26 | 13F | Private Trust Co Na | 31 | 0,00 | 3 | 0,00 | ||||
| 2026-02-13 | 13F | Brown Advisory Inc | 0 | -100,00 | 0 | |||||
| 2026-04-17 | 13F | Bell Investment Advisors, Inc | 92 | 84,00 | 3 | -25,00 | ||||
| 2026-02-13 | 13F | MAI Capital Management | 16 | 0,00 | 1 | 0,00 | ||||
| 2026-02-13 | 13F | Toroso Investments, LLC | 0 | -100,00 | 0 | |||||
| 2026-02-17 | 13F | Citadel Advisors Llc | Put | 8.000 | -32,20 | 657 | -40,58 | |||
| 2025-11-12 | 13F | Dunhill Financial, LLC | 0 | -100,00 | 0 | -100,00 | ||||
| 2026-02-02 | 13F | Bellecapital International Ltd. | 0 | -100,00 | 0 | |||||
| 2025-11-12 | 13F | Park Square Financial Group, LLC | 0 | -100,00 | 0 | |||||
| 2026-02-17 | 13F | SageView Advisory Group, LLC | 30 | 2 | ||||||
| 2025-11-14 | 13F | Blackstone Group Inc | 0 | -100,00 | 0 | -100,00 | ||||
| 2025-11-14 | 13F | Integrated Wealth Concepts LLC | 0 | -100,00 | 0 | |||||
| 2026-04-15 | 13F | Exchange Traded Concepts, Llc | 72.611 | -1,78 | 2.708 | -55,41 | ||||
| 2026-01-20 | 13F | Palisades Investment Partners, LLC | 119.375 | 1,63 | 9.803 | -10,83 | ||||
| 2026-02-13 | 13F | Van Eck Associates Corp | 21.059 | 15,93 | 2 | 0,00 | ||||
| 2026-02-13 | 13F | Walleye Capital LLC | 0 | -100,00 | 0 | |||||
| 2026-02-14 | 13F | Rockefeller Capital Management L.P. | 677 | 416,79 | 56 | 358,33 | ||||
| 2026-02-03 | 13F/A | Bank Of America Corp /de/ | Call | 0 | -100,00 | 0 | -100,00 | |||
| 2026-02-09 | 13F | Geode Capital Management, Llc | 391.732 | -1,21 | 32.169 | -13,32 | ||||
| 2026-02-12 | 13F | JPL Wealth Management, LLC | 0 | -100,00 | 0 | |||||
| 2026-02-13 | 13F | Colony Group, LLC | 3.143 | 0,03 | 258 | -12,24 | ||||
| 2026-04-24 | 13F | Ninety One UK Ltd | 117.891 | 24,55 | 4.396 | -43,45 | ||||
| 2026-01-16 | 13F | Crewe Advisors LLC | 330 | 2,48 | 27 | -10,00 | ||||
| 2026-04-21 | 13F | Wasatch Advisors Inc | 2.339.741 | 64,15 | 87.249 | -25,46 | ||||
| 2026-01-15 | 13F | Boston Common Asset Management, LLC | 31.792 | 21,68 | 2.611 | 6,75 | ||||
| 2026-02-17 | 13F | KADENSA CAPITAL Ltd | 0 | -100,00 | 0 |
Other Listings
| DE:MY1 | 39,04 € |