Grundlæggende statistik
| Porteføljeværdi | $ 253.251.785 |
| Nuværende stillinger | 93 |
Seneste beholdninger, ydeevne, AUM (fra 13F, 13D)
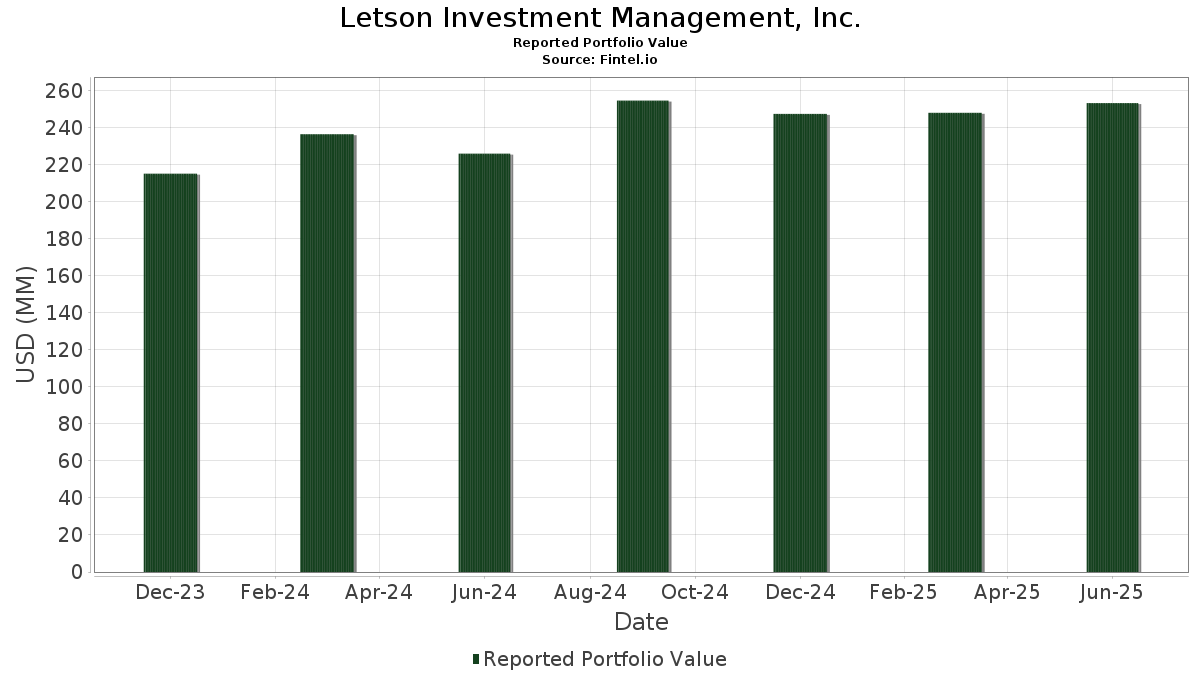
Letson Investment Management, Inc. har afsløret 93 samlede besiddelser i deres seneste SEC-arkivering. Den seneste porteføljeværdi er beregnet til at være $ 253.251.785 USD. Faktiske aktiver under forvaltning (AUM) er denne værdi plus kontanter (som ikke er oplyst). Letson Investment Management, Inc.s største beholdninger er AbbVie Inc. (US:ABBV) , Visa Inc. (US:V) , Abbott Laboratories (US:ABT) , Accenture plc (US:ACN) , and Johnson & Johnson (US:JNJ) . Letson Investment Management, Inc.s nye stillinger omfatter Kratos Defense & Security Solutions, Inc. (US:KTOS) , IonQ, Inc. (US:IONQ) , Centrus Energy Corp. (US:LEU) , Medtronic plc (US:MDT) , and Toast, Inc. (US:TOST) .
Top øger dette kvartal
Vi bruger ændringen i porteføljeallokeringen, fordi dette er den mest meningsfulde metrik. Ændringer kan skyldes handler eller ændringer i aktiekurser.
| Sikkerhed | Aktier (MM) |
Værdi (MM$) |
Portefølje % | ΔPortefølje % |
|---|---|---|---|---|
| 0,02 | 7,32 | 2,8899 | 0,6168 | |
| 0,03 | 10,15 | 4,0097 | 0,5548 | |
| 0,01 | 6,64 | 2,6210 | 0,5346 | |
| 0,11 | 7,71 | 3,0450 | 0,3516 | |
| 0,01 | 2,05 | 0,8076 | 0,3067 | |
| 0,01 | 0,61 | 0,2416 | 0,2416 | |
| 0,01 | 0,53 | 0,2087 | 0,2087 | |
| 0,11 | 5,09 | 2,0090 | 0,1998 | |
| 0,00 | 0,46 | 0,1808 | 0,1808 | |
| 0,01 | 3,15 | 1,2427 | 0,1693 |
Top falder i dette kvartal
Vi bruger ændringen i porteføljeallokeringen, fordi dette er den mest meningsfulde metrik. Ændringer kan skyldes handler eller ændringer i aktiekurser.
| Sikkerhed | Aktier (MM) |
Værdi (MM$) |
Portefølje % | ΔPortefølje % |
|---|---|---|---|---|
| 0,11 | 20,60 | 8,1360 | -1,2859 | |
| 0,08 | 12,04 | 4,7541 | -0,5179 | |
| 0,05 | 6,42 | 2,5336 | -0,4243 | |
| 0,01 | 2,37 | 0,9345 | -0,3767 | |
| 0,01 | 1,44 | 0,5684 | -0,3751 | |
| 0,04 | 12,47 | 4,9222 | -0,2754 | |
| 0,05 | 7,05 | 2,7850 | -0,2310 | |
| 0,05 | 3,88 | 1,5336 | -0,2271 | |
| 0,02 | 5,88 | 2,3226 | -0,2129 | |
| 0,01 | 3,63 | 1,4334 | -0,1999 |
13F og Fondsarkivering
Denne formular blev indsendt den 2025-08-14 for rapporteringsperioden 2025-06-30. Klik på linkikonet for at se den fulde transaktionshistorik.
Opgrader for at låse op for premium-data og eksportere til Excel ![]() .
.
| Sikkerhed | Type | Gennemsnitlig aktiekurs | Aktier (MM) |
Δ Aktier (%) |
Δ Aktier (%) |
Værdi ($MM) |
Portefølje (%) |
ΔPortefølje (%) |
|
|---|---|---|---|---|---|---|---|---|---|
| ABBV / AbbVie Inc. | 0,11 | -0,47 | 20,60 | -11,82 | 8,1360 | -1,2859 | |||
| V / Visa Inc. | 0,05 | -0,09 | 19,18 | 1,21 | 7,5753 | -0,0675 | |||
| ABT / Abbott Laboratories | 0,11 | -0,08 | 14,79 | 2,45 | 5,8395 | 0,0192 | |||
| ACN / Accenture plc | 0,04 | 0,96 | 12,47 | -3,30 | 4,9222 | -0,2754 | |||
| JNJ / Johnson & Johnson | 0,08 | -0,02 | 12,04 | -7,92 | 4,7541 | -0,5179 | |||
| AXP / American Express Company | 0,03 | -0,04 | 10,15 | 18,51 | 4,0097 | 0,5548 | |||
| SYK / Stryker Corporation | 0,02 | 0,00 | 8,53 | 6,28 | 3,3678 | 0,1320 | |||
| CARR / Carrier Global Corporation | 0,11 | 0,01 | 7,71 | 15,45 | 3,0450 | 0,3516 | |||
| TT / Trane Technologies plc | 0,02 | 0,00 | 7,32 | 29,82 | 2,8899 | 0,6168 | |||
| PAYX / Paychex, Inc. | 0,05 | 0,01 | 7,05 | -5,70 | 2,7850 | -0,2310 | |||
| INTU / Intuit Inc. | 0,01 | 0,01 | 6,64 | 28,28 | 2,6210 | 0,5346 | |||
| PEP / PepsiCo, Inc. | 0,05 | -0,67 | 6,42 | -12,53 | 2,5336 | -0,4243 | |||
| ADP / Automatic Data Processing, Inc. | 0,02 | 0,02 | 6,23 | 0,96 | 2,4585 | -0,0283 | |||
| MCD / McDonald's Corporation | 0,02 | 0,01 | 5,88 | -6,46 | 2,3226 | -0,2129 | |||
| EFX / Equifax Inc. | 0,02 | 0,00 | 5,20 | 6,49 | 2,0548 | 0,0844 | |||
| BAC / Bank of America Corporation | 0,11 | 0,00 | 5,09 | 13,40 | 2,0090 | 0,1998 | |||
| UNP / Union Pacific Corporation | 0,02 | 0,14 | 4,88 | -2,48 | 1,9273 | -0,0906 | |||
| CNI / Canadian National Railway Company | 0,04 | -0,82 | 4,58 | 5,88 | 1,8066 | 0,0642 | |||
| VTI / Vanguard Index Funds - Vanguard Total Stock Market ETF | 0,01 | 0,00 | 3,99 | 10,59 | 1,5751 | 0,1206 | |||
| MRK / Merck & Co., Inc. | 0,05 | 0,86 | 3,88 | -11,06 | 1,5336 | -0,2271 | |||
| AMGN / Amgen Inc. | 0,01 | 0,00 | 3,63 | -10,37 | 1,4334 | -0,1999 | |||
| CB / Chubb Limited | 0,01 | 0,76 | 3,39 | -3,33 | 1,3403 | -0,0757 | |||
| DIA / SPDR Dow Jones Industrial Average ETF Trust | 0,01 | 0,00 | 3,15 | 4,96 | 1,2456 | 0,0336 | |||
| JPM / JPMorgan Chase & Co. | 0,01 | 0,04 | 3,15 | 18,26 | 1,2427 | 0,1693 | |||
| KDP / Keurig Dr Pepper Inc. | 0,09 | 0,01 | 2,99 | -3,36 | 1,1815 | -0,0672 | |||
| PM / Philip Morris International Inc. | 0,02 | 0,00 | 2,92 | 14,71 | 1,1522 | 0,1268 | |||
| OTIS / Otis Worldwide Corporation | 0,03 | 0,14 | 2,69 | -3,93 | 1,0621 | -0,0667 | |||
| ITW / Illinois Tool Works Inc. | 0,01 | -0,30 | 2,48 | -0,60 | 0,9799 | -0,0268 | |||
| GNRC / Generac Holdings Inc. | 0,02 | -0,66 | 2,46 | 12,33 | 0,9714 | 0,0883 | |||
| BDX / Becton, Dickinson and Company | 0,01 | -3,22 | 2,37 | -27,22 | 0,9345 | -0,3767 | |||
| NOC / Northrop Grumman Corporation | 0,00 | 0,00 | 2,33 | -2,35 | 0,9187 | -0,0420 | |||
| COST / Costco Wholesale Corporation | 0,00 | 0,00 | 2,32 | 4,69 | 0,9166 | 0,0224 | |||
| RTX / RTX Corporation | 0,02 | 0,24 | 2,31 | 10,51 | 0,9133 | 0,0693 | |||
| MKC / McCormick & Company, Incorporated | 0,03 | 0,00 | 2,08 | -7,88 | 0,8217 | -0,0892 | |||
| AVGO / Broadcom Inc. | 0,01 | 0,00 | 2,05 | 64,65 | 0,8076 | 0,3067 | |||
| DIS / The Walt Disney Company | 0,02 | 0,00 | 1,94 | 25,70 | 0,7650 | 0,1433 | |||
| HD / The Home Depot, Inc. | 0,01 | 0,04 | 1,90 | 0,05 | 0,7501 | -0,0154 | |||
| CL / Colgate-Palmolive Company | 0,02 | 0,00 | 1,81 | -3,00 | 0,7153 | -0,0376 | |||
| AMP / Ameriprise Financial, Inc. | 0,00 | 0,00 | 1,80 | 10,27 | 0,7125 | 0,0526 | |||
| PKG / Packaging Corporation of America | 0,01 | 0,05 | 1,78 | -4,82 | 0,7023 | -0,0509 | |||
| YUM / Yum! Brands, Inc. | 0,01 | 0,00 | 1,55 | -5,84 | 0,6120 | -0,0517 | |||
| CVX / Chevron Corporation | 0,01 | -28,13 | 1,44 | -38,48 | 0,5684 | -0,3751 | |||
| NVDA / NVIDIA Corporation | 0,01 | 0,00 | 1,40 | 45,79 | 0,5534 | 0,1657 | |||
| MA / Mastercard Incorporated | 0,00 | 0,00 | 1,39 | 2,50 | 0,5508 | 0,0022 | |||
| NSC / Norfolk Southern Corporation | 0,01 | 0,04 | 1,39 | 8,11 | 0,5473 | 0,0303 | |||
| HON / Honeywell International Inc. | 0,01 | 0,00 | 1,36 | 9,96 | 0,5365 | 0,0384 | |||
| PGR / The Progressive Corporation | 0,00 | 0,00 | 1,07 | -5,74 | 0,4215 | -0,0350 | |||
| GPC / Genuine Parts Company | 0,01 | 0,00 | 1,07 | 1,81 | 0,4210 | -0,0012 | |||
| MSFT / Microsoft Corporation | 0,00 | 0,00 | 0,94 | 32,58 | 0,3698 | 0,0848 | |||
| KO / The Coca-Cola Company | 0,01 | 0,00 | 0,91 | -1,20 | 0,3574 | -0,0121 | |||
| SCI / Service Corporation International | 0,01 | 0,00 | 0,83 | 1,46 | 0,3288 | -0,0020 | |||
| SRE / Sempra | 0,01 | 0,00 | 0,77 | 6,19 | 0,3052 | 0,0117 | |||
| BMY / Bristol-Myers Squibb Company | 0,02 | 0,00 | 0,76 | -24,08 | 0,3015 | -0,1041 | |||
| MDLZ / Mondelez International, Inc. | 0,01 | 0,00 | 0,73 | -0,68 | 0,2897 | -0,0079 | |||
| FIS / Fidelity National Information Services, Inc. | 0,01 | 0,00 | 0,73 | 8,98 | 0,2877 | 0,0182 | |||
| VEA / Vanguard Tax-Managed Funds - Vanguard FTSE Developed Markets ETF | 0,01 | 0,00 | 0,72 | 12,27 | 0,2856 | 0,0256 | |||
| MU / Micron Technology, Inc. | 0,01 | 0,00 | 0,65 | 41,96 | 0,2579 | 0,0722 | |||
| ICE / Intercontinental Exchange, Inc. | 0,00 | 0,00 | 0,65 | 6,39 | 0,2564 | 0,0102 | |||
| UBER / Uber Technologies, Inc. | 0,01 | 0,00 | 0,62 | 28,04 | 0,2455 | 0,0497 | |||
| KTOS / Kratos Defense & Security Solutions, Inc. | 0,01 | 0,61 | 0,2416 | 0,2416 | |||||
| TJX / The TJX Companies, Inc. | 0,00 | 0,00 | 0,55 | 1,47 | 0,2189 | -0,0016 | |||
| IONQ / IonQ, Inc. | 0,01 | 0,53 | 0,2087 | 0,2087 | |||||
| PTON / Peloton Interactive, Inc. | 0,07 | 0,00 | 0,49 | 9,71 | 0,1922 | 0,0135 | |||
| PFE / Pfizer Inc. | 0,02 | 0,00 | 0,48 | -4,35 | 0,1914 | -0,0129 | |||
| PNC / The PNC Financial Services Group, Inc. | 0,00 | 0,00 | 0,46 | 6,19 | 0,1829 | 0,0068 | |||
| LEU / Centrus Energy Corp. | 0,00 | 0,46 | 0,1808 | 0,1808 | |||||
| APD / Air Products and Chemicals, Inc. | 0,00 | 0,00 | 0,42 | -4,37 | 0,1644 | -0,0111 | |||
| SHW / The Sherwin-Williams Company | 0,00 | 0,00 | 0,42 | -1,66 | 0,1642 | -0,0063 | |||
| COP / ConocoPhillips | 0,00 | 0,00 | 0,41 | -14,49 | 0,1631 | -0,0318 | |||
| GOOG / Alphabet Inc. | 0,00 | 0,04 | 0,41 | 13,41 | 0,1606 | 0,0162 | |||
| TMO / Thermo Fisher Scientific Inc. | 0,00 | 0,00 | 0,41 | -18,47 | 0,1604 | -0,0406 | |||
| AFL / Aflac Incorporated | 0,00 | 0,00 | 0,40 | -5,23 | 0,1577 | -0,0121 | |||
| RACE / Ferrari N.V. | 0,00 | 0,00 | 0,40 | 14,70 | 0,1573 | 0,0173 | |||
| PPLT / abrdn Platinum ETF Trust - abrdn Physical Platinum Shares ETF | 0,00 | 0,00 | 0,38 | 34,28 | 0,1504 | 0,0362 | |||
| LOW / Lowe's Companies, Inc. | 0,00 | 0,00 | 0,38 | -5,03 | 0,1496 | -0,0110 | |||
| IVV / iShares Trust - iShares Core S&P 500 ETF | 0,00 | 0,00 | 0,36 | 10,40 | 0,1429 | 0,0108 | |||
| XOM / Exxon Mobil Corporation | 0,00 | 0,00 | 0,35 | -9,37 | 0,1375 | -0,0174 | |||
| QQQ / Invesco QQQ Trust, Series 1 | 0,00 | 0,00 | 0,33 | 17,73 | 0,1311 | 0,0173 | |||
| ISRG / Intuitive Surgical, Inc. | 0,00 | 0,00 | 0,32 | 9,90 | 0,1272 | 0,0088 | |||
| MO / Altria Group, Inc. | 0,01 | 0,00 | 0,32 | -2,45 | 0,1259 | -0,0057 | |||
| ANET / Arista Networks Inc | 0,00 | 0,00 | 0,31 | 31,90 | 0,1212 | 0,0275 | |||
| TXN / Texas Instruments Incorporated | 0,00 | 0,00 | 0,30 | 15,59 | 0,1201 | 0,0140 | |||
| ASML / ASML Holding N.V. - Depositary Receipt (Common Stock) | 0,00 | 0,00 | 0,30 | 20,88 | 0,1190 | 0,0185 | |||
| PSX / Phillips 66 | 0,00 | 0,00 | 0,29 | -3,34 | 0,1144 | -0,0065 | |||
| AAPL / Apple Inc. | 0,00 | -24,14 | 0,25 | -30,00 | 0,0998 | -0,0456 | |||
| MDT / Medtronic plc | 0,00 | 0,25 | 0,0968 | 0,0968 | |||||
| ORCL / Oracle Corporation | 0,00 | 0,24 | 0,0956 | 0,0956 | |||||
| MMYT / MakeMyTrip Limited | 0,00 | 0,00 | 0,22 | 0,00 | 0,0879 | -0,0018 | |||
| TOST / Toast, Inc. | 0,00 | 0,21 | 0,0834 | 0,0834 | |||||
| LHX / L3Harris Technologies, Inc. | 0,00 | -40,66 | 0,21 | -28,96 | 0,0834 | -0,0364 | |||
| SJM / The J. M. Smucker Company | 0,00 | 0,00 | 0,21 | -17,13 | 0,0822 | -0,0190 | |||
| RJF / Raymond James Financial, Inc. | 0,00 | 0,20 | 0,0790 | 0,0790 | |||||
| MQ / Marqeta, Inc. | 0,03 | 0,00 | 0,20 | 41,43 | 0,0783 | 0,0218 | |||
| S / SentinelOne, Inc. | 0,00 | -100,00 | 0,00 | -100,00 | -0,0814 | ||||
| AES / The AES Corporation | 0,00 | -100,00 | 0,00 | -100,00 | -0,0544 |