Grundlæggende statistik
| Institutionelle ejere | 156 total, 156 long only, 0 short only, 0 long/short - change of -1,88% MRQ |
| Gennemsnitlig porteføljeallokering | 0.5596 % - change of 0,20% MRQ |
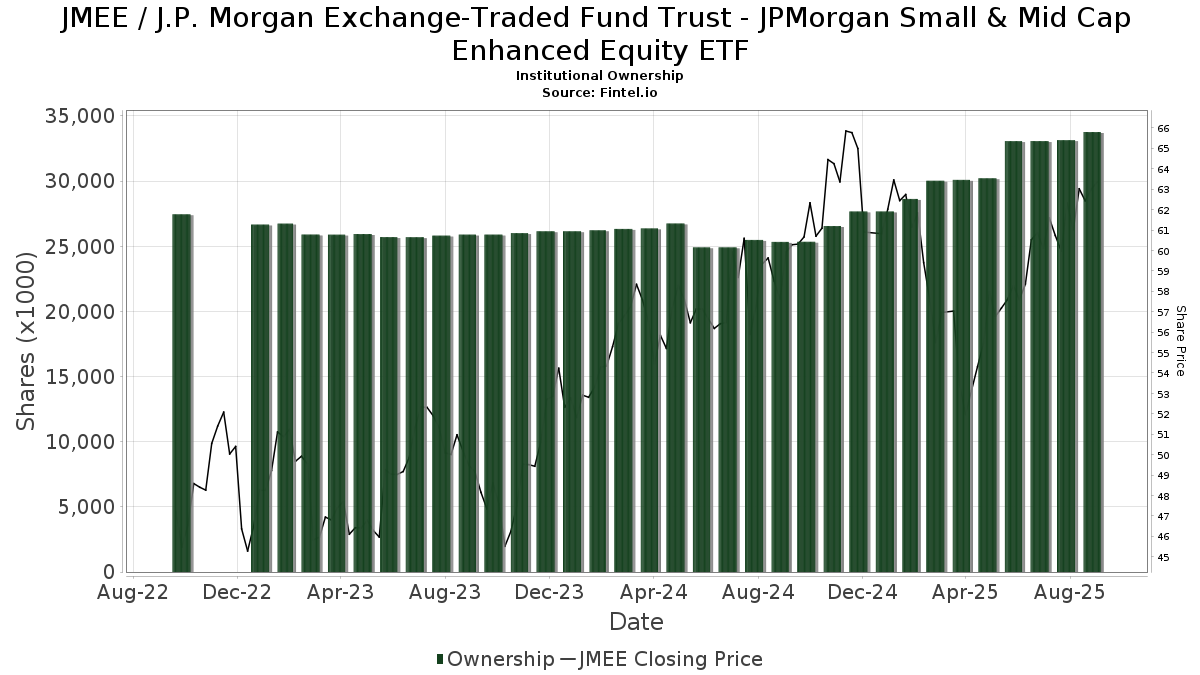
| Institutionelle aktier (lange) | 33.765.008 (ex 13D/G) - change of 0,69MM shares 2,10% MRQ |
| Institutionel værdi (lang) | $ 1.936.185 USD ($1000) |
Institutionelt ejerskab og aktionærer
J.P. Morgan Exchange-Traded Fund Trust - JPMorgan Small & Mid Cap Enhanced Equity ETF (US:JMEE) har 156 institutionelle ejere og aktionærer, der har indsendt 13D/G- eller 13F-formularer til Securities Exchange Commission (SEC). Disse institutioner har i alt 33,765,008 aktier. Største aktionærer omfatter Jpmorgan Chase & Co, ONIFX - JPMorgan Investor Growth Fund Class I, ONGFX - JPMorgan Investor Growth & Income Fund Class I, OIBFX - JPMorgan Investor Balanced Fund Class I, LPL Financial LLC, Crestwood Advisors Group LLC, Great Valley Advisor Group, Inc., Syntegra Private Wealth Group, LLC, ONCFX - JPMorgan Investor Conservative Growth Fund Class I, and Advisor Group Holdings, Inc. .
J.P. Morgan Exchange-Traded Fund Trust - JPMorgan Small & Mid Cap Enhanced Equity ETF (ARCA:JMEE) institutionel ejerskabsstruktur viser aktuelle positioner i virksomheden efter institutioner og fonde, samt seneste ændringer i positionsstørrelse. Større aktionærer kan omfatte individuelle investorer, investeringsforeninger, hedgefonde eller institutioner. Skema 13D angiver, at investoren besidder (eller besidder) mere end 5 % af virksomheden og har til hensigt (eller har til hensigt at) aktivt at forfølge en ændring i forretningsstrategi. Skema 13G indikerer en passiv investering på over 5%.
The share price as of September 11, 2025 is 64,21 / share. Previously, on September 11, 2024, the share price was 57,62 / share. This represents an increase of 11,44% over that period.
Fondens stemningsscore
Fund Sentiment Score (fka Ownership Accumulation Score) finder de aktier, der bliver mest købt af fonde. Det er resultatet af en sofistikeret, multi-faktor kvantitativ model, der identificerer virksomheder med de højeste niveauer af institutionel akkumulering. Scoringsmodellen bruger en kombination af den samlede stigning i oplyste ejere, ændringerne i porteføljeallokeringer i disse ejere og andre målinger. Tallet går fra 0 til 100, hvor højere tal indikerer et højere niveau af akkumulering for sine jævnaldrende, og 50 er gennemsnittet.
Opdateringsfrekvens: Dagligt
Se Ownership Explorer, som giver en liste over højest rangerende virksomheder.
Institutionel Put/Call-forhold
Ud over at indberette standardaktie- og gældsudstedelser skal institutter med mere end 100 mill. aktiver under forvaltning også oplyse deres put- og call-optionsbeholdninger. Da salgsoptioner generelt indikerer negativ stemning, og købsoptioner indikerer positiv stemning, kan vi få en fornemmelse af den overordnede institutionelle stemning ved at plotte forholdet mellem put og kald. Diagrammet til højre viser det historiske put/call-forhold for dette instrument.
Brug af Put/Call Ratio som en indikator for investorernes stemning overvinder en af de vigtigste mangler ved at bruge totalt institutionelt ejerskab, som er, at en betydelig mængde af aktiver under forvaltning investeres passivt for at spore indekser. Passivt forvaltede fonde køber typisk ikke optioner, så indikatoren for put/call-forholdet følger mere nøje følelsen af aktivt forvaltede fonde.
13F og NPORT arkivering
Detaljer om 13F-arkivering er gratis. Detaljer om NP-ansøgninger kræver et premium-medlemskab. Grønne rækker angiver nye positioner. Røde rækker angiver lukkede positioner. Klik på linket ikon for at se den fulde transaktionshistorik.
Opgrader
for at låse premium-data op og eksportere til Excel ![]() .
.
| Fil dato | Kilde | Investor | Type | Gennemsnitlig pris (Øst) |
Aktier | Δ Aktier (%) |
Rapporteret Værdi ($1000) |
Δ Værdi (%) |
Port Alloc (%) |
|
|---|---|---|---|---|---|---|---|---|---|---|
| 2025-07-08 | 13F | Choice Wealth Advisors, LLC | 156.587 | 1,72 | 9.272 | 7,59 | ||||
| 2025-08-11 | 13F | Principal Securities, Inc. | 324 | -50,08 | 19 | -51,28 | ||||
| 2025-08-12 | 13F/A | Cozad Asset Management Inc | 8.228 | -28,81 | 487 | -24,73 | ||||
| 2025-07-28 | 13F | Nestegg Advisors, Inc. | 3.870 | 0,00 | 229 | 6,02 | ||||
| 2025-07-07 | 13F | Global Wealth Strategies & Associates | 0 | -100,00 | 0 | |||||
| 2025-07-28 | 13F | Private Wealth Asset Management, LLC | 238 | 14 | ||||||
| 2025-08-26 | NP | EVCLX - The E-Valuator Conservative (15%-30%) RMS Fund Service Class Shares | 2.534 | -50,16 | 150 | -47,18 | ||||
| 2025-07-14 | 13F | Farmers & Merchants Investments Inc | 1 | 0,00 | 0 | |||||
| 2025-08-14 | 13F | Benjamin Edwards Inc | 13.699 | 0,76 | 811 | 6,57 | ||||
| 2025-08-26 | NP | EVTTX - The E-Valuator Conservative/Moderate (30%-50%) RMS Fund Service Class Shares | 2.747 | -47,47 | 163 | -44,52 | ||||
| 2025-08-12 | 13F | Tradition Wealth Management, LLC | 98.232 | 10,61 | 5.816 | 17,00 | ||||
| 2025-07-10 | 13F | Stewardship Advisors, LLC | 74.076 | 0,95 | 4.386 | 6,79 | ||||
| 2025-07-22 | 13F | Siligmueller & Norvid Wealth Advisors LLC | 19.165 | -15,94 | 1.152 | -9,72 | ||||
| 2025-08-14 | 13F | Sunbelt Securities, Inc. | 41 | 0,00 | 2 | 0,00 | ||||
| 2025-08-04 | 13F | IFG Advisory, LLC | 11.741 | 8,93 | 695 | 15,26 | ||||
| 2025-08-12 | 13F | Jpmorgan Chase & Co | 10.512.654 | 0,10 | 622.454 | 5,88 | ||||
| 2025-08-14 | 13F | D. E. Shaw & Co., Inc. | 3.489 | -61,68 | 207 | -59,53 | ||||
| 2025-07-09 | 13F | Fermata Advisors, LLC | 21.297 | -16,94 | 1.261 | -12,20 | ||||
| 2025-07-15 | 13F | Avaii Wealth Management, Llc | 7.283 | 431 | ||||||
| 2025-08-14 | 13F | Comerica Bank | 1.043 | -52,66 | 62 | -50,41 | ||||
| 2025-08-07 | 13F | Verus Capital Partners, Llc | 132.146 | -6,75 | 7.824 | -1,36 | ||||
| 2025-08-26 | NP | ONIFX - JPMorgan Investor Growth Fund Class I | 4.247.206 | 0,00 | 251.477 | 5,77 | ||||
| 2025-07-10 | 13F | Redhawk Wealth Advisors, Inc. | 0 | -100,00 | 0 | |||||
| 2025-07-11 | 13F | Bond & Devick Financial Network, Inc. | 154.248 | 6,32 | 9.133 | 12,46 | ||||
| 2025-08-15 | 13F | Asset Allocation Strategies LLC | 24.162 | -19,59 | 1.431 | -14,98 | ||||
| 2025-08-26 | NP | ONGFX - JPMorgan Investor Growth & Income Fund Class I | 2.895.844 | 0,00 | 171.463 | 5,77 | ||||
| 2025-05-13 | 13F | Thrivent Financial For Lutherans | 0 | -100,00 | 0 | |||||
| 2025-04-23 | 13F | Spire Wealth Management | 0 | -100,00 | 0 | |||||
| 2025-08-14 | 13F | Visionary Wealth Advisors | 0 | -100,00 | 0 | |||||
| 2025-08-26 | NP | EVMLX - The E-Valuator Moderate (50%-70%) RMS Fund Service Class Shares | 11.868 | -61,56 | 703 | -59,37 | ||||
| 2025-07-10 | 13F | Rockland Trust Co | 9.731 | -4,71 | 576 | 0,88 | ||||
| 2025-08-12 | 13F | Proequities, Inc. | 0 | 0 | ||||||
| 2025-07-31 | 13F | West Michigan Advisors, Llc | 69.047 | 1,03 | 4.088 | 6,85 | ||||
| 2025-08-08 | 13F | Advisory Resource Group | 286.683 | 21,46 | 16.974 | 28,46 | ||||
| 2025-08-11 | 13F | Brown Brothers Harriman & Co | 4.140 | 245 | ||||||
| 2025-07-25 | 13F | Total Clarity Wealth Management, Inc. | 22.670 | 53,36 | 1.342 | 50,28 | ||||
| 2025-08-04 | 13F | Spinnaker Trust | 3.554 | 210 | ||||||
| 2025-07-30 | 13F | Crewe Advisors LLC | 515 | 0,00 | 30 | 7,14 | ||||
| 2025-08-14 | 13F | Qube Research & Technologies Ltd | 353 | 21 | ||||||
| 2025-08-11 | 13F | Private Advisor Group, LLC | 68.860 | 221,09 | 4.077 | 239,75 | ||||
| 2025-08-26 | NP | EVAGX - The E-Valuator Aggressive Growth (85%-99%) RMS Fund Service Class Shares | 27.770 | -58,40 | 1.644 | -56,01 | ||||
| 2025-08-06 | 13F | Mascagni Wealth Management, Inc. | 4.390 | -9,69 | 260 | -4,78 | ||||
| 2025-04-21 | 13F | O'Dell Group, LLC | 0 | -100,00 | 0 | |||||
| 2025-07-22 | 13F | Awm Capital, Llc | 0 | -100,00 | 0 | |||||
| 2025-08-14 | 13F | Schwallier Wealth Management LLC | 120.470 | 26,16 | 7.133 | 33,45 | ||||
| 2025-08-26 | NP | EVGLX - The E-Valuator Growth (70%-85%) RMS Fund Service Class Shares | 34.845 | -59,50 | 2.063 | -57,16 | ||||
| 2025-07-24 | 13F | Leo Wealth, LLC | 18.776 | 1.112 | ||||||
| 2025-04-21 | 13F | Nelson, Van Denburg & Campbell Wealth Management Group, LLC | 0 | -100,00 | 0 | |||||
| 2025-08-15 | 13F | Kestra Advisory Services, LLC | 96.831 | 19,95 | 5.733 | -0,74 | ||||
| 2025-08-14 | 13F | Goldman Sachs Group Inc | 3.989 | 236 | ||||||
| 2025-08-14 | 13F | GWM Advisors LLC | 7.844 | -21,24 | 464 | -16,70 | ||||
| 2025-08-04 | 13F | Creative Financial Designs Inc /adv | 81.215 | -4,35 | 4.809 | 1,16 | ||||
| 2025-08-06 | 13F | Golden State Wealth Management, LLC | 670 | -32,39 | 40 | -29,09 | ||||
| 2025-08-12 | 13F | Global Retirement Partners, LLC | 18.921 | 298,76 | 1.120 | 291,61 | ||||
| 2025-07-07 | 13F | Nova Wealth Management, Inc. | 33 | 10,00 | 2 | 0,00 | ||||
| 2025-07-16 | 13F | Kendall Capital Management | 0 | -100,00 | 0 | |||||
| 2025-08-12 | 13F | Steward Partners Investment Advisory, Llc | 1.421 | 80,10 | 84 | 90,91 | ||||
| 2025-08-14 | 13F | Freedom Financial Partners LLC | 93.241 | 4,25 | 5.520 | 10,25 | ||||
| 2025-09-04 | 13F/A | Advisor Group Holdings, Inc. | 584.916 | 9,44 | 34.638 | 15,75 | ||||
| 2025-08-13 | 13F | Capital Analysts, Inc. | 402 | 0,00 | 0 | |||||
| 2025-07-22 | 13F | Wells Trecaso Financial Group, LLC | 26.064 | 5,42 | 1.543 | 11,57 | ||||
| 2025-08-11 | 13F | PAX Financial Group, LLC | 8.735 | -0,01 | 517 | 5,73 | ||||
| 2025-08-19 | 13F | Advisory Services Network, LLC | 4.920 | 35,91 | 295 | 46,04 | ||||
| 2025-07-31 | 13F | Glass Jacobson Investment Advisors llc | 2.100 | 0,00 | 124 | -1,59 | ||||
| 2025-08-14 | 13F | Stifel Financial Corp | 79.897 | -4,63 | 4.731 | 0,87 | ||||
| 2025-08-26 | NP | OIBFX - JPMorgan Investor Balanced Fund Class I | 2.576.137 | 0,00 | 152.533 | 5,77 | ||||
| 2025-08-15 | 13F | Morgan Stanley | 3.842 | 53,50 | 228 | 62,14 | ||||
| 2025-07-29 | 13F | Stratos Wealth Partners, LTD. | 3.406 | 202 | ||||||
| 2025-09-03 | 13F | American Trust | 75.645 | 4.479 | ||||||
| 2025-08-14 | 13F | Mml Investors Services, Llc | 8.463 | 13,05 | 1 | |||||
| 2025-07-15 | 13F | Financial Management Professionals, Inc. | 50 | 0,00 | 3 | 0,00 | ||||
| 2025-08-14 | 13F | Jane Street Group, Llc | 30.691 | -47,95 | 1.817 | -44,96 | ||||
| 2025-07-08 | 13F | Adamsbrown Wealth Consultants Llc | 0 | -100,00 | 0 | |||||
| 2025-06-11 | 13F | Fortitude Financial, LLC | 67.249 | 1,88 | 3.765 | -5,69 | ||||
| 2025-04-23 | 13F | SFG Wealth Management, LLC. | 0 | -100,00 | 0 | |||||
| 2025-08-11 | 13F | Summit Wealth Partners, LLC | 11.801 | 5,27 | 699 | 11,32 | ||||
| 2025-04-23 | 13F | Bluesphere Advisors, LLC | 0 | -100,00 | 0 | |||||
| 2025-08-14 | 13F | Heritage Wealth Management, Inc. | 5.558 | 39,05 | 329 | 47,53 | ||||
| 2025-07-30 | 13F | Syntegra Private Wealth Group, LLC | 799.983 | 5,84 | 47.367 | 11,94 | ||||
| 2025-08-05 | 13F | Scarborough Advisors, LLC | 83.493 | 29,38 | 4.944 | 36,85 | ||||
| 2025-07-31 | 13F | Cambridge Investment Research Advisors, Inc. | 27.137 | -11,18 | 2 | 0,00 | ||||
| 2025-05-06 | 13F | Assetmark, Inc | 0 | -100,00 | 0 | |||||
| 2025-08-07 | 13F | Lakeridge Wealth Management LLC | 77.720 | 3,10 | 4.602 | 9,05 | ||||
| 2025-08-06 | 13F | Commonwealth Equity Services, Llc | 210.980 | 21,07 | 12 | 33,33 | ||||
| 2025-07-09 | 13F | Dynamic Advisor Solutions LLC | 4.853 | -11,33 | 287 | -6,21 | ||||
| 2025-07-14 | 13F | Rooted Wealth Advisors, Inc. | 16.940 | 8,65 | 1.028 | 29,80 | ||||
| 2025-08-13 | 13F | Baird Financial Group, Inc. | 46.424 | -4,08 | 2.749 | 1,44 | ||||
| 2025-08-04 | 13F | Daymark Wealth Partners, Llc | 14.711 | 1,88 | 871 | 7,80 | ||||
| 2025-07-25 | 13F | NorthRock Partners, LLC | 8 | 0,00 | 0 | |||||
| 2025-08-12 | 13F | Cornerstone Wealth Management, LLC | 5.961 | 0,00 | 353 | 5,71 | ||||
| 2025-08-07 | 13F | Nwam Llc | 10.691 | -73,74 | 649 | -71,52 | ||||
| 2025-07-16 | 13F | RWM Asset Management, LLC | 63.706 | 2,36 | 3.772 | 8,27 | ||||
| 2025-07-28 | 13F | WealthPlan Investment Management, LLC | 11.876 | 703 | ||||||
| 2025-07-29 | 13F | Systelligence, LLC | 80.142 | -58,77 | 4.745 | -56,39 | ||||
| 2025-05-15 | 13F | Talon Private Wealth, LLC | 0 | -100,00 | 0 | -100,00 | ||||
| 2025-08-14 | 13F | Arete Wealth Advisors, LLC | 8.886 | 1,73 | 1 | |||||
| 2025-08-05 | 13F | Prosperity Wealth Management, Inc. | 5.544 | -5,30 | 328 | 0,31 | ||||
| 2025-07-22 | 13F | Merit Financial Group, LLC | 34.273 | -7,17 | 2.029 | -1,79 | ||||
| 2025-08-26 | NP | EVVLX - The E-Valuator Very Conservative (0%-15%) RMS Fund Service Class Shares | 378 | -6,20 | 22 | 0,00 | ||||
| 2025-05-09 | 13F | CoreCap Advisors, LLC | 0 | -100,00 | 0 | |||||
| 2025-07-15 | 13F | Total Wealth Planning, Llc | 442.415 | 11,47 | 26.195 | 17,91 | ||||
| 2025-07-24 | 13F | Us Bancorp \de\ | 28.120 | -0,01 | 1.665 | 5,72 | ||||
| 2025-07-17 | 13F | Janney Montgomery Scott LLC | 56.849 | -33,59 | 3 | -25,00 | ||||
| 2025-08-06 | 13F | AE Wealth Management LLC | 290 | -19,44 | 17 | -15,00 | ||||
| 2025-08-11 | 13F | Aptus Capital Advisors, LLC | 135 | 0,00 | 8 | 14,29 | ||||
| 2025-08-14 | 13F | Sequent Planning LLC | 4.734 | 19,12 | 280 | 26,13 | ||||
| 2025-08-12 | 13F | MAI Capital Management | 4.041 | 423,45 | 239 | 455,81 | ||||
| 2025-08-13 | 13F | Avestar Capital, LLC | 27.155 | 18,94 | 1.608 | 25,74 | ||||
| 2025-05-13 | 13F | Heck Capital Advisors, LLC | 0 | -100,00 | 0 | -100,00 | ||||
| 2025-08-12 | 13F | SRS Capital Advisors, Inc. | 416 | 1.334,48 | 25 | 2.300,00 | ||||
| 2025-05-13 | 13F | Quadrature Capital Ltd | 0 | -100,00 | 0 | -100,00 | ||||
| 2025-08-13 | 13F | Banco de Sabadell, S.A | 517 | 0 | ||||||
| 2025-07-25 | 13F | Concurrent Investment Advisors, LLC | 32.626 | 59,29 | 1.932 | 68,50 | ||||
| 2025-08-13 | 13F | Smith, Moore & Co. | 27.836 | -21,26 | 1.648 | -16,73 | ||||
| 2025-08-07 | 13F | Meridian Financial Partners LLC | 285.065 | 8,81 | 17 | 14,29 | ||||
| 2025-08-18 | 13F/A | National Bank Of Canada /fi/ | 37.388 | -15,92 | 2.214 | -10,87 | ||||
| 2025-08-14 | 13F | Ruggaard & Associates LLC | 28.071 | -11,86 | 1.662 | -6,73 | ||||
| 2025-05-12 | 13F | Citigroup Inc | 0 | -100,00 | 0 | |||||
| 2025-08-13 | 13F | Northwestern Mutual Wealth Management Co | 258.682 | 17,29 | 15.317 | 24,06 | ||||
| 2025-08-14 | 13F | Fmr Llc | 303 | 604,65 | 18 | 750,00 | ||||
| 2025-07-21 | 13F | Greenwood Capital Associates Llc | 18.489 | 20,45 | 1.095 | 27,36 | ||||
| 2025-08-04 | 13F | Center for Financial Planning, Inc. | 1.223 | 0,00 | 72 | 5,88 | ||||
| 2025-08-07 | 13F | Kestra Private Wealth Services, Llc | 18.097 | 15,81 | 1.072 | 22,54 | ||||
| 2025-07-30 | 13F | Wbh Advisory Inc | 19.148 | 1.134 | ||||||
| 2025-08-14 | 13F | Royal Bank Of Canada | 155.929 | 4,05 | 9.232 | 10,04 | ||||
| 2025-07-24 | 13F | Eastern Bank | 0 | -100,00 | 0 | |||||
| 2025-08-14 | 13F | McIlrath & Eck, LLC | 15 | 0,00 | 1 | |||||
| 2025-07-21 | 13F | Ameritas Advisory Services, LLC | 916 | 54 | ||||||
| 2025-08-06 | 13F | Atlas Legacy Advisors, LLC | 45.021 | 6,79 | 2.666 | 10,03 | ||||
| 2025-07-28 | 13F | CGC Financial Services, LLC | 368.650 | 5,55 | 21.828 | 11,64 | ||||
| 2025-08-14 | 13F | Susquehanna International Group, Llp | 0 | -100,00 | 0 | |||||
| 2025-08-14 | 13F | UBS Group AG | 50.255 | -18,13 | 2.976 | -13,42 | ||||
| 2025-07-17 | 13F | Fifth Third Securities, Inc. | 41.172 | 17,12 | 2.438 | 23,89 | ||||
| 2025-04-23 | 13F | Valicenti Advisory Services Inc | 0 | -100,00 | 0 | |||||
| 2025-08-14 | 13F | Ameriprise Financial Inc | 56.348 | -6,12 | 3.336 | -0,71 | ||||
| 2025-08-14 | 13F | Wiley Bros.-aintree Capital, Llc | 12.182 | 6,96 | 731 | 15,30 | ||||
| 2025-08-14 | 13F | Wells Fargo & Company/mn | 0 | 0 | ||||||
| 2025-07-08 | 13F | Legacy Private Trust Co. | 89.163 | 418,87 | 5.279 | 449,32 | ||||
| 2025-07-28 | 13F | Harbour Investments, Inc. | 195 | 10,17 | 12 | 22,22 | ||||
| 2025-07-29 | 13F | Harbor Asset Planning, Inc. | 8.746 | 518 | ||||||
| 2025-04-21 | 13F | MN Wealth Advisors, LLC | 0 | -100,00 | 0 | |||||
| 2025-08-13 | 13F | Balance Wealth, LLC | 0 | -100,00 | 0 | |||||
| 2025-07-09 | 13F | Triumph Capital Management | 0 | -100,00 | 0 | |||||
| 2025-07-17 | 13F | Wagner Wealth Management, Llc | 387.521 | 6,02 | 22.945 | 12,15 | ||||
| 2025-08-05 | 13F | Strategic Financial Concepts, LLC | 0 | -100,00 | 0 | |||||
| 2025-07-25 | 13F | Concord Wealth Partners | 341 | 2,71 | 20 | 11,11 | ||||
| 2025-08-05 | 13F | Flynn Zito Capital Management, Llc | 108.351 | 2,39 | 6.415 | 8,29 | ||||
| 2025-08-08 | 13F | Cetera Investment Advisers | 579.860 | 13,85 | 34.333 | 20,42 | ||||
| 2025-08-11 | 13F | Western Wealth Management, LLC | 10.524 | 8,45 | 623 | 14,73 | ||||
| 2025-07-25 | 13F | Northwest Capital Management Inc | 4.826 | 22,96 | 286 | 30,14 | ||||
| 2025-08-05 | 13F | Crestwood Advisors Group LLC | 859.938 | -24,33 | 50.917 | -19,97 | ||||
| 2025-07-25 | 13F | Hazlett, Burt & Watson, Inc. | 1.885 | 0,00 | 0 | |||||
| 2025-08-07 | 13F | PCG Wealth Advisors, LLC | 0 | -100,00 | 0 | |||||
| 2025-08-14 | 13F | Great Valley Advisor Group, Inc. | 845.752 | 22,45 | 50.077 | 29,51 | ||||
| 2025-08-15 | 13F | Equitable Holdings, Inc. | 52.710 | 17,10 | 3.121 | 23,86 | ||||
| 2025-08-04 | 13F | MeadowBrook Investment Advisors LLC | 0 | -100,00 | 0 | |||||
| 2025-08-04 | 13F | Pensionmark Financial Group, Llc | 5.514 | -1,27 | 326 | 4,49 | ||||
| 2025-08-13 | 13F | Jones Financial Companies Lllp | 288.256 | 41,50 | 17.073 | 50,40 | ||||
| 2025-08-15 | 13F | Tower Research Capital LLC (TRC) | 25.725 | 1.523 | ||||||
| 2025-08-11 | 13F | HighTower Advisors, LLC | 6.119 | -14,94 | 362 | -9,95 | ||||
| 2025-08-12 | 13F | CIBC Private Wealth Group, LLC | 1.535 | 0,00 | 91 | 20,00 | ||||
| 2025-08-13 | 13F | Capital Advisors Wealth Management, LLC | 5.133 | 16,66 | 304 | 23,17 | ||||
| 2025-07-24 | 13F | IFP Advisors, Inc | 913 | 18,11 | 54 | 25,58 | ||||
| 2025-08-12 | 13F | Barnes Pettey Financial Advisors, Llc | 12.811 | 759 | ||||||
| 2025-07-25 | 13F | Envestnet Portfolio Solutions, Inc. | 0 | -100,00 | 0 | |||||
| 2025-08-14 | 13F | Vienna Asset Management LLC | 0 | -100,00 | 0 | |||||
| 2025-07-31 | 13F | B & T Capital Management DBA Alpha Capital Management | 197.209 | -3,41 | 11.677 | 2,16 | ||||
| 2025-07-09 | 13F | Breakwater Capital Group | 0 | -100,00 | 0 | -100,00 | ||||
| 2025-07-21 | 13F | Ashton Thomas Securities, Llc | 28.823 | -18,22 | 1.707 | -13,49 | ||||
| 2025-07-31 | 13F | Oak Harbor Wealth Partners, Llc | 17.227 | 16,23 | 1.020 | 23,04 | ||||
| 2025-07-21 | 13F | Ameriflex Group, Inc. | 0 | -100,00 | 0 | |||||
| 2025-07-25 | 13F | Atria Wealth Solutions, Inc. | 0 | -100,00 | 0 | |||||
| 2025-08-13 | 13F | Elios Financial Group Inc. | 7.543 | 15,74 | 447 | 22,53 | ||||
| 2025-08-06 | 13F | Stone House Investment Management, LLC | 3.246 | 369,75 | 192 | 405,26 | ||||
| 2025-03-18 | 13F/A | Bank Of America Corp /de/ | 0 | -100,00 | 0 | |||||
| 2025-07-07 | 13F | Modus Advisors, LLC | 0 | -100,00 | 0 | |||||
| 2025-07-07 | 13F | Thurston, Springer, Miller, Herd & Titak, Inc. | 38 | 0,00 | 2 | 0,00 | ||||
| 2025-08-14 | 13F | Citadel Advisors Llc | 69.098 | 13,24 | 4.091 | 19,80 | ||||
| 2025-07-10 | 13F | Wealth Enhancement Advisory Services, Llc | 61.922 | -5,38 | 3.777 | 3,08 | ||||
| 2025-04-16 | 13F | Twin Peaks Wealth Advisors, LLC | 0 | -100,00 | 0 | |||||
| 2025-08-08 | 13F | Avantax Advisory Services, Inc. | 49.854 | 46,52 | 2.952 | 54,99 | ||||
| 2025-08-08 | 13F | Thoroughbred Financial Services, Llc | 0 | -100,00 | 0 | |||||
| 2025-07-25 | 13F | Cwm, Llc | 463.991 | 4,65 | 27 | 12,50 | ||||
| 2025-05-12 | 13F | Independent Advisor Alliance | 0 | -100,00 | 0 | |||||
| 2025-08-08 | 13F | Capital Investment Advisory Services, LLC | 53 | 60,61 | 3 | 200,00 | ||||
| 2025-07-29 | 13F | Private Trust Co Na | 5.268 | -4,48 | 312 | 0,97 | ||||
| 2025-08-12 | 13F | LPL Financial LLC | 1.976.433 | 12,98 | 117.025 | 19,50 | ||||
| 2025-07-16 | 13F | Strategic Investment Solutions, Inc. /IL | 216 | 0,00 | 13 | 0,00 | ||||
| 2025-08-08 | 13F | Creative Planning | 6.936 | 0,78 | 411 | 6,49 | ||||
| 2025-07-11 | 13F | Farther Finance Advisors, LLC | 409 | 24 | ||||||
| 2025-08-01 | 13F | Envestnet Asset Management Inc | 140.176 | 12,78 | 8.300 | 19,27 | ||||
| 2025-08-08 | 13F | Pnc Financial Services Group, Inc. | 0 | -100,00 | 0 | |||||
| 2025-08-26 | NP | ONCFX - JPMorgan Investor Conservative Growth Fund Class I | 623.255 | 3,61 | 36.903 | 9,59 | ||||
| 2025-07-25 | 13F | We Are One Seven, LLC | 8.083 | 1,67 | 479 | 7,42 | ||||
| 2025-08-14 | 13F | Raymond James Financial Inc | 408.759 | 18,20 | 24.203 | 25,02 | ||||
| 2025-07-21 | 13F | Triad Wealth Partners, LLC | 6.289 | -35,48 | 372 | -31,74 |