Grundlæggende statistik
| Institutionelle aktier (lange) | 193.297.741 - 52,72% (ex 13D/G) - change of -6,58MM shares -3,29% MRQ |
| Institutionel værdi (lang) | $ 8.367.872 USD ($1000) |
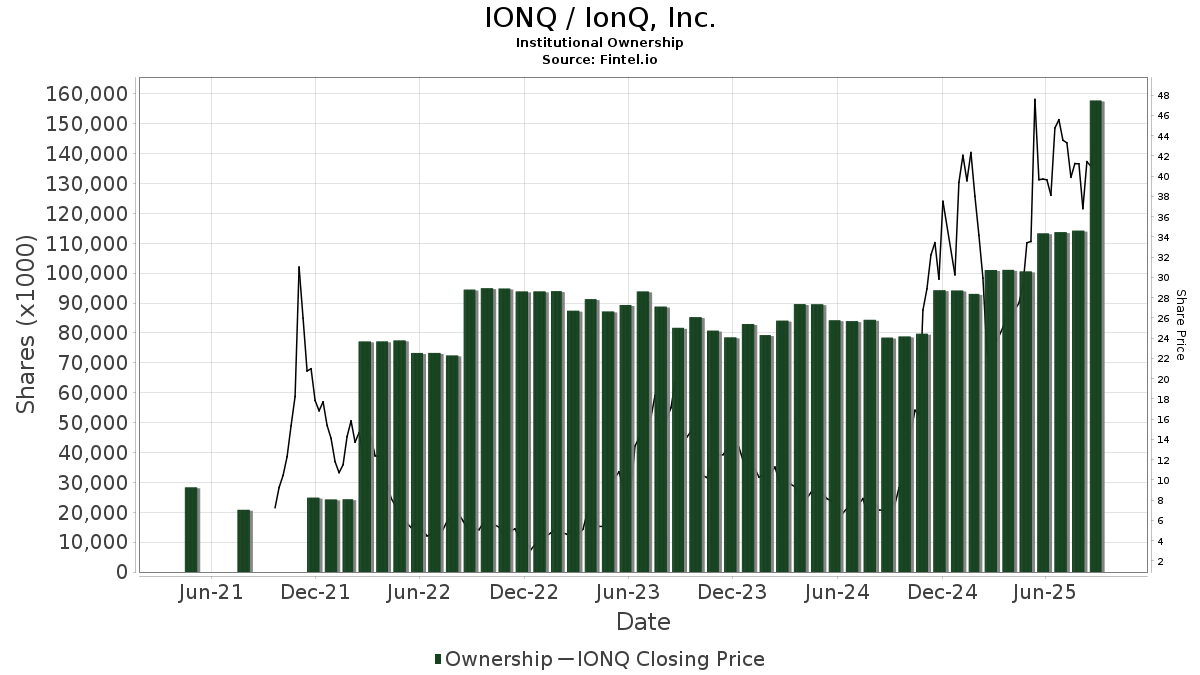
Institutionelt ejerskab og aktionærer
IonQ, Inc. (US:IONQ) har 687 institutionelle ejere og aktionærer, der har indsendt 13D/G- eller 13F-formularer til Securities Exchange Commission (SEC). Disse institutioner har i alt 193,297,741 aktier. Største aktionærer omfatter Vanguard Group Inc, BlackRock, Inc., Morgan Stanley, State Street Corp, Geode Capital Management, Llc, Susquehanna International Group, Llp, Norges Bank, UBS Group AG, Susquehanna International Group, Llp, and Marex Group plc .
IonQ, Inc. (NYSE:IONQ) institutionel ejerskabsstruktur viser aktuelle positioner i virksomheden efter institutioner og fonde, samt seneste ændringer i positionsstørrelse. Større aktionærer kan omfatte individuelle investorer, investeringsforeninger, hedgefonde eller institutioner. Skema 13D angiver, at investoren besidder (eller besidder) mere end 5 % af virksomheden og har til hensigt (eller har til hensigt at) aktivt at forfølge en ændring i forretningsstrategi. Skema 13G indikerer en passiv investering på over 5%.
The share price as of April 2, 2026 is 29,30 / share. Previously, on April 7, 2025, the share price was 22,75 / share. This represents an increase of 28,79% over that period.
Fondens stemningsscore
Fund Sentiment Score (fka Ownership Accumulation Score) finder de aktier, der bliver mest købt af fonde. Det er resultatet af en sofistikeret, multi-faktor kvantitativ model, der identificerer virksomheder med de højeste niveauer af institutionel akkumulering. Scoringsmodellen bruger en kombination af den samlede stigning i oplyste ejere, ændringerne i porteføljeallokeringer i disse ejere og andre målinger. Tallet går fra 0 til 100, hvor højere tal indikerer et højere niveau af akkumulering for sine jævnaldrende, og 50 er gennemsnittet.
Opdateringsfrekvens: Dagligt
Se Ownership Explorer, som giver en liste over højest rangerende virksomheder.
AI+ Ask Fintel’s AI assistant about IonQ, Inc..
Select a question to share a public post with an AI-crafted answer.
Thinking of good questions…
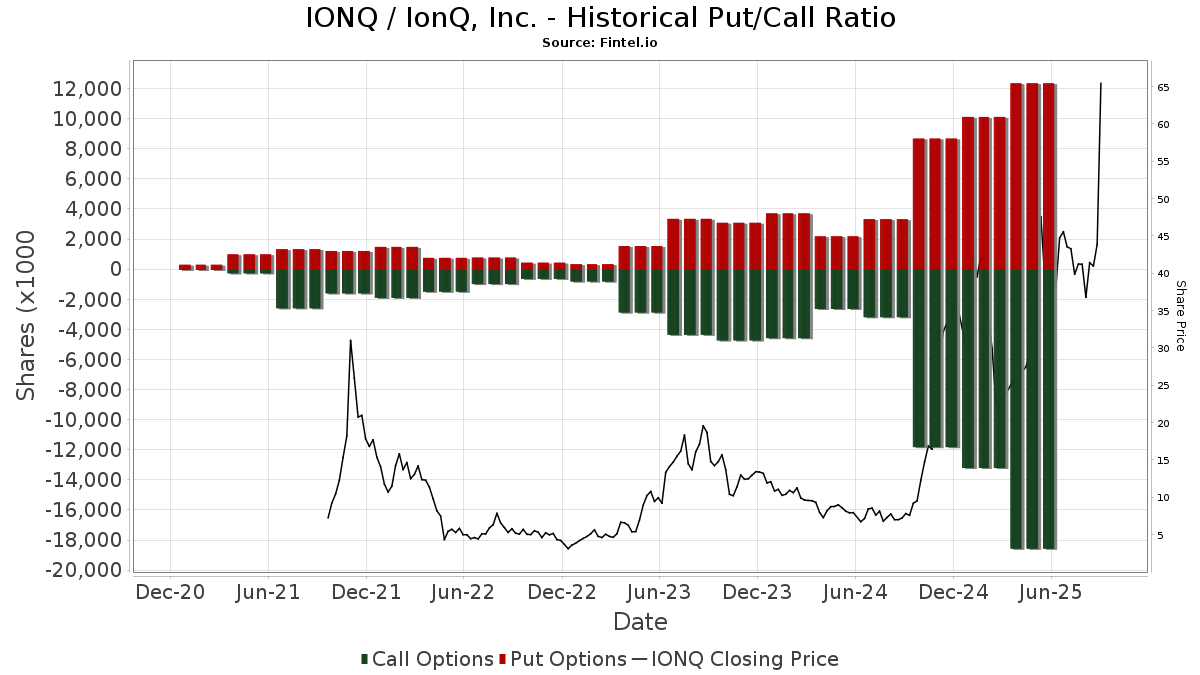
Institutionel Put/Call-forhold
Ud over at indberette standardaktie- og gældsudstedelser skal institutter med mere end 100 mill. aktiver under forvaltning også oplyse deres put- og call-optionsbeholdninger. Da salgsoptioner generelt indikerer negativ stemning, og købsoptioner indikerer positiv stemning, kan vi få en fornemmelse af den overordnede institutionelle stemning ved at plotte forholdet mellem put og kald. Diagrammet til højre viser det historiske put/call-forhold for dette instrument.
Brug af Put/Call Ratio som en indikator for investorernes stemning overvinder en af de vigtigste mangler ved at bruge totalt institutionelt ejerskab, som er, at en betydelig mængde af aktiver under forvaltning investeres passivt for at spore indekser. Passivt forvaltede fonde køber typisk ikke optioner, så indikatoren for put/call-forholdet følger mere nøje følelsen af aktivt forvaltede fonde.
13D/G-arkivering
Vi præsenterer 13D/G ansøgninger separat fra 13F ansøgninger på grund af den forskellige behandling af SEC. 13D/G-ansøgninger kan indgives af grupper af investorer (med én ledende), hvorimod 13F-ansøgninger ikke kan. Dette resulterer i situationer, hvor en investor kan indsende en 13D/G, der rapporterer én værdi for de samlede aktier (der repræsenterer alle de aktier, der ejes af investorgruppen), men derefter indsender en 13F, der rapporterer en anden værdi for de samlede aktier (der udelukkende repræsenterer deres egne) ejendomsret). Det betyder, at aktieejerskab af 13D/G-arkiver og 13F-arkiveringer ofte ikke er direkte sammenlignelige, så vi præsenterer dem separat.
Bemærk: Fra den 16. maj 2021 viser vi ikke længere ejere, der ikke har indsendt en 13D/G inden for det seneste år. Tidligere viste vi den fulde historie af 13D/G-arkiver. Generelt skal enheder, der er forpligtet til at indgive 13D/G-ansøgninger, indgive mindst årligt, før de indsender en afsluttende ansøgning. Dog forlader fonde nogle gange positioner uden at indsende en afsluttende ansøgning (dvs. de afvikler), så visning af den fulde historie resulterede nogle gange i forvirring om det nuværende ejerskab. For at undgå forvirring viser vi nu kun 'aktuelle' ejere - det vil sige - ejere, der har anmeldt inden for det seneste år.
Upgrade to unlock premium data.
| Fil dato | Form | Investor | Forrige Aktier |
Seneste Aktier |
Δ Aktier (Procent) |
Ejendomsret (Procent) |
Δ Ejerskab (Procent) |
|
|---|---|---|---|---|---|---|---|---|
| 2026-02-12 | MORGAN STANLEY | 18,640,847 | 17,092,900 | -8.30 | 4.80 | -32.39 | ||
| 2026-01-21 | BlackRock, Inc. | 15,110,462 | 27,763,822 | 83.74 | 7.80 | 23.81 |
13F og NPORT arkivering
Detaljer om 13F-arkivering er gratis. Detaljer om NP-ansøgninger kræver et premium-medlemskab. Grønne rækker angiver nye positioner. Røde rækker angiver lukkede positioner. Klik på linket ikon for at se den fulde transaktionshistorik.
Opgrader
for at låse premium-data op og eksportere til Excel ![]() .
.
Important Note
In an effort to reduce load times for our mobile users, we are testing some ways to deliver lighter pages.
In this first test, we will deliver only the most recent 750 transactions (out of 909 for this stock). If you are interested in loading *all* the transactions for this company, click the "load all" button below. This is just a test and if you don't like it, please let us know by submitting some gentle feedback via the link at the bottom of this page.
Load All| Fil dato | Kilde | Investor | Type | Gennemsnitlig pris (Øst) |
Aktier | Δ Aktier (%) |
Rapporteret Værdi ($1000) |
Δ Værdi (%) |
Port Alloc (%) |
|
|---|---|---|---|---|---|---|---|---|---|---|
| 2026-01-26 | 13F | Cwm, Llc | 7.726 | -6,48 | 0 | |||||
| 2026-02-09 | 13F | Huntington National Bank | 2.120 | -18,93 | 95 | -40,62 | ||||
| 2026-02-06 | 13F | EverSource Wealth Advisors, LLC | 303 | -84,26 | 14 | -88,98 | ||||
| 2026-02-03 | 13F | Redwood Wealth Management Group, LLC | 5.518 | -1,25 | 248 | -27,99 | ||||
| 2026-02-11 | 13F | Tradition Wealth Management, LLC | 6.406 | 10,13 | 287 | -19,61 | ||||
| 2026-02-17 | 13F | DV Trading LLC | 941 | 42 | ||||||
| 2026-02-09 | 13F | Harbour Investments, Inc. | 8.976 | 15,52 | 403 | -15,72 | ||||
| 2026-02-13 | 13F | Delos Wealth Advisors, LLC | 76 | 3 | ||||||
| 2026-01-21 | 13F | Future Financial Wealth Managment LLC | 0 | -100,00 | 0 | -100,00 | ||||
| 2026-02-12 | 13F | Skandinaviska Enskilda Banken AB (publ) | 65.960 | 2.961 | ||||||
| 2026-02-17 | 13F | Mercer Global Advisors Inc /adv | 24.790 | -14,67 | 1.112 | -37,74 | ||||
| 2026-02-05 | 13F | Tucker Asset Management Llc | 1.918 | 86 | ||||||
| 2026-01-20 | 13F | Toth Financial Advisory Corp | 200 | 100,00 | 9 | 33,33 | ||||
| 2026-01-23 | 13F | Sumitomo Mitsui Trust Holdings, Inc. | 572.251 | 25.677 | ||||||
| 2026-02-12 | 13F | BRYN MAWR TRUST Co | 1.000 | 0,00 | 45 | -27,87 | ||||
| 2026-02-11 | 13F | Fjarde Ap-fonden /fourth Swedish National Pension Fund | 63.900 | 2.867 | ||||||
| 2026-02-13 | 13F | Walleye Capital LLC | Call | 108.300 | -29,26 | 4.859 | -48,39 | |||
| 2026-01-12 | 13F | Daymark Wealth Partners, Llc | 8.609 | -18,83 | 386 | -40,80 | ||||
| 2026-02-13 | 13F | Walleye Capital LLC | Put | 73.900 | -68,53 | 3.316 | -77,04 | |||
| 2026-02-13 | 13F | Walleye Capital LLC | 6.249 | 403,95 | 280 | 268,42 | ||||
| 2026-02-13 | 13F | Edgestream Partners, L.P. | 0 | -100,00 | 0 | -100,00 | ||||
| 2026-02-04 | 13F | HighPoint Advisor Group LLC | 10.080 | 8,03 | 452 | -21,12 | ||||
| 2026-02-06 | 13F | Leonteq Securities AG | 43.013 | 165,02 | 1.930 | 93,29 | ||||
| 2026-02-17 | 13F | Brevan Howard Capital Management LP | 23.312 | -87,55 | 1.046 | -90,92 | ||||
| 2026-02-12 | 13F | Intesa Sanpaolo Wealth Management | 200 | 9 | ||||||
| 2026-02-02 | 13F | Benjamin Edwards Inc | 58.412 | -0,32 | 2.621 | -27,28 | ||||
| 2026-01-28 | 13F | Proathlete Wealth Management Llc | 36 | 0,00 | 2 | -50,00 | ||||
| 2026-02-05 | 13F | Bank Julius Baer & Co. Ltd, Zurich | 4.206 | 412,93 | 189 | 276,00 | ||||
| 2026-02-11 | 13F | O'shaughnessy Asset Management, Llc | 12.536 | 12,66 | 562 | -17,84 | ||||
| 2026-02-13 | 13F | Smartleaf Asset Management LLC | 1.921 | 73,06 | 87 | 22,54 | ||||
| 2026-02-05 | 13F | Owen LaRue, LLC | 8.740 | -88,55 | 392 | -91,65 | ||||
| 2026-01-30 | 13F | Sigma Planning Corp | 10.183 | -35,46 | 457 | -52,99 | ||||
| 2026-01-15 | 13F | Fortitude Family Office, LLC | 624 | 3.800,00 | 28 | |||||
| 2026-02-13 | 13F | Rhumbline Advisers | 494.284 | 13,66 | 22.178 | -17,07 | ||||
| 2025-11-14 | 13F | Wolverine Trading, Llc | 48.243 | -56,31 | 3.100 | -30,24 | ||||
| 2025-11-14 | 13F | Wolverine Trading, Llc | Call | 1.060.000 | 7,36 | 68.116 | 71,41 | |||
| 2025-11-14 | 13F | Wolverine Trading, Llc | Put | 648.000 | 33,83 | 41.640 | 113,66 | |||
| 2026-01-09 | 13F | SG Americas Securities, LLC | 8.727 | -77,17 | 0 | -100,00 | ||||
| 2026-02-17 | 13F | Polar Capital Holdings Plc | 0 | -100,00 | 0 | -100,00 | ||||
| 2026-02-17 | 13F | TCG Advisory Services, LLC | 6.632 | 12,05 | 298 | -18,41 | ||||
| 2026-02-10 | 13F/A | Northwestern Mutual Wealth Management Co | 3.410 | 124,19 | 153 | 64,52 | ||||
| 2026-01-13 | 13F | Mayflower Financial Advisors, LLC | 0 | -100,00 | 0 | -100,00 | ||||
| 2025-11-12 | 13F | 111 Capital | 0 | -100,00 | 0 | -100,00 | ||||
| 2026-01-28 | 13F | Geneos Wealth Management Inc. | 355 | 0,00 | 16 | -28,57 | ||||
| 2026-02-12 | 13F | Hm Payson & Co | 100 | 4 | ||||||
| 2026-01-30 | 13F | Keybank National Association/oh | 5.434 | 16,63 | 244 | -15,03 | ||||
| 2026-02-03 | 13F | Coston, McIsaac & Partners | 8 | 0,00 | 0 | |||||
| 2026-02-13 | 13F | National Bank Of Canada /fi/ | 18.216 | 57,35 | 817 | 14,77 | ||||
| 2026-02-09 | 13F | SLT Holdings LLC | 4.460 | -70,39 | 200 | -78,40 | ||||
| 2026-02-11 | 13F | Los Angeles Capital Management Llc | 43.192 | 11,69 | 2.599 | 9,25 | ||||
| 2026-02-04 | 13F | Swiss Life Asset Management Ltd | 19.662 | 64,88 | 882 | 20,33 | ||||
| 2026-02-04 | 13F | First Foundation Advisors | 5.025 | -49,88 | 225 | -63,47 | ||||
| 2026-02-09 | 13F | Arista Wealth Management, LLC | 8.043 | 361 | ||||||
| 2026-02-13 | 13F | Wells Fargo & Company/mn | 707.154 | 46,62 | 31.730 | 6,97 | ||||
| 2026-01-26 | 13F | Ckw Financial Group | 301 | 0,00 | 0 | |||||
| 2026-02-10 | 13F | Impact Partnership Wealth, LLC | 4.942 | 222 | ||||||
| 2026-01-30 | 13F | Levin Capital Strategies, L.p. | 16.250 | 0,00 | 729 | -27,03 | ||||
| 2026-02-11 | 13F | Prestige Wealth Management Group LLC | 7 | 0,00 | 0 | |||||
| 2026-01-23 | 13F | Optima Capital Llc | 13 | 1 | ||||||
| 2026-02-13 | 13F | Itau Unibanco Holding S.A. | 58.000 | 2.628 | ||||||
| 2026-01-20 | 13F | Nvwm, Llc | 200 | 0,00 | 9 | -33,33 | ||||
| 2026-02-24 | 13F | Bell Investment Advisors, Inc | 21 | 0,00 | 1 | -100,00 | ||||
| 2026-03-20 | 13F/A | Hsbc Holdings Plc | Put | 100 | 5 | |||||
| 2026-03-20 | 13F/A | Hsbc Holdings Plc | 165.524 | 1.209,53 | 7.488 | 858,77 | ||||
| 2026-02-13 | 13F | Manufacturers Life Insurance Company, The | 0 | -100,00 | 0 | |||||
| 2026-02-05 | 13F | Td Private Client Wealth Llc | 55 | -11,29 | 2 | -33,33 | ||||
| 2026-01-27 | 13F | TD Waterhouse Canada Inc. | 6.062 | 250,40 | 272 | 149,54 | ||||
| 2026-02-17 | 13F | Parallax Volatility Advisers, L.P. | Call | 495.400 | 73,82 | 22.229 | 26,82 | |||
| 2026-02-17 | 13F | Parallax Volatility Advisers, L.P. | Put | 495.000 | 19,28 | 22.211 | -12,98 | |||
| 2026-01-29 | 13F | UBS Group AG | Call | 59.822 | 125,74 | 2.684 | 64,76 | |||
| 2026-02-13 | 13F | Acumen Wealth Advisors, LLC | 200 | 9 | ||||||
| 2026-01-29 | 13F | UBS Group AG | 4.224.205 | -1,80 | 189.540 | -28,35 | ||||
| 2026-02-09 | 13F | Investors Portfolio Services LLC | 50 | 2 | ||||||
| 2026-02-10 | 13F | Quantbot Technologies LP | 0 | -100,00 | 0 | |||||
| 2026-02-11 | 13F | Deutsche Bank Ag\ | 1.216.153 | 56,44 | 54.569 | 14,13 | ||||
| 2026-02-03 | 13F | Asset Planning,Inc | 40 | 0,00 | 2 | -50,00 | ||||
| 2026-02-05 | 13F | Triton Wealth Management, PLLC | 12.510 | -0,53 | 468 | -40,05 | ||||
| 2026-02-17 | 13F | EFG International AG | 38.917 | 1.747 | ||||||
| 2026-02-12 | 13F | Federated Hermes, Inc. | 146.057 | -37,54 | 6.554 | -54,43 | ||||
| 2026-02-12 | 13F | Gould Capital, LLC | 410 | 17,14 | 18 | -14,29 | ||||
| 2026-02-13 | 13F | Morgan Stanley | 19.566.831 | -25,72 | 877.964 | -45,80 | ||||
| 2026-02-12 | 13F | Groupe la Francaise | 0 | -100,00 | 0 | -100,00 | ||||
| 2025-11-12 | 13F | Creekmur Asset Management LLC | 2.226 | 137 | ||||||
| 2026-02-12 | 13F | California Public Employees Retirement System | 562.839 | 22,22 | 25.255 | -10,83 | ||||
| 2026-02-06 | 13F | Princeton Capital Management Llc | 13.064 | 4,06 | 586 | -24,09 | ||||
| 2026-01-27 | 13F | Sterling Investment Counsel, LLC | 5.855 | 34,14 | 263 | -2,24 | ||||
| 2026-02-13 | 13F | Ubs Asset Management Americas Inc | 1.082.819 | 128,27 | 48.586 | 66,54 | ||||
| 2026-01-22 | 13F | Vision Financial Markets Llc | 4 | -96,00 | 0 | -100,00 | ||||
| 2026-02-17 | 13F | Canada Pension Plan Investment Board | 154.100 | 5.607,41 | 6.914 | 4.065,06 | ||||
| 2026-01-12 | 13F | Traynor Capital Management, Inc. | Call | 2.000 | 90 | |||||
| 2026-01-08 | 13F | Versant Capital Management, Inc | 1.411 | 1,22 | 63 | -25,88 | ||||
| 2026-01-12 | 13F | Traynor Capital Management, Inc. | 6.259 | 83,76 | 281 | 33,97 | ||||
| 2026-01-13 | 13F | CoreCap Advisors, LLC | 3.666 | 3,94 | 164 | -24,07 | ||||
| 2026-01-28 | 13F | Kingswood Wealth Advisors, Llc | 8.609 | -36,43 | 386 | -53,61 | ||||
| 2026-02-02 | 13F | Bay Harbor Wealth Management, LLC | 1 | 0 | ||||||
| 2026-02-06 | 13F | Pnc Financial Services Group, Inc. | 14.124 | 26,50 | 634 | -7,73 | ||||
| 2026-02-10 | 13F | Nomura Asset Management Co Ltd | 93.870 | 4.212 | ||||||
| 2026-02-17 | 13F | Delaware Management Holdings, Inc. | 734.904 | 32.975 | ||||||
| 2026-02-06 | 13F | Global Retirement Partners, LLC | 22.221 | 25,06 | 997 | -8,70 | ||||
| 2026-01-23 | 13F | Carnegie Capital Asset Management, LLC | 298.959 | 11,26 | 13.414 | -18,83 | ||||
| 2026-01-21 | 13F | Capital Advisors, Ltd. LLC | 8 | 14,29 | 0 | |||||
| 2026-02-13 | 13F | Aire Advisors, Llc | 60.000 | -0,05 | 2.692 | -27,07 | ||||
| 2025-11-04 | 13F | Lisanti Capital Growth, LLC | 0 | -100,00 | 0 | -100,00 | ||||
| 2026-01-22 | 13F | Kennebec Savings Bank | 70 | 0,00 | 3 | -25,00 | ||||
| 2026-01-22 | 13F | V-Square Quantitative Management LLC | 5.038 | 226 | ||||||
| 2026-02-17 | 13F | Nomura Holdings Inc | 160.880 | 7.219 | ||||||
| 2026-02-13 | 13F | SRS Capital Advisors, Inc. | 2.812 | 38,39 | 126 | 1,61 | ||||
| 2026-02-17 | 13F | Nomura Holdings Inc | Call | 323.400 | -63,83 | 14.511 | -73,61 | |||
| 2026-02-11 | 13F | Prudential Plc | 9.867 | 443 | ||||||
| 2026-02-10 | 13F | Eurizon Capital SGR S.p.A. | 289.857 | 13.007 | ||||||
| 2026-02-17 | 13F | Warren Averett Asset Management, LLC | 9.322 | 51,06 | 418 | 10,29 | ||||
| 2026-02-11 | 13F | Axiom International Investors Llc /de | 140.677 | -33,29 | 6.312 | -51,33 | ||||
| 2026-02-17 | 13F | Perritt Capital Management Inc | 0 | -100,00 | 0 | |||||
| 2026-02-13 | 13F | Caitong International Asset Management Co., Ltd | 1.015 | -98,85 | 46 | -99,17 | ||||
| 2026-01-27 | 13F | WealthCollab, LLC | 300 | 13 | ||||||
| 2026-01-29 | 13F | Comerica Bank | 44.326 | -54,38 | 1.989 | -66,73 | ||||
| 2026-01-28 | 13F | Klp Kapitalforvaltning As | 110.900 | 102,74 | 4.976 | 47,92 | ||||
| 2026-02-17 | 13F | Nomura Holdings Inc | Put | 914.800 | 41.047 | |||||
| 2026-02-13 | 13F | QVT Financial LP | 0 | -100,00 | 0 | -100,00 | ||||
| 2026-02-17 | 13F | Royal Bank Of Canada | 333.945 | -17,20 | 14.985 | -39,59 | ||||
| 2026-01-16 | 13F | Mirabaud & Cie SA | 0 | -100,00 | 0 | -100,00 | ||||
| 2026-02-09 | 13F | Prospera Financial Services Inc | 38.796 | -11,79 | 1.741 | -35,65 | ||||
| 2026-02-06 | 13F | ProShare Advisors LLC | 62.184 | 30,31 | 2.790 | -4,91 | ||||
| 2026-02-14 | 13F | POM Investment Strategies, LLC | 2.491 | 16,35 | 112 | -15,27 | ||||
| 2026-02-17 | 13F | Man Group plc | 145.039 | -39,01 | 6.508 | -55,51 | ||||
| 2026-02-02 | 13F | Aurora Private Wealth, Inc. | 10.111 | 0,00 | 0 | |||||
| 2026-02-11 | 13F | Vestcor Inc | 6.024 | 0 | ||||||
| 2026-01-27 | 13F | First Horizon Corp | 264 | 144,44 | 12 | 83,33 | ||||
| 2026-01-29 | 13F | D.a. Davidson & Co. | 8.332 | -70,42 | 374 | -78,46 | ||||
| 2026-02-17 | 13F | Creative Planning | 173.611 | 18,61 | 7.790 | -13,47 | ||||
| 2026-02-11 | 13F | Janney Montgomery Scott LLC | 38.333 | 8,64 | 2 | -50,00 | ||||
| 2026-02-12 | 13F | IFC & Insurance Marketing, Inc. | 25 | 0 | ||||||
| 2026-01-23 | 13F | State of Alaska, Department of Revenue | 1.360 | 0 | ||||||
| 2026-02-09 | 13F | Hartline Investment Corp/ | 0 | -100,00 | 0 | -100,00 | ||||
| 2026-01-12 | 13F | Kozak & Associates, Inc. | 300 | 50,00 | 15 | 55,56 | ||||
| 2026-01-12 | 13F | Contravisory Investment Management, Inc. | 305 | -15,04 | 14 | -40,91 | ||||
| 2026-01-16 | 13F | Banque Pictet & Cie Sa | 30.000 | 0,00 | 1.346 | -27,05 | ||||
| 2026-02-11 | 13F | Commonwealth Retirement Investments LLC | 1 | 0 | ||||||
| 2026-02-02 | 13F | Chapman Financial Group, Llc | 32 | 1 | ||||||
| 2026-01-23 | 13F | Valley National Advisers Inc | 200 | 0 | ||||||
| 2026-01-16 | 13F | StoneCrest Wealth Management, Inc. | 0 | -100,00 | 0 | |||||
| 2025-10-24 | 13F | Hemington Wealth Management | 903 | 0,00 | 0 | |||||
| 2026-02-17 | 13F | Ballast Financial Advisors LLC | 10.000 | 449 | ||||||
| 2026-02-17 | 13F | Cantor Fitzgerald, L. P. | Call | 350.000 | -64,29 | 15.704 | -73,94 | |||
| 2026-02-17 | 13F | Cantor Fitzgerald, L. P. | Put | 1.875.000 | 132,92 | 84.131 | 69,94 | |||
| 2025-11-13 | 13F | Twin Tree Management, LP | Call | 0 | -100,00 | 0 | -100,00 | |||
| 2026-02-17 | 13F | Cantor Fitzgerald, L. P. | 1.965.274 | 406,40 | 88.182 | 269,47 | ||||
| 2026-02-18 | 13F | Mackenzie Financial Corp | 46.182 | 134,89 | 2.088 | 72,70 | ||||
| 2026-02-06 | 13F | Berbice Capital Management LLC | 725 | 0,00 | 33 | -27,27 | ||||
| 2026-01-06 | 13F | Nelson, Van Denburg & Campbell Wealth Management Group, LLC | 8.786 | 59,48 | 394 | 16,57 | ||||
| 2026-01-29 | 13F | Veracity Capital LLC | 15.314 | 74,72 | 687 | 27,46 | ||||
| 2026-01-30 | 13F | Laurel Wealth Advisors LLC | 2 | 0 | ||||||
| 2026-02-13 | 13F | Public Employees Retirement Association Of Colorado | 29.592 | 39,51 | 1 | 0,00 | ||||
| 2026-02-17 | 13F | Defiance ETFs, LLC | 772.974 | 35.023 | ||||||
| 2026-02-17 | 13F | Snowden Capital Advisors LLC | 18.355 | 14,60 | 824 | -16,45 | ||||
| 2026-02-13 | 13F | Polymer Capital Management (HK) LTD | 0 | -100,00 | 0 | -100,00 | ||||
| 2026-01-12 | 13F | Salem Investment Counselors Inc | 0 | -100,00 | 0 | -100,00 | ||||
| 2026-04-02 | 13F | Ares Financial Consulting, LLC | 144 | 4 | ||||||
| 2026-01-21 | 13F | Albion Financial Group /ut | 1.000 | 0,00 | 45 | -27,87 | ||||
| 2026-01-22 | 13F | Ridgecrest Wealth Partners, Llc | 8.083 | -44,37 | 363 | -59,46 | ||||
| 2026-02-10 | 13F | Yukon Wealth Management, Inc. | 0 | -100,00 | 0 | -100,00 | ||||
| 2026-02-06 | 13F | Mach-1 Financial Group, Inc. | 0 | -100,00 | 0 | -100,00 | ||||
| 2026-02-17 | 13F | Fred Alger Management, Llc | 315.967 | 0,00 | 14.177 | -27,04 | ||||
| 2026-02-13 | 13F | Colony Group, LLC | 60.245 | 24,25 | 3.250 | 9,02 | ||||
| 2026-02-17 | 13F | Price T Rowe Associates Inc /md/ | 4.009.931 | 23,48 | 180 | -10,05 | ||||
| 2026-01-26 | 13F | Main Street Group, LTD | 0 | -100,00 | 0 | |||||
| 2026-02-13 | 13F | FORA Capital, LLC | 0 | -100,00 | 0 | -100,00 | ||||
| 2026-02-11 | 13F | Bck Capital Management Lp | 0 | -100,00 | 0 | -100,00 | ||||
| 2026-02-12 | 13F | Ensign Peak Advisors, Inc | 56.951 | 39,33 | 2.555 | 1,67 | ||||
| 2026-01-15 | 13F | Polianta Ltd | 27.500 | 1 | ||||||
| 2026-02-06 | 13F | Larson Financial Group LLC | 6.078 | 15,27 | 273 | -16,05 | ||||
| 2026-01-16 | 13F | Marquette Asset Management, LLC | 18 | -14,29 | 1 | -100,00 | ||||
| 2026-01-14 | 13F | Exchange Traded Concepts, Llc | 139.752 | 7,17 | 6.271 | -21,81 | ||||
| 2026-02-13 | 13F | Greenline Wealth Management LLC | 2.048 | 92 | ||||||
| 2026-02-17 | 13F | Integrated Advisors Network LLC | 5.098 | 0,10 | 229 | -27,16 | ||||
| 2026-01-14 | 13F | Nova Wealth Management, Inc. | 175 | -7,89 | 8 | -36,36 | ||||
| 2026-02-17 | 13F | Trybe Capital Management LP | 532.998 | 23.916 | ||||||
| 2026-02-09 | 13F | Frazier Financial Advisors, LLC | 0 | -100,00 | 0 | -100,00 | ||||
| 2026-03-20 | 13F | Purpose Unlimited Inc. | 17.482 | 784 | ||||||
| 2026-02-13 | 13F | Baird Financial Group, Inc. | 0 | -100,00 | 0 | -100,00 | ||||
| 2026-02-14 | 13F | Rockefeller Capital Management L.P. | 511.178 | 257,13 | 22.937 | 160,58 | ||||
| 2026-02-13 | 13F | Lansdowne Partners (uk) Llp | 642.793 | -66,82 | 28.842 | -25,19 | ||||
| 2026-02-17 | 13F | Woodline Partners LP | 5.442 | 244 | ||||||
| 2025-10-22 | 13F | D.a. Davidson & Co. | Call | 0 | -100,00 | 0 | -100,00 | |||
| 2026-02-11 | 13F | Cerity Partners LLC | 17.135 | 49,57 | 771 | 8,91 | ||||
| 2026-02-23 | 13F | Virtu Financial LLC | 39.620 | -47,28 | 2 | -75,00 | ||||
| 2026-01-23 | 13F | Legacy Bridge, LLC | 12.144 | 5,19 | 545 | -23,38 | ||||
| 2026-02-11 | 13F | Cookson Peirce & Co Inc | 126.806 | 7,72 | 5.690 | -21,41 | ||||
| 2026-04-03 | 13F | Adirondack Trust Co | 1.630 | 218,36 | 47 | 109,09 | ||||
| 2026-02-17 | 13F | Signature Equity Partners, LLC | 482 | 22 | ||||||
| 2026-01-21 | 13F | Raleigh Capital Management Inc. | 200 | 9 | ||||||
| 2026-02-06 | 13F | Handelsbanken Fonder AB | 86.300 | 41,48 | 4 | 0,00 | ||||
| 2026-02-13 | 13F | Walleye Trading LLC | Put | 246.700 | -51,03 | 11.069 | -64,27 | |||
| 2026-02-13 | 13F | Walleye Trading LLC | Call | 305.800 | -2,77 | 13.721 | -29,06 | |||
| 2025-11-14 | 13F | 1832 Asset Management L.P. | 0 | -100,00 | 0 | -100,00 | ||||
| 2026-02-17 | 13F | Bank Of America Corp /de/ | 2.137.750 | 30,89 | 95.921 | -4,50 | ||||
| 2026-02-17 | 13F | DCVC Opportunity Fund II GP, LLC | 9.521 | 427 | ||||||
| 2026-01-26 | 13F | Quadrant Private Wealth Management, LLC | 6.053 | 3,43 | 272 | -24,51 | ||||
| 2026-02-10 | 13F | Norges Bank | 4.451.819 | 199.753 | ||||||
| 2026-02-17 | 13F | Sora Investors Llc | 0 | -100,00 | 0 | -100,00 | ||||
| 2026-01-15 | 13F | Lewis Asset Management, LLC | 6.950 | -2,80 | 312 | -29,16 | ||||
| 2026-02-13 | 13F | Quarry LP | 0 | -100,00 | 0 | -100,00 | ||||
| 2026-01-28 | 13F | Universal- Beteiligungs- und Servicegesellschaft mbH | 66.122 | -54,46 | 2.974 | -66,69 | ||||
| 2025-11-14 | 13F | Creative Planning | Call | 0 | -100,00 | 0 | -100,00 | |||
| 2026-02-12 | 13F | Ci Investments Inc. | 0 | -100,00 | 0 | |||||
| 2026-02-05 | 13F | Qsemble Capital Management, LP | 0 | -100,00 | 0 | -100,00 | ||||
| 2026-02-13 | 13F | Dai-Ichi Life Insurance Company, Ltd | 13.977 | 627 | ||||||
| 2026-02-06 | 13F | Bare Financial Services, Inc | 0 | -100,00 | 0 | |||||
| 2026-02-10 | 13F | Evolution Wealth Management Inc. | 102 | 5 | ||||||
| 2026-02-13 | 13F | Marshall Wace, Llp | 193.036 | 8.662 | ||||||
| 2026-01-28 | 13F | Teacher Retirement System Of Texas | 9.771 | -71,54 | 438 | -79,25 | ||||
| 2026-02-13 | 13F | Citigroup Inc | Call | 0 | -100,00 | 0 | -100,00 | |||
| 2026-02-10 | 13F | Principia Wealth Advisory, LLC | 6 | 500,00 | 0 | |||||
| 2026-02-13 | 13F | Parkside Financial Bank & Trust | 368 | 26,03 | 17 | -5,88 | ||||
| 2026-02-13 | 13F | MAI Capital Management | 5.234 | 20,46 | 235 | -12,36 | ||||
| 2026-02-13 | 13F | JustInvest LLC | 20.951 | 24,55 | 940 | -9,09 | ||||
| 2026-02-17 | 13F | California State Teachers Retirement System | 476.339 | 91,79 | 21.373 | 39,93 | ||||
| 2025-11-14 | 13F | Scientech Research LLC | 0 | -100,00 | 0 | -100,00 | ||||
| 2026-02-12 | 13F | State Board Of Administration Of Florida Retirement System | 88.996 | 41,75 | 3.993 | 3,42 | ||||
| 2026-01-20 | 13F | SOA Wealth Advisors, LLC. | 213 | 104,81 | 10 | 50,00 | ||||
| 2026-02-02 | 13F | CENTRAL TRUST Co | 4.395 | 197 | ||||||
| 2025-11-07 | 13F | Levin Capital Strategies, L.p. | Call | 0 | -100,00 | 0 | -100,00 | |||
| 2026-02-17 | 13F | Granahan Investment Management Inc/ma | 106.722 | 4.789 | ||||||
| 2026-02-17 | 13F | Toronto Dominion Bank | 45.791 | 2.055 | ||||||
| 2026-02-12 | 13F | Tripletail Wealth Management, LLC | 350 | 16 | ||||||
| 2026-01-30 | 13F | Archer Investment Corp | 619 | 4,56 | 28 | -25,00 | ||||
| 2026-01-23 | 13F | Tower View Investment Management & Research LLC | 100 | 0,00 | 4 | -33,33 | ||||
| 2026-01-20 | 13F | Signaturefd, Llc | 5.722 | 14,17 | 257 | -16,88 | ||||
| 2026-01-22 | 13F | Financial Consulate, Inc | 468 | 0,00 | 21 | -25,00 | ||||
| 2025-11-14 | 13F | Cubist Systematic Strategies, LLC | Put | 0 | -100,00 | 0 | -100,00 | |||
| 2026-01-21 | 13F | SJS Investment Consulting Inc. | 11 | 83,33 | 0 | |||||
| 2026-02-12 | 13F | SWAN Capital LLC | 0 | -100,00 | 0 | -100,00 | ||||
| 2026-02-17 | 13F | Tudor Investment Corp Et Al | Put | 36.400 | -12,08 | 1.633 | -35,86 | |||
| 2026-01-29 | 13F | Matisse Capital | 11.405 | 24,13 | 512 | -9,56 | ||||
| 2026-02-17 | 13F | Tudor Investment Corp Et Al | Call | 31.800 | 17,78 | 1.427 | -14,10 | |||
| 2026-02-11 | 13F | LPL Financial LLC | Put | 5.000 | 0,00 | 224 | -27,04 | |||
| 2026-02-12 | 13F | BlackRock, Inc. | 30.077.550 | 33,78 | 1.349.580 | -2,39 | ||||
| 2026-02-13 | 13F | Wbi Investments, Inc. | 0 | -100,00 | 0 | |||||
| 2026-02-13 | 13F | Seneschal Advisors, LLC | 2 | 0 | ||||||
| 2025-11-21 | 13F/A | CIBC Bancorp USA Inc. | 29.491 | 1.814 | ||||||
| 2026-01-15 | 13F | Nisa Investment Advisors, Llc | 10.689 | 44,45 | 480 | 5,27 | ||||
| 2026-02-11 | 13F | LPL Financial LLC | 654.968 | 16,58 | 29.388 | -14,94 | ||||
| 2026-02-13 | 13F | Charles Schwab Investment Management Inc | 2.919.445 | 23,56 | 130.995 | -9,85 | ||||
| 2026-02-04 | 13F | BCJ Capital Management, LLC | 0 | -100,00 | 0 | -100,00 | ||||
| 2026-02-12 | 13F | Cibc World Markets Corp | 32.647 | 11,64 | 1.465 | 16,56 | ||||
| 2026-01-28 | 13F | Davis Capital Management | 4 | 0 | ||||||
| 2026-02-27 | 13F | Strategic Investment Solutions, Inc. /IL | 250 | -7,75 | 11 | -31,25 | ||||
| 2026-02-17 | 13F | Credit Agricole S A | 21.367 | 959 | ||||||
| 2026-02-02 | 13F | Fifth Third Bancorp | 123 | -65,45 | 6 | -76,19 | ||||
| 2026-01-27 | 13F | Prakash Investment Advisors Llc | 6.572 | -26,05 | 295 | -46,15 | ||||
| 2026-01-15 | 13F | Westend Capital Management LLC | 224 | 0,00 | 10 | -23,08 | ||||
| 2026-01-12 | 13F | Focus Financial Network, Inc. | 171.755 | 7.707 | ||||||
| 2026-01-15 | 13F | Allspring Global Investments Holdings, LLC | 13.723 | 10,18 | 642 | -18,34 | ||||
| 2026-02-06 | 13F | Keystone Financial Group | 47.056 | 25,73 | 2.111 | -8,26 | ||||
| 2026-02-03 | 13F | Ethic Inc. | 10.891 | 31,79 | 489 | -3,94 | ||||
| 2026-02-17 | 13F | Quadrature Capital Ltd | 570.797 | -20,99 | 25.612 | -42,32 | ||||
| 2026-02-03 | 13F | Generali Asset Management SPA SGR | 2.724 | 122 | ||||||
| 2026-02-10 | 13F | Lido Advisors, LLC | 3.454 | -2,81 | 212 | -2,75 | ||||
| 2026-02-13 | 13F | Citigroup Inc | 196.236 | -54,75 | 8.805 | -66,99 | ||||
| 2026-01-07 | 13F | Massmutual Trust Co Fsb/adv | 591 | -2,31 | 27 | -29,73 | ||||
| 2026-02-13 | 13F | Citigroup Inc | Put | 50.000 | 96,08 | 2.244 | 43,05 | |||
| 2026-02-17 | 13F | Northern Trust Corp | 3.277.218 | 19,74 | 147.049 | -12,64 | ||||
| 2026-02-02 | 13F | Strs Ohio | 49.300 | 3,79 | 2.212 | -24,27 | ||||
| 2026-02-17 | 13F | Raymond James Financial Inc | 516.883 | -5,07 | 23.224 | -30,65 | ||||
| 2025-11-14 | 13F | IHT Wealth Management, LLC | 0 | -100,00 | 0 | |||||
| 2026-02-13 | 13F | Chevy Chase Trust Holdings, Inc. | 606.464 | -0,73 | 27.212 | -27,57 | ||||
| 2026-02-17 | 13F | Two Sigma Investments, Lp | Put | 115.900 | 2.218,00 | 5.200 | 1.593,81 | |||
| 2026-02-13 | 13F | Transamerica Financial Advisors, Inc. | 3 | -75,00 | 0 | |||||
| 2026-02-17 | 13F | Two Sigma Investments, Lp | Call | 132.500 | 5.945 | |||||
| 2026-01-30 | 13F | State of New Jersey Common Pension Fund D | 102.633 | 10,09 | 4.605 | -19,68 | ||||
| 2026-02-10 | 13F | Murphy & Mullick Capital Management Corp | 460 | 27,78 | 21 | -9,09 | ||||
| 2026-01-21 | 13F | Brown Shipley& Co Ltd | 0 | -100,00 | 0 | |||||
| 2026-03-04 | 13F | SHP Wealth Management | 3.379 | 152 | ||||||
| 2026-02-17 | 13F | Two Sigma Investments, Lp | 174.726 | 118,67 | 7.840 | 59,52 | ||||
| 2026-02-05 | 13F | Western Wealth Management, LLC | 25.719 | 8,24 | 1.154 | -21,01 | ||||
| 2026-01-27 | 13F | GHP Investment Advisors, Inc. | 30 | 1 | ||||||
| 2026-02-17 | 13F | Aqr Capital Management Llc | 68.114 | 20,31 | 3.056 | -12,21 | ||||
| 2026-01-26 | 13F | Keystone Wealth Services, LLC | 8.381 | -14,28 | 376 | -37,44 | ||||
| 2026-01-23 | 13F | Freestone Capital Holdings, LLC | 0 | -100,00 | 0 | |||||
| 2026-02-17 | 13F | Css Llc/il | Put | 45.200 | 69,29 | 2.028 | 23,51 | |||
| 2026-01-20 | 13F | October Effect Ltd | 0 | -100,00 | 0 | -100,00 | ||||
| 2026-02-02 | 13F | Hussman Strategic Advisors, Inc. | 31.500 | 0,00 | 1.413 | -27,05 | ||||
| 2026-02-17 | 13F | Jump Financial, LLC | 282.929 | 796,65 | 12.695 | 554,38 | ||||
| 2026-02-19 | 13F | Mcguire Capital Advisors Inc | 487 | 22 | ||||||
| 2026-02-04 | 13F | Strategic Planning Group, Llc | 119.291 | 17,68 | 5.353 | -14,15 | ||||
| 2026-02-26 | 13F/A | Sculptor Capital LP | 0 | -100,00 | 0 | -100,00 | ||||
| 2026-02-26 | 13F/A | Sculptor Capital LP | Put | 0 | -100,00 | 0 | -100,00 | |||
| 2026-02-12 | 13F | Ankerstar Wealth, LLC | 138 | 6 | ||||||
| 2026-02-17 | 13F | Voleon Capital Management Lp | 0 | -100,00 | 0 | -100,00 | ||||
| 2026-01-16 | 13F | Crewe Advisors LLC | 299 | 51,01 | 13 | 8,33 | ||||
| 2026-01-29 | 13F | Inscription Capital, LLC | 6.916 | 7,14 | 310 | -21,72 | ||||
| 2026-01-30 | 13F | Fagan Associates, Inc. | 6.672 | 0,17 | 299 | -26,89 | ||||
| 2026-01-20 | 13F | Savvy Advisors, Inc. | 8.702 | 32,81 | 390 | -2,99 | ||||
| 2026-01-20 | 13F | Thurston, Springer, Miller, Herd & Titak, Inc. | 320 | 14 | ||||||
| 2026-02-10 | 13F | Close Asset Management Ltd | 2.020 | -12,93 | 0 | |||||
| 2026-02-12 | 13F | Insigneo Advisory Services, Llc | 7.524 | -12,04 | 338 | -35,93 | ||||
| 2026-02-13 | 13F | Kestra Advisory Services, LLC | 0 | -100,00 | 0 | |||||
| 2026-02-13 | 13F | Ausdal Financial Partners, Inc. | 13.154 | 25,61 | 590 | -8,39 | ||||
| 2025-11-14 | 13F | Cerberus Capital Management, L.P. | Put | 0 | -100,00 | 0 | -100,00 | |||
| 2026-02-17 | 13F | D. E. Shaw & Co., Inc. | Call | 927.300 | -42,00 | 41.608 | -57,68 | |||
| 2026-02-17 | 13F | D. E. Shaw & Co., Inc. | Put | 294.400 | 12,75 | 13.210 | -17,74 | |||
| 2026-02-17 | 13F | SIH Partners, LLLP | 85.928 | 1.350,26 | 3.856 | 959,07 | ||||
| 2026-02-17 | 13F | D. E. Shaw & Co., Inc. | 879.600 | -83,86 | 39.468 | -88,22 | ||||
| 2026-02-12 | 13F | Commonwealth Equity Services, Llc | 81.037 | 9,91 | 3.636 | 90.800,00 | ||||
| 2026-02-12 | 13F | Penserra Capital Management LLC | 774.817 | -3,16 | 35 | -30,61 | ||||
| 2026-02-12 | 13F | UniSuper Management Pty Ltd | 6.200 | 278 | ||||||
| 2026-02-18 | 13F | Caitlin John, LLC | 150 | 0,00 | 7 | -33,33 | ||||
| 2026-01-21 | 13F | Sowell Financial Services LLC | 15.883 | 33,53 | 713 | -2,60 | ||||
| 2026-02-17 | 13F | LaSalle St. Investment Advisors, LLC | 4.989 | 0,00 | 0 | |||||
| 2026-02-10 | 13F | Moors & Cabot, Inc. | 51.188 | 11,23 | 2.297 | -18,87 | ||||
| 2026-02-10 | 13F | Savant Capital, LLC | 5.466 | -1,46 | 245 | -28,15 | ||||
| 2026-02-17 | 13F | Naspers Ltd | 0 | -100,00 | 0 | -100,00 | ||||
| 2026-02-17 | 13F | Alphadyne Asset Management, LLC | Call | 0 | -100,00 | 0 | -100,00 | |||
| 2026-02-17 | 13F | Nissay Asset Management Corp /japan/ /adv | 38.097 | 1.709 | ||||||
| 2026-02-10 | 13F | Amazon Com Inc | 6.671 | 299 | ||||||
| 2026-02-11 | 13F | Zions Bancorporation, National Association /ut/ | 12 | 1 | ||||||
| 2026-01-29 | 13F | Vanguard Group Inc | 34.774.743 | 18,46 | 1.560.343 | -13,57 | ||||
| 2026-02-13 | 13F | Schroder Investment Management Group | 4.424 | 200 | ||||||
| 2026-01-15 | 13F | Capital Advisors Inc/ok | 341.588 | 0,58 | 15.327 | -26,61 | ||||
| 2026-02-17 | 13F | Schonfeld Strategic Advisors LLC | 0 | -100,00 | 0 | |||||
| 2026-01-07 | 13F | Aventura Private Wealth, LLC | 103 | 9,57 | 5 | -20,00 | ||||
| 2026-02-13 | 13F | Ostrum Asset Management | 5.610 | 252 | ||||||
| 2026-01-12 | 13F | Rialto Wealth Management, LLC | 147 | 0,00 | 7 | -33,33 | ||||
| 2026-02-03 | 13F | F/M Investments LLC | 43.587 | 60,45 | 1.956 | 17,07 | ||||
| 2026-01-21 | 13F | Signature Resources Capital Management, LLC | 0 | -100,00 | 0 | |||||
| 2026-02-17 | 13F | Aquatic Capital Management LLC | 0 | -100,00 | 0 | -100,00 | ||||
| 2026-02-12 | 13F | DRW Securities, LLC | Put | 0 | -100,00 | 0 | -100,00 | |||
| 2026-02-10 | 13F | Rothschild Investment Llc | 5.500 | 2,61 | 247 | -25,23 | ||||
| 2026-04-02 | 13F | Aspect Partners, LLC | 147 | 15,75 | 4 | -20,00 | ||||
| 2026-01-26 | 13F | Mirae Asset Global Investments Co., Ltd. | 83.265 | 151,48 | 3.736 | 83,50 | ||||
| 2026-02-06 | 13F | Tortoise Investment Management, LLC | 0 | -100,00 | 0 | |||||
| 2026-02-13 | 13F | Fortis Capital Management LLC | 4.983 | -31,56 | 224 | -50,11 | ||||
| 2026-02-17 | 13F | Banco Bilbao Vizcaya Argentaria, S.a. | 15.109 | 42,67 | 680 | 4,46 | ||||
| 2026-02-17 | 13F | Altshuler Shaham Ltd | 21.000 | 942 | ||||||
| 2025-11-14 | 13F | Strategic Wealth Partners, Ltd. | 29 | -86,06 | 2 | -87,50 | ||||
| 2026-02-13 | 13F | Virtus ETF Advisers LLC | 7.071 | 87,51 | 317 | 37,23 | ||||
| 2026-01-30 | 13F | Jennison Associates Llc | 12.378 | 3,11 | 555 | -24,80 | ||||
| 2026-02-13 | 13F | Headlands Technologies LLC | 17.636 | -61,92 | 791 | -72,23 | ||||
| 2026-02-11 | 13F | Fox Run Management, L.l.c. | 7.530 | 49,67 | 338 | 9,06 | ||||
| 2025-10-27 | 13F | Stephens Inc /ar/ | 0 | -100,00 | 0 | -100,00 | ||||
| 2026-01-29 | 13F | UMA Financial Services, Inc. | 103 | 35,53 | 5 | 0,00 | ||||
| 2026-02-13 | 13F | Neuberger Berman Group LLC | 426.280 | 445,90 | 19.127 | 298,31 | ||||
| 2026-02-13 | 13F | Toroso Investments, LLC | 101.080 | -22,97 | 4.535 | -43,80 | ||||
| 2026-02-02 | 13F | Danske Bank A/s | 94.400 | 4.620,00 | 4.236 | 3.343,09 | ||||
| 2026-02-03 | 13F | Mitsubishi UFJ Kokusai Asset Management Co., Ltd. | 281.447 | 61.084,13 | 13.163 | 46.910,71 | ||||
| 2026-02-10 | 13F | Daiwa Securities Group Inc. | 25.800 | 1 | ||||||
| 2026-02-17 | 13F | Fmr Llc | 1.979.213 | -12,86 | 88.807 | -36,42 | ||||
| 2026-02-17 | 13F | Citadel Advisors Llc | Put | 1.736.000 | -35,92 | 77.894 | -53,25 | |||
| 2026-02-06 | 13F | Resona Asset Management Co.,Ltd. | 87.015 | 3.909 | ||||||
| 2026-01-29 | 13F | Rakuten Securities, Inc. | 125.765 | 127,14 | 5.643 | 65,73 | ||||
| 2026-01-20 | 13F | Stratos Wealth Partners, LTD. | 19.740 | -40,97 | 886 | -56,96 | ||||
| 2026-01-29 | 13F | Concurrent Investment Advisors, LLC | Put | 0 | -100,00 | 0 | -100,00 | |||
| 2026-02-19 | 13F | Invesco Ltd. | 611.895 | 26,25 | 27.456 | -7,89 | ||||
| 2026-02-17 | 13F | Citadel Advisors Llc | 255.492 | -70,63 | 11.464 | -78,57 | ||||
| 2026-02-17 | 13F | Alphadyne Asset Management, LLC | Put | 0 | -100,00 | 0 | -100,00 | |||
| 2026-02-17 | 13F | Citadel Advisors Llc | Call | 1.891.100 | -30,67 | 84.854 | -49,41 | |||
| 2025-11-14 | 13F | Mercer Global Advisors Inc /adv | Call | 0 | -100,00 | 0 | -100,00 | |||
| 2026-02-13 | 13F | Tradewinds, LLC. | 5.484 | 0,00 | 246 | -27,00 | ||||
| 2026-02-03 | 13F | Winch Advisory Services, LLC | 122 | 510,00 | 5 | 400,00 | ||||
| 2025-11-12 | 13F | Cobblestone Capital Advisors Llc /ny/ | 4.097 | 252 | ||||||
| 2026-02-11 | 13F | GW&K Investment Management, LLC | 25.995 | 77,76 | 1 | |||||
| 2026-02-11 | 13F | Orion Investment Co | 277.184 | 0,71 | 12.437 | -26,52 | ||||
| 2026-02-12 | 13F | Wedbush Securities Inc | 13.057 | 82,67 | 1 | |||||
| 2026-02-02 | 13F | Holistic Planning, LLC | 6.353 | 7,59 | 285 | -21,49 | ||||
| 2026-01-26 | 13F | Wealth Effects Llc | 0 | -100,00 | 0 | -100,00 | ||||
| 2026-02-17 | 13F | State Of Wisconsin Investment Board | 148.788 | 44,90 | 6.676 | 5,72 | ||||
| 2026-02-25 | 13F | Tempo Wealth, LLC | 7.360 | 330 | ||||||
| 2026-02-12 | 13F | Front Row Advisors LLC | 2.300 | 0,00 | 103 | -26,95 | ||||
| 2026-01-08 | 13F | True Wealth Design, LLC | 3 | 0 | ||||||
| 2026-02-06 | 13F/A | Rathbone Brothers plc | 11.532 | -1,55 | 517 | -28,19 | ||||
| 2026-01-16 | 13F | Compagnie Lombard Odier SCmA | 1.115 | 50 | ||||||
| 2026-02-09 | 13F | Berkshire Capital Holdings Inc | 10 | 0,00 | 0 | |||||
| 2026-01-22 | 13F | Massachusetts Financial Services Co /ma/ | 12.154 | 545 | ||||||
| 2025-11-13 | 13F | GeoWealth Management, LLC | 0 | -100,00 | 0 | -100,00 | ||||
| 2025-11-06 | 13F | REAP Financial Group, LLC | 0 | -100,00 | 0 | -100,00 | ||||
| 2026-02-03 | 13F | SBI Securities Co., Ltd. | 229.766 | 30,84 | 10.310 | -4,55 | ||||
| 2026-01-26 | 13F | Draper Asset Management, LLC | Call | 0 | -100,00 | 0 | -100,00 | |||
| 2025-11-14 | 13F | Full Sail Capital, LLC | 4.000 | 246 | ||||||
| 2026-01-26 | 13F | Draper Asset Management, LLC | 0 | -100,00 | 0 | -100,00 | ||||
| 2026-02-10 | 13F | Main Management ETF Advisors, LLC | 26.622 | 1,03 | 1 | 0,00 | ||||
| 2026-02-02 | 13F | Truist Financial Corp | 23.792 | 9,60 | 1.068 | -20,07 | ||||
| 2026-01-23 | 13F | Rsm Us Wealth Management Llc | 15.392 | 34,12 | 697 | -1,13 | ||||
| 2026-02-18 | 13F/A | Empowered Funds, LLC | 4.910 | 220 | ||||||
| 2026-02-02 | 13F | Sachetta, LLC | 400 | 0,00 | 18 | -29,17 | ||||
| 2026-02-26 | 13F | TD Capital Management LLC | 42 | 0,00 | 2 | -50,00 | ||||
| 2026-01-08 | 13F | Grove Bank & Trust | 100 | 4 | ||||||
| 2026-02-05 | 13F | WIM INVESTMENT MANAGEMENT Ltd | 87.700 | 3.935 | ||||||
| 2025-11-04 | 13F | Guerra Advisors Inc | 4 | 0 | ||||||
| 2026-02-06 | 13F | Gsa Capital Partners Llp | 0 | -100,00 | 0 | |||||
| 2026-01-15 | 13F | Lodestone Wealth Management LLC | 2.079 | 93 | ||||||
| 2026-02-10 | 13F | Foundations Investment Advisors, LLC | 8.985 | -45,62 | 403 | -60,33 | ||||
| 2026-02-13 | 13F | Islay Capital Management, Llc | 0 | -100,00 | 0 | -100,00 | ||||
| 2026-02-17 | 13F | Quantitative Investment Management, LLC | 0 | -100,00 | 0 | -100,00 | ||||
| 2026-02-13 | 13F | Arete Wealth Advisors, LLC | 7.081 | -41,35 | 0 | |||||
| 2026-02-12 | 13F | Marex Group plc | 4.083.453 | 410,06 | 183.225 | 272,13 | ||||
| 2026-02-13 | 13F | Royal London Asset Management Ltd | 11.095 | 498 | ||||||
| 2026-02-06 | 13F | Banque Cantonale Vaudoise | 28.277 | 873,73 | 1.269 | |||||
| 2026-02-04 | 13F | Western Pacific Wealth Management, LP | 658 | -49,38 | 30 | -63,29 | ||||
| 2026-01-23 | 13F | Clear Creek Financial Management, LLC | 12.390 | -4,28 | 556 | -30,28 | ||||
| 2026-02-17 | 13F | Advisor Group Holdings, Inc. | 227.751 | 9,73 | 10.219 | -1,01 | ||||
| 2026-01-14 | 13F | ORG Partners LLC | 60 | -75,00 | 3 | -85,71 | ||||
| 2026-02-12 | 13F | Swiss National Bank | 809.148 | 59,16 | 36.306 | 16,12 | ||||
| 2026-02-05 | 13F | Bessemer Group Inc | 214.390 | 6,50 | 10 | -25,00 | ||||
| 2026-02-17 | 13F/A | Kovack Advisors, Inc. | 28.535 | 6,12 | 1.280 | -22,57 | ||||
| 2026-02-17 | 13F/A | Kovack Advisors, Inc. | Call | 10.000 | 449 | |||||
| 2026-02-17 | 13F | Crawford Fund Management, LLC | Put | 421.000 | 20,80 | 18.890 | -11,86 | |||
| 2026-01-14 | 13F | Wealthcare Advisory Partners LLC | 7.759 | 8,90 | 348 | -20,55 | ||||
| 2026-02-10 | 13F | Bnp Paribas Arbitrage, Sa | 787.875 | 163,53 | 35.352 | 92,27 | ||||
| 2026-01-14 | 13F | ORG Wealth Partners, LLC | 32.902 | 7,13 | 1.476 | -21,82 | ||||
| 2026-02-10 | 13F | Seven Grand Managers, Llc | 50.000 | 2.244 | ||||||
| 2026-01-28 | 13F | Chicago Partners Investment Group LLC | 5.425 | 3,67 | 256 | -14,38 | ||||
| 2026-02-11 | 13F | Parallel Advisors, LLC | 2.725 | -21,85 | 122 | -42,99 | ||||
| 2026-02-12 | 13F | MetLife Investment Management, LLC | 186.413 | 15,93 | 8.364 | -15,41 | ||||
| 2026-02-17 | 13F | Mpwm Advisory Solutions, Llc | 415 | 336,84 | 19 | 260,00 | ||||
| 2026-02-11 | 13F | Strategic Advocates LLC | 49.527 | -0,47 | 2.244 | -26,67 | ||||
| 2026-02-12 | 13F | Quadrant Capital Group Llc | 26 | 0,00 | 1 | 0,00 | ||||
| 2026-02-11 | 13F | Group One Trading, L.p. | 141.647 | 80,71 | 6.356 | 31,85 | ||||
| 2026-02-12 | 13F | Mount Yale Investment Advisors, LLC | 0 | -100,00 | 0 | -100,00 | ||||
| 2026-02-06 | 13F | GPS Wealth Strategies Group, LLC | 0 | -100,00 | 0 | -100,00 | ||||
| 2026-02-23 | 13F | Beaird Harris Wealth Management, LLC | 500 | 0,00 | 22 | -26,67 | ||||
| 2025-11-14 | 13F | Brooklands Fund Management Ltd | Call | 0 | -100,00 | 0 | -100,00 | |||
| 2026-02-13 | 13F | State Street Corp | 8.962.789 | 42,28 | 402.160 | 3,80 | ||||
| 2026-02-06 | 13F | IFP Advisors, Inc | 4.936 | 49,21 | 221 | 8,87 | ||||
| 2026-01-30 | 13F | Us Bancorp \de\ | 14.687 | -12,47 | 659 | -36,08 | ||||
| 2026-02-11 | 13F | Ameritas Investment Partners, Inc. | 27.956 | 1.254 | ||||||
| 2026-01-27 | 13F | Fortis Capital Advisors, LLC | 0 | -100,00 | 0 | -100,00 | ||||
| 2026-01-15 | 13F | Highline Wealth Partners Llc | 27 | 0,00 | 1 | 0,00 | ||||
| 2026-01-12 | 13F | Thompson Davis & Co., Inc. | 0 | -100,00 | 0 | |||||
| 2026-02-05 | 13F | Amalgamated Bank | 10.637 | 18,68 | 0 | |||||
| 2026-01-20 | 13F | Family Legacy Financial Solutions, LLC | 0 | -100,00 | 0 | -100,00 | ||||
| 2026-01-23 | 13F | Gainplan LLC | 7.866 | 353 | ||||||
| 2026-01-07 | 13F | Retirement Wealth Solutions LLC | 25 | 8,70 | 1 | 0,00 | ||||
| 2026-02-17 | 13F | Equitable Holdings, Inc. | 16.544 | 79,65 | 742 | 31,10 | ||||
| 2026-01-29 | 13F | Saybrook Capital /nc | 0 | -100,00 | 0 | -100,00 | ||||
| 2026-01-30 | 13F | Kohmann Bosshard Financial Services, LLC | 345 | 15 | ||||||
| 2026-02-10 | 13F | Godfrey Financial Associates, Inc. | 7 | 0 | ||||||
| 2026-02-17 | 13F | Cresset Asset Management, LLC | 9.304 | 17,06 | 417 | -14,55 | ||||
| 2026-02-11 | 13F | Cedar Mountain Advisors, LLC | 130 | 0,00 | 6 | -28,57 | ||||
| 2026-02-13 | 13F | Pinnacle Wealth Planning Services, Inc. | 2.290 | 103 | ||||||
| 2026-01-20 | 13F | AdvisorNet Financial, Inc | 6.339 | 305,83 | 284 | 195,83 | ||||
| 2026-02-09 | 13F/A | Swedbank AB | 60.355 | 2.708 | ||||||
| 2025-11-14 | 13F | Massar Capital Management, LP | 0 | -100,00 | 0 | -100,00 | ||||
| 2025-11-12 | 13F | Journey Strategic Wealth Llc | 0 | -100,00 | 0 | -100,00 | ||||
| 2026-02-05 | 13F | HighMark Wealth Management LLC | 100 | 72,41 | 4 | 33,33 | ||||
| 2026-02-12 | 13F | Rowland & Co Investment Counsel/adv | 0 | -100,00 | 0 | -100,00 | ||||
| 2026-02-02 | 13F | Wolverine Asset Management Llc | 9.326 | -34,14 | 418 | -51,95 | ||||
| 2026-02-13 | 13F | Squarepoint Ops LLC | Call | 106.000 | -66,62 | 4.756 | -75,65 | |||
| 2026-02-09 | 13F | Emerald Advisers, Llc | 452.674 | -1,12 | 20.311 | -27,85 | ||||
| 2026-02-13 | 13F | Squarepoint Ops LLC | Put | 172.700 | -61,11 | 7.749 | -71,63 | |||
| 2026-02-13 | 13F | Squarepoint Ops LLC | 1.188.570 | -24,06 | 53.331 | -44,59 | ||||
| 2025-10-10 | 13F | Sound Income Strategies, LLC | 0 | -100,00 | 0 | -100,00 | ||||
| 2026-01-14 | 13F | Jfs Wealth Advisors, Llc | 20 | 1 | ||||||
| 2026-01-27 | 13F | Godsey & Gibb Associates | 160 | 0,00 | 7 | -22,22 | ||||
| 2026-02-11 | 13F | Gordian Capital Singapore Pte Ltd | 1 | 0,00 | 0 | |||||
| 2026-02-12 | 13F | Xponance, Inc. | 43.796 | 99,79 | 1.965 | 45,77 | ||||
| 2026-02-17 | 13F | Kemnay Advisory Services Inc. | 1.305 | 59 | ||||||
| 2026-02-06 | 13F | Covestor Ltd | Put | 3 | 0 | |||||
| 2026-02-06 | 13F | Covestor Ltd | 325 | 0,00 | 0 | |||||
| 2026-02-23 | 13F | REX Advisers, LLC | Put | 18.000 | 18 | |||||
| 2026-02-10 | 13F | Founders Financial Securities Llc | 0 | -100,00 | 0 | |||||
| 2026-02-23 | 13F | REX Advisers, LLC | Call | 18.000 | 3 | |||||
| 2026-02-23 | 13F | REX Advisers, LLC | 9.000 | 404 | ||||||
| 2026-02-12 | 13F | Chilton Capital Management Llc | 17 | 1 | ||||||
| 2026-01-23 | 13F | Assetmark, Inc | 253 | 64,29 | 11 | 22,22 | ||||
| 2026-02-13 | 13F | Alerus Financial Na | 0 | -100,00 | 0 | -100,00 | ||||
| 2026-02-05 | 13F | Rossmore Private Capital | 5.010 | 0,00 | 225 | -27,27 | ||||
| 2026-02-13 | 13F | Police & Firemen's Retirement System of New Jersey | 91.112 | 18,31 | 4.088 | -13,68 | ||||
| 2026-02-10 | 13F | Root Financial Partners, LLC | 1.404 | 75,50 | 63 | 26,53 | ||||
| 2026-02-13 | 13F | American Century Companies Inc | 0 | -100,00 | 0 | |||||
| 2026-01-28 | 13F | Barrett & Company, Inc. | 28 | 1 | ||||||
| 2026-02-17 | 13F | Capital Fund Management S.a. | Put | 658.300 | -42,56 | 29.538 | -58,09 | |||
| 2026-02-17 | 13F | Capital Fund Management S.a. | Call | 741.600 | 45,58 | 33.276 | 6,21 | |||
| 2025-11-13 | 13F | Riggs Asset Managment Co. Inc. | 0 | -100,00 | 0 | |||||
| 2026-01-22 | 13F | Harwood Advisory Group, LLC | 948 | -13,82 | 43 | -37,31 | ||||
| 2026-01-27 | 13F | Forum Financial Management, LP | 6.137 | 22,76 | 275 | -10,42 | ||||
| 2026-01-26 | 13F | AE Wealth Management LLC | 10.099 | 55,35 | 453 | 13,53 | ||||
| 2026-02-10 | 13F | Goldman Sachs Group Inc | Put | 0 | -100,00 | 0 | -100,00 | |||
| 2026-02-10 | 13F | CIBC Asset Management Inc | 16.150 | 143,92 | 725 | 77,89 | ||||
| 2026-01-22 | 13F | HHM Wealth Advisors, LLC | 235 | 0,00 | 11 | -28,57 | ||||
| 2026-02-11 | 13F | Nemes Rush Group LLC | 150 | 0,00 | 7 | -33,33 | ||||
| 2026-02-17 | 13F | Ameriprise Financial Inc | 86.098 | -80,40 | 3.863 | -85,70 | ||||
| 2026-02-06 | 13F | HighTower Advisors, LLC | 78.948 | 12,48 | 3.542 | -17,93 | ||||
| 2026-02-17 | 13F | Buckland Partners Management Co LLC | 6.000 | 269 | ||||||
| 2026-02-17 | 13F | Morgens Waterfall Vintiadis & Co Inc | 0 | -100,00 | 0 | |||||
| 2026-02-17 | 13F | SherpaCapital, LLC | 3.752 | -96,38 | 168 | -97,37 | ||||
| 2026-01-08 | 13F | Armstrong Advisory Group, Inc | 482 | 0,00 | 22 | -27,59 | ||||
| 2026-02-19 | 13F | CI Private Wealth, LLC | 62.124 | 30,95 | 2.591 | -11,21 | ||||
| 2026-02-02 | 13F | Qrg Capital Management, Inc. | 0 | -100,00 | 0 | -100,00 | ||||
| 2026-02-13 | 13F | Cornerstone Financial Management LLC | 40 | 2 | ||||||
| 2026-02-12 | 13F | CIBC Private Wealth Group, LLC | 20.561 | 446,40 | 923 | 299,13 | ||||
| 2026-02-17 | 13F | Himension Fund | 10.857 | 487 | ||||||
| 2026-02-17 | 13F | Abel Hall, LLC | 17.254 | 180,14 | 774 | 104,76 | ||||
| 2026-01-21 | 13F | First United Bank Trust/ | 0 | -100,00 | 0 | -100,00 | ||||
| 2026-04-02 | 13F | Noble Wealth Management PBC | 100 | 0,00 | 3 | -50,00 | ||||
| 2026-02-12 | 13F | Dimensional Fund Advisors Lp | 777.367 | 13,78 | 34.889 | -17,03 | ||||
| 2026-02-10 | 13F | CIBC World Markets Inc. | 104.930 | -13,47 | 4.708 | -36,86 | ||||
| 2025-11-06 | 13F | Abich Financial Wealth Management LLC | 3.088 | 191,32 | 190 | 2.000,00 | ||||
| 2026-01-23 | 13F | Ritholtz Wealth Management | 0 | -100,00 | 0 | -100,00 | ||||
| 2026-02-12 | 13F | Principal Securities, Inc. | 0 | -100,00 | 0 | -100,00 | ||||
| 2026-02-12 | 13F | Callan Family Office, LLC | 6.976 | 21,77 | 313 | -11,08 | ||||
| 2026-02-12 | 13F | Aviva Plc | 223.666 | 10.036 | ||||||
| 2026-02-02 | 13F | Principal Financial Group Inc | 124.631 | 34,65 | 5.592 | -1,76 | ||||
| 2026-02-10 | 13F | Avestar Capital, LLC | 9.270 | -34,26 | 416 | -52,13 | ||||
| 2026-02-10 | 13F | Avestar Capital, LLC | Call | 2.300 | 15,00 | 103 | -16,26 | |||
| 2026-02-17 | 13F | Ancora Advisors, LLC | 5.255 | 24,23 | 236 | -9,62 | ||||
| 2026-02-17 | 13F | Sig Brokerage, Lp | Call | 15.000 | 0,00 | 673 | -27,01 | |||
| 2026-02-09 | 13F | Bleakley Financial Group, LLC | 20.391 | 1,96 | 915 | -25,69 | ||||
| 2026-02-17 | 13F | Sig Brokerage, Lp | Put | 52.500 | 0,00 | 2.356 | -27,04 | |||
| 2026-02-17 | 13F | Quantinno Capital Management LP | 26.910 | 46,70 | 1.207 | 7,00 | ||||
| 2026-02-09 | 13F | Kestra Investment Management, LLC | 0 | -100,00 | 0 | -100,00 | ||||
| 2026-02-17 | 13F | Ameriflex Group, Inc. | 1.054 | 157,07 | 47 | 88,00 | ||||
| 2026-01-16 | 13F | Ronald Blue Trust, Inc. | 1.612 | 27,23 | 72 | -6,49 | ||||
| 2026-02-12 | 13F | Fortress Private Ledger, Llc | 73.269 | 4,26 | 3.288 | -23,93 | ||||
| 2026-02-12 | 13F | Nuveen, LLC | 1.534.964 | 25,66 | 68.874 | -8,32 | ||||
| 2026-02-13 | 13F | Umb Bank N A/mo | 48 | -90,40 | 2 | -93,33 | ||||
| 2026-02-17 | 13F | Alliancebernstein L.p. | 1.836.123 | 470,82 | 82.387 | 316,47 | ||||
| 2026-02-03 | 13F | Legacy Wealth Managment, LLC/ID | 16 | 33,33 | 1 | |||||
| 2026-01-27 | 13F | Gf Fund Management Co. Ltd. | 286 | 13 | ||||||
| 2026-02-12 | 13F | EAM Investors, LLC | 29.904 | -80,05 | 1.342 | -85,21 | ||||
| 2026-02-13 | 13F | Allianz Se | 18.141 | 814 | ||||||
| 2025-11-14 | 13F | Twinbeech Capital Lp | 0 | -100,00 | 0 | |||||
| 2026-02-12 | 13F | Voya Investment Management Llc | 905.213 | 100,77 | 40.617 | 46,48 | ||||
| 2026-02-13 | 13F | Bank Of Nova Scotia | 20.923 | 939 | ||||||
| 2025-11-10 | 13F/A | Flaharty Asset Management, LLC | 0 | -100,00 | 0 | -100,00 | ||||
| 2026-02-12 | 13F | Concorde Asset Management, LLC | 13.005 | 27,94 | 584 | -15,14 | ||||
| 2026-01-28 | 13F | Arizona State Retirement System | 81.059 | 4,49 | 3.637 | -23,75 | ||||
| 2026-02-17 | 13F | Two Sigma Advisers, Lp | 8.700 | 390 | ||||||
| 2026-02-17 | 13F | Cetera Investment Advisers | Call | 3.000 | 0,00 | 18 | -76,71 | |||
| 2026-01-27 | 13F | Asset Management One Co., Ltd. | 116.804 | 5.284 | ||||||
| 2026-02-10 | 13F | Essex Financial Services, Inc. | 19.198 | 0,78 | 861 | -26,47 | ||||
| 2026-02-11 | 13F | Rise Advisors, LLC | 0 | -100,00 | 0 | -100,00 | ||||
| 2026-02-17 | 13F | Cetera Investment Advisers | 152.559 | 24,85 | 6.845 | -8,90 | ||||
| 2025-11-14 | 13F | Cubist Systematic Strategies, LLC | Call | 119.100 | -74,73 | 7.325 | -63,83 | |||
| 2025-10-30 | 13F | Twin Peaks Wealth Advisors, LLC | 0 | -100,00 | 0 | -100,00 | ||||
| 2026-02-04 | 13F | Ameritas Advisory Services, LLC | 0 | -100,00 | 0 | -100,00 | ||||
| 2026-01-21 | 13F | Newbridge Financial Services Group, Inc. | 3.902 | 10,07 | 175 | -19,72 | ||||
| 2026-02-10 | 13F | Connor, Clark & Lunn Investment Management Ltd. | 476.906 | -20,80 | 21.399 | -42,22 | ||||
| 2026-01-20 | 13F | Harbor Capital Advisors, Inc. | 9.504 | 30,39 | 0 | |||||
| 2026-02-12 | 13F | Steward Partners Investment Advisory, Llc | 19.084 | 19,22 | 856 | -13,01 | ||||
| 2026-02-17 | 13F | National Asset Management, Inc. | 6.604 | 28,11 | 296 | -6,62 | ||||
| 2026-02-17 | 13F | MIRAE ASSET GLOBAL ETFS HOLDINGS Ltd. | 171.203 | 24,02 | 7.682 | -9,52 | ||||
| 2026-02-13 | 13F | SPX Equities Gestao de Recursos Ltda | 0 | -100,00 | 0 | -100,00 | ||||
| 2026-02-13 | 13F | Mml Investors Services, Llc | 21.466 | 3,97 | 963 | -24,11 | ||||
| 2026-02-13 | 13F | Visionary Wealth Advisors | 12.345 | -7,08 | 554 | -32,31 | ||||
| 2026-02-17 | 13F | Dauntless Investment Group, LLC | Put | 0 | -100,00 | 0 | -100,00 | |||
| 2026-02-11 | 13F | Hilton Head Capital Partners, LLC | 50 | 2 | ||||||
| 2026-02-13 | 13F | Clear Street Group Inc. | 3.195.818 | 219,65 | 143.396 | 133,21 | ||||
| 2026-02-17 | 13F | Gotham Asset Management, LLC | 0 | -100,00 | 0 | |||||
| 2026-02-17 | 13F | Blair William & Co/il | 12.368 | 13,00 | 555 | -17,68 | ||||
| 2026-01-15 | 13F | Trust Co | 9 | 0 | ||||||
| 2026-02-11 | 13F | Jpmorgan Chase & Co | 1.554.105 | -48,33 | 69.733 | -62,31 | ||||
| 2026-02-17 | 13F | Private Advisor Group, LLC | 103.965 | 77,44 | 4.665 | 29,45 | ||||
| 2026-01-29 | 13F | Sanctuary Advisors, LLC | 37.489 | -23,19 | 1.682 | -43,95 | ||||
| 2026-02-09 | 13F | Kingsview Wealth Management, LLC | 9.953 | 21,99 | 447 | -10,98 | ||||
| 2026-02-02 | 13F | Mutual Advisors, LLC | 11.121 | 226,51 | 499 | 146,53 | ||||
| 2026-02-24 | 13F/A | Pacer Advisors, Inc. | 8 | 0 | ||||||
| 2026-01-28 | 13F | Salomon & Ludwin, LLC | 200 | 0,00 | 10 | -35,71 | ||||
| 2026-02-17 | 13F | XTX Topco Ltd | 23.977 | 1.076 | ||||||
| 2026-02-10 | 13F | Marshall & Sterling Wealth Advisors Inc. | 150 | -25,00 | 7 | -50,00 | ||||
| 2026-02-10 | 13F | Intech Investment Management Llc | 107.639 | 36,18 | 4.830 | -0,64 | ||||
| 2025-11-14 | 13F | Sassicaia Capital Advisers Llc | 0 | -100,00 | 0 | -100,00 | ||||
| 2026-02-17 | 13F | Susquehanna International Group, Llp | Put | 5.079.000 | 1,44 | 227.895 | -25,99 | |||
| 2026-02-17 | 13F | Susquehanna International Group, Llp | Call | 4.164.000 | -2,01 | 186.839 | -28,51 | |||
| 2026-01-16 | 13F | Trust Co Of Vermont | 37 | 2 | ||||||
| 2026-01-29 | 13F | IMC-Chicago, LLC | 0 | -100,00 | 0 | -100,00 | ||||
| 2026-01-23 | 13F | Westside Investment Management, Inc. | 18 | 1 | ||||||
| 2026-02-09 | 13F | Emerald Mutual Fund Advisers Trust | 277.668 | 0,00 | 12.459 | -27,04 | ||||
| 2026-01-26 | 13F | Patriot Financial Group Insurance Agency, LLC | 20.607 | -21,18 | 925 | -42,50 | ||||
| 2026-02-02 | 13F | Cornerstone Planning Group LLC | 107 | 4,90 | 5 | -33,33 | ||||
| 2026-01-22 | 13F | Bartlett & Co. Wealth Management Llc | 33 | 0,00 | 1 | -50,00 | ||||
| 2026-01-26 | 13F | PDS Planning, Inc | 12.565 | 5,31 | 564 | -23,19 | ||||
| 2026-02-12 | 13F | Rossby Financial, LCC | 0 | -100,00 | 0 | -100,00 | ||||
| 2026-02-17 | 13F | Balyasny Asset Management Llc | Call | 47.500 | 0,00 | 2.131 | -27,05 | |||
| 2026-02-17 | 13F | Susquehanna International Group, Llp | 1.583.208 | 24,93 | 71.039 | -8,85 | ||||
| 2026-02-10 | 13F | Ellevest, Inc. | 0 | -100,00 | 0 | |||||
| 2026-02-17 | 13F | Balyasny Asset Management Llc | Put | 500.000 | -52,34 | 22.435 | -65,22 | |||
| 2026-03-27 | 13F | Prosperity Wealth Management, Inc. | 6.900 | -17,86 | 310 | -40,12 | ||||
| 2026-02-17 | 13F | Janus Henderson Group Plc | 55.433 | -51,42 | 2.488 | -64,53 | ||||
| 2026-02-10 | 13F | Td Asset Management Inc | 60.928 | 2.734 | ||||||
| 2026-01-28 | 13F | Milestone Asset Management, Llc | 24.298 | 85,40 | 1.090 | 35,24 | ||||
| 2026-02-12 | 13F | Bank Of Montreal /can/ | Put | 827.000 | 18,82 | 37.107 | -13,31 | |||
| 2026-02-12 | 13F | Bank Of Montreal /can/ | 1.065.265 | 44,35 | 47.798 | 5,32 | ||||
| 2026-02-03 | 13F | Farmers & Merchants Investments Inc | 0 | -100,00 | 0 | -100,00 | ||||
| 2026-02-06 | 13F | Creative Financial Designs Inc /adv | 473 | -7,80 | 21 | -32,26 | ||||
| 2025-11-07 | 13F | Jacobi Capital Management LLC | 0 | -100,00 | 0 | -100,00 | ||||
| 2026-01-20 | 13F | Pine Harbor Wealth Management, LLC | 11.191 | 0,00 | 502 | -27,03 | ||||
| 2026-02-13 | 13F | Pathstone Holdings, LLC | 16.307 | 3,77 | 732 | -24,33 | ||||
| 2025-11-14 | 13F | Walleye Trading LLC | 0 | -100,00 | 0 | -100,00 | ||||
| 2026-02-17 | 13F | Hilltop Holdings Inc. | 16.199 | -0,33 | 727 | -27,33 | ||||
| 2026-02-09 | 13F | Legal & General Group Plc | 1.361.858 | 48,47 | 61.107 | 8,32 | ||||
| 2026-02-10 | 13F | JTC Employer Solutions Trusteee Ltd | 6.372 | 0,00 | 0 | |||||
| 2025-11-13 | 13F | Magnetar Financial LLC | 0 | -100,00 | 0 | |||||
| 2026-01-21 | 13F | Flagship Harbor Advisors, Llc | 5.171 | 55,05 | 232 | 13,17 | ||||
| 2026-02-13 | 13F | BNP Paribas Asset Management Holding S.A. | 34.117 | 1.235,30 | 2 | |||||
| 2026-01-20 | 13F | Aspiriant, Llc | 16.204 | 727 | ||||||
| 2025-11-14 | 13F | WealthTrak Capital Management LLC | 0 | -100,00 | 0 | |||||
| 2026-02-09 | 13F | Geode Capital Management, Llc | 8.074.301 | 21,93 | 361.624 | -11,39 | ||||
| 2026-01-29 | 13F | Kestra Private Wealth Services, Llc | 40.569 | 4,16 | 1.820 | -24,01 | ||||
| 2026-01-14 | 13F | Weil Company, Inc. | 6.000 | 0,00 | 269 | -27,10 | ||||
| 2026-01-16 | 13F | Perigon Wealth Management, LLC | 12.037 | -5,44 | 540 | -30,95 | ||||
| 2026-02-05 | 13F | DnB Asset Management AS | 55.230 | 1.099,09 | 2.478 | 775,62 | ||||
| 2026-02-11 | 13F | J.w. Cole Advisors, Inc. | 13.510 | 22,05 | 193 | -71,76 | ||||
| 2026-02-17 | 13F | LMR Partners LLP | Put | 59.400 | 98,00 | 2.665 | 44,44 | |||
| 2026-02-09 | 13F | HBK Sorce Advisory LLC | 20.732 | 12,64 | 725 | -45,57 | ||||
| 2026-02-11 | 13F | Livforsakringsbolaget Skandia, Omsesidigt | 2.100 | 94 | ||||||
| 2026-02-17 | 13F | LMR Partners LLP | 40.000 | 1.795 | ||||||
| 2026-02-03 | 13F | Strengthening Families & Communities, LLC | 510 | 23 | ||||||
| 2026-02-11 | 13F | BI Asset Management Fondsmaeglerselskab A/S | 127.744 | 16,93 | 6 | -16,67 | ||||
| 2025-11-10 | 13F | Axq Capital, Lp | 0 | -100,00 | 0 | -100,00 | ||||
| 2025-11-17 | 13F | FSA Wealth Management LLC | 80 | 0,00 | 5 | 33,33 | ||||
| 2026-02-04 | 13F | LRI Investments, LLC | 82 | 182,76 | 4 | 200,00 | ||||
| 2026-03-12 | 13F/A | Peak6 Llc | Call | 81.500 | -73,65 | 3.657 | -80,78 | |||
| 2026-03-12 | 13F/A | Peak6 Llc | 49.907 | 2.239 | ||||||
| 2026-03-12 | 13F/A | Peak6 Llc | Put | 174.500 | -12,92 | 7.830 | -36,47 | |||
| 2026-02-03 | 13F | Sumitomo Mitsui DS Asset Management Company, Ltd | 34.253 | 1.537 | ||||||
| 2026-02-04 | 13F | Virginia Retirement Systems Et Al | 0 | -100,00 | 0 | -100,00 | ||||
| 2026-02-17 | 13F | VestGen Advisors, LLC | 4.823 | -93,57 | 216 | -95,32 | ||||
| 2026-02-17 | 13F | Algert Global Llc | 0 | -100,00 | 0 | -100,00 | ||||
| 2025-10-21 | 13F | Tradewinds Capital Management, LLC | 0 | -100,00 | 0 | |||||
| 2026-02-20 | 13F | Kovitz Investment Group Partners, LLC | 0 | -100,00 | 0 | -100,00 | ||||
| 2026-02-19 | 13F/A | T. Rowe Price Investment Management, Inc. | 25.678 | 0,00 | 1 | 0,00 | ||||
| 2026-02-10 | 13F | Forsta Ap-fonden | 122.312 | 5.488 | ||||||
| 2026-02-09 | 13F | Jefferies Financial Group Inc. | 72.900 | 3.271 | ||||||
| 2026-02-13 | 13F | Banque Transatlantique SA | 225 | -67,86 | 10 | -76,74 | ||||
| 2026-02-17 | 13F | SageView Advisory Group, LLC | 512 | 23 | ||||||
| 2026-02-12 | 13F | Hilton Capital Management, LLC | 4.620 | 207 | ||||||
| 2026-02-10 | 13F | Bank of New York Mellon Corp | 1.737.145 | 34,59 | 77.946 | -1,80 | ||||
| 2026-02-02 | 13F | Pittenger & Anderson Inc | 545 | 0,00 | 24 | -27,27 | ||||
| 2026-02-12 | 13F | Brinker Capital Investments, LLC | 12.107 | 18,05 | 543 | -13,81 | ||||
| 2026-01-30 | 13F | Bogart Wealth, LLC | 1.023 | -23,77 | 46 | -45,12 | ||||
| 2026-01-30 | 13F | Moody Aldrich Partners Llc | 0 | -100,00 | 0 | -100,00 | ||||
| 2026-02-17 | 13F | Jain Global LLC | 0 | -100,00 | 0 | -100,00 | ||||
| 2026-01-28 | 13F | B. Metzler seel. Sohn & Co. AG | 13.900 | 624 | ||||||
| 2026-01-29 | 13F | Calamos Advisors LLC | 0 | -100,00 | 0 | -100,00 | ||||
| 2026-01-12 | 13F | E. Ohman J:or Asset Management AB | 7.429 | 333 | ||||||
| 2026-02-12 | 13F | Jane Street Group, Llc | Call | 1.779.800 | -52,32 | 79.860 | -65,22 | |||
| 2026-02-12 | 13F | Jane Street Group, Llc | 9.022 | 7,96 | 405 | -21,25 | ||||
| 2025-10-21 | 13F | Crowley Wealth Management, Inc. | 0 | -100,00 | 0 | -100,00 | ||||
| 2026-02-12 | 13F | Jane Street Group, Llc | Put | 1.092.300 | -33,53 | 49.012 | -51,50 | |||
| 2026-01-12 | 13F | Lauer Wealth, LLC | 5.107 | 5,26 | 258 | -26,78 | ||||
| 2026-02-18 | 13F | GWM Advisors LLC | 23.135 | -33,54 | 1.038 | -35,17 | ||||
| 2026-02-17 | 13F | North Capital, Inc. | 0 | -100,00 | 0 | |||||
| 2026-02-17 | 13F | Amundi | 935.788 | 41.989 | ||||||
| 2026-01-23 | 13F | Avion Wealth | 240 | 0,00 | 0 | |||||
| 2026-01-30 | 13F | Wealthfront Advisers Llc | 16.018 | 36,63 | 719 | -0,42 | ||||
| 2026-02-04 | 13F | Independent Advisor Alliance | 11.747 | -42,28 | 527 | -57,87 | ||||
| 2026-02-02 | 13F | Horizon Investments, LLC | 1.855 | 47,93 | 83 | 7,79 | ||||
| 2026-02-17 | 13F | Cerberus Capital Management, L.P. | 127.201 | 0,00 | 5.708 | -27,04 | ||||
| 2026-02-11 | 13F | IMA Wealth, Inc. | 29 | 1 | ||||||
| 2026-01-22 | 13F | Apollon Wealth Management, LLC | 4.948 | -44,68 | 222 | -59,64 | ||||
| 2026-02-09 | 13F | Allstate Corp | 22.323 | 1.002 | ||||||
| 2026-02-09 | 13F | Hartland & Co., LLC | 11.489 | 12,38 | 516 | -17,99 | ||||
| 2026-01-23 | 13F | Strong Tower Advisory Services | 31.276 | 3,46 | 1.403 | -24,53 | ||||
| 2026-04-02 | 13F | Hilltop National Bank | 325 | 44,44 | 9 | -10,00 | ||||
| 2026-01-14 | 13F | Chesley Taft & Associates LLC | 15.115 | 678 | ||||||
| 2026-02-17 | 13F | Investment Management Corp of Ontario | 20.025 | 899 | ||||||
| 2026-02-05 | 13F | Allworth Financial LP | 4.842 | -18,91 | 217 | -40,87 | ||||
| 2026-01-21 | 13F | Prime Capital Investment Advisors, LLC | 11.675 | 14,02 | 524 | -16,85 | ||||
| 2026-01-26 | 13F | Asset Dedication, LLC | 125 | -73,52 | 6 | -82,76 | ||||
| 2026-02-12 | 13F | Hrt Financial Lp | 0 | -100,00 | 0 | -100,00 | ||||
| 2026-01-12 | 13F | CVA Family Office, LLC | 200 | 9 | ||||||
| 2026-01-30 | 13F | Caldwell Securities, Inc | 250 | 68,92 | 11 | 22,22 | ||||
| 2026-02-10 | 13F | Ilmarinen Mutual Pension Insurance Co | 63.058 | 3 | ||||||
| 2026-01-27 | 13F | Oak Harvest Investment Services | 65.465 | 772,87 | 2.937 | 537,09 | ||||
| 2026-02-10 | 13F | Hazlett, Burt & Watson, Inc. | 95 | 850,00 | 0 | |||||
| 2026-02-17 | 13F | Millennium Management Llc | 116.004 | -72,13 | 5.205 | -79,67 | ||||
| 2026-02-17 | 13F | Millennium Management Llc | Call | 93.700 | 4.204 | |||||
| 2026-02-10 | 13F | Thoroughbred Financial Services, Llc | 31.772 | -2,57 | 1 | -50,00 | ||||
| 2026-02-17 | 13F | Millennium Management Llc | Put | 141.800 | 6.363 | |||||
| 2026-01-26 | 13F | Private Trust Co Na | 1.700 | -33,65 | 76 | -51,59 | ||||
| 2026-02-17 | 13F | Lazard Asset Management Llc | 0 | -100,00 | 0 | -100,00 | ||||
| 2026-02-06 | 13F | New Millennium Group LLC | 157 | 0,00 | 7 | -22,22 | ||||
| 2026-01-30 | 13F/A | M&t Bank Corp | 9.977 | 448 | ||||||
| 2026-02-17 | 13F/A | American Alpha Advisors, LLC | 50.000 | 0,00 | 2.244 | -27,06 | ||||
| 2026-01-26 | 13F | KBC Group NV | 81.590 | 983,39 | 4 | |||||
| 2026-01-27 | 13F | Ticino Wealth | 13.943 | 626 | ||||||
| 2026-01-30 | 13F | Activest Wealth Management | 71 | 0,00 | 3 | -25,00 | ||||
| 2026-02-13 | 13F | Gts Securities Llc | 10.816 | 13,34 | 485 | -17,24 | ||||
| 2026-02-11 | 13F | Modus Advisors, LLC | 8.800 | 0,00 | 395 | -27,17 | ||||
| 2026-02-11 | 13F | Winton Capital Group Ltd | 216.236 | 9.703 | ||||||
| 2026-02-04 | 13F | Fortem Financial Group, Llc | 4.518 | 203 | ||||||
| 2026-02-17 | 13F | Frontier Capital Management Co Llc | 373.245 | -40,59 | 16.748 | -56,66 | ||||
| 2026-02-03 | 13F | Encompass More Asset Management | 31.082 | 1.395 | ||||||
| 2026-02-13 | 13F | Stifel Financial Corp | 39.166 | 21,31 | 1.757 | -11,49 | ||||
| 2026-02-17 | 13F | Engineers Gate Manager LP | 9.589 | 430 | ||||||
| 2026-02-11 | 13F | Vise Technologies, Inc. | 6.334 | 79,59 | 284 | 31,48 | ||||
| 2026-02-03 | 13F | Bokf, Na | 415 | 19 | ||||||
| 2026-02-13 | 13F | First Trust Advisors Lp | 155.870 | -9,39 | 6.994 | -33,90 | ||||
| 2026-02-12 | 13F | IFM Investors Pty Ltd | 55.251 | 2 | ||||||
| 2025-11-12 | 13F | TCG Advisory Services, LLC | Call | 0 | -100,00 | 0 | -100,00 | |||
| 2026-02-13 | 13F | Siren, L.L.C. | 170.000 | 0,00 | 7.628 | -27,05 | ||||
| 2026-02-17 | 13F | First Manhattan Co | 0 | -100,00 | 0 | -100,00 | ||||
| 2026-02-12 | 13F | Castleark Management Llc | 48.320 | -57,75 | 2.168 | -69,17 | ||||
| 2026-02-14 | 13F | BluePath Capital Management, LLC | 25.792 | -30,60 | 1.157 | -49,37 | ||||
| 2026-02-12 | 13F | Great Valley Advisor Group, Inc. | 26.922 | 52,10 | 1.208 | 11,03 | ||||
| 2026-02-04 | 13F | Pure Financial Advisors, Inc. | 15.664 | 6,76 | 703 | -22,17 | ||||
| 2026-01-07 | 13F | Lake Street Financial Llc | 4.700 | 211 | ||||||
| 2026-02-13 | 13F | Verition Fund Management LLC | Put | 13.600 | -2,16 | 610 | -28,57 | |||
| 2026-01-07 | 13F | Harbor Investment Advisory, Llc | 260 | 0,00 | 12 | -26,67 | ||||
| 2026-02-13 | 13F | Verition Fund Management LLC | 16.367 | -55,60 | 734 | -67,61 | ||||
| 2026-01-21 | 13F | Stone House Investment Management, LLC | 50 | -87,50 | 2 | -91,67 | ||||
| 2026-02-13 | 13F | Golden State Wealth Management, LLC | 2.043 | 5,69 | 92 | -22,88 | ||||
| 2026-01-21 | 13F | Westfuller Advisors, LLC | 5.009 | 4.181,20 | 225 | 3.100,00 | ||||
| 2026-02-17 | 13F | Optiver Holding B.V. | 20.966 | 941 | ||||||
| 2026-02-17 | 13F | Advisory Services Network, LLC | 20.806 | -51,20 | 934 | -64,42 | ||||
| 2026-02-17 | 13F | Silvercrest Asset Management Group Llc | 4.871 | -2,58 | 219 | -28,99 | ||||
| 2026-02-17 | 13F | Jones Financial Companies Lllp | 76.211 | 40,06 | 3.420 | -6,58 | ||||
| 2026-02-17 | 13F | Point72 Asset Management, L.P. | Put | 40.900 | 1.835 | |||||
| 2026-01-30 | 13F | North Star Investment Management Corp. | 35 | 0,00 | 2 | -50,00 | ||||
| 2025-11-13 | 13F | Glenmede Investment Management, LP | 5.951 | 26,94 | 366 | 81,59 | ||||
| 2026-02-17 | 13F | Point72 Asset Management, L.P. | Call | 138.300 | 143,06 | 6.206 | 77,34 | |||
| 2026-02-05 | 13F | Elyxium Wealth, LLC | 1.000 | 45 | ||||||
| 2026-03-02 | 13F | Cfo Capital Management Llc | 23.723 | 1.064 | ||||||
| 2026-02-10 | 13F | Acadian Asset Management Llc | 10.872 | 0 | ||||||
| 2026-02-13 | 13F | BRITISH COLUMBIA INVESTMENT MANAGEMENT Corp | 52.564 | 2.359 | ||||||
| 2026-02-13 | 13F | Sei Investments Co | 85.661 | 2,08 | 3.843 | -25,54 | ||||
| 2026-02-06 | 13F | Pathway Financial Advisers, LLC | 0 | -100,00 | 0 | -100,00 | ||||
| 2026-02-23 | 13F | Monetary Solutions, Ltd | 520 | 23 | ||||||
| 2026-01-29 | 13F | Dunhill Financial, LLC | 7 | 0 | ||||||
| 2026-02-13 | 13F | North Ridge Wealth Advisors, Inc. | 100 | 0,00 | 4 | -33,33 | ||||
| 2026-02-17 | 13F | Gladstone Institutional Advisory LLC | 13.953 | 6,37 | 626 | -22,33 | ||||
| 2026-01-14 | 13F | Yarbrough Capital, LLC | 28.992 | 0,00 | 1.301 | -27,09 | ||||
| 2026-03-13 | 13F/A | Pensionmark Financial Group, Llc | 0 | -100,00 | 0 | -100,00 | ||||
| 2026-02-13 | 13F | Macquarie Group Ltd | 6.457 | -98,95 | 290 | -99,23 | ||||
| 2026-02-09 | 13F | Quest Partners LLC | 7.702 | 51,02 | 346 | 10,22 | ||||
| 2026-02-17 | 13F | Lakewood Capital Management, Lp | Put | 50.000 | 2.244 | |||||
| 2026-02-12 | 13F | Wealthspire Advisors, LLC | 7.896 | 57,67 | 354 | 15,31 | ||||
| 2026-01-14 | 13F | Spire Wealth Management | 1.556 | 30,76 | 70 | -5,48 | ||||
| 2026-02-10 | 13F | Bbr Partners, Llc | 11.956 | 0,00 | 536 | -27,07 | ||||
| 2026-02-03 | 13F | International Assets Investment Management, Llc | 17.000 | 199,35 | 763 | 235,68 | ||||
| 2026-02-10 | 13F | Belvedere Trading LLC | Call | 3.100 | 287,50 | 139 | 183,67 | |||
| 2026-02-10 | 13F | Belvedere Trading LLC | Put | 11.400 | 96,55 | 512 | 43,54 | |||
| 2026-02-10 | 13F | IAG Wealth Partners, LLC | 0 | -100,00 | 0 | -100,00 | ||||
| 2026-02-13 | 13F | Barclays Plc | Put | 127.000 | -73,44 | 5.698 | 36,35 | |||
| 2026-02-13 | 13F | Cavalier Investments, LLC | 18.420 | 827 | ||||||
| 2026-02-13 | 13F | Vontobel Holding Ltd. | 44.437 | -3,24 | 1.994 | -29,43 | ||||
| 2026-02-13 | 13F | Barclays Plc | Call | 325.100 | 233,44 | 14.587 | 143,28 | |||
| 2026-02-13 | 13F | Vontobel Holding Ltd. | Put | 14.000 | 900,00 | 628 | 630,23 | |||
| 2026-01-05 | 13F | GAMMA Investing LLC | 3.191 | 28,67 | 143 | -5,92 | ||||
| 2026-02-13 | 13F | Barclays Plc | 878.495 | 9,91 | 39.418 | 464,32 | ||||
| 2026-02-13 | 13F | Vontobel Holding Ltd. | Call | 23.000 | 1.032 | |||||
| 2026-02-12 | 13F | Founders Financial Alliance, LLC | 0 | -100,00 | 0 | -100,00 | ||||
| 2026-02-13 | 13F | Cavalier Investments, LLC | Call | 200.000 | 8.974 | |||||
| 2025-11-14 | 13F/A | Skopos Labs, Inc. | 0 | -100,00 | 0 | -100,00 | ||||
| 2025-11-14 | 13F | Owl Creek Asset Management, L.P. | Call | 0 | -100,00 | 0 | -100,00 | |||
| 2026-02-02 | 13F | RIA Advisory Group LLC | 0 | -100,00 | 0 | -100,00 | ||||
| 2026-02-13 | 13F | Heritage Wealth Advisors | 100 | 33,33 | 4 | 0,00 | ||||
| 2026-01-30 | 13F | Verity Asset Management, Inc. | 9.108 | 36,59 | 409 | -0,49 | ||||
| 2026-02-09 | 13F | Integrity Advisory Solutions, LLC | 0 | -100,00 | 0 | -100,00 | ||||
| 2026-01-26 | 13F | Nations Financial Group Inc, /ia/ /adv | 36.079 | -26,63 | 1.619 | -46,49 |