Grundlæggende statistik
| Institutionelle ejere | 258 total, 258 long only, 0 short only, 0 long/short - change of 10,68% MRQ |
| Gennemsnitlig porteføljeallokering | 0.6277 % - change of -13,97% MRQ |
| Institutionelle aktier (lange) | 48.142.097 (ex 13D/G) - change of 1,67MM shares 3,60% MRQ |
| Institutionel værdi (lang) | $ 2.971.926 USD ($1000) |
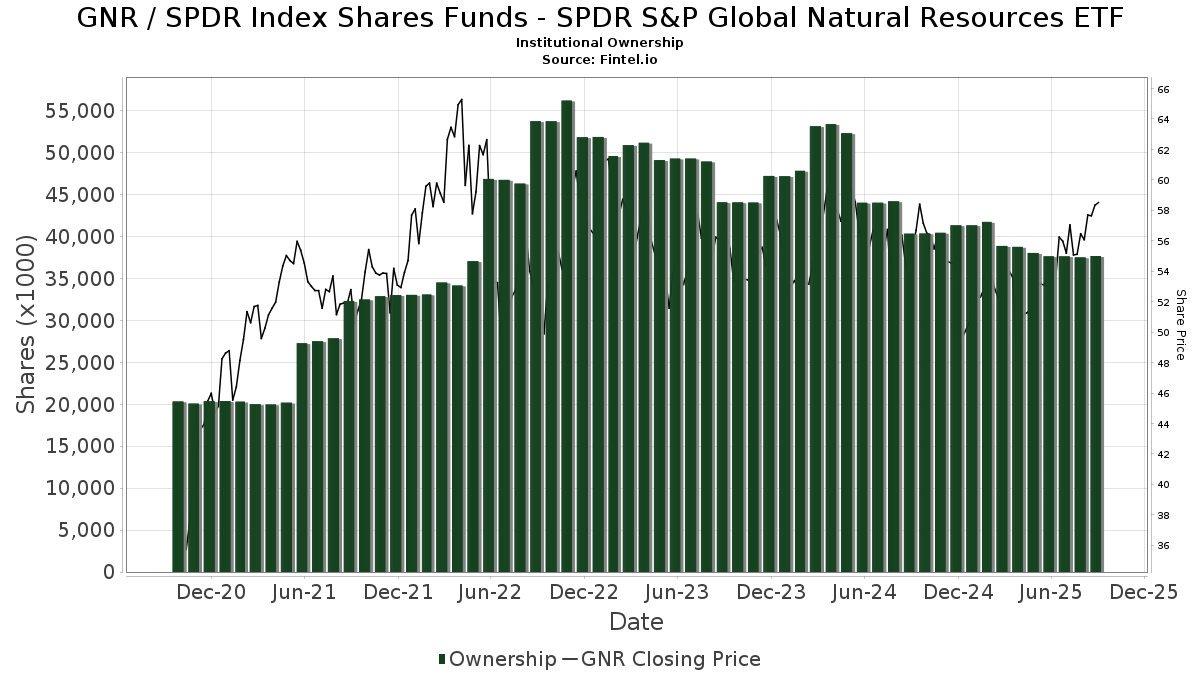
Institutionelt ejerskab og aktionærer
SPDR Index Shares Funds - State Street SPDR S&P Global Natural Resources ETF (US:GNR) har 258 institutionelle ejere og aktionærer, der har indsendt 13D/G- eller 13F-formularer til Securities Exchange Commission (SEC). Disse institutioner har i alt 48,142,097 aktier. Største aktionærer omfatter Northern Trust Corp, First Command Advisory Services, Inc., Envestnet Asset Management Inc, Schroder Investment Management Group, Pure Financial Advisors, Inc., Oxford Financial Group Ltd, Hackensack Meridian Health, Inc., Johns Hopkins University, BlackRock, Inc., and Morgan Stanley .
SPDR Index Shares Funds - State Street SPDR S&P Global Natural Resources ETF (ARCA:GNR) institutionel ejerskabsstruktur viser aktuelle positioner i virksomheden efter institutioner og fonde, samt seneste ændringer i positionsstørrelse. Større aktionærer kan omfatte individuelle investorer, investeringsforeninger, hedgefonde eller institutioner. Skema 13D angiver, at investoren besidder (eller besidder) mere end 5 % af virksomheden og har til hensigt (eller har til hensigt at) aktivt at forfølge en ændring i forretningsstrategi. Skema 13G indikerer en passiv investering på over 5%.
The share price as of March 10, 2026 is 72,78 / share. Previously, on March 11, 2025, the share price was 52,23 / share. This represents an increase of 39,35% over that period.
Fondens stemningsscore
Fund Sentiment Score (fka Ownership Accumulation Score) finder de aktier, der bliver mest købt af fonde. Det er resultatet af en sofistikeret, multi-faktor kvantitativ model, der identificerer virksomheder med de højeste niveauer af institutionel akkumulering. Scoringsmodellen bruger en kombination af den samlede stigning i oplyste ejere, ændringerne i porteføljeallokeringer i disse ejere og andre målinger. Tallet går fra 0 til 100, hvor højere tal indikerer et højere niveau af akkumulering for sine jævnaldrende, og 50 er gennemsnittet.
Opdateringsfrekvens: Dagligt
Se Ownership Explorer, som giver en liste over højest rangerende virksomheder.
AI+ Ask Fintel’s AI assistant about SPDR Index Shares Funds - State Street SPDR S&P Global Natural Resources ETF.
Select a question to share a public post with an AI-crafted answer.
Thinking of good questions…
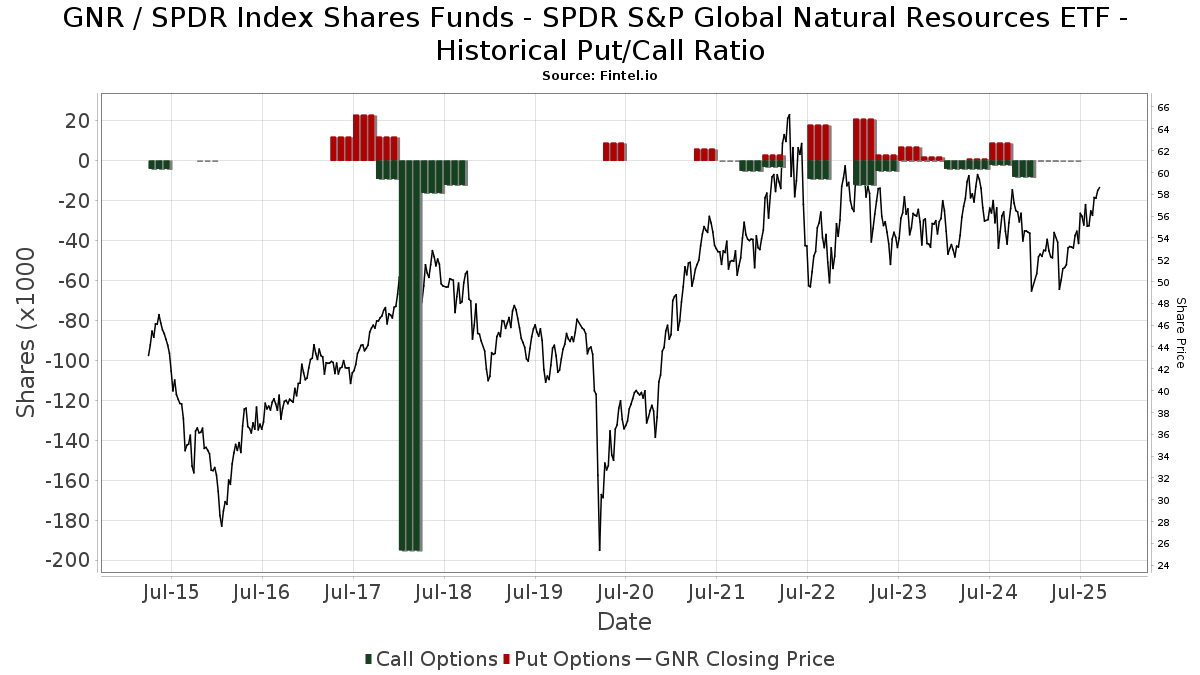
Institutionel Put/Call-forhold
Ud over at indberette standardaktie- og gældsudstedelser skal institutter med mere end 100 mill. aktiver under forvaltning også oplyse deres put- og call-optionsbeholdninger. Da salgsoptioner generelt indikerer negativ stemning, og købsoptioner indikerer positiv stemning, kan vi få en fornemmelse af den overordnede institutionelle stemning ved at plotte forholdet mellem put og kald. Diagrammet til højre viser det historiske put/call-forhold for dette instrument.
Brug af Put/Call Ratio som en indikator for investorernes stemning overvinder en af de vigtigste mangler ved at bruge totalt institutionelt ejerskab, som er, at en betydelig mængde af aktiver under forvaltning investeres passivt for at spore indekser. Passivt forvaltede fonde køber typisk ikke optioner, så indikatoren for put/call-forholdet følger mere nøje følelsen af aktivt forvaltede fonde.
13F og NPORT arkivering
Detaljer om 13F-arkivering er gratis. Detaljer om NP-ansøgninger kræver et premium-medlemskab. Grønne rækker angiver nye positioner. Røde rækker angiver lukkede positioner. Klik på linket ikon for at se den fulde transaktionshistorik.
Opgrader
for at låse premium-data op og eksportere til Excel ![]() .
.
| Fil dato | Kilde | Investor | Type | Gennemsnitlig pris (Øst) |
Aktier | Δ Aktier (%) |
Rapporteret Værdi ($1000) |
Δ Værdi (%) |
Port Alloc (%) |
|
|---|---|---|---|---|---|---|---|---|---|---|
| 2026-01-21 | 13F | Mayfair Advisory Group, LLC | 4.365 | 28,76 | 276 | 38,00 | ||||
| 2026-02-13 | 13F | Aptus Capital Advisors, LLC | 360 | 1,41 | 22 | 4,76 | ||||
| 2026-02-12 | 13F | BRYN MAWR TRUST Co | 10.800 | 0,00 | 671 | 5,01 | ||||
| 2026-02-13 | 13F | Minot DeBlois Advisors LLC | 750 | 0,00 | 47 | 4,55 | ||||
| 2026-02-04 | 13F | Brio Consultants, LLC | 29.468 | 0,31 | 1.831 | 5,29 | ||||
| 2026-02-13 | 13F | Oxford Financial Group Ltd | 1.862.224 | 3,48 | 115.719 | 8,60 | ||||
| 2026-02-17 | 13F | Blair William & Co/il | 4.497 | 23,21 | 279 | 29,17 | ||||
| 2026-02-12 | 13F | BlackRock, Inc. | 1.062.299 | 0,06 | 66.011 | 5,01 | ||||
| 2025-12-16 | 13F | Garde Capital, Inc. | 0 | -100,00 | 0 | -100,00 | ||||
| 2026-03-04 | 13F | SHP Wealth Management | 234 | 15 | ||||||
| 2026-02-17 | 13F | Johns Hopkins University | 1.572.088 | 0,00 | 97.690 | 4,95 | ||||
| 2026-02-04 | 13F | Atlantic Union Bankshares Corp | 405 | 0,75 | 25 | 8,70 | ||||
| 2026-01-23 | 13F | Hedeker Wealth, LLC | 13.628 | 5,48 | 847 | 10,73 | ||||
| 2026-01-20 | 13F | Trust Co Of Toledo Na /oh/ | 13 | 0,00 | 1 | |||||
| 2026-01-29 | 13F | St Germain D J Co Inc | 750 | 0,00 | 47 | 4,55 | ||||
| 2026-02-13 | 13F | National Bank Of Canada /fi/ | 9.029 | 5,80 | 561 | 11,11 | ||||
| 2026-01-02 | 13F | Boltwood Capital Management | 42.575 | -4,97 | 2.646 | -0,26 | ||||
| 2026-01-26 | 13F | Duff & Phelps Investment Management Co | 56.400 | 19,49 | 3.505 | 25,41 | ||||
| 2025-11-13 | 13F | Glenmede Investment Management, LP | 6.473 | 0,00 | 383 | 9,12 | ||||
| 2026-02-13 | 13F | Gts Securities Llc | 24.478 | 165,23 | 1.521 | 178,57 | ||||
| 2026-02-09 | 13F | Harbour Investments, Inc. | 210 | 1,94 | 13 | 8,33 | ||||
| 2026-02-09 | 13F | Annis Gardner Whiting Capital Advisors, LLC | 1.760 | 109 | ||||||
| 2026-02-17 | 13F | Gotham Asset Management, LLC | 38.379 | 0,33 | 2.385 | 5,30 | ||||
| 2026-01-22 | 13F | Treasure Coast Financial Planning | 123.335 | 10,60 | 7.659 | 16,01 | ||||
| 2026-02-13 | 13F | Botty Investors LLC | 6.900 | 0,00 | 429 | 4,90 | ||||
| 2026-01-08 | 13F | Wealth Enhancement Advisory Services, Llc | 21.314 | 10,66 | 1.366 | 19,51 | ||||
| 2026-01-30 | 13F | Sage Rhino Capital Llc | 27.117 | -5,51 | 1.685 | -0,82 | ||||
| 2026-02-06 | 13F | Kimelman & Baird, LLC | 14.500 | 0,00 | 901 | 5,01 | ||||
| 2026-01-20 | 13F | Cromwell Holdings LLC | 0 | -100,00 | 0 | |||||
| 2026-02-17 | 13F | Hanover Advisors Inc | 5.889 | -2,39 | 366 | 2,24 | ||||
| 2026-02-17 | 13F | Old Mission Capital Llc | 11.672 | -28,38 | 725 | -24,87 | ||||
| 2026-01-12 | 13F | Abound Wealth Management | 0 | -100,00 | 0 | |||||
| 2026-01-30 | 13F | Jackson Hole Capital Partners, LLC | 2.502 | 0,00 | 155 | 4,73 | ||||
| 2026-02-11 | 13F | Strategic Advocates LLC | 289 | 0,00 | 18 | 5,88 | ||||
| 2026-02-05 | 13F | Plante Moran Financial Advisors, LLC | 1.087 | 68 | ||||||
| 2026-02-10 | 13F | Godfrey Financial Associates, Inc. | 1.063 | 66 | ||||||
| 2026-01-28 | 13F | HB Wealth Management, LLC | 8.502 | 528 | ||||||
| 2026-02-17 | 13F | Wiley Bros.-aintree Capital, Llc | 13.850 | 155,72 | 861 | 168,75 | ||||
| 2026-02-02 | 13F | Cornerstone Planning Group LLC | 534 | 575,95 | 38 | 362,50 | ||||
| 2026-02-13 | 13F | Brooklands Fund Management Ltd | Call | 0 | -100,00 | 0 | ||||
| 2026-01-30 | 13F | AMG National Trust Bank | 661.418 | 19,44 | 41.101 | 25,35 | ||||
| 2026-02-02 | 13F | Millstone Evans Group, LLC | 130 | 0,00 | 8 | 14,29 | ||||
| 2026-02-13 | 13F | 1832 Asset Management L.P. | 459.825 | 28.574 | ||||||
| 2026-02-19 | 13F | CI Private Wealth, LLC | 6.405 | 398 | ||||||
| 2026-02-09 | 13F | Allen Capital Group, LLC | 22.631 | -0,75 | 1.406 | 4,15 | ||||
| 2026-02-10 | 13F | Savant Capital, LLC | 3.600 | -76,16 | 224 | -75,06 | ||||
| 2026-02-17 | 13F/A | Sentinus, LLC | 29.358 | 1.824 | ||||||
| 2026-02-12 | 13F | Mason Investment Advisory Services, Inc. | 11.857 | 0,70 | 737 | 5,60 | ||||
| 2026-02-10 | 13F | Operose Advisors LLC | 189 | 0,00 | 12 | 0,00 | ||||
| 2026-02-12 | 13F | Litman Gregory Asset Management LLC | 6.766 | 0,00 | 420 | 5,00 | ||||
| 2026-01-08 | 13F | Signet Financial Management, Llc | 7.019 | 40,18 | 436 | 47,30 | ||||
| 2026-02-13 | 13F | Brooklands Fund Management Ltd | 1 | 0 | ||||||
| 2026-01-22 | 13F | Fmb Wealth Management | 21.799 | 0,00 | 1.355 | 4,96 | ||||
| 2026-02-12 | 13F | Conservest Capital Advisors, Inc. | 44.396 | -2,38 | 2.759 | 2,45 | ||||
| 2026-02-02 | 13F | Essex Savings Bank | 3.304 | 205 | ||||||
| 2026-02-10 | 13F/A | Northwestern Mutual Wealth Management Co | 22.326 | 92,13 | 1.387 | 101,89 | ||||
| 2026-02-13 | 13F | Smartleaf Asset Management LLC | 3.673 | 174,31 | 230 | 189,87 | ||||
| 2026-02-13 | 13F | Neuberger Berman Group LLC | 7.669 | 0,00 | 477 | 4,85 | ||||
| 2026-01-26 | 13F | Mirae Asset Global Investments Co., Ltd. | 45.600 | 42,50 | 2.834 | 76,18 | ||||
| 2026-02-11 | 13F | Capital Analysts, Inc. | 2.613 | 0,00 | 0 | |||||
| 2026-02-18 | 13F | GWM Advisors LLC | 0 | -100,00 | 0 | |||||
| 2026-02-17 | 13F | Cambridge Associates Llc /ma/ /adv | 495.844 | 51,29 | 30.812 | 58,78 | ||||
| 2026-02-13 | 13F | Kestra Advisory Services, LLC | 1.398 | 87 | ||||||
| 2026-01-28 | 13F | Kanawha Capital Management Llc | 18.285 | -0,14 | 1.136 | 4,80 | ||||
| 2026-01-26 | 13F | Prairiewood Capital, LLC | 255.519 | 5,27 | 15.878 | 10,48 | ||||
| 2025-09-25 | NP | WMMRX - Wilmington Real Asset Fund Class A Shares | 119.300 | 0,00 | 6.504 | 6,34 | ||||
| 2026-01-23 | 13F | FSM Wealth Advisors, LLC | 4.754 | -8,17 | 295 | -3,59 | ||||
| 2026-01-29 | 13F | Dupree Financial Group, LLC | 8.689 | -2,39 | 540 | 2,28 | ||||
| 2026-01-08 | 13F | Fermata Advisors, LLC | 10.848 | 2,20 | 674 | 7,32 | ||||
| 2026-01-30 | 13F | Palisades Hudson Asset Management, L.P. | 40.822 | -30,37 | 3 | -33,33 | ||||
| 2026-02-10 | 13F | Calton & Associates, Inc. | 3.783 | -1,92 | 235 | 3,07 | ||||
| 2026-02-11 | 13F | LPL Financial LLC | 161.465 | 6,30 | 10.033 | 11,55 | ||||
| 2026-02-17 | 13F | Cardiff Park Advisors, Llc | 0 | -100,00 | 0 | |||||
| 2026-02-17 | 13F | Alliancebernstein L.p. | 521.804 | 4,09 | 32.425 | 9,24 | ||||
| 2026-02-17 | 13F | Creative Planning | 20.829 | -7,71 | 1.294 | -3,14 | ||||
| 2026-02-02 | 13F | Mutual Advisors, LLC | 4.035 | -8,13 | 251 | -4,21 | ||||
| 2026-02-17 | 13F | Ameriprise Financial Inc | 142.370 | 8,68 | 8.840 | 13,96 | ||||
| 2026-01-13 | 13F | Kathmere Capital Management, LLC | 23.141 | 1.438 | ||||||
| 2026-02-05 | 13F | Mesirow Financial Investment Management, Inc. | 4.030 | 1,05 | 250 | 5,93 | ||||
| 2026-02-13 | 13F | Integrated Wealth Concepts LLC | 4.931 | -34,19 | 306 | -30,93 | ||||
| 2026-01-29 | 13F | Warren Street Wealth Advisors, LLC | 179.649 | 1,14 | 11.163 | 6,15 | ||||
| 2026-01-26 | 13F | JNBA Financial Advisors | 4.089 | -2,04 | 254 | 2,83 | ||||
| 2025-11-03 | 13F | Hollencrest Capital Management | 0 | -100,00 | 0 | -100,00 | ||||
| 2026-02-06 | 13F | Cadence Wealth Management LLC | 88.617 | 5,36 | 5.507 | 10,58 | ||||
| 2026-02-02 | 13F | CX Institutional | 219 | -98,23 | 0 | |||||
| 2026-02-13 | 13F | Stifel Financial Corp | 63.779 | 21,33 | 3.963 | 27,35 | ||||
| 2025-11-06 | 13F | Gunma Bank,Ltd. | 0 | -100,00 | 0 | -100,00 | ||||
| 2025-11-12 | 13F | Reyes Financial Architecture, Inc. | 0 | -100,00 | 0 | |||||
| 2026-02-13 | 13F | SRS Capital Advisors, Inc. | 567 | 35 | ||||||
| 2026-03-05 | 13F | Bayban | 10.520 | 654 | ||||||
| 2026-01-26 | 13F | Private Trust Co Na | 1.745 | 0,00 | 108 | 4,85 | ||||
| 2026-01-27 | 13F | Regions Financial Corp | 309 | 18,85 | 0 | |||||
| 2026-02-11 | 13F | Jpmorgan Chase & Co | 562.118 | 2,73 | 34.930 | 7,82 | ||||
| 2026-02-11 | 13F | Dorsey & Whitney Trust CO LLC | 7.506 | 0,00 | 466 | 4,95 | ||||
| 2026-02-10 | 13F | IAG Wealth Partners, LLC | 68.482 | 1,94 | 4.256 | 6,99 | ||||
| 2025-10-21 | 13F | Brookwood Investment Group LLC | 0 | -100,00 | 0 | |||||
| 2026-02-17 | 13F | Cetera Investment Advisers | 68.677 | 0,54 | 4.268 | 5,51 | ||||
| 2026-01-20 | 13F | J2 Capital Management Inc | 10.998 | 6,68 | 683 | 11,97 | ||||
| 2026-02-12 | 13F | Callan Family Office, LLC | 72.005 | 4.474 | ||||||
| 2026-01-20 | 13F | Stratos Wealth Partners, LTD. | 9.209 | 14,55 | 572 | 20,42 | ||||
| 2026-02-03 | 13F | Morton Capital Management LLC/CA | 9.891 | -8,08 | 615 | -3,61 | ||||
| 2026-02-17 | 13F | Advisor Group Holdings, Inc. | 15.919 | 23,65 | 989 | 30,47 | ||||
| 2026-02-13 | 13F | Commerce Bank | 4.025 | -7,89 | 250 | -3,10 | ||||
| 2026-01-29 | 13F | Sanctuary Advisors, LLC | 5.600 | 7,32 | 348 | 12,66 | ||||
| 2026-01-26 | 13F | Phillips Financial Management, Llc | 60.518 | -14,27 | 3.761 | -10,03 | ||||
| 2026-01-21 | 13F | Kfg Wealth Management, Llc | 3.375 | 210 | ||||||
| 2026-02-09 | 13F | Huntington National Bank | 131 | 13.000,00 | ||||||
| 2026-02-11 | 13F | Empowered Funds, LLC | 50.865 | 3.161 | ||||||
| 2025-10-07 | 13F | Salem Investment Counselors Inc | 0 | -100,00 | 0 | |||||
| 2026-01-15 | 13F | One + One Wealth Management, Llc | 33.564 | -3,89 | 2.086 | 0,87 | ||||
| 2026-01-29 | 13F | Simon Quick Advisors, Llc | 16.450 | 0,00 | 1.022 | 4,93 | ||||
| 2026-02-05 | 13F | GSB Wealth Management, LLC | 183 | 7,02 | 11 | 10,00 | ||||
| 2026-02-17 | 13F | Opus Financial Solutions LLC | 6.253 | 389 | ||||||
| 2026-02-17 | 13F | PACK Private Wealth, LLC | 160.496 | 1,35 | 9.973 | 6,37 | ||||
| 2025-11-14 | 13F | D. E. Shaw & Co., Inc. | 0 | -100,00 | 0 | -100,00 | ||||
| 2026-02-17 | 13F | Qube Research & Technologies Ltd | 1.948 | 310,11 | 121 | 332,14 | ||||
| 2026-02-03 | 13F | Legacy Wealth Managment, LLC/ID | 11 | 0,00 | 1 | |||||
| 2026-02-12 | 13F | Jane Street Group, Llc | 34.054 | -65,13 | 2.116 | -63,40 | ||||
| 2026-01-30 | 13F | Us Bancorp \de\ | 19.017 | 0,00 | 1.182 | 4,98 | ||||
| 2026-02-05 | 13F | Elyxium Wealth, LLC | 141 | 9 | ||||||
| 2026-01-22 | 13F | Comprehensive Money Management Services LLC | 11.601 | 0,02 | 721 | 4,96 | ||||
| 2026-01-23 | 13F | Nbt Bank N A /ny | 750 | 0,00 | 47 | 4,55 | ||||
| 2026-02-09 | 13F | Firestone Capital Management | 16.328 | -8,74 | 1.015 | -4,25 | ||||
| 2026-02-13 | 13F | Mml Investors Services, Llc | 12.356 | 43,46 | 768 | 50,69 | ||||
| 2026-02-10 | 13F | DiMeo Schneider & Associates, L.L.C. | 22.953 | -68,22 | 1.426 | -66,65 | ||||
| 2026-02-17 | 13F | Cambria Investment Management, L.P. | 50.865 | 3.161 | ||||||
| 2026-02-10 | 13F | Crescent Grove Advisors, LLC | 55.341 | 13,37 | 3.439 | 18,96 | ||||
| 2026-02-11 | 13F | Vise Technologies, Inc. | 3.821 | 237 | ||||||
| 2026-02-11 | 13F | O'shaughnessy Asset Management, Llc | 451 | 0,00 | 28 | 7,69 | ||||
| 2026-02-17 | 13F | Susquehanna International Group, Llp | Call | 3.400 | 211 | |||||
| 2026-01-14 | 13F | Sterling Investment Advisors Llc /adv | 88.296 | -1,43 | 5.487 | 3,45 | ||||
| 2025-10-16 | 13F | Lowe Wealth Advisors, LLC | 270 | 0,00 | 16 | 7,14 | ||||
| 2026-02-04 | 13F | Pure Financial Advisors, Inc. | 2.140.794 | 4,46 | 133.029 | 9,63 | ||||
| 2026-02-20 | 13F | Catalyst Investment Management LLC | 29.914 | 1.859 | ||||||
| 2026-02-05 | 13F | Allworth Financial LP | 75 | 0,00 | 5 | 0,00 | ||||
| 2026-01-14 | 13F | Pathway Financial Advisors LLC | 8.431 | 0,00 | 540 | 8,22 | ||||
| 2026-01-20 | 13F | Toth Financial Advisory Corp | 27 | 2 | ||||||
| 2026-02-05 | 13F | Navalign, LLC | 3.007 | 187 | ||||||
| 2026-01-23 | 13F | Rsm Us Wealth Management Llc | 14.750 | -14,69 | 922 | -9,97 | ||||
| 2026-02-13 | 13F | Baird Financial Group, Inc. | 3.817 | 0,00 | 237 | 4,87 | ||||
| 2026-02-17 | 13F | Jones Financial Companies Lllp | 8.937 | 120,23 | 555 | 131,25 | ||||
| 2026-02-13 | 13F | Bristlecone Value Partners, LLC | 50.369 | 3.130 | ||||||
| 2026-01-08 | 13F | Asempa Wealth Advisors | 7.906 | 491 | ||||||
| 2026-02-11 | 13F | TCTC Holdings, LLC | 175 | 0,00 | 11 | 0,00 | ||||
| 2026-01-29 | 13F | UBS Group AG | 444.653 | 1,48 | 27.631 | 6,50 | ||||
| 2026-01-30 | 13F | Caldwell Trust Co | 1.800 | -26,56 | 112 | -23,45 | ||||
| 2026-02-05 | 13F | Hills Bank & Trust Co | 44.967 | 0,02 | 2.794 | 5,00 | ||||
| 2026-02-06 | 13F | Evoke Wealth, Llc | 105.828 | 4,20 | 6.576 | 9,36 | ||||
| 2026-02-19 | 13F | TMB Capital Partners, LLC | 67.500 | 4.194 | ||||||
| 2025-11-14 | 13F | Susquehanna International Group, Llp | 0 | -100,00 | 0 | -100,00 | ||||
| 2026-02-13 | 13F | Schroder Investment Management Group | 2.491.686 | 155.705 | ||||||
| 2026-02-10 | 13F | Bnp Paribas Arbitrage, Sa | 0 | -100,00 | 0 | |||||
| 2026-01-20 | 13F | AdvisorNet Financial, Inc | 1.226 | 0,08 | 76 | 5,56 | ||||
| 2026-01-28 | 13F | Geneos Wealth Management Inc. | 2.070 | 0,00 | 129 | 4,92 | ||||
| 2026-01-30 | 13F | SOL Capital Management CO | 34.670 | -11,49 | 2 | 0,00 | ||||
| 2026-02-13 | 13F | Manufacturers Life Insurance Company, The | 47.821 | -2,99 | 2.972 | 1,82 | ||||
| 2026-01-23 | 13F | Farther Finance Advisors, LLC | 13.505 | 39,47 | 839 | 46,42 | ||||
| 2026-02-03 | 13F | NewEdge Wealth, LLC | 8.043 | -11,31 | 500 | -5,31 | ||||
| 2026-02-20 | 13F | Sunbelt Securities, Inc. | 13 | 0,00 | 1 | |||||
| 2026-02-13 | 13F | Kayne Anderson Rudnick Investment Management Llc | 187 | 0,00 | 12 | 0,00 | ||||
| 2026-01-13 | 13F | Mather Group, Llc. | 5.708 | 0,00 | 355 | 5,04 | ||||
| 2026-02-17 | 13F | Northern Trust Corp | 12.760.196 | -2,00 | 792.919 | 2,84 | ||||
| 2026-01-26 | 13F | AE Wealth Management LLC | 2.093 | 149,76 | 130 | 165,31 | ||||
| 2026-01-29 | 13F | TKG Advisors, LLC | 5.493 | 0,00 | 341 | 4,92 | ||||
| 2026-02-17 | 13F | Aqr Capital Management Llc | 25.839 | -1,97 | 1.606 | 2,88 | ||||
| 2026-02-13 | 13F | Wells Fargo & Company/mn | 291.244 | -6,09 | 18.098 | -1,44 | ||||
| 2026-02-13 | 13F | Satovsky Asset Management Llc | 142.670 | 1,99 | 8.866 | 7,03 | ||||
| 2025-11-06 | 13F | Boston Private Wealth Llc | 0 | -100,00 | 0 | -100,00 | ||||
| 2025-11-06 | 13F | Abich Financial Wealth Management LLC | 116 | 7 | ||||||
| 2026-01-08 | 13F | Old Port Advisors | 9.467 | -2,30 | 588 | 2,62 | ||||
| 2026-02-17 | 13F | Regal Investment Advisors LLC | 48.285 | 0,68 | 3.000 | 5,67 | ||||
| 2026-02-06 | 13F | IFP Advisors, Inc | 0 | -100,00 | 0 | -100,00 | ||||
| 2026-01-13 | 13F | CoreCap Advisors, LLC | 2.405 | 149 | ||||||
| 2026-02-13 | 13F | Umb Bank N A/mo | 0 | -100,00 | 0 | |||||
| 2025-10-30 | 13F | WFA Asset Management Corp | 493 | 0,00 | 28 | 3,70 | ||||
| 2026-01-08 | 13F | Versant Capital Management, Inc | 160.828 | -0,05 | 9.994 | 4,89 | ||||
| 2026-02-12 | 13F | Commonwealth Equity Services, Llc | 44.429 | 1,13 | 2.761 | 137.900,00 | ||||
| 2026-01-07 | 13F | Harbor Investment Advisory, Llc | 2.602 | 6.405,00 | 162 | 7.950,00 | ||||
| 2026-01-23 | 13F | Patriot Investment Management Inc. | 3.625 | -18,90 | 225 | -14,77 | ||||
| 2026-02-02 | 13F | Principal Financial Group Inc | 216.150 | -1,19 | 13.432 | 3,70 | ||||
| 2026-02-10 | 13F | Fort Sheridan Advisors Llc | 3.765 | -3,24 | 234 | 1,30 | ||||
| 2026-02-17 | 13F | Captrust Financial Advisors | 170.134 | 3,23 | 10.572 | 8,34 | ||||
| 2026-01-21 | 13F | Stone House Investment Management, LLC | 1.560 | -2,32 | 97 | 2,13 | ||||
| 2026-01-21 | 13F | Sound Income Strategies, LLC | 155 | 715,79 | 10 | 900,00 | ||||
| 2026-01-16 | 13F | Worth Financial Advisory Group, LLC | 4.061 | -6,21 | 252 | -1,56 | ||||
| 2026-02-13 | 13F | Mariner, LLC | 74.034 | 0,58 | 4.600 | 5,55 | ||||
| 2026-01-29 | 13F | D.a. Davidson & Co. | 61.392 | 2,14 | 3.815 | 7,20 | ||||
| 2026-01-13 | 13F | Bank & Trust Co | 110 | 7 | ||||||
| 2026-01-23 | 13F | Brown, Lisle/cummings, Inc. | 67 | 0,00 | 4 | 33,33 | ||||
| 2026-02-10 | 13F | Hackensack Meridian Health, Inc. | 1.606.000 | 0,00 | 99.797 | 4,95 | ||||
| 2025-11-12 | 13F | CIBC Bancorp USA Inc. | 5.361 | 317 | ||||||
| 2026-01-22 | 13F | Cornerstone Partners Capital Management, Llc | 352.374 | 0,00 | 21.897 | 4,95 | ||||
| 2026-02-17 | 13F | Advisory Services Network, LLC | 0 | -100,00 | 0 | |||||
| 2026-02-06 | 13F | HighTower Advisors, LLC | 4.036 | -8,71 | 251 | -4,21 | ||||
| 2026-01-14 | 13F | Spire Wealth Management | 106 | 0,00 | 7 | 0,00 | ||||
| 2026-01-20 | 13F | Signaturefd, Llc | 400 | 166,67 | 25 | 200,00 | ||||
| 2026-02-13 | 13F | Ingalls & Snyder Llc | 25.465 | 38,10 | 2 | 0,00 | ||||
| 2025-11-14 | 13F | Flow Traders U.s. Llc | 0 | -100,00 | 0 | -100,00 | ||||
| 2026-01-06 | 13F | Chemistry Wealth Management LLC | 35.588 | 3,91 | 2.211 | 9,08 | ||||
| 2026-02-13 | 13F | Citigroup Inc | 8.748 | -5,72 | 544 | -1,09 | ||||
| 2026-02-17 | 13F | Mercer Global Advisors Inc /adv | 84.999 | 3,46 | 5.282 | 8,57 | ||||
| 2026-02-17 | 13F | Royal Bank Of Canada | 113.576 | 1,48 | 7.057 | 6,49 | ||||
| 2026-01-15 | 13F | Fifth Third Wealth Advisors LLC | 13.070 | 0,00 | 812 | 5,05 | ||||
| 2026-02-12 | 13F | CIBC Private Wealth Group, LLC | 5.613 | 9,69 | 349 | 15,23 | ||||
| 2026-01-13 | 13F | Sendero Wealth Management, LLC | 241.194 | -19,65 | 14.988 | -15,68 | ||||
| 2026-01-20 | 13F | Savvy Advisors, Inc. | 3.632 | -0,11 | 226 | 4,65 | ||||
| 2026-02-17 | 13F | Cresset Asset Management, LLC | 6.969 | 3,78 | 433 | 9,07 | ||||
| 2026-02-17 | 13F | Citadel Advisors Llc | 0 | -100,00 | 0 | |||||
| 2026-01-29 | 13F | Nbc Securities, Inc. | 29 | 0,00 | 2 | 0,00 | ||||
| 2026-01-26 | 13F | Cwm, Llc | 552 | -36,11 | 0 | |||||
| 2026-02-17 | 13F | Raymond James Financial Inc | 418.689 | -0,94 | 26.017 | 3,96 | ||||
| 2025-10-31 | 13F | Cullen/frost Bankers, Inc. | 0 | -100,00 | 0 | -100,00 | ||||
| 2026-02-05 | 13F | Landmark Wealth Management, LLC | 35.834 | -0,04 | 2.227 | 4,90 | ||||
| 2026-02-17 | 13F | Redwood Park Advisors LLC | 11.117 | 2,24 | 691 | 7,31 | ||||
| 2026-02-09 | 13F | Prospera Financial Services Inc | 6.836 | 0,01 | 425 | 4,95 | ||||
| 2026-01-23 | 13F | Assetmark, Inc | 367 | 71,50 | 23 | 83,33 | ||||
| 2026-02-10 | 13F | Rock Creek Group, LP | 5.916 | -34,27 | 368 | -31,02 | ||||
| 2026-01-23 | 13F | Stephenson National Bank & Trust | 35.045 | -0,80 | 2.178 | 4,11 | ||||
| 2025-11-14 | 13F | Wood Tarver Financial Group, LLC | 0 | -100,00 | 0 | |||||
| 2026-01-12 | 13F | Fiduciary Financial Group, Llc | 137.787 | 8,76 | 8.562 | 14,14 | ||||
| 2026-02-12 | 13F | Summit Financial, LLC | 80.865 | 0,37 | 5.025 | 5,32 | ||||
| 2026-02-17 | 13F | Nepc Llc | 870.237 | 19,07 | 54.077 | 24,96 | ||||
| 2026-01-29 | 13F | Comerica Bank | 16.793 | -9,04 | 1.044 | -4,57 | ||||
| 2026-02-05 | 13F | Lynx Investment Advisory | 12.007 | -9,48 | 746 | -4,97 | ||||
| 2026-02-02 | 13F | Sachetta, LLC | 209.044 | 1,07 | 12.990 | 6,08 | ||||
| 2026-02-13 | 13F | VPR Management LLC | 77.550 | 0,00 | 4.819 | 4,94 | ||||
| 2026-02-17 | 13F | Fmr Llc | 521.429 | -13,65 | 32.402 | -9,38 | ||||
| 2026-02-11 | 13F | Cerity Partners LLC | 67.650 | -3,28 | 4.204 | 1,50 | ||||
| 2026-02-18 | 13F | Mackenzie Financial Corp | 6.550 | 61,25 | 409 | 70,00 | ||||
| 2025-11-13 | 13F | Visionary Wealth Advisors | 0 | -100,00 | 0 | -100,00 | ||||
| 2026-02-04 | 13F | Hirtle Callaghan & Co LLC | 4.926 | -3,15 | 306 | 1,66 | ||||
| 2026-02-17 | 13F | Perritt Capital Management Inc | 0 | -100,00 | 0 | |||||
| 2026-02-11 | 13F | First Command Advisory Services, Inc. | 5.359.762 | 5,78 | 333.056 | 11,01 | ||||
| 2026-02-17 | 13F | Glenmede Trust Co Na | 6.473 | -31,88 | 402 | -20,55 | ||||
| 2026-01-14 | 13F | ORG Partners LLC | 200 | 0,00 | 12 | 9,09 | ||||
| 2026-01-20 | 13F | White & Co Financial Planning Inc | 58.966 | -0,04 | 3.664 | 4,93 | ||||
| 2026-02-17 | 13F | Snowden Capital Advisors LLC | 7.671 | 0,00 | 477 | 4,85 | ||||
| 2026-02-12 | 13F | Hudock, Inc. | 4.447 | 1,00 | 276 | 6,15 | ||||
| 2026-01-29 | 13F | 4Thought Financial Group Inc. | 793 | 49 | ||||||
| 2026-01-29 | 13F | Almanack Investment Partners, LLC. | 12.803 | 3,75 | 796 | 8,90 | ||||
| 2026-02-20 | 13F | Cambient Family Office, Llc | 11.313 | 703 | ||||||
| 2026-02-03 | 13F | CGC Financial Services, LLC | 7 | 0 | ||||||
| 2026-02-05 | 13F | Cambridge Investment Research Advisors, Inc. | 4.411 | 0 | ||||||
| 2026-01-27 | 13F | Belpointe Asset Management LLC | 4.898 | -12,18 | 304 | -7,88 | ||||
| 2026-02-05 | 13F | Thrivent Financial For Lutherans | 167.456 | 10 | ||||||
| 2026-02-18 | 13F | Beacon Pointe Advisors, LLC | 5.191 | 323 | ||||||
| 2026-02-14 | 13F | Rockefeller Capital Management L.P. | 105.492 | 14,47 | 6.555 | 20,14 | ||||
| 2026-02-10 | 13F | Bank of New York Mellon Corp | 177.745 | -33,73 | 11.045 | -30,45 | ||||
| 2026-02-12 | 13F | Oath Planning, LLC | 5.861 | 364 | ||||||
| 2026-02-12 | 13F | Renaissance Technologies Llc | 8.800 | -65,35 | 547 | -63,67 | ||||
| 2026-01-16 | 13F | Perigon Wealth Management, LLC | 24.993 | 18,43 | 1.553 | 24,34 | ||||
| 2026-02-13 | 13F | Morgan Stanley | 1.057.386 | -0,39 | 65.706 | 4,54 | ||||
| 2026-02-13 | 13F | Colony Group, LLC | 24.971 | 8,92 | 1.552 | 14,30 | ||||
| 2026-02-10 | 13F | Envestnet Asset Management Inc | 4.659.957 | 0,29 | 289.570 | 5,25 | ||||
| 2026-02-12 | 13F | Bank Of Montreal /can/ | 114.913 | -2,24 | 7.141 | 2,59 | ||||
| 2026-01-29 | 13F | Managed Asset Portfolios, Llc | 12.547 | 780 | ||||||
| 2026-01-21 | 13F | Newbridge Financial Services Group, Inc. | 18 | 0,00 | 1 | 0,00 | ||||
| 2026-02-13 | 13F | Hurley Capital, LLC | 1.100 | 0,00 | 68 | 4,62 | ||||
| 2025-10-22 | 13F | OneAscent Financial Services LLC | 13.886 | -13,49 | 822 | |||||
| 2026-02-12 | 13F | Steward Partners Investment Advisory, Llc | 1.119 | -15,67 | 70 | -11,54 | ||||
| 2026-02-03 | 13F | Sequoia Financial Advisors, LLC | 11.132 | 2,59 | 692 | 7,63 | ||||
| 2026-01-26 | 13F | Valmark Advisers, Inc. | 102.433 | -5,89 | 6.365 | -1,23 | ||||
| 2026-02-10 | 13F | Natixis Advisors, L.p. | 0 | -100,00 | 0 | |||||
| 2026-02-13 | 13F | Charles Schwab Investment Management Inc | 335.418 | -2,54 | 20.843 | 2,28 | ||||
| 2026-02-05 | 13F | United Bank | 10.668 | 0,00 | 663 | 4,91 | ||||
| 2026-01-26 | 13F | Main Street Group, LTD | 0 | -100,00 | 0 | |||||
| 2026-02-17 | 13F | Bank Of America Corp /de/ | 803.996 | -17,40 | 49.960 | -13,31 | ||||
| 2026-02-11 | 13F | Parallel Advisors, LLC | 100 | 0,00 | 6 | 20,00 | ||||
| 2025-10-31 | 13F | Whittier Trust Co Of Nevada Inc | 0 | -100,00 | 0 | -100,00 | ||||
| 2025-11-12 | 13F | Simplex Trading, Llc | 0 | -100,00 | 0 | |||||
| 2026-01-30 | 13F/A | M&t Bank Corp | 123.251 | 3.019,49 | 7.659 | 3.186,70 | ||||
| 2026-02-02 | 13F | Longview Financial Advisors, Inc. | 19.624 | -1,01 | 1.219 | 3,92 | ||||
| 2026-02-04 | 13F | Meridian Wealth Management, LLC | 3.700 | 0,00 | 230 | 4,57 | ||||
| 2026-01-05 | 13F | Park Avenue Securities Llc | 0 | -100,00 | 0 | |||||
| 2026-02-13 | 13F | MAI Capital Management | 698 | 63,08 | 43 | 72,00 | ||||
| 2026-02-05 | 13F | Bessemer Group Inc | 36.681 | -24,64 | 2 | 0,00 | ||||
| 2026-01-29 | 13F | Global Strategic Investment Solutions, LLC | 23.748 | -11,12 | 1.476 | -6,76 | ||||
| 2026-02-13 | 13F | Haverford Trust Co | 30.101 | 1.870 | ||||||
| 2026-01-23 | 13F | Sage Mountain Advisors LLC | 13.394 | 0,00 | 832 | 4,92 | ||||
| 2026-01-30 | 13F | Wealthfront Advisers Llc | 41.347 | 11,47 | 2.569 | 16,99 | ||||
| 2026-02-10 | 13F | Goldman Sachs Group Inc | 10.050 | 67,30 | 625 | 75,77 | ||||
| 2026-01-08 | 13F | Grove Bank & Trust | 485 | 0,00 | 30 | 7,14 | ||||
| 2026-01-12 | 13F | Spinnaker Investment Group, LLC | 6.514 | -1,23 | 405 | 3,59 | ||||
| 2026-02-09 | 13F | Clune & Associates, Ltd. | 22.000 | 8,74 | 1.367 | 14,20 | ||||
| 2026-02-17 | 13F | Hilltop Holdings Inc. | 27.034 | 1.680 | ||||||
| 2026-01-14 | 13F | Wealthcare Advisory Partners LLC | 25.019 | -0,08 | 1.555 | 4,86 | ||||
| 2026-02-06 | 13F | Pnc Financial Services Group, Inc. | 7.303 | -0,23 | 454 | 4,62 | ||||
| 2026-02-13 | 13F | Pathstone Holdings, LLC | 22.780 | 0,00 | 1.416 | 4,97 |