Grundlæggende statistik
| Institutionelle ejere | 336 total, 336 long only, 0 short only, 0 long/short - change of 6,58% MRQ |
| Gennemsnitlig porteføljeallokering | 0.3460 % - change of -33,90% MRQ |
| Institutionelle aktier (lange) | 110.569.619 (ex 13D/G) - change of 2,29MM shares 2,12% MRQ |
| Institutionel værdi (lang) | $ 2.743.881 USD ($1000) |
Institutionelt ejerskab og aktionærer
VanEck ETF Trust - VanEck J.P. Morgan EM Local Currency Bond ETF (US:EMLC) har 336 institutionelle ejere og aktionærer, der har indsendt 13D/G- eller 13F-formularer til Securities Exchange Commission (SEC). Disse institutioner har i alt 110,569,619 aktier. Største aktionærer omfatter Charles Schwab Investment Management Inc, Sei Investments Co, Adventist Health System Sunbelt Healthcare Corp, Valmark Advisers, Inc., Varma Mutual Pension Insurance Co, IMC-Chicago, LLC, BlackRock, Inc., Envestnet Asset Management Inc, Wright Fund Managment, LLC, and Asset Management One Co., Ltd. .
VanEck ETF Trust - VanEck J.P. Morgan EM Local Currency Bond ETF (ARCA:EMLC) institutionel ejerskabsstruktur viser aktuelle positioner i virksomheden efter institutioner og fonde, samt seneste ændringer i positionsstørrelse. Større aktionærer kan omfatte individuelle investorer, investeringsforeninger, hedgefonde eller institutioner. Skema 13D angiver, at investoren besidder (eller besidder) mere end 5 % af virksomheden og har til hensigt (eller har til hensigt at) aktivt at forfølge en ændring i forretningsstrategi. Skema 13G indikerer en passiv investering på over 5%.
The share price as of March 2, 2026 is 26,17 / share. Previously, on March 3, 2025, the share price was 23,64 / share. This represents an increase of 10,70% over that period.

Fondens stemningsscore
Fund Sentiment Score (fka Ownership Accumulation Score) finder de aktier, der bliver mest købt af fonde. Det er resultatet af en sofistikeret, multi-faktor kvantitativ model, der identificerer virksomheder med de højeste niveauer af institutionel akkumulering. Scoringsmodellen bruger en kombination af den samlede stigning i oplyste ejere, ændringerne i porteføljeallokeringer i disse ejere og andre målinger. Tallet går fra 0 til 100, hvor højere tal indikerer et højere niveau af akkumulering for sine jævnaldrende, og 50 er gennemsnittet.
Opdateringsfrekvens: Dagligt
Se Ownership Explorer, som giver en liste over højest rangerende virksomheder.
AI+ Ask Fintel’s AI assistant about VanEck ETF Trust - VanEck J.P. Morgan EM Local Currency Bond ETF.
Select a question to share a public post with an AI-crafted answer.
Thinking of good questions…
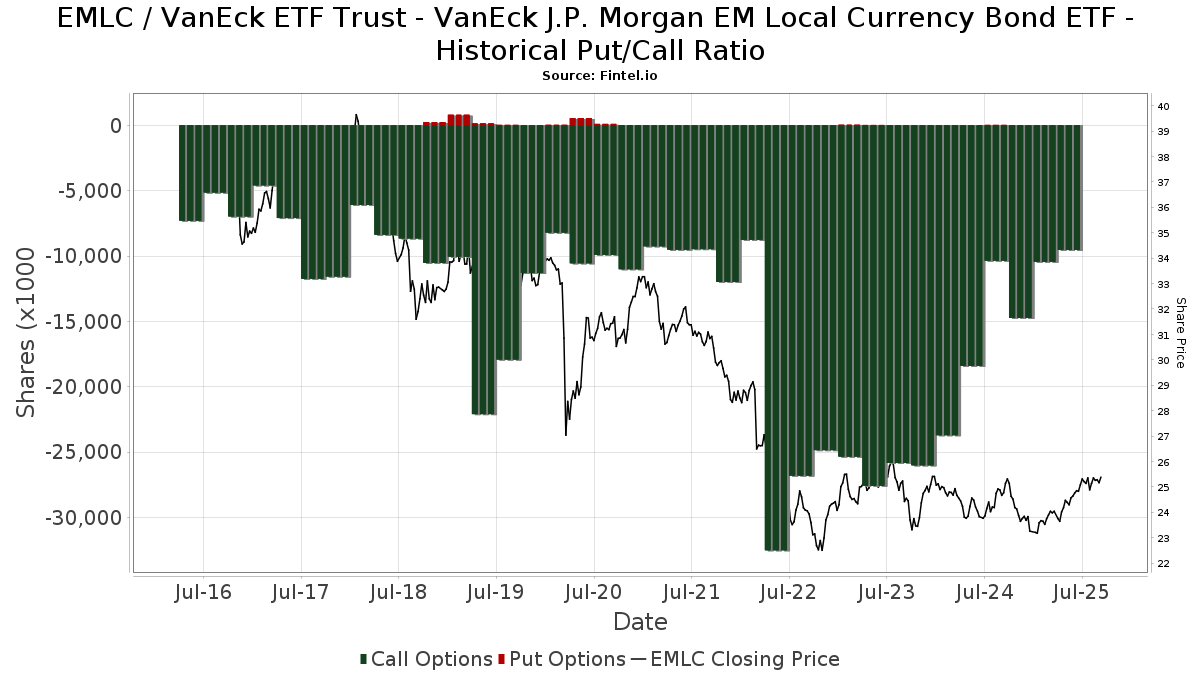
Institutionel Put/Call-forhold
Ud over at indberette standardaktie- og gældsudstedelser skal institutter med mere end 100 mill. aktiver under forvaltning også oplyse deres put- og call-optionsbeholdninger. Da salgsoptioner generelt indikerer negativ stemning, og købsoptioner indikerer positiv stemning, kan vi få en fornemmelse af den overordnede institutionelle stemning ved at plotte forholdet mellem put og kald. Diagrammet til højre viser det historiske put/call-forhold for dette instrument.
Brug af Put/Call Ratio som en indikator for investorernes stemning overvinder en af de vigtigste mangler ved at bruge totalt institutionelt ejerskab, som er, at en betydelig mængde af aktiver under forvaltning investeres passivt for at spore indekser. Passivt forvaltede fonde køber typisk ikke optioner, så indikatoren for put/call-forholdet følger mere nøje følelsen af aktivt forvaltede fonde.
13F og NPORT arkivering
Detaljer om 13F-arkivering er gratis. Detaljer om NP-ansøgninger kræver et premium-medlemskab. Grønne rækker angiver nye positioner. Røde rækker angiver lukkede positioner. Klik på linket ikon for at se den fulde transaktionshistorik.
Opgrader
for at låse premium-data op og eksportere til Excel ![]() .
.
| Fil dato | Kilde | Investor | Type | Gennemsnitlig pris (Øst) |
Aktier | Δ Aktier (%) |
Rapporteret Værdi ($1000) |
Δ Værdi (%) |
Port Alloc (%) |
|
|---|---|---|---|---|---|---|---|---|---|---|
| 2026-01-22 | 13F | Pinnacle Bancorp, Inc. | 312 | 0,00 | 8 | 14,29 | ||||
| 2026-02-06 | 13F | Csenge Advisory Group | 38.812 | 10,46 | 1.002 | 11,83 | ||||
| 2026-02-10 | 13F | Waterloo Capital, L.P. | 218.905 | 101,44 | 5.652 | 103,90 | ||||
| 2026-01-29 | 13F | DecisionPoint Financial, LLC | 96 | 2 | ||||||
| 2026-02-17 | 13F | Private Advisor Group, LLC | 60.502 | 14,22 | 1.562 | 15,62 | ||||
| 2025-11-20 | 13F | Asset Dedication, LLC | 0 | -100,00 | 0 | |||||
| 2026-02-17 | 13F | Tower Research Capital LLC (TRC) | 426 | 11 | ||||||
| 2026-02-09 | 13F | Key FInancial Inc | 4 | 0,00 | 0 | |||||
| 2026-02-05 | 13F | Park Square Financial Group, LLC | 0 | -100,00 | 0 | |||||
| 2026-02-06 | 13F | Vestmark Advisory Solutions, Inc. | 402.437 | 10.391 | ||||||
| 2025-12-09 | 13F | Painted Porch Advisors LLC | 332 | 1,53 | 8 | 0,00 | ||||
| 2026-01-26 | 13F | AE Wealth Management LLC | 20.812 | 0,28 | 537 | 1,51 | ||||
| 2026-02-10 | 13F | Patrick Mauro Investment Advisor, INC. | 29.610 | 180,21 | 765 | 184,01 | ||||
| 2026-02-11 | 13F | Invst, LLC | 21.137 | 546 | ||||||
| 2026-01-26 | 13F | BCS Wealth Management | 8.440 | 218 | ||||||
| 2026-02-03 | 13F | SBI Securities Co., Ltd. | 11.122 | 32,33 | 287 | 34,11 | ||||
| 2026-02-10 | 13F | Root Financial Partners, LLC | 2.164 | -23,72 | 56 | -23,61 | ||||
| 2026-01-26 | 13F | Main Street Group, LTD | 0 | -100,00 | 0 | |||||
| 2026-02-06 | 13F | Payden & Rygel | 2.435.462 | 63 | ||||||
| 2026-02-13 | 13F | Motiv8 Investments LLC | 7 | 0 | ||||||
| 2026-01-26 | 13F | Merit Financial Group, LLC | 141.042 | 2,75 | 3.642 | 4,00 | ||||
| 2026-02-13 | 13F | Commerce Bank | 12.347 | 319 | ||||||
| 2026-01-29 | 13F | Sanctuary Advisors, LLC | 20.201 | 72,82 | 522 | 74,83 | ||||
| 2025-11-14 | 13F | Citadel Advisors Llc | Call | 0 | -100,00 | 0 | -100,00 | |||
| 2026-02-13 | 13F | Wells Fargo & Company/mn | 2.098.757 | 6,62 | 54.190 | 7,91 | ||||
| 2025-10-16 | 13F | Lowe Wealth Advisors, LLC | 15 | 0 | ||||||
| 2026-02-13 | 13F | MAI Capital Management | 2.441 | 20,48 | 63 | 23,53 | ||||
| 2026-02-12 | 13F | Mount Yale Investment Advisors, LLC | 147.351 | 3.805 | ||||||
| 2026-02-17 | 13F | Guggenheim Capital Llc | 411.029 | 11,03 | 10.613 | 12,37 | ||||
| 2026-02-17 | 13F | Citadel Advisors Llc | 65.736 | 23,21 | 1.697 | 24,69 | ||||
| 2026-02-17 | 13F | Captrust Financial Advisors | 247.237 | 0,13 | 6.384 | 1,35 | ||||
| 2025-11-21 | 13F/A | CIBC Bancorp USA Inc. | Call | 200.000 | 15.280 | |||||
| 2026-02-05 | 13F | AlphaCore Capital LLC | 59.046 | 11,94 | 1.525 | 13,31 | ||||
| 2026-02-13 | 13F | Integrity Financial Corp /WA | 271 | 7 | ||||||
| 2026-02-10 | 13F | Basepoint Wealth LLC | 76 | 2 | ||||||
| 2026-02-13 | 13F | Morgan Stanley | 2.546.122 | -5,84 | 65.741 | -4,70 | ||||
| 2026-02-20 | 13F | Sunbelt Securities, Inc. | 3 | 0,00 | 0 | |||||
| 2025-11-07 | 13F | TCTC Holdings, LLC | 0 | -100,00 | 0 | |||||
| 2026-02-13 | 13F | Marathon Trading Investment Management LLC | Call | 61.000 | 2.552,17 | 5.506 | 747,08 | |||
| 2026-01-23 | 13F | Avion Wealth | 709 | 0,00 | 0 | |||||
| 2026-01-21 | 13F | Signature Resources Capital Management, LLC | 616 | 0,00 | 16 | 0,00 | ||||
| 2026-02-10 | 13F | Calton & Associates, Inc. | 12.184 | -16,71 | 315 | -15,82 | ||||
| 2025-11-14 | 13F | Susquehanna International Group, Llp | Put | 0 | -100,00 | 0 | -100,00 | |||
| 2025-10-31 | 13F | Barrett & Company, Inc. | 0 | -100,00 | 0 | |||||
| 2026-02-03 | 13F | McIlrath & Eck, LLC | 433 | 0,00 | 11 | 0,00 | ||||
| 2025-09-26 | NP | BDBT - Bluemonte Core Bond ETF | 129 | 3 | ||||||
| 2026-01-28 | 13F | Arkansas Financial Group, Inc. | 8.620 | 4,38 | 223 | 5,71 | ||||
| 2026-01-29 | 13F | Spurstone Advisory Services, LLC | 11 | 0,00 | 0 | |||||
| 2026-01-15 | 13F | Columbus Macro, LLC | 42.172 | 43,69 | 1.089 | 45,45 | ||||
| 2026-02-27 | 13F | Arwa Llc | 16.814 | 434 | ||||||
| 2026-02-12 | 13F | Renaissance Technologies Llc | 55.051 | 1.421 | ||||||
| 2025-09-26 | NP | BLACKROCK GLOBAL ALLOCATION FUND, INC. - BLACKROCK GLOBAL ALLOCATION FUND, INC. Investor A This fund is a listed as child fund of BlackRock, Inc. and if that institution has disclosed ownership in this security, then these positions will not be double counted when calculating total shares and total value | 531.633 | 0,00 | 13.222 | 1,63 | ||||
| 2026-02-11 | 13F | LPL Financial LLC | 1.026.661 | 219,75 | 26.508 | 223,66 | ||||
| 2026-01-13 | 13F | Olistico Wealth, LLC | 502 | 13 | ||||||
| 2026-02-14 | 13F | Rockefeller Capital Management L.P. | 104.784 | 62,59 | 1.424 | -13,44 | ||||
| 2026-01-15 | 13F | Stewardship Advisors, LLC | 21.924 | 5,01 | 566 | 6,39 | ||||
| 2026-02-09 | 13F | Huntington National Bank | 2 | |||||||
| 2026-02-12 | 13F | Cibc World Markets Corp | Call | 55.000 | 10,00 | 6.089 | 133,92 | |||
| 2026-01-29 | 13F | Kestra Private Wealth Services, Llc | 10.773 | 2,27 | 278 | 3,73 | ||||
| 2026-02-13 | 13F | Solstein Capital, LLC | 5.907 | 0,00 | 153 | 1,33 | ||||
| 2026-02-17 | 13F | Ameriprise Financial Inc | 890.914 | 41,05 | 22.997 | 42,79 | ||||
| 2026-01-15 | 13F | ALM First Financial Advisors, LLC | 527.748 | 0,00 | 13.626 | 1,22 | ||||
| 2026-02-06 | 13F | EverSource Wealth Advisors, LLC | 238 | 0,00 | 6 | 0,00 | ||||
| 2026-01-12 | 13F | Focus Financial Network, Inc. | 30.984 | -23,12 | 800 | -22,18 | ||||
| 2026-02-12 | 13F | Wealthspire Advisors, LLC | 0 | -100,00 | 0 | |||||
| 2025-11-14 | 13F | Alliancebernstein L.p. | 0 | -100,00 | 0 | -100,00 | ||||
| 2025-11-13 | 13F | Western Asset Management Company, LLC | 0 | -100,00 | 0 | -100,00 | ||||
| 2026-02-02 | 13F | Truist Financial Corp | 206.163 | -6,00 | 5.323 | -4,84 | ||||
| 2026-01-29 | 13F | Viewpoint Investment Partners Corp | 1.353.700 | -3,81 | 34.953 | -2,03 | ||||
| 2025-10-10 | 13F | Navigoe, LLC | 0 | -100,00 | 0 | |||||
| 2026-02-12 | 13F | WealthPLAN Partners, LLC | 8.399 | 217 | ||||||
| 2026-02-27 | 13F | Compass Financial Services Inc | 0 | -100,00 | 0 | |||||
| 2026-01-08 | 13F | Wealth Enhancement Advisory Services, Llc | 120.833 | 2,45 | 3.139 | 4,88 | ||||
| 2026-02-18 | 13F | GWM Advisors LLC | 0 | -100,00 | 0 | |||||
| 2026-01-27 | 13F | CenterStar Asset Management, LLC | Call | 2.800 | -78,95 | 1.008 | -76,77 | |||
| 2026-02-17 | 13F | Cahill Financial Advisors Inc | 16.269 | -8,21 | 420 | -7,08 | ||||
| 2026-01-30 | 13F | Arlington Trust Co LLC | 1.000 | 0,00 | 26 | 0,00 | ||||
| 2026-02-13 | 13F | Schroder Investment Management Group | 388.213 | -15,70 | 10.024 | -14,68 | ||||
| 2026-02-11 | 13F | Ackerman Capital Advisors, LLC | 96.696 | 2.497 | ||||||
| 2026-01-30 | 13F | Bogart Wealth, LLC | 49 | 0,00 | 1 | 0,00 | ||||
| 2026-02-17 | 13F | Hancock Whitney Corp | 71.177 | -4,62 | 1.838 | -3,47 | ||||
| 2026-02-13 | 13F | Edgestream Partners, L.P. | 0 | -100,00 | 0 | |||||
| 2026-02-10 | 13F/A | Northwestern Mutual Wealth Management Co | 143.483 | 423,95 | 3.705 | 430,66 | ||||
| 2026-02-03 | 13F | Indivisible Partners | 36.083 | 932 | ||||||
| 2026-01-26 | 13F | Key Capital Management, INC | 1 | 0 | ||||||
| 2026-01-21 | 13F | Avantra Family Wealth, Inc. | 10.804 | 279 | ||||||
| 2026-01-28 | 13F | Diversified Enterprises, LLC | 22.644 | 52,09 | 585 | 54,09 | ||||
| 2026-02-17 | 13F | Advisory Services Network, LLC | 7.838 | 180,03 | 202 | 184,51 | ||||
| 2026-02-04 | 13F | Boston Private Wealth Llc | 23.120 | -2,51 | 597 | -1,32 | ||||
| 2026-02-17 | 13F | Cetera Investment Advisers | 508.651 | 267,13 | 13.133 | 271,62 | ||||
| 2026-02-13 | 13F | Heritage Wealth Advisors | 0 | -100,00 | 0 | |||||
| 2026-01-14 | 13F | Exchange Traded Concepts, Llc | 104.882 | 147,09 | 2.708 | 150,28 | ||||
| 2026-02-06 | 13F | Covestor Ltd | 405 | 0,00 | 0 | |||||
| 2026-02-17 | 13F | NorthRock Partners, LLC | 17.155 | 443 | ||||||
| 2026-02-13 | 13F | Sofos Investments, Inc. | 69 | 0,00 | 2 | 0,00 | ||||
| 2026-02-13 | 13F | Change Path, LLC | 53.549 | 1.383 | ||||||
| 2026-02-03 | 13F | Farmers & Merchants Investments Inc | 0 | -100,00 | 0 | |||||
| 2026-01-16 | 13F | Ronald Blue Trust, Inc. | 115 | -86,49 | 3 | -90,48 | ||||
| 2026-02-13 | 13F | Maven Securities LTD | Call | 83.900 | -55,91 | 17.852 | -54,54 | |||
| 2026-02-05 | 13F | WealthPlan Investment Management, LLC | 90.924 | 2.348 | ||||||
| 2026-02-11 | 13F | Group One Trading, L.p. | 200 | 5 | ||||||
| 2026-01-15 | 13F | Wright Fund Managment, LLC | 2.776.482 | 23,59 | 71.689 | 25,09 | ||||
| 2026-01-20 | 13F | Whalen Wealth Management Inc. | 47.015 | 1.214 | ||||||
| 2026-02-17 | 13F | Readystate Asset Management Lp | 16.646 | -68,62 | 430 | -68,29 | ||||
| 2026-01-16 | 13F | Perigon Wealth Management, LLC | 40.456 | 3,14 | 1.045 | 4,40 | ||||
| 2026-01-27 | 13F | Dravo Bay Llc | 9.535 | -8,10 | 246 | -6,82 | ||||
| 2026-01-22 | 13F | Comprehensive Money Management Services LLC | 30.027 | 0,02 | 775 | 1,31 | ||||
| 2026-02-11 | 13F | Group One Trading, L.p. | Call | 2.353.800 | 24,63 | 222.682 | 31,97 | |||
| 2026-02-13 | 13F | Pinnacle Wealth Planning Services, Inc. | 3.563 | 92 | ||||||
| 2026-02-02 | 13F | CENTRAL TRUST Co | 422.630 | 10,28 | 10.912 | 11,62 | ||||
| 2026-01-21 | 13F | Flagship Harbor Advisors, Llc | 21 | 1 | ||||||
| 2026-02-03 | 13F | Apeiron RIA LLC | 15.376 | -13,69 | 397 | -12,36 | ||||
| 2026-01-27 | 13F | Friedenthal Financial | 0 | -100,00 | 0 | |||||
| 2026-02-19 | 13F | Invesco Ltd. | 10.301 | -4,71 | 266 | -3,64 | ||||
| 2026-01-15 | 13F | Highline Wealth Partners Llc | 0 | -100,00 | 0 | |||||
| 2026-01-22 | 13F | Columbia Advisory Partners Llc | 14.230 | 367 | ||||||
| 2026-02-10 | 13F | Td Asset Management Inc | 0 | -100,00 | 0 | |||||
| 2026-02-06 | 13F | GPS Wealth Strategies Group, LLC | 4 | 0,00 | 0 | |||||
| 2025-11-13 | 13F | Hsbc Holdings Plc | 1.153.041 | -44,88 | 29.822 | 10,78 | ||||
| 2026-01-30 | 13F | Pekin Hardy Strauss, Inc. | 381.457 | 14,46 | 9.849 | 15,86 | ||||
| 2026-02-10 | 13F | Goldman Sachs Group Inc | 102.115 | 8,52 | 2.637 | 9,83 | ||||
| 2026-02-02 | 13F | FSA Advisors, Inc. | 127.520 | 132 | ||||||
| 2026-02-12 | 13F | Advisors Asset Management, Inc. | 20.869 | -27,18 | 539 | -26,40 | ||||
| 2026-01-14 | 13F | Whitcomb & Hess, Inc. | 403.431 | 6,99 | 10.469 | 8,85 | ||||
| 2026-01-27 | 13F | Asset Management One Co., Ltd. | 2.705.995 | -0,36 | 69.652 | 0,53 | ||||
| 2026-01-23 | 13F | Penn Mutual Asset Management, LLC | 18.000 | 0,00 | 465 | 1,09 | ||||
| 2026-02-10 | 13F | Clear Harbor Asset Management, LLC | 15.050 | -4,75 | 389 | -3,72 | ||||
| 2025-11-12 | 13F | Headlands Technologies LLC | 0 | -100,00 | 0 | |||||
| 2026-01-12 | 13F | Fiduciary Financial Group, Llc | 14.305 | 73,29 | 369 | 75,71 | ||||
| 2026-02-18 | 13F | Beacon Pointe Advisors, LLC | 449.976 | 5,01 | 11.618 | 6,28 | ||||
| 2026-02-13 | 13F | Centaurus Financial, Inc. | 18.974 | 0 | ||||||
| 2026-02-13 | 13F | Neuberger Berman Group LLC | 2.655.068 | -35,98 | 68.554 | -35,20 | ||||
| 2026-01-07 | 13F | Lake Hills Wealth Management, LLC | 174.826 | 111,28 | 4.514 | 113,93 | ||||
| 2026-02-17 | 13F | High Falls Advisors, Inc | 7.879 | 203 | ||||||
| 2026-01-20 | 13F | JB Capital LLC | 65.094 | 1.681 | ||||||
| 2026-02-18 | 13F | EP Wealth Advisors, Inc. | 0 | -100,00 | 0 | |||||
| 2025-09-25 | NP | HFIGX - Hartford Schroders Diversified Growth Fund Class I | 99.430 | -61,90 | 2.473 | -61,29 | ||||
| 2026-02-09 | 13F | Hantz Financial Services, Inc. | 174 | 0,00 | 0 | |||||
| 2025-09-26 | 13F | Capital A Wealth Management, LLC | 0 | -100,00 | 0 | |||||
| 2026-01-26 | 13F | Cwm, Llc | 3.655 | 5,61 | 0 | |||||
| 2026-02-17 | 13F | Modern Wealth Management, LLC | 21.886 | -2,40 | 565 | -1,22 | ||||
| 2026-02-13 | 13F | National Bank Of Canada /fi/ | 546.209 | -36,12 | 14.103 | -35,35 | ||||
| 2026-01-21 | 13F | Capital Investment Advisory Services, LLC | 3.316 | -4,52 | 86 | -3,41 | ||||
| 2026-02-10 | 13F | Ellevest, Inc. | 49.348 | 9,16 | 1.274 | 10,49 | ||||
| 2026-01-05 | 13F | Park Avenue Securities Llc | 1.034.253 | 9,96 | 27 | 13,04 | ||||
| 2026-01-29 | 13F | Nbc Securities, Inc. | 506 | 2,02 | 13 | 8,33 | ||||
| 2026-02-18 | 13F | First Citizens Bank & Trust Co | 31.499 | -1,24 | 813 | 0,00 | ||||
| 2026-02-13 | 13F | Integrated Wealth Concepts LLC | 19.027 | -22,75 | 491 | -21,82 | ||||
| 2026-01-06 | 13F | Ehrlich Financial Group | 11.221 | 290 | ||||||
| 2026-01-20 | 13F | Ethos Financial Group, LLC | 296.407 | 1.672,03 | 7.653 | 1.696,48 | ||||
| 2026-02-06 | 13F | Larson Financial Group LLC | 386 | -54,85 | 10 | -57,14 | ||||
| 2025-11-14 | 13F | XTX Topco Ltd | 0 | -100,00 | 0 | -100,00 | ||||
| 2026-01-12 | 13F | Kozak & Associates, Inc. | 110 | 3 | ||||||
| 2026-02-13 | 13F | Kilter Group LLC | 2.539 | 1,32 | 66 | 3,17 | ||||
| 2026-02-11 | 13F | Greykasell Wealth Strategies, Inc. | 499 | 0,00 | 13 | 0,00 | ||||
| 2026-02-17 | 13F | Cape Investment Advisory, Inc. | 1.558 | 3,87 | 40 | 5,26 | ||||
| 2026-01-26 | 13F | Valmark Advisers, Inc. | 4.419.178 | 3,51 | 114.103 | 4,77 | ||||
| 2026-02-13 | 13F | Aptus Capital Advisors, LLC | 4.596 | 353,25 | 119 | 372,00 | ||||
| 2026-02-17 | 13F | Ancora Advisors, LLC | 515 | 13 | ||||||
| 2026-01-26 | 13F | Private Trust Co Na | 611 | 869,84 | 16 | 1.400,00 | ||||
| 2026-01-29 | 13F | Quest 10 Wealth Builders, Inc. | 56 | 64,71 | 1 | |||||
| 2026-01-14 | 13F | International Private Wealth Advisors LLC | 12.175 | 5,69 | 314 | 7,17 | ||||
| 2026-02-17 | 13F | Laird Norton Trust Company, Llc | 0 | -100,00 | 0 | |||||
| 2026-02-13 | 13F | Financial Network Wealth Advisors LLC | 0 | -100,00 | 0 | |||||
| 2026-02-10 | 13F | Rothschild Investment Llc | 2 | 0,00 | 0 | |||||
| 2026-02-17 | 13F | Creative Planning | 16.623 | -17,00 | 429 | -15,88 | ||||
| 2026-01-08 | 13F | Integrated Capital Management, Inc. | 272.547 | 5,67 | 7.037 | 6,96 | ||||
| 2026-02-03 | 13F | We Are One Seven, LLC | 10.341 | 267 | ||||||
| 2026-02-04 | 13F | Pensionmark Financial Group, Llc | 11.126 | 216 | ||||||
| 2025-11-14 | 13F | Strategic Wealth Partners, Ltd. | 106 | 3 | ||||||
| 2026-01-29 | 13F | Dunhill Financial, LLC | 7 | 0,00 | ||||||
| 2025-11-04 | 13F | Pineridge Advisors LLC | 352 | 1,44 | 9 | 0,00 | ||||
| 2026-01-06 | 13F | Tucker Asset Management Llc | 0 | -100,00 | 0 | |||||
| 2026-01-26 | 13F | Mirae Asset Global Investments Co., Ltd. | 84.478 | 8,31 | 2.181 | 9,65 | ||||
| 2026-02-11 | 13F | Franklin Resources Inc | 1.230.082 | 0,17 | 31.761 | 1,39 | ||||
| 2026-02-12 | 13F | Commonwealth Equity Services, Llc | 259.345 | 270,82 | 6.696 | 669.500,00 | ||||
| 2026-02-12 | 13F | Brinker Capital Investments, LLC | 26.046 | 673 | ||||||
| 2026-01-30 | 13F | Turning Point Benefit Group, Inc. | 0 | -100,00 | 0 | |||||
| 2026-01-28 | 13F | Sage Advisory Services, Ltd.Co. | 51.142 | -0,62 | 1.320 | 0,53 | ||||
| 2026-02-12 | 13F | Hrt Financial Lp | 0 | -100,00 | 0 | -100,00 | ||||
| 2026-02-11 | 13F | SOUTH STATE Corp | 2.763 | 71 | ||||||
| 2025-11-13 | 13F | Absolute Gestao de Investimentos Ltda. | 0 | -100,00 | 0 | |||||
| 2026-02-13 | 13F | Delos Wealth Advisors, LLC | 74.969 | 4,29 | 1.936 | 5,56 | ||||
| 2026-02-17 | 13F | Logan Stone Capital, LLC | 0 | -100,00 | 0 | |||||
| 2026-02-02 | 13F | Nkcfo Llc | 153.100 | 0,00 | 4 | 0,00 | ||||
| 2026-02-17 | 13F | Crabel Capital Management, LLC | 132.377 | 33,76 | 3.418 | 35,38 | ||||
| 2026-02-10 | 13F | Principia Wealth Advisory, LLC | Call | 0 | -100,00 | 0 | ||||
| 2026-02-13 | 13F | Kestra Advisory Services, LLC | 0 | -100,00 | 0 | |||||
| 2026-02-11 | 13F | Jpmorgan Chase & Co | 151.322 | -77,87 | 3.907 | -77,60 | ||||
| 2026-02-09 | 13F | Jefferies Financial Group Inc. | 9.199 | 238 | ||||||
| 2026-02-13 | 13F | Vontobel Holding Ltd. | 28.200 | 0,00 | 728 | 1,25 | ||||
| 2026-02-05 | 13F | Cambridge Investment Research Advisors, Inc. | 134.007 | 79,30 | 3 | 200,00 | ||||
| 2026-02-13 | 13F | LGT Financial Advisors LLC | 497 | 13 | ||||||
| 2026-01-20 | 13F | AdvisorNet Financial, Inc | 4.563 | 0,00 | 118 | 0,86 | ||||
| 2025-11-10 | 13F | Garda Capital Partners Lp | Call | 0 | -100,00 | 0 | -100,00 | |||
| 2026-02-11 | 13F | Jpmorgan Chase & Co | Call | 1.181.000 | -44,77 | 189.364 | -9,45 | |||
| 2026-02-13 | 13F | VPR Management LLC | 316.200 | 0,00 | 8.164 | 1,21 | ||||
| 2026-01-29 | 13F | Concurrent Investment Advisors, LLC | 11.204 | 10,94 | 289 | 12,45 | ||||
| 2026-02-13 | 13F | Mml Investors Services, Llc | 346.403 | 116,11 | 8.944 | 118,73 | ||||
| 2026-02-10 | 13F | Bnp Paribas Arbitrage, Sa | 656.874 | -55,37 | 16.960 | -54,82 | ||||
| 2026-02-19 | 13F | Mcguire Capital Advisors Inc | 686 | 18 | ||||||
| 2026-02-13 | 13F | Citigroup Inc | 12.334 | 7,44 | 318 | 8,90 | ||||
| 2026-02-10 | 13F | Bank of New York Mellon Corp | 779.278 | -1,17 | 20.121 | 0,03 | ||||
| 2026-02-13 | 13F | Hurley Capital, LLC | Call | 0 | -100,00 | 0 | ||||
| 2025-11-06 | 13F | Whipplewood Advisors, LLC | 0 | -100,00 | 0 | |||||
| 2026-01-08 | 13F | Signet Financial Management, Llc | 15.566 | 402 | ||||||
| 2026-01-29 | 13F | Camelot Portfolios, LLC | 50 | 1 | ||||||
| 2025-10-30 | 13F | Migdal Insurance & Financial Holdings Ltd. | 0 | -100,00 | 0 | |||||
| 2026-02-12 | 13F | BlackRock, Inc. | 2.990.701 | -36,89 | 77.220 | -36,13 | ||||
| 2026-01-13 | 13F | CoreCap Advisors, LLC | 3.051 | 2,14 | 79 | 2,63 | ||||
| 2026-02-12 | 13F | Front Row Advisors LLC | 62 | 0,00 | 2 | 0,00 | ||||
| 2026-01-15 | 13F | Acima Private Wealth, Llc | 323.432 | 7,98 | 8.351 | 9,31 | ||||
| 2025-11-12 | 13F | Angeles Wealth Management, Llc | 0 | -100,00 | 0 | |||||
| 2026-01-20 | 13F | Stratos Wealth Partners, LTD. | 14.249 | 0,77 | 368 | 1,94 | ||||
| 2025-11-12 | 13F | Transce3nd, LLC | 0 | -100,00 | 0 | |||||
| 2026-01-23 | 13F | Assetmark, Inc | 572.025 | 73,84 | 14.770 | 75,97 | ||||
| 2026-02-17 | 13F | Wellington Management Group Llp | 0 | -100,00 | 0 | |||||
| 2026-02-11 | 13F | O'shaughnessy Asset Management, Llc | 810 | -0,74 | 21 | 0,00 | ||||
| 2026-02-13 | 13F | 1832 Asset Management L.P. | 1.936.676 | -0,49 | 50.005 | 0,72 | ||||
| 2026-02-17 | 13F | Susquehanna International Group, Llp | 0 | -100,00 | 0 | |||||
| 2026-02-12 | 13F | Proficio Capital Partners LLC | 59.245 | 1.530 | ||||||
| 2026-02-14 | 13F | Silver Grove Financial Group, Inc. | 2.030 | 52 | ||||||
| 2026-01-27 | 13F | TriaGen Wealth Management LLC | 17.543 | 0,37 | 453 | 1,57 | ||||
| 2026-01-08 | 13F | Cooper Financial Group | 10.739 | 277 | ||||||
| 2026-02-12 | 13F | Founders Financial Alliance, LLC | 0 | -100,00 | 0 | |||||
| 2026-02-11 | 13F | Capital Analysts, Inc. | 1.859 | 1,58 | 0 | |||||
| 2026-01-29 | 13F | UBS Group AG | 2.641.642 | 9,78 | 68.207 | 11,11 | ||||
| 2026-02-13 | 13F | Icon Wealth Advisors, LLC | 13.113 | 339 | ||||||
| 2026-02-09 | 13F | Keating Financial Advisory Services, Inc. | 12.171 | 314 | ||||||
| 2026-02-02 | 13F | Varma Mutual Pension Insurance Co | 3.100.000 | 0,00 | 80.042 | 1,22 | ||||
| 2026-02-13 | 13F | Barclays Plc | 0 | -100,00 | 0 | |||||
| 2026-02-17 | 13F | Integrated Advisors Network LLC | 8.843 | 228 | ||||||
| 2026-01-02 | 13F | Insight Wealth Strategies, LLC | 637.239 | 16.454 | ||||||
| 2026-02-09 | 13F | Fidelity D & D Bancorp Inc | 117.100 | 15,78 | 3.024 | 17,17 | ||||
| 2026-02-17 | 13F | Keebeck Wealth Management, LLC | 81.675 | 0,00 | 2.109 | 1,20 | ||||
| 2026-02-04 | 13F | Madison Asset Management, LLC | 511.961 | 13.219 | ||||||
| 2025-11-17 | 13F | FSA Wealth Management LLC | 500 | 0,00 | 13 | 0,00 | ||||
| 2026-02-11 | 13F | MCF Advisors LLC | 0 | -100,00 | 0 | |||||
| 2026-02-12 | 13F | Principal Securities, Inc. | 0 | -100,00 | 0 | |||||
| 2026-01-20 | 13F | Thurston, Springer, Miller, Herd & Titak, Inc. | 4 | 0 | ||||||
| 2026-02-17 | 13F | Quadrature Capital Ltd | 0 | -100,00 | 0 | |||||
| 2026-02-06 | 13F | Cullen/frost Bankers, Inc. | 0 | -100,00 | 0 | |||||
| 2026-02-09 | 13F | Harbour Investments, Inc. | 69 | -91,05 | 2 | -94,74 | ||||
| 2026-02-12 | 13F | Triumph Capital Management | 5 | 0,00 | 0 | |||||
| 2026-01-29 | 13F | Matisse Capital | 24.900 | 0,00 | 643 | 1,10 | ||||
| 2026-02-12 | 13F | CIBC Private Wealth Group, LLC | 114 | -93,40 | 3 | -95,45 | ||||
| 2025-11-14 | 13F | Binnacle Investments Inc | 53.937 | 4,17 | 1.376 | 4,80 | ||||
| 2026-01-28 | 13F | Evergreen Private Wealth LLC | 67.468 | 2,69 | 1.742 | 3,94 | ||||
| 2026-02-02 | 13F | Oppenheimer & Co Inc | 243.373 | -0,06 | 6.284 | 1,14 | ||||
| 2026-02-12 | 13F | Federation des caisses Desjardins du Quebec | 1.146.271 | -1,14 | 29.597 | 0,06 | ||||
| 2026-02-20 | 13F | Kovitz Investment Group Partners, LLC | 0 | -100,00 | 0 | |||||
| 2026-01-12 | 13F | Sax Wealth Advisors, Llc | 36.915 | 953 | ||||||
| 2026-02-13 | 13F | Mariner, LLC | 9.010 | -37,81 | 233 | -37,13 | ||||
| 2026-02-11 | 13F | Empowered Funds, LLC | 158.709 | -73,55 | 4.098 | -73,09 | ||||
| 2026-02-17 | 13F | Signature Equity Partners, LLC | 116 | 3 | ||||||
| 2026-02-17 | 13F | Engineers Gate Manager LP | 0 | -100,00 | 0 | |||||
| 2026-02-04 | 13F | Ameritas Advisory Services, LLC | 27.224 | 1.903,24 | 703 | 1.964,71 | ||||
| 2025-11-14 | 13F | Moore Capital Management, Lp | 0 | -100,00 | 0 | |||||
| 2025-09-26 | NP | AVGAX - BNY Mellon Dynamic Total Return Fund Class A | 142.540 | -6,25 | 3.545 | -4,73 | ||||
| 2026-01-21 | 13F | Raleigh Capital Management Inc. | 2.317 | -6,16 | 60 | -4,84 | ||||
| 2026-02-09 | 13F | Collaborative Wealth Managment Inc. | 196.973 | 6,15 | 5.086 | 7,44 | ||||
| 2026-02-10 | 13F | SBI Okasan Asset Management Co.Ltd. | 108.931 | 2.804 | ||||||
| 2025-11-21 | 13F/A | CIBC Bancorp USA Inc. | 600.000 | 15.306 | ||||||
| 2026-02-06 | 13F | Axxcess Wealth Management, Llc | 9.496 | 17,50 | 245 | 18,93 | ||||
| 2025-11-12 | 13F | Kingsview Wealth Management, LLC | 0 | -100,00 | 0 | |||||
| 2026-02-06 | 13F | Global Retirement Partners, LLC | 27.787 | 1.725,69 | 717 | 1.786,84 | ||||
| 2026-01-29 | 13F | Comerica Bank | 161.016 | 18,10 | 4.157 | 19,52 | ||||
| 2026-01-14 | 13F | ORG Partners LLC | 1.259 | 0,00 | 33 | 0,00 | ||||
| 2026-02-12 | 13F | Bank Of Montreal /can/ | 1.489.733 | 15,25 | 38.465 | 16,65 | ||||
| 2026-02-13 | 13F | Ieq Capital, Llc | 9.935 | 257 | ||||||
| 2026-02-12 | 13F | Cutler Investment Counsel Llc | 336.869 | 2,83 | 8.698 | 4,07 | ||||
| 2026-02-17 | 13F | Jones Financial Companies Lllp | 21.626 | 41,06 | 558 | 43,08 | ||||
| 2026-01-16 | 13F | Balboa Wealth Partners | 60.025 | 263,94 | 1.550 | 268,81 | ||||
| 2026-01-16 | 13F | RHS Financial, LLC | 99.288 | 3,49 | 2.564 | 4,74 | ||||
| 2026-02-13 | 13F | Avos Capital Management, LLC | 216.617 | 0,91 | 5.593 | 2,14 | ||||
| 2026-02-20 | 13F/A | CMT Capital Markets Trading GmbH | Call | 1.917.100 | 20,10 | 164 | 35,54 | |||
| 2026-02-13 | 13F | SRS Capital Advisors, Inc. | 11.958 | 309 | ||||||
| 2026-01-21 | 13F | Martel Wealth Advisors Inc | 85.852 | 0,03 | 2.217 | 1,23 | ||||
| 2026-02-13 | 13F | Colony Group, LLC | 75.080 | 551,11 | 1.938 | 559,18 | ||||
| 2026-01-28 | 13F | WPG Advisers, LLC | 6.486 | 0,95 | 167 | 2,45 | ||||
| 2026-02-11 | 13F | Parallel Advisors, LLC | 159 | -52,40 | 4 | -50,00 | ||||
| 2026-01-29 | 13F | James Investment Research Inc | 38.223 | 987 | ||||||
| 2026-02-17 | 13F | Optiver Holding B.V. | Call | 1.790.100 | 23,20 | 644.669 | 35,95 | |||
| 2026-01-22 | 13F | Bartlett & Co. Wealth Management Llc | 5.284 | -0,02 | 136 | 1,49 | ||||
| 2026-02-13 | 13F | Smartleaf Asset Management LLC | 82 | -73,72 | 2 | -71,43 | ||||
| 2026-02-17 | 13F | Capitolis Liquid Global Markets LLC | 0 | -100,00 | 0 | |||||
| 2026-02-05 | 13F | Allworth Financial LP | 18.174 | -19,79 | 469 | -18,86 | ||||
| 2026-02-17 | 13F | Clark Capital Management Group, Inc. | 142.459 | 2,13 | 3.678 | 3,37 | ||||
| 2026-01-29 | 13F | IMC-Chicago, LLC | Call | 3.008.500 | 1,59 | 631.992 | 24,73 | |||
| 2026-02-17 | 13F | Stark Wealth Management LLC | 34.358 | 794 | ||||||
| 2026-01-22 | 13F | HHM Wealth Advisors, LLC | 25 | 1 | ||||||
| 2026-01-28 | 13F | Geneos Wealth Management Inc. | 111 | 58,57 | 3 | 100,00 | ||||
| 2026-01-30 | 13F | New Harbor Financial Group, LLC | 596.008 | 7,52 | 15.389 | 8,82 | ||||
| 2026-02-11 | 13F | Janney Montgomery Scott LLC | 159.395 | 12,63 | 4 | 33,33 | ||||
| 2026-02-17 | 13F | SageView Advisory Group, LLC | 1.225 | 32 | ||||||
| 2026-01-14 | 13F | Centurion Wealth Management LLC | 27.000 | 11,34 | 697 | 12,78 | ||||
| 2026-02-13 | 13F | Transamerica Financial Advisors, Inc. | 8.207 | 212 | ||||||
| 2026-02-17 | 13F | Cambria Investment Management, L.P. | 237.208 | 1,22 | 6.125 | 2,91 | ||||
| 2026-02-13 | 13F | Golden State Wealth Management, LLC | 281 | 7 | ||||||
| 2026-01-26 | 13F | Abbington Investment Group | 11.400 | 1,03 | 294 | 2,44 | ||||
| 2025-11-12 | 13F | Compass Capital Corp /ma/ /adv | 0 | -100,00 | 0 | |||||
| 2025-09-24 | NP | NSTLX - Neuberger Berman Strategic Income Fund Institutional Class | 2.486.286 | 61.834 | ||||||
| 2026-01-29 | 13F | Calamos Advisors LLC | 383.000 | 9.889 | ||||||
| 2026-01-26 | 13F | Tanager Wealth Management LLP | 9.444 | -35,74 | 244 | -35,03 | ||||
| 2026-01-26 | 13F | Consilium Wealth Advisory, LLC | 9.750 | 0,00 | 252 | 1,21 | ||||
| 2026-02-12 | 13F | Summit Financial, LLC | 62.284 | -0,73 | 1.608 | 0,50 | ||||
| 2025-10-24 | 13F | rebel Financial LLC | 0 | -100,00 | 4.703 | 2,37 | ||||
| 2026-02-10 | 13F | IFG Advisory, LLC | 15.150 | 391 | ||||||
| 2026-02-17 | 13F | Elequin Capital Lp | 1.202 | 0,00 | 31 | 3,33 | ||||
| 2026-02-13 | 13F | Sei Investments Co | 9.286.842 | 4,47 | 239.786 | 5,74 | ||||
| 2026-01-27 | 13F | WealthCollab, LLC | 529 | 14 | ||||||
| 2026-01-26 | 13F | Phraction Management LLC | 8.177 | 0,00 | 211 | 1,44 | ||||
| 2026-01-14 | 13F | Chesley Taft & Associates LLC | 56.900 | 1.469 | ||||||
| 2026-02-17 | 13F | Cresset Asset Management, LLC | 9.260 | 239 | ||||||
| 2026-01-12 | 13F | Brucke Financial, Inc. | 14.781 | 382 | ||||||
| 2026-01-26 | 13F | Quadrant Private Wealth Management, LLC | 23.349 | 603 | ||||||
| 2026-02-10 | 13F | ShoreHaven Wealth Partners, LLC | 32.580 | 841 | ||||||
| 2026-02-17 | 13F | Two Sigma Securities, Llc | 28.398 | 733 | ||||||
| 2026-02-06 | 13F | Lloyd Advisory Services, LLC. | 0 | 0 | ||||||
| 2026-02-03 | 13F | Garner Asset Management Corp | 900 | 23 | ||||||
| 2026-01-30 | 13F | Us Bancorp \de\ | 23 | 1 | ||||||
| 2026-02-17 | 13F | Advisor Group Holdings, Inc. | 383.634 | 4,87 | 9.906 | 6,22 | ||||
| 2026-02-03 | 13F | Ballentine Partners, LLC | 21.835 | 0,00 | 564 | 1,08 | ||||
| 2026-02-09 | 13F | Hartland & Co., LLC | 136 | 0,00 | 4 | 0,00 | ||||
| 2026-01-30 | 13F | Exencial Wealth Advisors, Llc | 36.155 | 1,46 | 934 | 2,75 | ||||
| 2026-02-17 | 13F | Bank Of America Corp /de/ | 2.512.545 | 42,52 | 64.874 | 44,26 | ||||
| 2026-02-13 | 13F | Ubs Asset Management Americas Inc | 729.448 | 18.834 | ||||||
| 2026-01-13 | 13F | Kelly Financial Services LLC | 129.435 | 3.342 | ||||||
| 2026-01-22 | 13F | Mh & Associates Securities Management Corp /adv | 426 | 11 | ||||||
| 2026-02-11 | 13F | Tiaa Trust, National Association | 1.953.251 | 87,51 | 50.433 | 89,79 | ||||
| 2025-11-14 | 13F | Horizon Investments, LLC | 0 | -100,00 | 0 | |||||
| 2026-01-23 | 13F | Farther Finance Advisors, LLC | 10.871 | 3.418,12 | 281 | 3.900,00 | ||||
| 2025-11-14 | 13F | Hilltop Holdings Inc. | 0 | -100,00 | 0 | -100,00 | ||||
| 2026-01-22 | 13F | K2 Financial Inc. | 66.901 | 1,93 | 1.731 | 4,03 | ||||
| 2026-02-06 | 13F | Kingdom Financial Group LLC. | 77 | 2 | ||||||
| 2026-02-11 | 13F | Howard Bailey Securities, Llc | 9.407 | -15,49 | 243 | -14,49 | ||||
| 2025-10-31 | 13F | BCJ Capital Management, LLC | 0 | -100,00 | 0 | |||||
| 2026-02-20 | 13F/A | Capital Markets Trading UK LLP | Call | 634.100 | -23,80 | 54 | -14,29 | |||
| 2026-01-27 | 13F | Godsey & Gibb Associates | 110 | 0,00 | 3 | 0,00 | ||||
| 2026-02-02 | 13F | Ping Capital Management, Inc. | Call | 0 | -100,00 | 0 | ||||
| 2025-11-14 | 13F | Verition Fund Management LLC | 0 | -100,00 | 0 | |||||
| 2026-02-06 | 13F | Keystone Financial Group | 11.058 | 286 | ||||||
| 2026-02-13 | 13F | Charles Schwab Investment Management Inc | 15.016.492 | 14,16 | 387.726 | 15,55 | ||||
| 2026-02-17 | 13F | Millennium Management Llc | 0 | -100,00 | 0 | |||||
| 2026-01-26 | 13F | Lionsbridge Wealth Management LLC | 11.560 | -12,60 | 298 | -11,57 | ||||
| 2026-02-17 | 13F | GeoWealth Management, LLC | 8.164 | 211 | ||||||
| 2026-01-30 | 13F | Wealthfront Advisers Llc | 34.219 | 103,67 | 884 | 106,31 | ||||
| 2026-02-13 | 13F | Stifel Financial Corp | 113.152 | 45,53 | 2.922 | 47,30 | ||||
| 2026-02-17 | 13F | Royal Bank Of Canada | 1.018.869 | 13,72 | 26.307 | 15,10 | ||||
| 2026-01-27 | 13F | Evergreen Capital Management Llc | 1.078.317 | 1,85 | 27.842 | 3,09 | ||||
| 2026-02-17 | 13F | D. E. Shaw & Co., Inc. | 0 | -100,00 | 0 | |||||
| 2026-02-12 | 13F | Cloud Capital Management, LLC | 0 | -100,00 | 0 | |||||
| 2025-11-05 | 13F | Vantage Financial Partners, LLC | 0 | -100,00 | 0 | |||||
| 2026-02-13 | 13F | Manufacturers Life Insurance Company, The | 0 | -100,00 | 0 | |||||
| 2026-02-11 | 13F | Signet Private Wealth LLC | 13.359 | 345 | ||||||
| 2026-02-17 | 13F | Fmr Llc | 2.305.208 | 1.395,26 | 59.520 | 1.413,73 | ||||
| 2026-01-23 | 13F | Keener Financial Planning LLC | 0 | -100,00 | 0 | |||||
| 2026-01-22 | 13F | Triad Wealth Partners, LLC | 50.401 | 1.301 | ||||||
| 2026-02-17 | 13F | Wiley Bros.-aintree Capital, Llc | 53.793 | -3,10 | 1.387 | -1,84 | ||||
| 2026-02-03 | 13F | Sequoia Financial Advisors, LLC | 22.092 | 570 | ||||||
| 2026-02-06 | 13F | Pnc Financial Services Group, Inc. | 2.232 | 137,95 | 58 | 147,83 | ||||
| 2026-01-16 | 13F | Clarus Group, Inc. | 0 | -100,00 | 0 | |||||
| 2025-11-07 | 13F | Beacon Capital Management, LLC | 0 | -100,00 | 0 | |||||
| 2026-02-06 | 13F | IFP Advisors, Inc | 4.625 | 40,58 | 119 | 43,37 | ||||
| 2026-02-12 | 13F | Steward Partners Investment Advisory, Llc | 182.401 | -3,94 | 4.710 | -2,77 | ||||
| 2026-01-21 | 13F | Apella Capital, LLC | 10.438 | 15,29 | 269 | 16,96 | ||||
| 2025-11-03 | 13F | Annis Gardner Whiting Capital Advisors, LLC | 0 | -100,00 | 0 | |||||
| 2026-01-13 | 13F | Capital Investment Advisors, LLC | 214.054 | 7,52 | 5.527 | 8,82 | ||||
| 2026-01-26 | 13F | United Advisor Group, LLC | 17.554 | 2,73 | 453 | 4,14 | ||||
| 2026-02-09 | 13F | Bleakley Financial Group, LLC | 102.169 | 56,71 | 2.638 | 58,63 | ||||
| 2026-02-12 | 13F | IFC & Insurance Marketing, Inc. | 24 | 0 | ||||||
| 2026-01-20 | 13F | C2P Capital Advisory Group, LLC d.b.a. Prosperity Capital Advisors | 50.393 | 1.301 | ||||||
| 2026-02-12 | 13F | Virtus Fixed Income Advisers, LLC | 10 | -50,00 | 0 | |||||
| 2025-10-30 | 13F | Ridgewood Investments LLC | 0 | -100,00 | 0 | |||||
| 2026-02-02 | 13F | Cornerstone Planning Group LLC | 58 | 480,00 | 2 | 0,00 | ||||
| 2026-02-17 | 13F | Raymond James Financial Inc | 82.329 | 6,39 | 2.126 | 7,65 | ||||
| 2026-01-14 | 13F | Net Worth Advisory Group | 17.034 | 5,62 | 440 | 6,81 | ||||
| 2026-02-12 | 13F | Laurel Oak Wealth Management, Llc | 30.582 | 790 | ||||||
| 2026-02-25 | 13F | Topor & Co. Korea | 16.625 | 0 | ||||||
| 2026-01-23 | 13F | Diversify Advisory Services, LLC | 73.725 | 1.912 | ||||||
| 2026-02-06 | 13F | Rockport Wealth LLC | 78.884 | 4,38 | 2.037 | 5,66 | ||||
| 2026-02-03 | 13F | Diversify Wealth Management, Llc | 40.638 | 1.055 | ||||||
| 2026-01-29 | 13F | Almanack Investment Partners, LLC. | 229.126 | 2,20 | 5.916 | 3,44 | ||||
| 2026-01-23 | 13F | Mid-American Wealth Advisory Group, Inc. | 21.994 | 70,60 | 568 | 72,87 | ||||
| 2026-02-13 | 13F | Warberg Asset Management LLC | Call | 22.000 | 4,76 | 1.887 | 17,58 | |||
| 2026-01-26 | 13F | Invariant Investment Management | 16.062 | 415 | ||||||
| 2026-02-03 | 13F | International Assets Investment Management, Llc | 597 | 15 | ||||||
| 2026-02-02 | 13F | Fifth Third Bancorp | 29 | -25,64 | 1 | |||||
| 2026-02-13 | 13F | Fiduciary Trust Co | 16.400 | 0,00 | 423 | 1,20 | ||||
| 2026-02-17 | 13F | Toronto Dominion Bank | 1.200.000 | 100,00 | 30.984 | 102,43 | ||||
| 2026-02-06 | 13F | HighTower Advisors, LLC | 41.119 | 328,01 | 1.062 | 333,06 | ||||
| 2026-01-26 | 13F | Keystone Wealth Services, LLC | 15.436 | 399 | ||||||
| 2026-02-10 | 13F | Nomura Asset Management Co Ltd | 478.577 | 461,55 | 12.357 | 468,35 | ||||
| 2026-02-10 | 13F | Envestnet Asset Management Inc | 2.967.737 | 81,88 | 76.627 | 84,09 | ||||
| 2026-02-17 | 13F | IHT Wealth Management, LLC | 25.984 | 1,83 | 671 | 3,08 | ||||
| 2026-01-29 | 13F | Quent Capital, LLC | 12 | 0 | ||||||
| 2026-01-27 | 13F | Checchi Capital Advisers, LLC | 794.627 | -0,33 | 20.517 | 0,88 | ||||
| 2026-02-12 | 13F | StoneX Group Inc. | 0 | -100,00 | 0 | |||||
| 2026-01-30 | 13F | Kiker Wealth Management, LLC | 9.581 | -93,84 | 247 | -93,77 | ||||
| 2026-02-06 | 13F | Envestnet Portfolio Solutions, Inc. | 224.666 | 550,92 | 5.801 | 559,09 | ||||
| 2026-02-13 | 13F | Adventist Health System Sunbelt Healthcare Corp | 6.595.189 | 11,05 | 170.288 | 12,40 | ||||
| 2026-01-22 | 13F | Upper Left Wealth Management, LLC | 162.253 | 3,35 | 4.189 | 4,62 | ||||
| 2026-02-12 | 13F | Brown Brothers Harriman & Co | 305 | 8 | ||||||
| 2026-01-09 | 13F | SG Americas Securities, LLC | Call | 569.100 | 1.176,01 | 7 | 500,00 | |||
| 2026-01-23 | 13F | Webster Bank, N. A. | 3.393 | 0,00 | 88 | 1,16 | ||||
| 2026-02-11 | 13F | Deutsche Bank Ag\ | 814.487 | 1.790,33 | 21.030 | 1.813,56 | ||||
| 2026-02-13 | 13F | Atlas Capital Advisors Llc | 405 | 10 | ||||||
| 2026-01-27 | 13F | Avenue 1 Advisors, LLC | 84.620 | 1,13 | 2.185 | 2,34 | ||||
| 2026-02-13 | 13F | Bank Of Nova Scotia | 0 | -100,00 | 0 | |||||
| 2026-02-12 | 13F | Betterment LLC | 48.709 | -8,40 | 1 | 0,00 | ||||
| 2026-01-20 | 13F | YANKCOM Partnership | 102 | 3 | ||||||
| 2026-02-12 | 13F | Rossby Financial, LCC | 13.824 | -1,34 | 357 | 0,00 |