Grundlæggende statistik
| Institutionelle aktier (lange) | 49.636.287 - 115,74% (ex 13D/G) - change of -9,37MM shares -15,88% MRQ |
| Institutionel værdi (lang) | $ 6.992.343 USD ($1000) |
Institutionelt ejerskab og aktionærer
Brinker International, Inc. (US:EAT) har 474 institutionelle ejere og aktionærer, der har indsendt 13D/G- eller 13F-formularer til Securities Exchange Commission (SEC). Disse institutioner har i alt 49,636,287 aktier. Største aktionærer omfatter BlackRock, Inc., Fmr Llc, Vanguard Group Inc, UBS Group AG, State Street Corp, D. E. Shaw & Co., Inc., Holocene Advisors, LP, Arrowstreet Capital, Limited Partnership, Balyasny Asset Management Llc, and Capital World Investors .
Brinker International, Inc. (NYSE:EAT) institutionel ejerskabsstruktur viser aktuelle positioner i virksomheden efter institutioner og fonde, samt seneste ændringer i positionsstørrelse. Større aktionærer kan omfatte individuelle investorer, investeringsforeninger, hedgefonde eller institutioner. Skema 13D angiver, at investoren besidder (eller besidder) mere end 5 % af virksomheden og har til hensigt (eller har til hensigt at) aktivt at forfølge en ændring i forretningsstrategi. Skema 13G indikerer en passiv investering på over 5%.
The share price as of May 1, 2026 is 148,14 / share. Previously, on May 5, 2025, the share price was 128,68 / share. This represents an increase of 15,12% over that period.

Fondens stemningsscore
Fund Sentiment Score (fka Ownership Accumulation Score) finder de aktier, der bliver mest købt af fonde. Det er resultatet af en sofistikeret, multi-faktor kvantitativ model, der identificerer virksomheder med de højeste niveauer af institutionel akkumulering. Scoringsmodellen bruger en kombination af den samlede stigning i oplyste ejere, ændringerne i porteføljeallokeringer i disse ejere og andre målinger. Tallet går fra 0 til 100, hvor højere tal indikerer et højere niveau af akkumulering for sine jævnaldrende, og 50 er gennemsnittet.
Opdateringsfrekvens: Dagligt
Se Ownership Explorer, som giver en liste over højest rangerende virksomheder.
AI+ Ask Fintel’s AI assistant about Brinker International, Inc..
Select a question to share a public post with an AI-crafted answer.
Thinking of good questions…
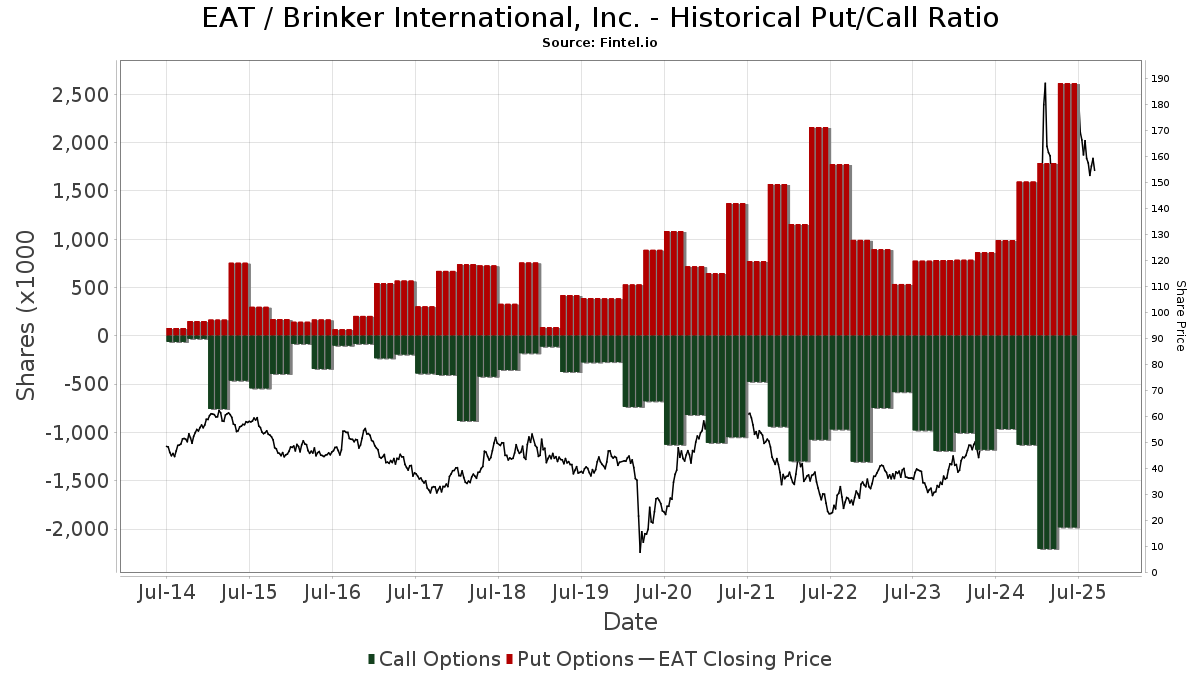
Institutionel Put/Call-forhold
Ud over at indberette standardaktie- og gældsudstedelser skal institutter med mere end 100 mill. aktiver under forvaltning også oplyse deres put- og call-optionsbeholdninger. Da salgsoptioner generelt indikerer negativ stemning, og købsoptioner indikerer positiv stemning, kan vi få en fornemmelse af den overordnede institutionelle stemning ved at plotte forholdet mellem put og kald. Diagrammet til højre viser det historiske put/call-forhold for dette instrument.
Brug af Put/Call Ratio som en indikator for investorernes stemning overvinder en af de vigtigste mangler ved at bruge totalt institutionelt ejerskab, som er, at en betydelig mængde af aktiver under forvaltning investeres passivt for at spore indekser. Passivt forvaltede fonde køber typisk ikke optioner, så indikatoren for put/call-forholdet følger mere nøje følelsen af aktivt forvaltede fonde.
13D/G-arkivering
Vi præsenterer 13D/G ansøgninger separat fra 13F ansøgninger på grund af den forskellige behandling af SEC. 13D/G-ansøgninger kan indgives af grupper af investorer (med én ledende), hvorimod 13F-ansøgninger ikke kan. Dette resulterer i situationer, hvor en investor kan indsende en 13D/G, der rapporterer én værdi for de samlede aktier (der repræsenterer alle de aktier, der ejes af investorgruppen), men derefter indsender en 13F, der rapporterer en anden værdi for de samlede aktier (der udelukkende repræsenterer deres egne) ejendomsret). Det betyder, at aktieejerskab af 13D/G-arkiver og 13F-arkiveringer ofte ikke er direkte sammenlignelige, så vi præsenterer dem separat.
Bemærk: Fra den 16. maj 2021 viser vi ikke længere ejere, der ikke har indsendt en 13D/G inden for det seneste år. Tidligere viste vi den fulde historie af 13D/G-arkiver. Generelt skal enheder, der er forpligtet til at indgive 13D/G-ansøgninger, indgive mindst årligt, før de indsender en afsluttende ansøgning. Dog forlader fonde nogle gange positioner uden at indsende en afsluttende ansøgning (dvs. de afvikler), så visning af den fulde historie resulterede nogle gange i forvirring om det nuværende ejerskab. For at undgå forvirring viser vi nu kun 'aktuelle' ejere - det vil sige - ejere, der har anmeldt inden for det seneste år.
Upgrade to unlock premium data.
| Fil dato | Form | Investor | Forrige Aktier |
Seneste Aktier |
Δ Aktier (Procent) |
Ejendomsret (Procent) |
Δ Ejerskab (Procent) |
|
|---|---|---|---|---|---|---|---|---|
| 2026-04-29 | VANGUARD CAPITAL MANAGEMENT LLC | 2,275,822 | 5.22 | |||||
| 2026-04-29 | VANGUARD PORTFOLIO MANAGEMENT LLC | 2,500,356 | 5.74 | |||||
| 2026-03-26 | VANGUARD GROUP INC | 4,965,829 | 0 | -100.00 | 0.00 | -100.00 | ||
| 2026-01-08 | FMR LLC | 3,519,391 | 5,208,744 | 48.00 | 11.70 | 48.80 | ||
| 2025-04-25 | BlackRock, Inc. | 7,773,200 | 6,545,938 | -15.79 | 14.70 | -16.00 |
13F og NPORT arkivering
Detaljer om 13F-arkivering er gratis. Detaljer om NP-ansøgninger kræver et premium-medlemskab. Grønne rækker angiver nye positioner. Røde rækker angiver lukkede positioner. Klik på linket ikon for at se den fulde transaktionshistorik.
Opgrader
for at låse premium-data op og eksportere til Excel ![]() .
.
| Fil dato | Kilde | Investor | Type | Gennemsnitlig pris (Øst) |
Aktier | Δ Aktier (%) |
Rapporteret Værdi ($1000) |
Δ Værdi (%) |
Port Alloc (%) |
|
|---|---|---|---|---|---|---|---|---|---|---|
| 2026-02-17 | 13F | Aster Capital Management (DIFC) Ltd | 59 | 8 | ||||||
| 2026-02-11 | 13F | Buckingham Strategic Partners | 2.045 | 293 | ||||||
| 2026-02-04 | 13F | Blackhawk Capital Partners LLC. | 0 | -100,00 | 0 | -100,00 | ||||
| 2025-11-14 | 13F | Nomura Holdings Inc | Put | 0 | -100,00 | 0 | -100,00 | |||
| 2025-11-17 | 13F | Armistice Capital, Llc | 0 | -100,00 | 0 | -100,00 | ||||
| 2026-02-09 | 13F | Optimize Financial Inc | 3.825 | 1,38 | 549 | 14,88 | ||||
| 2026-02-17 | 13F | Alliancebernstein L.p. | 123.112 | 39,70 | 17.669 | 58,27 | ||||
| 2026-02-13 | 13F | Sei Investments Co | 27.740 | -5,88 | 3.981 | 6,64 | ||||
| 2026-02-13 | 13F | Vontobel Holding Ltd. | 3.161 | -28,68 | 454 | -19,25 | ||||
| 2026-02-09 | 13F | Frazier Financial Advisors, LLC | 0 | -100,00 | 0 | |||||
| 2026-02-17 | 13F | D. E. Shaw & Co., Inc. | Put | 56.100 | 43,85 | 8.051 | 62,98 | |||
| 2026-02-13 | 13F | Virtus ETF Advisers LLC | 5.093 | 0,00 | 731 | 13,18 | ||||
| 2025-11-14 | 13F | Sig Brokerage, Lp | Put | 0 | -100,00 | 0 | -100,00 | |||
| 2026-02-17 | 13F | Tabor Asset Management, LP | 28.760 | 4.128 | ||||||
| 2026-02-13 | 13F | Prudential Financial Inc | 49.954 | -34,90 | 7.169 | -26,24 | ||||
| 2026-02-04 | 13F | Marco Investment Management Llc | 2.550 | 366 | ||||||
| 2026-01-28 | 13F | CAPROCK Group, Inc. | 1.655 | -34,30 | 238 | -39,54 | ||||
| 2026-02-02 | 13F | Cornerstone Planning Group LLC | 0 | -100,00 | 0 | |||||
| 2026-02-17 | 13F | Shay Capital LLC | 7.400 | 1.062 | ||||||
| 2025-11-04 | 13F | Convergence Investment Partners, LLC | 0 | -100,00 | 0 | -100,00 | ||||
| 2026-02-12 | 13F | Xponance, Inc. | 3.491 | 0,72 | 501 | 14,12 | ||||
| 2026-04-17 | 13F | CENTRAL TRUST Co | 7 | 1 | ||||||
| 2026-01-23 | 13F | Beacon Harbor Wealth Advisors, Inc. | 0 | -100,00 | 0 | -100,00 | ||||
| 2026-02-09 | 13F | Atlantic Trust, LLC | 0 | -100,00 | 0 | |||||
| 2026-02-11 | 13F | Zions Bancorporation, National Association /ut/ | 8 | 1 | ||||||
| 2026-02-11 | 13F | O'shaughnessy Asset Management, Llc | 13.163 | -45,99 | 1.889 | -38,81 | ||||
| 2026-02-17 | 13F | Gladstone Institutional Advisory LLC | 0 | -100,00 | 0 | |||||
| 2026-04-30 | 13F | Horrell Capital Management, Inc. | 22.337 | -8,19 | 3.189 | -8,65 | ||||
| 2026-02-05 | 13F | Atria Investments Llc | 4.262 | 135,86 | 612 | 167,98 | ||||
| 2026-02-17 | 13F | D. E. Shaw & Co., Inc. | Call | 23.600 | -62,42 | 3.387 | -57,42 | |||
| 2026-04-28 | 13F | Raleigh Capital Management Inc. | 15 | 2 | ||||||
| 2026-02-17 | 13F | D. E. Shaw & Co., Inc. | 1.544.009 | -17,37 | 221.596 | -6,39 | ||||
| 2026-02-11 | 13F | Fox Run Management, L.l.c. | 4.152 | -78,79 | 596 | -76,01 | ||||
| 2026-04-30 | 13F | Hsbc Holdings Plc | 5.540 | -83,42 | 792 | -83,53 | ||||
| 2026-02-12 | 13F | Federation des caisses Desjardins du Quebec | 0 | -100,00 | 0 | |||||
| 2026-02-13 | 13F | Schroder Investment Management Group | 42.809 | 28,80 | 6.112 | 38,31 | ||||
| 2026-04-14 | 13F | Howland Capital Management Llc | 12.146 | 0,00 | 1.734 | -0,52 | ||||
| 2026-04-30 | 13F | First Horizon Corp | 337 | 0,00 | 48 | 0,00 | ||||
| 2026-04-20 | 13F | Kestra Private Wealth Services, Llc | 0 | -100,00 | 0 | |||||
| 2026-02-17 | 13F | California State Teachers Retirement System | 42.032 | 1,64 | 6.032 | 15,16 | ||||
| 2025-11-21 | 13F | Nebula Research & Development LLC | 0 | -100,00 | 0 | -100,00 | ||||
| 2026-04-29 | 13F | Klp Kapitalforvaltning As | 9.800 | 3,16 | 1.399 | 2,64 | ||||
| 2026-01-23 | 13F | Robeco Institutional Asset Management B.V. | 0 | -100,00 | 0 | |||||
| 2026-01-30 | 13F | State of New Jersey Common Pension Fund D | 17.650 | 12,78 | 2.533 | 27,80 | ||||
| 2026-02-17 | 13F | Tower Research Capital LLC (TRC) | 1.818 | -17,33 | 261 | -6,47 | ||||
| 2026-02-13 | 13F | Aurora Investment Counsel | 5.649 | -20,65 | 811 | -10,10 | ||||
| 2026-02-13 | 13F | Squarepoint Ops LLC | 0 | -100,00 | 0 | -100,00 | ||||
| 2026-01-29 | 13F | Brindle & Bay Financial Advisors, LLC | 3.046 | 437 | ||||||
| 2026-04-17 | 13F | LMG Wealth Partners, LLC | 5.584 | 17,48 | 797 | 16,86 | ||||
| 2026-02-10 | 13F | Lido Advisors, LLC | 14.289 | 1,32 | 1.823 | 2,02 | ||||
| 2026-02-17 | 13F | Occudo Quantitative Strategies Lp | 0 | -100,00 | 0 | |||||
| 2026-02-17 | 13F | Vinva Investment Management Ltd | 1.030 | 219 | ||||||
| 2026-02-11 | 13F | Axiom International Investors Llc /de | 0 | -100,00 | 0 | -100,00 | ||||
| 2026-02-17 | 13F | XTX Topco Ltd | 19.853 | 160,78 | 2.849 | 195,54 | ||||
| 2026-04-30 | 13F | Fortune Financial Advisors, LLC | 6.150 | 878 | ||||||
| 2026-02-11 | 13F | Townsquare Capital Llc | 3.266 | -30,70 | 469 | -21,61 | ||||
| 2026-02-13 | 13F | Bridgewater Associates, LP | 55.603 | 270,24 | 7.980 | 319,56 | ||||
| 2025-11-21 | 13F/A | CIBC Bancorp USA Inc. | 4.723 | 598 | ||||||
| 2026-02-12 | 13F | Swiss National Bank | 87.600 | 1,62 | 12.572 | 15,14 | ||||
| 2026-02-04 | 13F | Versor Investments LP | 2.381 | -57,34 | 342 | -51,77 | ||||
| 2025-11-12 | 13F | Neo Ivy Capital Management | 0 | -100,00 | 0 | -100,00 | ||||
| 2026-02-17 | 13F | Caption Management, LLC | 0 | -100,00 | 0 | |||||
| 2026-04-15 | 13F | DAVENPORT & Co LLC | 3.633 | -18,51 | 519 | -18,94 | ||||
| 2026-02-17 | 13F | Quantinno Capital Management LP | 6.877 | 2,87 | 987 | 16,55 | ||||
| 2026-04-20 | 13F | Ritholtz Wealth Management | 5.477 | -6,76 | 782 | -7,35 | ||||
| 2026-04-28 | 13F | BW Gestao de Investimentos Ltda. | 0 | -100,00 | 0 | |||||
| 2026-04-24 | 13F | UMA Financial Services, Inc. | 4 | 1 | ||||||
| 2026-01-06 | 13F | Nelson, Van Denburg & Campbell Wealth Management Group, LLC | 0 | -100,00 | 0 | -100,00 | ||||
| 2026-02-13 | 13F | Parkside Financial Bank & Trust | 48 | 26,32 | 7 | 50,00 | ||||
| 2026-02-17 | 13F | Advisory Services Network, LLC | 8.148 | 3,00 | 1.169 | 16,67 | ||||
| 2026-02-13 | 13F | Entropy Technologies, LP | 14.923 | -39,37 | 2.142 | -31,31 | ||||
| 2025-12-15 | 13F | FNY Investment Advisers, LLC | 0 | -100,00 | 0 | -100,00 | ||||
| 2026-02-09 | 13F | Employees Retirement System of Texas | 600 | -78,94 | 0 | |||||
| 2026-02-12 | 13F | Dimensional Fund Advisors Lp | 959.510 | -1,59 | 137.704 | 11,47 | ||||
| 2026-04-30 | 13F | Nuveen, LLC | 159.683 | -16,31 | 22.798 | -16,75 | ||||
| 2026-03-16 | 13F/A | Rockefeller Capital Management L.P. | 425 | -97,07 | 61 | -96,74 | ||||
| 2026-04-20 | 13F | Assenagon Asset Management S.A. | 456.565 | 53,75 | 65.184 | 52,94 | ||||
| 2026-02-17 | 13F | Creative Planning | 39.465 | 41,04 | 5.664 | 59,82 | ||||
| 2025-11-26 | 13F/A | Jpmorgan Chase & Co | Put | 0 | -100,00 | 0 | -100,00 | |||
| 2026-02-17 | 13F | Bayesian Capital Management, LP | 0 | -100,00 | 0 | |||||
| 2026-01-29 | 13F | Teachers Retirement System Of The State Of Kentucky | 11.154 | -11,60 | 2 | 0,00 | ||||
| 2026-02-13 | 13F | Financial Network Wealth Advisors LLC | 23 | 360,00 | 3 | |||||
| 2025-11-14 | 13F | Texas Permanent School Fund | 0 | -100,00 | 0 | -100,00 | ||||
| 2026-04-10 | 13F | Abound Wealth Management | 2 | -33,33 | 0 | |||||
| 2026-02-13 | 13F | Greenline Wealth Management LLC | 8 | 1 | ||||||
| 2026-02-12 | 13F | CIBC Private Wealth Group, LLC | 1.025 | -26,47 | 147 | -16,48 | ||||
| 2026-01-15 | 13F | Allspring Global Investments Holdings, LLC | 80.606 | 7,56 | 12.213 | 30,33 | ||||
| 2026-02-17 | 13F | Balyasny Asset Management Llc | 1.142.263 | 667,51 | 163.938 | 769,55 | ||||
| 2026-02-10 | 13F | Bnp Paribas Arbitrage, Sa | 81.624 | -81,88 | 11.715 | -79,47 | ||||
| 2025-11-14 | 13F | Harvest Fund Management Co., Ltd | 0 | -100,00 | 0 | |||||
| 2026-04-28 | 13F | Everence Capital Management Inc | 2.179 | -12,84 | 0 | |||||
| 2026-02-17 | 13F | Dv Equities, Llc | 4.148 | 595 | ||||||
| 2026-02-06 | 13F | Pinnbrook Capital Management Lp | 35.130 | 242,70 | 5.042 | 288,37 | ||||
| 2026-02-09 | 13F | Smithfield Trust Co | 144 | 0,00 | 0 | |||||
| 2026-02-10 | 13F | Easterly Investment Partners Llc | 80.593 | 11.567 | ||||||
| 2026-02-10 | 13F | Bank of New York Mellon Corp | 294.399 | -5,00 | 42.252 | 7,63 | ||||
| 2025-11-14 | 13F | Point72 (DIFC) Ltd | 0 | -100,00 | 0 | -100,00 | ||||
| 2025-11-03 | 13F | Annis Gardner Whiting Capital Advisors, LLC | 0 | -100,00 | 0 | -100,00 | ||||
| 2026-02-12 | 13F | Rossby Financial, LCC | 5 | 0,00 | 1 | |||||
| 2026-02-17 | 13F | Wiley Bros.-aintree Capital, Llc | 4.469 | 3,23 | 641 | 16,97 | ||||
| 2026-02-13 | 13F | Cape Cod Five Cents Savings Bank | 2.900 | 0,00 | 222 | 0,00 | ||||
| 2026-02-17 | 13F | Graham Capital Management, L.P. | 2.770 | -50,11 | 398 | -43,53 | ||||
| 2026-02-17 | 13F | ISAM Funds (UK) Ltd | 0 | -100,00 | 0 | |||||
| 2026-04-22 | 13F | Janney Montgomery Scott LLC | 0 | -100,00 | 0 | |||||
| 2026-02-02 | 13F | Danske Bank A/s | 10.719 | -44,48 | 1.538 | -37,10 | ||||
| 2025-11-07 | 13F | Capital CS Group, LLC | 0 | -100,00 | 0 | -100,00 | ||||
| 2026-04-08 | 13F | DiNuzzo Private Wealth, Inc. | 6 | 0,00 | 1 | |||||
| 2026-02-10 | 13F | Acadian Asset Management Llc | 606 | 181,86 | 0 | |||||
| 2026-02-10 | 13F | Globeflex Capital L P | 10 | 0,00 | 1 | 0,00 | ||||
| 2026-02-11 | 13F | Prestige Wealth Management Group LLC | 19 | 0,00 | 3 | 0,00 | ||||
| 2026-02-05 | 13F | Qsemble Capital Management, LP | 13.761 | 736,53 | 1.975 | 849,04 | ||||
| 2026-02-06 | 13F | Lsv Asset Management | 5.100 | 1 | ||||||
| 2026-05-01 | 13F | Fifth Third Bancorp | 28.607 | 10.860,54 | 4.084 | 10.937,84 | ||||
| 2026-01-12 | 13F | Byrne Asset Management LLC | 0 | -100,00 | 0 | -100,00 | ||||
| 2026-04-14 | 13F | Congress Asset Management Co /ma | 615.732 | 9,75 | 87.908 | 9,18 | ||||
| 2025-11-14 | 13F | Menard Financial Group LLC | 0 | -100,00 | 0 | -100,00 | ||||
| 2026-02-13 | 13F | Smartleaf Asset Management LLC | 1.089 | -37,70 | 155 | -33,19 | ||||
| 2026-02-13 | 13F | Champlain Investment Partners, LLC | 126.037 | 18.089 | ||||||
| 2026-04-28 | 13F | Harbor Capital Advisors, Inc. | 148 | 54,17 | 0 | |||||
| 2026-04-27 | 13F | Sound Income Strategies, LLC | 23 | -73,26 | 3 | -76,92 | ||||
| 2026-02-17 | 13F | Interval Partners, LP | 106.918 | 154,23 | 15.345 | 188,04 | ||||
| 2026-04-30 | 13F | Kestra Advisory Services, LLC | 0 | -100,00 | 0 | |||||
| 2026-01-29 | 13F | Nbc Securities, Inc. | 0 | -100,00 | 0 | -100,00 | ||||
| 2026-02-05 | 13F | Bessemer Group Inc | 65.487 | 881,67 | 9 | |||||
| 2026-02-03 | 13F | Mma Asset Management Llc | 0 | -100,00 | 0 | |||||
| 2025-11-04 | 13F | Transcendent Capital Group LLC | 0 | -100,00 | 0 | -100,00 | ||||
| 2026-02-11 | 13F | Allianz Asset Management GmbH | 160.951 | -47,04 | 23.100 | -40,00 | ||||
| 2026-02-17 | 13F | MIRAE ASSET GLOBAL ETFS HOLDINGS Ltd. | 20.558 | -0,12 | 2.950 | 13,16 | ||||
| 2026-02-09 | 13F | Geode Capital Management, Llc | 1.060.367 | -1,69 | 152.208 | 11,10 | ||||
| 2026-05-01 | 13F | Anchor Investment Management, LLC | 100 | 0,00 | 14 | 0,00 | ||||
| 2026-01-29 | 13F | IMC-Chicago, LLC | Put | 172.300 | 96,47 | 24.728 | 122,59 | |||
| 2026-01-29 | 13F | IMC-Chicago, LLC | Call | 141.900 | 32,25 | 20.365 | 49,83 | |||
| 2026-02-12 | 13F | Counterpoint Mutual Funds LLC | 0 | -100,00 | 0 | -100,00 | ||||
| 2026-02-12 | 13F | Integrated Quantitative Investments LLC | 0 | -100,00 | 0 | |||||
| 2026-04-23 | 13F | Marquette Asset Management, LLC | 5 | 0,00 | 1 | |||||
| 2026-04-29 | 13F | Police & Firemen's Retirement System of New Jersey | 11.876 | -1,40 | 1.696 | -1,91 | ||||
| 2026-02-11 | 13F | Invst, LLC | 5.771 | -1,45 | 828 | 11,74 | ||||
| 2026-02-02 | 13F | Horizon Investments, LLC | 10.425 | -15,83 | 1.496 | -4,59 | ||||
| 2026-02-11 | 13F | Picton Mahoney Asset Management | 16 | -99,73 | 2 | |||||
| 2026-02-12 | 13F | BlackRock, Inc. | 6.578.291 | -3,14 | 944.116 | 9,74 | ||||
| 2026-02-13 | 13F | Caxton Associates Llp | 0 | -100,00 | 0 | -100,00 | ||||
| 2026-04-24 | 13F | Yousif Capital Management, Llc | 7.705 | -2,33 | 1.100 | -12,70 | ||||
| 2026-02-13 | 13F | Transamerica Financial Advisors, Inc. | 181 | 26 | ||||||
| 2026-04-14 | 13F | Bay Harbor Wealth Management, LLC | 6 | 20,00 | 1 | |||||
| 2026-02-11 | 13F | J.w. Cole Advisors, Inc. | 0 | -100,00 | 0 | |||||
| 2026-04-13 | 13F | Massmutual Trust Co Fsb/adv | 53 | 1,92 | 8 | 0,00 | ||||
| 2026-04-07 | 13F | Signaturefd, Llc | 959 | 1,48 | 137 | 0,74 | ||||
| 2026-04-17 | 13F | Bell Investment Advisors, Inc | 83 | 0,00 | 12 | 0,00 | ||||
| 2026-02-06 | 13F | EverSource Wealth Advisors, LLC | 1.804 | 46,43 | 259 | 65,38 | ||||
| 2025-11-14 | 13F | Axa S.a. | 0 | -100,00 | 0 | -100,00 | ||||
| 2026-04-16 | 13F | Balboa Wealth Partners | 2.194 | 53,32 | 313 | 52,68 | ||||
| 2026-04-29 | 13F | Nilsine Partners, LLC | 18.876 | 804,02 | 2.532 | 746,49 | ||||
| 2026-04-10 | 13F/A | OP Asset Management Ltd | 23.526 | 29,76 | 3.359 | 29,05 | ||||
| 2026-01-29 | 13F | Elevated Financial Group LLC | 2.282 | 328 | ||||||
| 2026-02-13 | 13F | Walleye Trading LLC | Call | 7.500 | -28,57 | 1.076 | -19,10 | |||
| 2026-04-22 | 13F | Pictet Asset Management Holding SA | 6.875 | 10,62 | 982 | 10,10 | ||||
| 2026-04-24 | 13F | Abacus Wealth Partners, LLC | 1.406 | -30,33 | 201 | -30,80 | ||||
| 2026-02-13 | 13F | Walleye Trading LLC | 41.205 | -26,37 | 5.914 | -16,59 | ||||
| 2026-02-13 | 13F | Timelo Investment Management Inc. | 20.000 | 100,00 | 2.870 | 126,70 | ||||
| 2026-02-13 | 13F | Walleye Trading LLC | Put | 73.600 | -26,55 | 10.563 | -16,78 | |||
| 2026-04-29 | 13F | Oregon Public Employees Retirement Fund | 9.962 | -1,94 | 1.422 | -2,47 | ||||
| 2026-02-04 | 13F | Virginia Retirement Systems Et Al | 23.066 | 3,13 | 3.310 | 16,84 | ||||
| 2026-02-17 | 13F | Longaeva Partners L.P. | 119.904 | 17.209 | ||||||
| 2026-02-17 | 13F | Woodline Partners LP | 410.862 | 58.967 | ||||||
| 2026-02-13 | 13F/A | Alberta Investment Management Corp | 0 | -100,00 | 0 | -100,00 | ||||
| 2026-02-13 | 13F | Baird Financial Group, Inc. | 0 | -100,00 | 0 | -100,00 | ||||
| 2026-04-27 | 13F | HB Wealth Management, LLC | 1.518 | 217 | ||||||
| 2026-02-12 | 13F | Commonwealth Equity Services, Llc | 5.520 | 16,23 | 792 | |||||
| 2026-04-17 | 13F | Fifth Third Wealth Advisors LLC | 1.406 | 201 | ||||||
| 2026-02-06 | 13F | Kingdom Financial Group LLC. | 70 | 10 | ||||||
| 2025-11-14 | 13F | Teza Capital Management LLC | 0 | -100,00 | 0 | -100,00 | ||||
| 2026-02-02 | 13F | Advisors Preferred, LLC | 6.430 | 974 | ||||||
| 2026-02-04 | 13F | Atlantic Union Bankshares Corp | 336 | -22,94 | 48 | -12,73 | ||||
| 2026-02-17 | 13F | Captrust Financial Advisors | 8.244 | 81,79 | 1.183 | 106,10 | ||||
| 2026-01-12 | 13F | Rialto Wealth Management, LLC | 3 | 0,00 | 0 | |||||
| 2026-02-12 | 13F | Ci Investments Inc. | 0 | -100,00 | 0 | |||||
| 2026-02-19 | 13F | Atomi Financial Group, Inc. | 2.189 | -6,69 | 314 | 5,72 | ||||
| 2026-02-03 | 13F | Rezny Wealth Management, Inc. | 11.738 | 0,79 | 1.685 | 14,17 | ||||
| 2026-02-10 | 13F | Nomura Asset Management Co Ltd | 160 | 0,00 | 23 | 10,00 | ||||
| 2026-01-28 | 13F | Salomon & Ludwin, LLC | 299 | 45,15 | 45 | 69,23 | ||||
| 2026-02-10 | 13F | Hillsdale Investment Management Inc. | 43.950 | -17,39 | 6.308 | -6,41 | ||||
| 2026-01-27 | 13F | TD Waterhouse Canada Inc. | 26 | 0,00 | 4 | 0,00 | ||||
| 2026-01-21 | 13F | Portside Wealth Group, LLC | 3.816 | 548 | ||||||
| 2026-02-13 | 13F | Maverick Capital Ltd | 0 | -100,00 | 0 | |||||
| 2026-02-13 | 13F | Victory Capital Management Inc | 30.726 | -67,14 | 4.410 | -62,77 | ||||
| 2025-11-12 | 13F | Edgestream Partners, L.P. | 0 | -100,00 | 0 | -100,00 | ||||
| 2026-04-27 | 13F | Burford Brothers, Inc. | 2.652 | 0,00 | 379 | -0,53 | ||||
| 2026-02-17 | 13F | Millennium Management Llc | Call | 30.600 | -0,97 | 4.392 | 12,19 | |||
| 2026-04-30 | 13F | Cedar Mountain Advisors, LLC | 6 | 500,00 | 1 | |||||
| 2025-11-13 | 13F | Quadrature Capital Ltd | 0 | -100,00 | 0 | -100,00 | ||||
| 2026-01-08 | 13F | Signet Financial Management, Llc | 0 | -100,00 | 0 | -100,00 | ||||
| 2026-04-30 | 13F | Torren Management, LLC | 27 | 0,00 | 4 | 0,00 | ||||
| 2026-02-09 | 13F | Hartland & Co., LLC | 3.936 | 888,94 | 565 | 1.028,00 | ||||
| 2026-02-13 | 13F | Morgan Stanley | 653.927 | 2,08 | 93.852 | 15,65 | ||||
| 2026-02-13 | 13F | State Street Corp | 1.654.324 | -0,48 | 237.429 | 12,75 | ||||
| 2026-04-22 | 13F | Ifrah Financial Services, Inc. | 1.443 | -3,86 | 206 | -4,19 | ||||
| 2026-02-11 | 13F | Twin Tree Management, LP | Call | 31.800 | 98,75 | 4.564 | 125,22 | |||
| 2026-02-13 | 13F | Umb Bank N A/mo | 217 | 15,43 | 31 | 34,78 | ||||
| 2026-01-28 | 13F | DekaBank Deutsche Girozentrale | 3.379 | 0,00 | 0 | |||||
| 2026-04-30 | 13F | Sumitomo Mitsui Trust Holdings, Inc. | 1.500 | 214 | ||||||
| 2026-02-09 | 13F | Accent Capital Management, LLC | 42 | 0,00 | 6 | 20,00 | ||||
| 2026-02-17 | 13F | Aquatic Capital Management LLC | 6.440 | -93,64 | 924 | -92,80 | ||||
| 2026-02-13 | 13F | Squarepoint Ops LLC | Call | 10.900 | -71,83 | 1.564 | -68,09 | |||
| 2026-02-13 | 13F | Squarepoint Ops LLC | Put | 5.500 | -42,11 | 789 | -34,41 | |||
| 2026-04-16 | 13F | Capital Advisors, Ltd. LLC | 18 | 0,00 | 0 | |||||
| 2026-04-30 | 13F | Money Concepts Capital Corp | 0 | -100,00 | 0 | |||||
| 2026-02-09 | 13F | Optimist Retirement Group LLC | 2.074 | 2,37 | 298 | 16,02 | ||||
| 2026-02-13 | 13F | AlTi Global, Inc. | 0 | -100,00 | 0 | |||||
| 2026-02-17 | 13F | Millennium Management Llc | 1.012.513 | 81,84 | 145.316 | 106,02 | ||||
| 2026-04-17 | 13F | Agp Franklin, Llc | 13.934 | 298,46 | 1.989 | 297,01 | ||||
| 2026-02-17 | 13F | Royal Bank Of Canada | 75.084 | 206,34 | 10.775 | 247,24 | ||||
| 2025-11-14 | 13F | Centiva Capital, LP | 0 | -100,00 | 0 | -100,00 | ||||
| 2026-04-29 | 13F | CVA Family Office, LLC | 27 | 4 | ||||||
| 2026-02-13 | 13F | Natixis | 4.800 | 689 | ||||||
| 2026-02-10 | 13F | Rothschild Investment Llc | 2.985 | -4,42 | 428 | 8,35 | ||||
| 2026-02-13 | 13F | FORA Capital, LLC | 0 | -100,00 | 0 | |||||
| 2025-11-14 | 13F | AXA Investment Managers S.A. | 35.699 | 4.522 | ||||||
| 2026-02-03 | 13F | Navellier & Associates Inc | 14.351 | -22,39 | 2.060 | -12,08 | ||||
| 2026-02-13 | 13F | Blueshift Asset Management, LLC | 0 | -100,00 | 0 | |||||
| 2026-02-17 | 13F | Jones Financial Companies Lllp | 1.426 | 49,01 | 205 | 61,90 | ||||
| 2026-04-15 | 13F | Horizon Financial Services, Llc | 0 | 0 | ||||||
| 2026-02-04 | 13F | Independent Advisor Alliance | 26.282 | 21,97 | 3.772 | 38,18 | ||||
| 2026-04-28 | 13F | Golden State Wealth Management, LLC | 257 | 446,81 | 37 | 500,00 | ||||
| 2026-04-23 | 13F | North Growth Management Ltd. | 142.000 | 1,43 | 20 | 0,00 | ||||
| 2026-02-12 | 13F | Federated Hermes, Inc. | 61.581 | -12,48 | 8.838 | -0,84 | ||||
| 2026-02-17 | 13F | Sherbrooke Park Advisers Llc | 0 | -100,00 | 0 | |||||
| 2025-11-06 | 13F | Cookson Peirce & Co Inc | 0 | -100,00 | 0 | -100,00 | ||||
| 2025-11-14 | 13F | Cartenna Capital, LP | Put | 0 | -100,00 | 0 | -100,00 | |||
| 2026-02-11 | 13F | Simplex Trading, Llc | Put | 1.400 | -91,62 | 201 | 9.900,00 | |||
| 2026-02-17 | 13F | Jain Global LLC | 0 | -100,00 | 0 | |||||
| 2026-02-17 | 13F | Citadel Advisors Llc | 835.731 | 6,31 | 119.944 | 20,44 | ||||
| 2026-02-17 | 13F | Trexquant Investment LP | 0 | -100,00 | 0 | |||||
| 2026-02-11 | 13F | Simplex Trading, Llc | Call | 65.500 | -36,71 | 9.401 | 72.207,69 | |||
| 2026-04-13 | 13F | True Wealth Design, LLC | 0 | -100,00 | 0 | |||||
| 2026-02-17 | 13F | Citadel Advisors Llc | Put | 186.900 | 16,45 | 26.824 | 31,93 | |||
| 2026-02-17 | 13F | Citadel Advisors Llc | Call | 272.200 | -37,48 | 39.066 | -29,17 | |||
| 2025-11-05 | 13F | Axim Planning & Wealth | 0 | -100,00 | 0 | -100,00 | ||||
| 2025-11-14 | 13F | Wolverine Trading, Llc | 8.341 | 1.109 | ||||||
| 2026-02-17 | 13F | Algert Global Llc | 36.109 | 0,00 | 5 | 25,00 | ||||
| 2025-11-14 | 13F | Wolverine Trading, Llc | Call | 60.600 | -14,16 | 8.058 | -36,61 | |||
| 2026-04-23 | 13F | CWM Advisors, LLC | 15 | 0,00 | 2 | 0,00 | ||||
| 2025-11-14 | 13F | Wolverine Trading, Llc | Put | 47.100 | -38,51 | 6.263 | -54,59 | |||
| 2026-02-12 | 13F | Campbell & CO Investment Adviser LLC | 0 | -100,00 | 0 | |||||
| 2026-02-13 | 13F | First Trust Advisors Lp | 23.709 | -52,83 | 3.403 | -46,57 | ||||
| 2026-04-17 | 13F | AdvisorNet Financial, Inc | 38 | 0,00 | 5 | 0,00 | ||||
| 2026-04-21 | 13F | Hennessy Advisors Inc | 58.700 | -3,29 | 8.381 | -3,80 | ||||
| 2026-02-17 | 13F | Point72 Asset Management, L.P. | 649.168 | 15,57 | 93.169 | 30,93 | ||||
| 2026-02-17 | 13F | Point72 Asset Management, L.P. | Put | 2.900 | 416 | |||||
| 2026-02-17 | 13F | Holocene Advisors, LP | 1.390.703 | 2.558,12 | 199.594 | 2.911,82 | ||||
| 2026-02-13 | 13F | Martingale Asset Management L P | 5.140 | -31,84 | 738 | -22,83 | ||||
| 2026-02-17 | 13F | Point72 Asset Management, L.P. | Call | 14.200 | 2.038 | |||||
| 2026-02-17 | 13F | Qube Research & Technologies Ltd | Call | 0 | -100,00 | 0 | ||||
| 2026-04-29 | 13F | Standard Life Aberdeen plc | 128.450 | -5,94 | 18.339 | -6,43 | ||||
| 2026-02-17 | 13F | Farringdon Capital, Ltd. | 0 | -100,00 | 0 | |||||
| 2026-02-17 | 13F | Qube Research & Technologies Ltd | 0 | -100,00 | 0 | |||||
| 2026-02-17 | 13F | Qube Research & Technologies Ltd | Put | 0 | -100,00 | 0 | ||||
| 2026-02-11 | 13F | Cerity Partners LLC | 16.971 | 61,61 | 2.436 | 83,08 | ||||
| 2026-04-28 | 13F | SBI Securities Co., Ltd. | 124 | -26,63 | 18 | -29,17 | ||||
| 2026-01-23 | 13F | Sunpointe, LLC | 0 | -100,00 | 0 | -100,00 | ||||
| 2026-02-19 | 13F | CI Private Wealth, LLC | 3.482 | -21,04 | 500 | -10,57 | ||||
| 2026-02-13 | 13F | Divisadero Street Capital Management, LP | 0 | -100,00 | 0 | -100,00 | ||||
| 2026-02-17 | 13F | Wellington Management Group Llp | 52.302 | -10,25 | 7.506 | 1,69 | ||||
| 2026-02-17 | 13F | Mangrove Partners | 3.154 | 453 | ||||||
| 2025-11-14 | 13F | Millennium Management Llc | Put | 0 | -100,00 | 0 | -100,00 | |||
| 2025-11-06 | 13F | Ameritas Advisory Services, LLC | 0 | -100,00 | 0 | -100,00 | ||||
| 2026-02-17 | 13F | Northern Trust Corp | 432.705 | -4,08 | 62.102 | 8,67 | ||||
| 2025-11-13 | 13F | Twin Tree Management, LP | 0 | -100,00 | 0 | -100,00 | ||||
| 2025-11-14 | 13F | Oxford Asset Management Llp | 0 | -100,00 | 0 | -100,00 | ||||
| 2026-02-17 | 13F | Aristeia Capital Llc | 0 | -100,00 | 0 | -100,00 | ||||
| 2026-02-17 | 13F | Mane Global Capital Management Lp | 383.364 | 55.020 | ||||||
| 2025-11-20 | 13F | Crown Advisors Management, Inc. | 0 | -100,00 | 0 | -100,00 | ||||
| 2026-05-01 | 13F | Triton Wealth Management, PLLC | 2.732 | 0,00 | 396 | -8,78 | ||||
| 2026-04-06 | 13F | Versant Capital Management, Inc | 382 | 0,00 | 55 | 0,00 | ||||
| 2026-04-30 | 13F | Sequoia Financial Advisors, LLC | 1.524 | -33,51 | 218 | -33,84 | ||||
| 2026-02-17 | 13F | Cinctive Capital Management LP | 5.498 | 789 | ||||||
| 2026-01-30 | 13F | Wealth High Governance Capital Ltda | 18.308 | -84,74 | 2.628 | -82,72 | ||||
| 2026-02-17 | 13F | Capstone Investment Advisors, Llc | 0 | -100,00 | 0 | -100,00 | ||||
| 2026-02-09 | 13F | Jackson Creek Investment Advisors LLC | 0 | -100,00 | 0 | -100,00 | ||||
| 2026-04-16 | 13F | BI Asset Management Fondsmaeglerselskab A/S | 106.613 | 15 | ||||||
| 2026-01-29 | 13F | New Century Financial Group, LLC | 0 | -100,00 | 0 | -100,00 | ||||
| 2026-02-17 | 13F | Two Sigma Advisers, Lp | 17.000 | -97,60 | 2.440 | -97,29 | ||||
| 2026-02-10 | 13F | Envestnet Asset Management Inc | 36.277 | 73,61 | 5.206 | 96,68 | ||||
| 2025-11-17 | 13F | Connective Capital Management, LLC | 0 | -100,00 | 0 | -100,00 | ||||
| 2025-11-14 | 13F | Point72 Hong Kong Ltd | 18.969 | 140,45 | 2.403 | 68,92 | ||||
| 2026-02-17 | 13F | Cetera Investment Advisers | 17.005 | -1,85 | 2.441 | 11,21 | ||||
| 2026-02-13 | 13F | American Century Companies Inc | 113.617 | -23,81 | 16.306 | -13,68 | ||||
| 2026-02-13 | 13F | Marshall Wace, Llp | 106.492 | -68,41 | 15.284 | -64,21 | ||||
| 2026-02-12 | 13F | Cibc World Markets Corp | 2.931 | -46,31 | 421 | -57,32 | ||||
| 2026-04-27 | 13F | New York State Teachers Retirement System | 52.907 | -9,18 | 8 | -12,50 | ||||
| 2026-02-17 | 13F | Zacks Investment Management | 13.454 | -1,29 | 1.931 | 11,82 | ||||
| 2026-02-19 | 13F | Invesco Ltd. | 564.633 | 0,90 | 81.036 | 14,32 | ||||
| 2026-04-10 | 13F | Jacobson & Schmitt Advisors, Llc | 3.695 | 0,00 | 528 | -0,57 | ||||
| 2025-11-13 | 13F | Glenmede Investment Management, LP | 0 | -100,00 | 0 | -100,00 | ||||
| 2026-04-24 | 13F | James Investment Research Inc | 19.821 | 0,12 | 2.830 | -0,42 | ||||
| 2026-02-13 | 13F | Pathstone Holdings, LLC | 15.833 | 2,56 | 2.272 | 16,21 | ||||
| 2026-02-12 | 13F | Ankerstar Wealth, LLC | 7 | 1 | ||||||
| 2026-02-17 | 13F | Two Sigma Investments, Lp | 64.028 | -93,14 | 9.189 | -92,22 | ||||
| 2026-04-21 | 13F | GHP Investment Advisors, Inc. | 1 | 0 | ||||||
| 2026-02-17 | 13F | Polymer Capital Management (US) LLC | 6.558 | 7,16 | 941 | 21,42 | ||||
| 2026-02-11 | 13F | 111 Capital | 0 | -100,00 | 0 | -100,00 | ||||
| 2025-11-05 | 13F | Plato Investment Management Ltd | 0 | -100,00 | 0 | -100,00 | ||||
| 2025-11-14 | 13F | National Bank Of Canada /fi/ | 0 | -100,00 | 0 | -100,00 | ||||
| 2026-01-16 | 13F | Crewe Advisors LLC | 12 | 2 | ||||||
| 2026-02-17 | 13F | Schonfeld Strategic Advisors LLC | 45.896 | 53,08 | 6.587 | 73,45 | ||||
| 2026-04-23 | 13F | First Pacific Financial | 8 | 1 | ||||||
| 2026-04-22 | 13F | Spire Wealth Management | 0 | -100,00 | 0 | |||||
| 2026-04-29 | 13F | Burney Co/ | 17.402 | 59,10 | 2.484 | 58,32 | ||||
| 2026-02-06 | 13F | GPS Wealth Strategies Group, LLC | 0 | -100,00 | 0 | -100,00 | ||||
| 2025-11-17 | 13F | OmniStar Financial Group, Inc. | 0 | -100,00 | 0 | -100,00 | ||||
| 2026-01-15 | 13F | Burns Matteson Capital Management, LLC | 0 | -100,00 | 0 | -100,00 | ||||
| 2026-02-06 | 13F | Mach-1 Financial Group, Inc. | 4.270 | 613 | ||||||
| 2026-02-05 | 13F | AMJ Financial Wealth Management | 30.840 | -46,28 | 4.426 | -39,13 | ||||
| 2026-02-06 | 13F | Global Retirement Partners, LLC | 360 | 1.233,33 | 52 | 1.600,00 | ||||
| 2026-01-26 | 13F | AE Wealth Management LLC | 2.658 | 6,11 | 381 | 20,19 | ||||
| 2026-02-17 | 13F | Brevan Howard Capital Management LP | 0 | -100,00 | 0 | -100,00 | ||||
| 2026-04-29 | 13F | Skopos Labs, Inc. | 3.214 | 459 | ||||||
| 2026-02-03 | 13F | Strengthening Families & Communities, LLC | 0 | -100,00 | 0 | -100,00 | ||||
| 2026-04-27 | 13F | Meramec Financial Planners, LLC | 50 | 0,00 | 8 | -12,50 | ||||
| 2026-02-06 | 13F | Fortis Group Advisors, LLC | 5.023 | 792 | ||||||
| 2026-02-12 | 13F | Triumph Capital Management | 450 | -83,30 | 65 | -81,23 | ||||
| 2026-02-17 | 13F | Signature Equity Partners, LLC | 226 | 32 | ||||||
| 2026-01-29 | 13F | Vanguard Group Inc | 4.819.397 | 1,55 | 691.680 | 15,04 | ||||
| 2026-02-17 | 13F | Capital Fund Management S.a. | Call | 17.000 | -80,16 | 2.440 | -77,53 | |||
| 2026-04-24 | 13F | Profund Advisors Llc | 1.850 | -7,04 | 264 | -7,37 | ||||
| 2026-02-13 | 13F | Healthcare Of Ontario Pension Plan Trust Fund | 158.500 | -20,75 | 22.748 | -10,22 | ||||
| 2026-02-17 | 13F | Capital Fund Management S.a. | Put | 20.800 | -74,48 | 2.985 | -71,09 | |||
| 2025-11-13 | 13F | Nearwater Capital Markets, Ltd | 0 | -100,00 | 0 | |||||
| 2026-02-13 | 13F | SRS Capital Advisors, Inc. | 4 | -99,32 | 1 | -100,00 | ||||
| 2025-11-21 | 13F/A | Royal Bank Of Canada | Put | 0 | -100,00 | 0 | -100,00 | |||
| 2026-02-17 | 13F | State Of Wisconsin Investment Board | 65.712 | 75,15 | 9.431 | 98,44 | ||||
| 2026-04-07 | 13F | CoreCap Advisors, LLC | 1 | 0,00 | 0 | |||||
| 2026-04-30 | 13F | Valued Wealth Advisors LLC | 9 | 1 | ||||||
| 2026-01-26 | 13F | Paradigm Financial Partners, Llc | 0 | -100,00 | 0 | -100,00 | ||||
| 2026-02-13 | 13F | Ieq Capital, Llc | 17.841 | 2.561 | ||||||
| 2026-02-17 | 13F | Quantedge Capital Pte Ltd | 0 | -100,00 | 0 | |||||
| 2025-11-13 | 13F | Inceptionr Llc | 0 | -100,00 | 0 | |||||
| 2025-11-26 | 13F | Vermillion & White Wealth Management Group, LLC | 0 | -100,00 | 0 | -100,00 | ||||
| 2026-02-06 | 13F | Bare Financial Services, Inc | 59 | -4,84 | 8 | 14,29 | ||||
| 2026-02-11 | 13F | Primecap Management Co/ca/ | 28.200 | 0,00 | 4.047 | 13,30 | ||||
| 2026-02-17 | 13F | Janus Henderson Group Plc | 19.540 | 0,00 | 2.804 | 13,21 | ||||
| 2026-04-22 | 13F | Stone House Investment Management, LLC | 4 | 1 | ||||||
| 2026-02-11 | 13F | Livforsakringsbolaget Skandia, Omsesidigt | 15.821 | -30,44 | 2.527 | -86,06 | ||||
| 2026-04-22 | 13F | Oak Harvest Investment Services | 34.233 | 4.887 | ||||||
| 2026-02-17 | 13F | Shelton Capital Management | 1.450 | -11,53 | 208 | 0,48 | ||||
| 2026-02-12 | 13F | Brinker Capital Investments, LLC | 1.540 | -88,38 | 221 | -86,83 | ||||
| 2026-02-13 | 13F | Wells Fargo & Company/mn | Call | 30.000 | 4.306 | |||||
| 2026-05-01 | 13F | Rakuten Securities, Inc. | 4 | -63,64 | 1 | -100,00 | ||||
| 2026-02-13 | 13F | Wells Fargo & Company/mn | 55.845 | -3,48 | 8.015 | 9,35 | ||||
| 2026-04-21 | 13F | Financial Consulate, Inc | 50 | 0,00 | 7 | 0,00 | ||||
| 2026-02-17 | 13F | Dark Forest Capital Management Lp | 0 | -100,00 | 0 | |||||
| 2026-02-10 | 13F | Intech Investment Management Llc | 42.650 | -34,25 | 6.121 | -25,51 | ||||
| 2026-02-02 | 13F | Sachetta, LLC | 0 | -100,00 | 0 | -100,00 | ||||
| 2026-04-15 | 13F | Bayforest Capital Ltd | 288 | 294,52 | 41 | 310,00 | ||||
| 2026-01-28 | 13F | Universal- Beteiligungs- und Servicegesellschaft mbH | 19.281 | -25,04 | 2.767 | -15,07 | ||||
| 2026-02-12 | 13F | Cloud Capital Management, LLC | 0 | -100,00 | 0 | |||||
| 2026-02-05 | 13F | Elyxium Wealth, LLC | 1.000 | 144 | ||||||
| 2026-02-11 | 13F | Vestcor Inc | 12.061 | -57,59 | 2 | -66,67 | ||||
| 2026-02-06 | 13F | Pnc Financial Services Group, Inc. | 3.585 | -40,05 | 515 | -32,10 | ||||
| 2026-04-13 | 13F | Trust Co | 2 | 0,00 | 0 | |||||
| 2026-02-09 | 13F | Delta Asset Management Llc/tn | 600 | 0,00 | 86 | 13,16 | ||||
| 2026-02-17 | 13F | Fmr Llc | 5.208.745 | 55,22 | 747.559 | 75,85 | ||||
| 2026-02-13 | 13F | Quarry LP | 320 | -47,97 | 46 | -41,56 | ||||
| 2026-02-17 | 13F | Junto Capital Management LP | 0 | -100,00 | 0 | |||||
| 2026-01-27 | 13F | WealthCollab, LLC | 284 | 0,00 | 41 | 14,29 | ||||
| 2026-02-12 | 13F | Renaissance Technologies Llc | 1.126.065 | -20,20 | 161.613 | -9,59 | ||||
| 2026-04-28 | 13F | DGS Capital Management, LLC | 2.147 | -10,35 | 307 | -10,79 | ||||
| 2026-02-05 | 13F | Wakefield Asset Management LLLP | 7.513 | -0,19 | 1.078 | 13,12 | ||||
| 2026-02-13 | 13F | 10Elms LLP | 140 | 0,00 | 20 | 17,65 | ||||
| 2026-02-11 | 13F | Capital World Investors | 1.137.863 | 96,50 | 163.306 | 122,62 | ||||
| 2026-02-06 | 13F | Sierra Summit Advisors Llc | 0 | -100,00 | 0 | |||||
| 2026-02-10 | 13F/A | Northwestern Mutual Wealth Management Co | 146 | 4,29 | 21 | 17,65 | ||||
| 2026-04-27 | 13F | First Dallas Securities Inc. | 2.990 | -23,37 | 427 | -23,93 | ||||
| 2026-05-01 | 13F | HFM Investment Advisors, LLC | 3 | 50,00 | 0 | |||||
| 2026-02-10 | 13F | Daiwa Securities Group Inc. | 0 | -100,00 | 0 | |||||
| 2026-02-13 | 13F | Diametric Capital, LP | 31.340 | 54,08 | 4.498 | 74,57 | ||||
| 2026-02-13 | 13F | Hudson Bay Capital Management LP | Call | 0 | -100,00 | 0 | -100,00 | |||
| 2026-04-24 | 13F | Capricorn Fund Managers Ltd | 34.000 | 4.854 | ||||||
| 2026-02-10 | 13F | Quantbot Technologies LP | 0 | -100,00 | 0 | -100,00 | ||||
| 2026-02-17 | 13F | Lazard Asset Management Llc | 10.007 | -89,48 | 1.436 | -88,08 | ||||
| 2026-04-24 | 13F | United Community Bank | 620 | 2,48 | 89 | 2,33 | ||||
| 2026-04-07 | 13F | Farther Finance Advisors, LLC | 3.585 | 91,20 | 514 | 90,71 | ||||
| 2026-01-13 | 13F | Matrix Trust Co | 0 | -100,00 | 0 | |||||
| 2026-04-24 | 13F | Root Financial Partners, LLC | 103 | 21,18 | 15 | 16,67 | ||||
| 2026-02-10 | 13F | State of Wyoming | 0 | -100,00 | 0 | -100,00 | ||||
| 2026-02-10 | 13F | Thoroughbred Financial Services, Llc | 0 | -100,00 | 0 | |||||
| 2026-04-20 | 13F | Hilton Head Capital Partners, LLC | 122 | 0,00 | 17 | 0,00 | ||||
| 2026-04-17 | 13F | Krilogy Financial LLC | 1.335 | 2,93 | 202 | -1,47 | ||||
| 2026-02-05 | 13F | Allworth Financial LP | 336 | 49,33 | 48 | 71,43 | ||||
| 2026-04-27 | 13F | Truist Financial Corp | 8.257 | 48,16 | 1.179 | 47,43 | ||||
| 2026-02-12 | 13F | California Public Employees Retirement System | 82.547 | -6,25 | 11.847 | 6,21 | ||||
| 2026-04-10 | 13F | Lifestyle Asset Management, Inc. | 0 | -100,00 | 0 | |||||
| 2026-02-11 | 13F | Rise Advisors, LLC | 0 | -100,00 | 0 | |||||
| 2026-01-27 | 13F | PFG Advisors | 6.728 | 17,70 | 966 | 33,29 | ||||
| 2026-02-05 | 13F | Amalgamated Bank | 12.924 | 1,04 | 2 | 0,00 | ||||
| 2025-11-26 | 13F/A | Jpmorgan Chase & Co | Call | 0 | -100,00 | 0 | -100,00 | |||
| 2026-02-17 | 13F | Manatuck Hill Partners, LLC | 6.000 | 861 | ||||||
| 2026-02-09 | 13F | Royce & Associates Lp | 3.804 | 546 | ||||||
| 2026-02-13 | 13F | Great West Life Assurance Co /can/ | 38.532 | -17,62 | 6 | -16,67 | ||||
| 2025-11-14 | 13F | DZ BANK AG Deutsche Zentral Genossenschafts Bank, Frankfurt am Main | 0 | -100,00 | 0 | |||||
| 2026-02-06 | 13F | Tortoise Investment Management, LLC | 0 | -100,00 | 0 | |||||
| 2026-02-13 | 13F | Brown Advisory Inc | 1.789 | 0,00 | 257 | 13,27 | ||||
| 2026-02-17 | 13F | Boothbay Fund Management, Llc | 0 | -100,00 | 0 | -100,00 | ||||
| 2026-02-19 | 13F | Mcguire Capital Advisors Inc | 122 | 18 | ||||||
| 2025-11-06 | 13F | Wedbush Securities Inc | 0 | -100,00 | 0 | |||||
| 2026-04-16 | 13F | Future Financial Wealth Managment LLC | 2.000 | 0,00 | 314 | -1,57 | ||||
| 2026-02-06 | 13F | Cullen/frost Bankers, Inc. | 151 | 6,34 | 22 | 23,53 | ||||
| 2026-02-11 | 13F | Meeder Asset Management Inc | 21.416 | -5,16 | 3.074 | 7,45 | ||||
| 2026-02-10 | 13F | Mutual Of America Capital Management Llc | 5.078 | 1,99 | 729 | 15,56 | ||||
| 2026-02-17 | 13F | Russell Investments Group, Ltd. | 40.331 | -46,61 | 5.788 | -39,56 | ||||
| 2026-04-20 | 13F | State of Alaska, Department of Revenue | 21.498 | -4,98 | 3 | 0,00 | ||||
| 2026-02-02 | 13F | Hussman Strategic Advisors, Inc. | 0 | -100,00 | 0 | -100,00 | ||||
| 2026-02-17 | 13F | RMB Capital Management, LLC | 1.680 | 241 | ||||||
| 2026-02-04 | 13F | Swiss Life Asset Management Ltd | 2.040 | 0,00 | 293 | 13,18 | ||||
| 2025-11-14 | 13F | Lido Advisors, LLC | Put | 0 | -100,00 | 0 | -100,00 | |||
| 2026-02-17 | 13F | Delaware Management Holdings, Inc. | 411.233 | 59.020 | ||||||
| 2025-11-06 | 13F | CIBC World Markets Inc. | 0 | -100,00 | 0 | -100,00 | ||||
| 2026-01-23 | 13F | Assetmark, Inc | 1 | 0,00 | 0 | |||||
| 2026-01-16 | 13F | Morris Retirement Advisors, LLC | 0 | -100,00 | 0 | -100,00 | ||||
| 2026-02-23 | 13F | Virtu Financial LLC | 0 | -100,00 | 0 | |||||
| 2026-02-11 | 13F | Jpmorgan Chase & Co | 135.671 | -19,47 | 19.472 | -8,76 | ||||
| 2026-02-13 | 13F | Charles Schwab Investment Management Inc | 632.432 | -1,32 | 90.767 | 11,80 | ||||
| 2025-11-13 | 13F | Elevatus Welath Management | 0 | -100,00 | 0 | |||||
| 2026-01-28 | 13F | WPG Advisers, LLC | 0 | -100,00 | 0 | |||||
| 2026-04-06 | 13F | GAMMA Investing LLC | 808 | 5,48 | 115 | 5,50 | ||||
| 2026-02-17 | 13F | Engineers Gate Manager LP | 209.695 | -31,73 | 30.095 | -22,65 | ||||
| 2026-02-12 | 13F | Wealthspire Advisors, LLC | 0 | -100,00 | 0 | -100,00 | ||||
| 2026-01-29 | 13F | UBS Group AG | 2.975.655 | 103,20 | 427.066 | 130,21 | ||||
| 2026-01-30 | 13F | Jennison Associates Llc | 0 | -100,00 | 0 | -100,00 | ||||
| 2026-01-30 | 13F | Us Bancorp \de\ | 4.820 | 33,89 | 692 | 51,54 | ||||
| 2026-04-20 | 13F | Jfs Wealth Advisors, Llc | 39 | 5,41 | 6 | 0,00 | ||||
| 2026-02-05 | 13F | High Note Wealth, LLC | 15 | -46,43 | 2 | -33,33 | ||||
| 2026-02-12 | 13F | New York State Common Retirement Fund | 15.178 | 0,00 | 2.178 | 13,32 | ||||
| 2026-02-13 | 13F | Laurion Capital Management LP | 5.822 | 836 | ||||||
| 2026-02-13 | 13F | JustInvest LLC | 4.109 | 11,32 | 590 | 26,12 | ||||
| 2025-11-12 | 13F | Seeds Investor Llc | 0 | -100,00 | 0 | -100,00 | ||||
| 2026-02-17 | 13F | Lotus Technology Management, LP | 6.543 | 939 | ||||||
| 2026-04-13 | 13F | IFP Advisors, Inc | 299 | -2,92 | 43 | -4,55 | ||||
| 2026-02-12 | 13F | State Board Of Administration Of Florida Retirement System | 10.796 | 0,00 | 1.549 | 13,31 | ||||
| 2026-04-27 | 13F | Ethic Inc. | 2.449 | 1,96 | 350 | 1,45 | ||||
| 2026-02-17 | 13F | Shellback Capital, LP | 62.800 | 71,12 | 9.013 | 93,87 | ||||
| 2026-02-17 | 13F | Parallax Volatility Advisers, L.P. | Put | 633.800 | 13,79 | 90.963 | 28,91 | |||
| 2026-02-17 | 13F | Parallax Volatility Advisers, L.P. | 5.692 | 54,59 | 817 | 75,11 | ||||
| 2026-02-11 | 13F | Los Angeles Capital Management Llc | 19.892 | 0,00 | 2.150 | -14,65 | ||||
| 2025-11-13 | 13F | Fuller & Thaler Asset Management, Inc. | 0 | -100,00 | 0 | -100,00 | ||||
| 2026-04-28 | 13F | PFA Pension, Forsikringsaktieselskab | 19.758 | 2.821 | ||||||
| 2026-02-12 | 13F | Steward Partners Investment Advisory, Llc | 11 | 2 | ||||||
| 2026-02-11 | 13F | LPL Financial LLC | 14.078 | -8,10 | 2.020 | 4,12 | ||||
| 2026-05-01 | 13F | Arizona State Retirement System | 12.213 | 0,10 | 1.744 | -0,46 | ||||
| 2026-02-17 | 13F | SageView Advisory Group, LLC | 43 | 6 | ||||||
| 2026-02-09 | 13F | Coldstream Capital Management Inc | 3.903 | -3,84 | 560 | 8,95 | ||||
| 2026-01-23 | 13F | Gibbs Wealth Management | 4.636 | 742 | ||||||
| 2026-04-21 | 13F | PharVision Advisers, LLC | 0 | -100,00 | 0 | |||||
| 2026-01-30 | 13F | Turning Point Benefit Group, Inc. | 1 | 0,00 | 0 | |||||
| 2026-02-17 | 13F | Mercer Global Advisors Inc /adv | 12.880 | 51,39 | 1.849 | 71,59 | ||||
| 2026-02-11 | 13F | Twin Tree Management, LP | Put | 0 | -100,00 | 0 | -100,00 | |||
| 2026-02-04 | 13F | BCJ Capital Management, LLC | 0 | -100,00 | 0 | -100,00 | ||||
| 2026-04-08 | 13F | NorthCrest Asset Manangement, LLC | 11.910 | -0,47 | 1.723 | -3,64 | ||||
| 2025-11-14 | 13F | Williamson Legacy Group, LLC | 0 | -100,00 | 0 | -100,00 | ||||
| 2025-11-14 | 13F | Sandler Capital Management | 0 | -100,00 | 0 | -100,00 | ||||
| 2026-04-20 | 13F | City State Bank | 41 | 0,00 | 6 | 0,00 | ||||
| 2026-02-02 | 13F | Principal Financial Group Inc | 279.029 | 7,99 | 40.046 | 22,35 | ||||
| 2025-11-14 | 13F | Candlestick Capital Management LP | 0 | -100,00 | 0 | |||||
| 2026-04-28 | 13F | Whittier Trust Co | 289 | 0,00 | 43 | -4,44 | ||||
| 2026-02-13 | 13F | Colony Group, LLC | 2.679 | 385 | ||||||
| 2026-02-17 | 13F | Tudor Investment Corp Et Al | Call | 28.400 | -71,11 | 4.076 | -67,27 | |||
| 2026-04-14 | 13F | Banque Pictet & Cie Sa | 0 | -100,00 | 0 | |||||
| 2026-02-03 | 13F | Mitsubishi UFJ Kokusai Asset Management Co., Ltd. | 210 | 0,00 | 32 | 19,23 | ||||
| 2026-02-17 | 13F | Tudor Investment Corp Et Al | Put | 22.800 | -58,55 | 3.272 | -53,04 | |||
| 2025-11-17 | 13F | Alyeska Investment Group, L.P. | 0 | -100,00 | 0 | -100,00 | ||||
| 2026-02-12 | 13F | Mark Sheptoff Financial Planning, Llc | 0 | -100,00 | 0 | |||||
| 2026-04-15 | 13F | Merit Financial Group, LLC | 6.341 | 17,34 | 905 | 16,77 | ||||
| 2026-02-12 | 13F | Marex Group plc | 0 | -100,00 | 0 | |||||
| 2026-02-13 | 13F | Corient IA LLC | 1.500 | 215 | ||||||
| 2026-02-17 | 13F | Price T Rowe Associates Inc /md/ | 220.895 | 0,68 | 32 | 14,81 | ||||
| 2026-01-23 | 13F | Rsm Us Wealth Management Llc | 2.101 | -21,92 | 300 | -12,06 | ||||
| 2025-11-03 | 13F | Ballentine Partners, LLC | 0 | -100,00 | 0 | -100,00 | ||||
| 2026-02-17 | 13F | Eddie Patel Inc | 4.495 | 645 | ||||||
| 2025-11-04 | 13F | Penserra Capital Management LLC | 0 | -100,00 | 0 | |||||
| 2026-02-12 | 13F | Logan Capital Management Inc | 3.833 | -31,07 | 550 | -21,87 | ||||
| 2026-02-10 | 13F | Natixis Advisors, L.p. | 10.634 | 2 | ||||||
| 2026-02-09 | 13F | King Luther Capital Management Corp | 14.924 | 0,00 | 2.142 | 13,28 | ||||
| 2026-02-10 | 13F | Goldman Sachs Group Inc | 388.992 | -49,91 | 55.828 | -43,25 | ||||
| 2026-02-17 | 13F | Gotham Asset Management, LLC | 17.421 | -67,75 | 2.500 | -63,47 | ||||
| 2026-02-13 | 13F | Verition Fund Management LLC | 103.000 | 1,88 | 14.783 | 15,42 | ||||
| 2025-11-14 | 13F | Boothbay Fund Management, Llc | Put | 0 | -100,00 | 0 | -100,00 | |||
| 2026-02-17 | 13F | Summit Global Investments | 1.948 | 2,20 | 0 | |||||
| 2026-02-17 | 13F | Kemnay Advisory Services Inc. | 130 | 19 | ||||||
| 2026-02-04 | 13F | MADDEN SECURITIES Corp | 2.000 | 0,00 | 287 | 13,44 | ||||
| 2026-02-11 | 13F | Erste Asset Management GmbH | 0 | 0 | ||||||
| 2026-02-12 | 13F | denkapparat Operations GmbH | 3.082 | 0,00 | 442 | 13,33 | ||||
| 2026-02-13 | 13F | Public Sector Pension Investment Board | 0 | -100,00 | 0 | |||||
| 2026-02-12 | 13F | Advisory Resource Group | 1.670 | 0,00 | 240 | 13,27 | ||||
| 2026-02-17 | 13F | Public Employees Retirement System Of Ohio | 203 | -83,73 | 29 | -81,65 | ||||
| 2026-02-13 | 13F | Fieldview Capital Management, LLC | 6.210 | 72,36 | 891 | 95,39 | ||||
| 2026-05-01 | 13F | Thrivent Financial For Lutherans | 29.069 | -7,61 | 4 | 0,00 | ||||
| 2026-02-13 | 13F | Hudson Bay Capital Management LP | 96.520 | 15.986,67 | 13.853 | 18.126,32 | ||||
| 2026-02-13 | 13F | Manufacturers Life Insurance Company, The | 21.169 | -6,64 | 3.038 | 5,78 | ||||
| 2026-04-24 | 13F | ProShare Advisors LLC | 6.755 | -21,60 | 964 | -22,01 | ||||
| 2026-02-17 | 13F | Aqr Capital Management Llc | 305.135 | 119,96 | 43.793 | 149,20 | ||||
| 2026-04-15 | 13F | Journey Strategic Wealth Llc | 1.433 | -0,83 | 205 | -1,45 | ||||
| 2025-11-12 | 13F | Cresset Asset Management, LLC | 0 | -100,00 | 0 | -100,00 | ||||
| 2026-04-15 | 13F | Exchange Traded Concepts, Llc | 17.082 | 1.558,45 | 2.439 | 1.558,50 | ||||
| 2026-02-17 | 13F | Voloridge Investment Management, Llc | 0 | -100,00 | 0 | -100,00 | ||||
| 2026-02-13 | 13F | Divisadero Street Capital Management, LP | Call | 0 | -100,00 | 0 | -100,00 | |||
| 2026-02-13 | 13F | Panagora Asset Management Inc | 52.413 | -53,79 | 7.522 | -47,64 | ||||
| 2026-02-17 | 13F | Samlyn Capital, Llc | 0 | -100,00 | 0 | |||||
| 2026-04-30 | 13F | Teacher Retirement System Of Texas | 3.771 | -74,15 | 538 | -74,30 | ||||
| 2026-04-16 | 13F | SG Americas Securities, LLC | 3.086 | -33,03 | 0 | |||||
| 2026-02-13 | 13F | Barclays Plc | Put | 277.400 | 177,40 | 39.812 | 214,27 | |||
| 2026-04-21 | 13F | Gilpin Wealth Management, Llc | 6 | 50,00 | 1 | |||||
| 2026-02-12 | 13F | Brown Brothers Harriman & Co | 29 | 4 | ||||||
| 2026-02-13 | 13F | Barclays Plc | Call | 148.400 | 21.298 | |||||
| 2026-01-26 | 13F | Mirae Asset Global Investments Co., Ltd. | 0 | -100,00 | 0 | -100,00 | ||||
| 2026-02-11 | 13F | Empowered Funds, LLC | 58.637 | 422,24 | 8.416 | 491,77 | ||||
| 2026-02-13 | 13F | Barclays Plc | 104.012 | -58,79 | 14.928 | -53,32 | ||||
| 2026-02-10 | 13F | Florida Financial Advisors, Llc | 0 | -100,00 | 0 | |||||
| 2025-12-15 | 13F/A | Hudson Bay Capital Management LP | Put | 0 | -100,00 | 0 | -100,00 | |||
| 2025-11-14 | 13F | Maxi Investments CY Ltd | 0 | -100,00 | 0 | |||||
| 2026-02-18 | 13F | Mackenzie Financial Corp | 6.258 | 111,85 | 892 | 138,24 | ||||
| 2026-01-26 | 13F | Cwm, Llc | 16.533 | 521,31 | 2 | |||||
| 2026-02-13 | 13F | Truvestments Capital Llc | 7.540 | 12,14 | 1.082 | 27,14 | ||||
| 2026-04-28 | 13F | AdvisorShares Investments LLC | 1.206 | -16,19 | 172 | -16,50 | ||||
| 2026-02-06 | 13F | Pinnbrook Capital Management Lp | Call | 0 | -100,00 | 0 | -100,00 | |||
| 2026-02-18 | 13F | GWM Advisors LLC | 98 | -14,78 | 14 | 0,00 | ||||
| 2026-04-15 | 13F | Financial Management Professionals, Inc. | 155 | 22 | ||||||
| 2026-02-12 | 13F | Principal Securities, Inc. | 0 | -100,00 | 0 | |||||
| 2026-02-11 | 13F | Deutsche Bank Ag\ | 58.315 | 33,54 | 8.369 | 51,31 | ||||
| 2026-04-15 | 13F | Radnor Capital Management, LLC | 2.310 | 0,00 | 330 | -0,60 | ||||
| 2026-02-13 | 13F | Ubs Asset Management Americas Inc | 96.573 | -1,70 | 13.860 | 11,37 | ||||
| 2026-03-12 | 13F/A | Peak6 Llc | Put | 13.800 | -60,23 | 1.981 | -54,95 | |||
| 2026-02-11 | 13F | Parallel Advisors, LLC | 178 | -5,32 | 26 | 8,70 | ||||
| 2026-03-12 | 13F/A | Peak6 Llc | Call | 112.600 | 119,07 | 16.160 | 148,20 | |||
| 2025-11-07 | 13F | Shell Asset Management Co | 1.948 | -61,55 | 0 | |||||
| 2026-01-27 | 13F | Zurcher Kantonalbank (Zurich Cantonalbank) | 15.036 | 5,48 | 2.158 | 19,50 | ||||
| 2026-02-09 | 13F | Quest Partners LLC | 576 | -84,04 | 83 | -82,06 | ||||
| 2026-02-09 | 13F | Blue Bell Private Wealth Management, Llc | 149 | 0,00 | 21 | 16,67 | ||||
| 2026-04-28 | 13F | Stratos Wealth Partners, LTD. | 16.567 | -10,21 | 2.365 | -10,65 | ||||
| 2026-02-09 | 13F | Kazazian Asset Management, LLC | 9.061 | 0,00 | 1.300 | 13,34 | ||||
| 2025-11-14 | 13F | EAM Investors, LLC | 0 | -100,00 | 0 | -100,00 | ||||
| 2026-02-17 | 13F | Susquehanna International Group, Llp | Put | 113.900 | -65,25 | 16.347 | -60,64 | |||
| 2026-02-13 | 13F | C M Bidwell & Associates Ltd | 0 | -100,00 | 0 | -100,00 | ||||
| 2026-02-17 | 13F | Susquehanna International Group, Llp | Call | 252.100 | -24,02 | 36.181 | -13,92 | |||
| 2026-02-13 | 13F | Mml Investors Services, Llc | 7.938 | -33,24 | 1.139 | -24,37 | ||||
| 2026-02-17 | 13F | Susquehanna International Group, Llp | 3.232 | -97,19 | 464 | -96,83 | ||||
| 2026-01-29 | 13F | Concurrent Investment Advisors, LLC | 5.128 | 103,73 | 736 | 131,13 | ||||
| 2026-02-09 | 13F | Keating Financial Advisory Services, Inc. | 19 | 3 | ||||||
| 2026-02-13 | 13F | Arrowstreet Capital, Limited Partnership | 1.160.920 | -16,70 | 166.615 | -5,62 | ||||
| 2026-02-13 | 13F | Citigroup Inc | Put | 70.000 | 0,00 | 10.046 | 13,30 | |||
| 2025-11-05 | 13F | Concord Wealth Partners | 0 | -100,00 | 0 | |||||
| 2026-02-13 | 13F | Citigroup Inc | 96.812 | 144,92 | 13.894 | 177,49 | ||||
| 2026-02-17 | 13F | Soros Capital Management Llc | 2.027 | 291 | ||||||
| 2026-02-12 | 13F | MetLife Investment Management, LLC | 24.279 | -6,47 | 3.485 | 5,96 | ||||
| 2026-02-11 | 13F | Illinois Municipal Retirement Fund | 63.543 | 25,26 | 9.120 | 41,91 | ||||
| 2026-02-17 | 13F | Twinbeech Capital Lp | 0 | -100,00 | 0 | |||||
| 2026-01-26 | 13F | Moran Wealth Management, LLC | 0 | -100,00 | 0 | |||||
| 2026-02-13 | 13F | Mariner, LLC | 14.557 | 131,47 | 2.089 | 162,31 | ||||
| 2026-02-13 | 13F | Pinnacle Wealth Planning Services, Inc. | 702 | 101 | ||||||
| 2026-02-06 | 13F | Gsa Capital Partners Llp | 0 | -100,00 | 0 | |||||
| 2026-02-17 | 13F | Freestone Grove Partners LP | 0 | -100,00 | 0 | |||||
| 2026-02-26 | 13F | TD Capital Management LLC | 4 | 1 | ||||||
| 2026-02-06 | 13F | Larson Financial Group LLC | 138 | 4.500,00 | 20 | |||||
| 2026-04-29 | 13F | Swedbank AB | 27.000 | 3.855 | ||||||
| 2026-01-30 | 13F | Archer Investment Corp | 930 | 0,00 | 133 | 13,68 | ||||
| 2026-02-17 | 13F | Scientech Research LLC | 0 | -100,00 | 0 | -100,00 | ||||
| 2026-04-30 | 13F | Cambridge Investment Research Advisors, Inc. | 8.930 | -6,54 | 1 | 0,00 | ||||
| 2026-02-09 | 13F | Jefferies Financial Group Inc. | 20.600 | 379,07 | 2.957 | 443,38 | ||||
| 2026-02-12 | 13F | Colonial Trust Co / SC | 19 | 0,00 | 3 | 0,00 | ||||
| 2026-01-29 | 13F | IMC-Chicago, LLC | 0 | -100,00 | 0 | -100,00 | ||||
| 2026-02-13 | 13F | Caitong International Asset Management Co., Ltd | 0 | -100,00 | 0 | |||||
| 2026-02-17 | 13F | Maryland State Retirement & Pension System | 6.511 | 1,89 | 934 | 15,45 | ||||
| 2026-04-13 | 13F | Whalen Wealth Management Inc. | 3.112 | 444 | ||||||
| 2026-02-12 | 13F | Bank Of Montreal /can/ | 4.076 | -17,27 | 585 | -6,41 | ||||
| 2026-02-11 | 13F | Winton Capital Group Ltd | 0 | -100,00 | 0 | -100,00 | ||||
| 2026-02-17 | 13F | Optiver Holding B.V. | 38 | -75,80 | 5 | -73,68 | ||||
| 2026-04-01 | 13F | Burkett Financial Services, Llc | 51 | 0,00 | 7 | 0,00 | ||||
| 2025-11-12 | 13F | NewSquare Capital LLC | 0 | -100,00 | 0 | -100,00 | ||||
| 2026-02-09 | 13F | Legal & General Group Plc | 115.788 | -11,12 | 16.618 | 0,69 | ||||
| 2026-02-10 | 13F | Smith Group Asset Management, LLC | 20.127 | 0,77 | 2.889 | 14,15 | ||||
| 2026-02-17 | 13F | Raymond James Financial Inc | 46.752 | -48,43 | 6.710 | -41,57 | ||||
| 2026-01-29 | 13F | Dunhill Financial, LLC | 1 | 0 | ||||||
| 2026-02-13 | 13F | Dynamic Technology Lab Private Ltd | 4.377 | -89,53 | 628 | -88,15 | ||||
| 2025-11-14 | 13F | Cubist Systematic Strategies, LLC | Put | 18.000 | -61,70 | 2.280 | -73,10 | |||
| 2026-02-17 | 13F | Jump Financial, LLC | 0 | -100,00 | 0 | |||||
| 2026-01-23 | 13F | Optima Capital Llc | 9 | 1 | ||||||
| 2025-11-14 | 13F | Cubist Systematic Strategies, LLC | Call | 29.000 | -47,46 | 3.674 | -63,10 | |||
| 2025-11-14 | 13F | Cubist Systematic Strategies, LLC | 371.270 | 180,23 | 47.033 | 96,86 | ||||
| 2026-02-06 | 13F | HighTower Advisors, LLC | 2.485 | -0,16 | 357 | 13,02 | ||||
| 2026-04-17 | 13F | Vermillion Wealth Management, Inc. | 3 | 0 | ||||||
| 2026-02-11 | 13F | Franklin Resources Inc | 43.294 | -76,47 | 6.214 | -73,35 | ||||
| 2026-02-13 | 13F | Stifel Financial Corp | 35.959 | 150,71 | 5.161 | 184,14 | ||||
| 2026-02-13 | 13F | Neuberger Berman Group LLC | 6.051 | 1,80 | 868 | 15,43 | ||||
| 2026-02-17 | 13F | Glenmede Trust Co Na | 1.612 | 0,88 | 231 | -2,94 | ||||
| 2026-04-15 | 13F | Fortitude Family Office, LLC | 21 | 162,50 | 3 | 100,00 | ||||
| 2026-02-12 | 13F | Aviva Plc | 4.123 | 2,79 | 592 | 16,34 | ||||
| 2026-02-17 | 13F | Game Creek Capital, LP | 13.000 | 1.866 | ||||||
| 2026-02-17 | 13F | Prelude Capital Management, Llc | 8.268 | -8,39 | 1.187 | 3,76 | ||||
| 2026-02-13 | 13F | Toroso Investments, LLC | 5.224 | -34,38 | 750 | -25,69 | ||||
| 2025-11-14 | 13F | Two Sigma Securities, Llc | 0 | -100,00 | 0 | -100,00 | ||||
| 2026-05-01 | 13F | Hantz Financial Services, Inc. | 542 | 87,54 | 0 | |||||
| 2026-02-12 | 13F | Adviser Investments LLC | 1.500 | 215 | ||||||
| 2026-02-10 | 13F | Norges Bank | 582.520 | 83.603 | ||||||
| 2026-02-12 | 13F | Jane Street Group, Llc | Put | 355.700 | 6,56 | 51.050 | 20,73 | |||
| 2026-02-12 | 13F | Quadrant Capital Group Llc | 7.740 | -2,32 | 1.111 | 10,67 | ||||
| 2026-02-12 | 13F | Jane Street Group, Llc | 2.142 | -99,53 | 307 | -99,47 | ||||
| 2026-02-17 | 13F | Alphadyne Asset Management, LLC | Put | 1.500 | 215 | |||||
| 2026-02-12 | 13F | Jane Street Group, Llc | Call | 129.100 | 17,47 | 18.528 | 33,08 | |||
| 2026-04-24 | 13F | Strs Ohio | 4.000 | -6,98 | 571 | -7,46 | ||||
| 2026-02-12 | 13F | Callan Family Office, LLC | 13.351 | 1,58 | 1.916 | 15,14 | ||||
| 2025-12-16 | 13F | Garde Capital, Inc. | 0 | -100,00 | 0 | |||||
| 2026-04-28 | 13F | Flagship Harbor Advisors, Llc | 0 | -100,00 | 0 | |||||
| 2026-02-10 | 13F | Baker Avenue Asset Management, LP | 8.747 | -4,06 | 1.255 | 8,75 | ||||
| 2026-01-29 | 13F | Comerica Bank | 23.940 | -62,75 | 3.436 | -57,81 | ||||
| 2026-02-13 | 13F | Aigen Investment Management, Lp | 0 | -100,00 | 0 | -100,00 | ||||
| 2026-02-17 | 13F | Polar Asset Management Partners Inc. | 7.000 | 1.005 | ||||||
| 2026-02-17 | 13F | Guggenheim Capital Llc | 6.210 | 251,44 | 891 | 299,55 | ||||
| 2026-02-17 | 13F | Fwl Investment Management, Llc | 0 | -100,00 | 0 | |||||
| 2026-04-23 | 13F | Simmons Bank | 3.375 | 0,00 | 482 | -0,62 | ||||
| 2025-11-14 | 13F | Scotia Capital Inc. | 0 | -100,00 | 0 | -100,00 | ||||
| 2026-04-16 | 13F | Diversified Trust Co | 4.392 | 57,82 | 627 | 57,14 | ||||
| 2026-02-11 | 13F | Ameritas Investment Partners, Inc. | 3.670 | -0,84 | 527 | 12,39 | ||||
| 2026-05-01 | 13F | Commonwealth Of Pennsylvania Public School Empls Retrmt Sys | 10.770 | -2,09 | 1.538 | -2,60 | ||||
| 2026-02-12 | 13F | Hrt Financial Lp | 0 | -100,00 | 0 | |||||
| 2026-04-22 | 13F | Sterling Capital Management LLC | 281 | -2,77 | 40 | -2,44 | ||||
| 2025-11-14 | 13F | Bridgeway Capital Management Inc | 0 | -100,00 | 0 | -100,00 | ||||
| 2026-02-13 | 13F | Jacobs Levy Equity Management, Inc | 5.554 | -85,44 | 797 | -83,50 | ||||
| 2026-02-09 | 13F | Huntington National Bank | 63 | -5,97 | 9 | 12,50 | ||||
| 2026-01-26 | 13F | Reyes Financial Architecture, Inc. | 507 | 0,00 | 73 | 12,50 | ||||
| 2026-02-06 | 13F | Covestor Ltd | 134 | 6,35 | 0 | |||||
| 2026-04-30 | 13F | BRYN MAWR TRUST Co | 113 | 16 | ||||||
| 2026-02-09 | 13F | 44 Wealth Management Llc | 9.505 | -1,32 | 1.364 | 11,80 | ||||
| 2026-02-12 | 13F | Ensign Peak Advisors, Inc | 10.982 | -47,22 | 1.576 | -40,19 | ||||
| 2026-02-17 | 13F | Alphadyne Asset Management, LLC | 167 | 24 | ||||||
| 2026-04-28 | 13F | Integrated Advisors Network LLC | 7.550 | 357,30 | 1.078 | 356,36 | ||||
| 2026-02-17 | 13F | Magnetar Financial LLC | 0 | -100,00 | 0 | -100,00 | ||||
| 2025-11-06 | 13F | Oppenheimer & Co Inc | 0 | -100,00 | 0 | |||||
| 2026-02-12 | 13F | Systematic Alpha Investments, LLC | 0 | -100,00 | 0 | |||||
| 2026-02-11 | 13F | Group One Trading, L.p. | Call | 104.800 | -25,94 | 15.041 | -16,09 | |||
| 2026-02-13 | 13F | MAI Capital Management | 163 | 503,70 | 23 | 666,67 | ||||
| 2026-02-11 | 13F | Group One Trading, L.p. | Put | 41.700 | 487,32 | 5.985 | 565,63 | |||
| 2026-02-05 | 13F | AMJ Financial Wealth Management | Put | 0 | -100,00 | 0 | -100,00 | |||
| 2026-02-11 | 13F | Westfield Capital Management Co Lp | 0 | -100,00 | 0 | -100,00 | ||||
| 2026-02-09 | 13F | Harbour Investments, Inc. | 2.088 | -16,81 | 300 | -5,68 | ||||
| 2026-04-20 | 13F | Louisiana State Employees Retirement System | 19.300 | -5,39 | 2.755 | -5,88 | ||||
| 2026-02-10 | 13F | Savant Capital, LLC | 0 | -100,00 | 0 | -100,00 | ||||
| 2026-04-23 | 13F | SJS Investment Consulting Inc. | 22 | 4,76 | 3 | 0,00 | ||||
| 2026-02-03 | 13F | Stevens Capital Management Lp | 0 | -100,00 | 0 | |||||
| 2026-02-17 | 13F | Discovery Capital Management, Llc / Ct | 250.111 | 32,12 | 35.896 | 49,68 | ||||
| 2026-02-13 | 13F | Macquarie Group Ltd | 0 | -100,00 | 0 | -100,00 | ||||
| 2026-01-29 | 13F | J. Team Financial, Inc. | 0 | -100,00 | 0 | -100,00 | ||||
| 2026-04-30 | 13F | Nisa Investment Advisors, Llc | 8.319 | -26,12 | 1.188 | -26,55 | ||||
| 2026-02-13 | 13F | Public Employees Retirement Association Of Colorado | 4.615 | 0,00 | 1 | |||||
| 2026-02-05 | 13F | ANTIPODES PARTNERS Ltd | 586.808 | 47,90 | 84.225 | 67,56 | ||||
| 2026-02-13 | 13F | Rhumbline Advisers | 117.996 | -5,76 | 16.935 | 6,77 | ||||
| 2026-02-12 | 13F | Alps Advisors Inc | 2.996 | 1,11 | 430 | 14,40 | ||||
| 2026-02-17 | 13F | Bank Of America Corp /de/ | 176.265 | -54,17 | 25.298 | -48,07 | ||||
| 2025-11-14 | 13F | Peak6 Llc | 0 | -100,00 | 0 | -100,00 | ||||
| 2026-01-22 | 13F | Vision Financial Markets Llc | 0 | -100,00 | 0 | -100,00 | ||||
| 2026-04-28 | 13F | Steigerwald, Gordon & Koch Inc. | 0 | -100,00 | 0 | |||||
| 2026-02-12 | 13F | Voya Investment Management Llc | 240.600 | 1.634,18 | 34.531 | 1.865,34 | ||||
| 2026-02-17 | 13F | Advisor Group Holdings, Inc. | 71.079 | 177,97 | 10.201 | 158,38 | ||||
| 2026-02-09 | 13F | New Age Alpha Advisors, LLC | 2.047 | 4,81 | 294 | 18,62 | ||||
| 2026-02-18 | 13F | State of Tennessee, Treasury Department | 20.204 | -12,70 | 3.187 | 8,70 | ||||
| 2026-02-13 | 13F | BNP Paribas Asset Management Holding S.A. | 32.035 | 6.849,02 | 5 | |||||
| 2026-01-20 | 13F | Savvy Advisors, Inc. | 2.076 | 1,27 | 298 | 14,67 | ||||
| 2026-01-27 | 13F | Evergreen Capital Management Llc | 3.989 | -2,64 | 573 | 10,21 | ||||
| 2026-02-17 | 13F | Canada Pension Plan Investment Board | 113.803 | 8,90 | 16.333 | 23,38 | ||||
| 2026-04-15 | 13F | Norden Group Llc | 1.777 | -0,45 | 254 | -1,17 | ||||
| 2026-02-09 | 13F | Fisher Asset Management, LLC | 221.178 | -8,65 | 31.743 | 3,50 | ||||
| 2026-04-08 | 13F | Wealth Enhancement Advisory Services, Llc | 21.282 | 97,04 | 1.356 | -23,00 | ||||
| 2026-04-27 | 13F | Y-Intercept (Hong Kong) Ltd | 27.525 | 857,39 | 3.930 | 853,64 | ||||
| 2026-02-12 | 13F | Great Lakes Advisors, Llc | 1.457 | -13,01 | 209 | -1,42 | ||||
| 2026-02-17 | 13F | Night Squared LP | 46.298 | 6.645 | ||||||
| 2026-04-29 | 13F | Hughes Financial Services, LLC | 49 | 6,52 | 7 | 0,00 | ||||
| 2026-02-12 | 13F | DRW Securities, LLC | 0 | -100,00 | 0 | -100,00 | ||||
| 2026-02-17 | 13F | Lighthouse Investment Partners, LLC | 13.220 | 1.897 | ||||||
| 2026-04-13 | 13F | Wedge Capital Management L L P/nc | 35.766 | 25,32 | 5.106 | 24,69 | ||||
| 2026-02-17 | 13F | Man Group plc | 53.334 | -89,21 | 7.654 | -87,77 | ||||
| 2026-02-10 | 13F | Connor, Clark & Lunn Investment Management Ltd. | 0 | -100,00 | 0 | |||||
| 2026-02-17 | 13F | Hancock Whitney Corp | 1.457 | -10,72 | 209 | 1,46 | ||||
| 2026-02-10 | 13F | Mitchell Capital Management Co | 21.015 | 3.016 | ||||||
| 2025-11-12 | 13F | Cobblestone Capital Advisors Llc /ny/ | 1.700 | 0,00 | 215 | -29,74 | ||||
| 2026-02-17 | 13F | Amundi | 14.729 | -57,76 | 2.114 | -52,10 | ||||
| 2026-02-13 | 13F | Walleye Capital LLC | Call | 500 | -73,68 | 72 | -70,42 | |||
| 2026-02-13 | 13F | Walleye Capital LLC | Put | 100 | -99,11 | 14 | -99,01 | |||
| 2026-02-13 | 13F | Walleye Capital LLC | 49.407 | 50,26 | 7.091 | 70,23 | ||||
| 2026-04-23 | 13F | Farmers & Merchants Investments Inc | 425 | -0,47 | 61 | -1,64 | ||||
| 2026-01-26 | 13F | KBC Group NV | 1.222 | 0,00 | 0 | |||||
| 2026-02-17 | 13F | Ameriprise Financial Inc | 477.798 | 23,92 | 68.574 | 40,39 | ||||
| 2026-02-17 | 13F | Broad Bay Capital Management, LP | 175.000 | 25.116 |