Grundlæggende statistik
| Institutionelle ejere | 145 total, 145 long only, 0 short only, 0 long/short - change of 4,23% MRQ |
| Gennemsnitlig porteføljeallokering | 0.7275 % - change of -36,98% MRQ |
| Institutionelle aktier (lange) | 25.379.142 (ex 13D/G) - change of -1,05MM shares -3,96% MRQ |
| Institutionel værdi (lang) | $ 1.468.551 USD ($1000) |
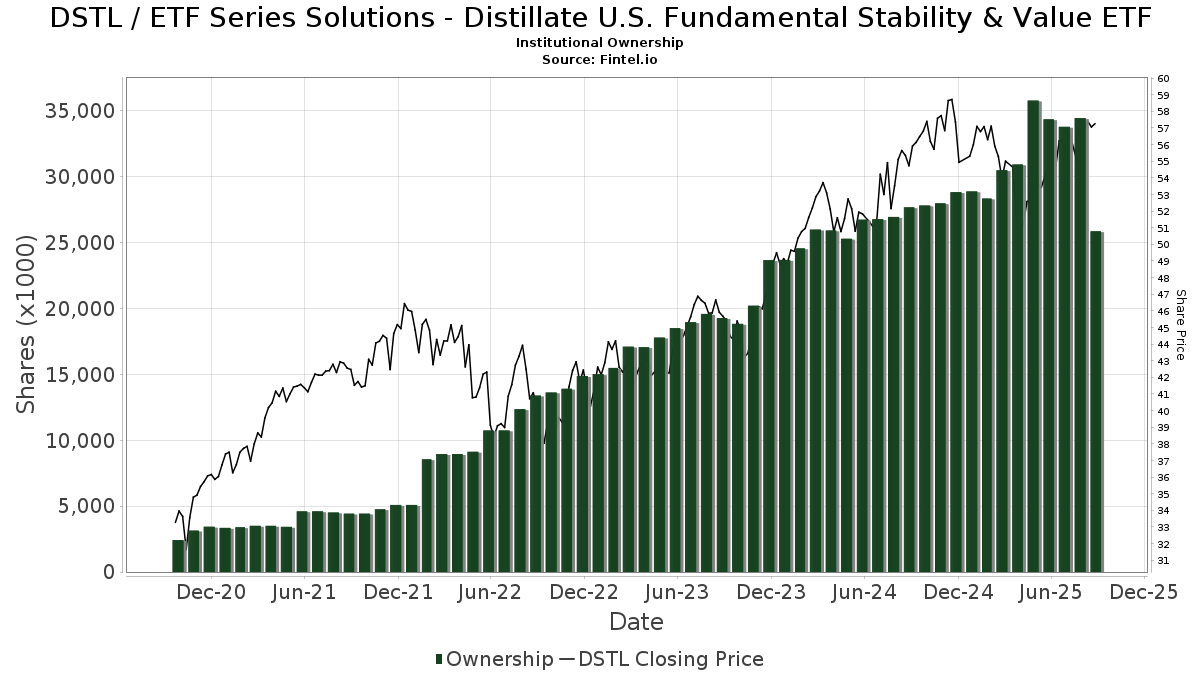
Institutionelt ejerskab og aktionærer
ETF Series Solutions - Distillate U.S. Fundamental Stability & Value ETF (US:DSTL) har 145 institutionelle ejere og aktionærer, der har indsendt 13D/G- eller 13F-formularer til Securities Exchange Commission (SEC). Disse institutioner har i alt 25,379,142 aktier. Største aktionærer omfatter Sequoia Financial Advisors, LLC, Wealth Enhancement Advisory Services, Llc, Oxford Financial Group Ltd, Abacus Planning Group, Inc., Resonant Capital Advisors, LLC, Madison Asset Management, LLC, Cetera Investment Advisers, AlphaCore Capital LLC, Raymond James Financial Inc, and Green Square Capital Advisors Llc .
ETF Series Solutions - Distillate U.S. Fundamental Stability & Value ETF (ARCA:DSTL) institutionel ejerskabsstruktur viser aktuelle positioner i virksomheden efter institutioner og fonde, samt seneste ændringer i positionsstørrelse. Større aktionærer kan omfatte individuelle investorer, investeringsforeninger, hedgefonde eller institutioner. Skema 13D angiver, at investoren besidder (eller besidder) mere end 5 % af virksomheden og har til hensigt (eller har til hensigt at) aktivt at forfølge en ændring i forretningsstrategi. Skema 13G indikerer en passiv investering på over 5%.
The share price as of March 18, 2026 is 58,17 / share. Previously, on March 19, 2025, the share price was 55,00 / share. This represents an increase of 5,76% over that period.
Fondens stemningsscore
Fund Sentiment Score (fka Ownership Accumulation Score) finder de aktier, der bliver mest købt af fonde. Det er resultatet af en sofistikeret, multi-faktor kvantitativ model, der identificerer virksomheder med de højeste niveauer af institutionel akkumulering. Scoringsmodellen bruger en kombination af den samlede stigning i oplyste ejere, ændringerne i porteføljeallokeringer i disse ejere og andre målinger. Tallet går fra 0 til 100, hvor højere tal indikerer et højere niveau af akkumulering for sine jævnaldrende, og 50 er gennemsnittet.
Opdateringsfrekvens: Dagligt
Se Ownership Explorer, som giver en liste over højest rangerende virksomheder.
AI+ Ask Fintel’s AI assistant about ETF Series Solutions - Distillate U.S. Fundamental Stability & Value ETF.
Select a question to share a public post with an AI-crafted answer.
Thinking of good questions…
Institutionel Put/Call-forhold
Ud over at indberette standardaktie- og gældsudstedelser skal institutter med mere end 100 mill. aktiver under forvaltning også oplyse deres put- og call-optionsbeholdninger. Da salgsoptioner generelt indikerer negativ stemning, og købsoptioner indikerer positiv stemning, kan vi få en fornemmelse af den overordnede institutionelle stemning ved at plotte forholdet mellem put og kald. Diagrammet til højre viser det historiske put/call-forhold for dette instrument.
Brug af Put/Call Ratio som en indikator for investorernes stemning overvinder en af de vigtigste mangler ved at bruge totalt institutionelt ejerskab, som er, at en betydelig mængde af aktiver under forvaltning investeres passivt for at spore indekser. Passivt forvaltede fonde køber typisk ikke optioner, så indikatoren for put/call-forholdet følger mere nøje følelsen af aktivt forvaltede fonde.
13F og NPORT arkivering
Detaljer om 13F-arkivering er gratis. Detaljer om NP-ansøgninger kræver et premium-medlemskab. Grønne rækker angiver nye positioner. Røde rækker angiver lukkede positioner. Klik på linket ikon for at se den fulde transaktionshistorik.
Opgrader
for at låse premium-data op og eksportere til Excel ![]() .
.
| Fil dato | Kilde | Investor | Type | Gennemsnitlig pris (Øst) |
Aktier | Δ Aktier (%) |
Rapporteret Værdi ($1000) |
Δ Værdi (%) |
Port Alloc (%) |
|
|---|---|---|---|---|---|---|---|---|---|---|
| 2026-02-17 | 13F | GeoWealth Management, LLC | 3.472 | -39,91 | 205 | -38,92 | ||||
| 2026-02-12 | 13F | Quadrant Capital Group Llc | 453 | 0,00 | 27 | 0,00 | ||||
| 2026-01-29 | 13F | Resonant Capital Advisors, LLC | 1.045.286 | 2,91 | 61.567 | 4,58 | ||||
| 2026-01-15 | 13F | Brady Martz Wealth Solutions, LLC | 6.027 | 355 | ||||||
| 2026-01-26 | 13F | Opal Wealth Advisors, LLC | 3.513 | 207 | ||||||
| 2026-02-06 | 13F | IFP Advisors, Inc | 49.993 | 8,01 | 2.945 | 9,77 | ||||
| 2026-02-13 | 13F | Mariner, LLC | 18.834 | 3,25 | 1.109 | 4,92 | ||||
| 2026-02-17 | 13F | Equitable Holdings, Inc. | 76.739 | -26,33 | 4.520 | -25,14 | ||||
| 2026-02-11 | 13F | Insight Advisors, LLC/ PA | 3.433 | 202 | ||||||
| 2026-01-05 | 13F | GAMMA Investing LLC | 2 | 0 | ||||||
| 2026-01-14 | 13F | Spire Wealth Management | 415 | -74,62 | 24 | -74,47 | ||||
| 2026-01-26 | 13F | Cwm, Llc | 110 | -80,57 | 0 | |||||
| 2026-02-06 | 13F | Pnc Financial Services Group, Inc. | 626 | 0,00 | 37 | 0,00 | ||||
| 2026-02-12 | 13F | Hibernia Wealth Partners, LLC | 23.438 | 98,85 | 1.380 | 102,05 | ||||
| 2026-02-13 | 13F | MAI Capital Management | 927 | -11,29 | 55 | -10,00 | ||||
| 2026-02-17 | 13F | Two Sigma Investments, Lp | 48.000 | 2.827 | ||||||
| 2025-11-06 | 13F | Sage Advisory Services, Ltd.Co. | 0 | -100,00 | 0 | |||||
| 2026-02-04 | 13F | LRI Investments, LLC | 57.198 | 14,17 | 3.369 | 16,02 | ||||
| 2026-02-13 | 13F | Stifel Financial Corp | 12.174 | -8,20 | 717 | -6,77 | ||||
| 2026-01-27 | 13F | TFR Capital, LLC. | 28.783 | 0,38 | 1.695 | 2,05 | ||||
| 2026-01-08 | 13F | Fermata Advisors, LLC | 80.699 | 10,61 | 4.753 | 12,42 | ||||
| 2026-02-09 | 13F | Harbour Investments, Inc. | 29.028 | -15,57 | 1.710 | -14,21 | ||||
| 2026-02-06 | 13F | Global Retirement Partners, LLC | 685 | 40 | ||||||
| 2026-02-17 | 13F | Fmr Llc | 250 | -7,06 | 15 | -6,67 | ||||
| 2026-02-11 | 13F | Simplex Trading, Llc | 0 | -100,00 | 0 | |||||
| 2026-02-17 | 13F | Cetera Investment Advisers | 901.472 | -0,45 | 53.097 | 1,16 | ||||
| 2026-02-12 | 13F | Richard W. Paul & Associates, LLC | 150 | -99,58 | 9 | -99,62 | ||||
| 2025-11-07 | 13F | HighTower Advisors, LLC | 0 | -100,00 | 0 | |||||
| 2026-01-08 | 13F | Old Port Advisors | 120.841 | -3,29 | 7.118 | -1,73 | ||||
| 2026-01-15 | 13F | One + One Wealth Management, Llc | 10.377 | 611 | ||||||
| 2026-02-06 | 13F | EverSource Wealth Advisors, LLC | 0 | -100,00 | 0 | |||||
| 2026-01-12 | 13F | Arlington Financial Advisors, LLC | 510.658 | 3,95 | 30.078 | 5,64 | ||||
| 2026-01-08 | 13F | Hutchens & Kramer Investment Management Group, LLC | 12.745 | -1,89 | 751 | -0,27 | ||||
| 2025-11-12 | 13F | Per Stirling Capital Management, LLC. | 0 | -100,00 | 0 | |||||
| 2026-01-23 | 13F | Aspect Partners, LLC | 54.804 | 13,89 | 3.228 | 15,75 | ||||
| 2026-02-09 | 13F | Allen Capital Group, LLC | 550.849 | -1,08 | 32.445 | 0,52 | ||||
| 2026-02-09 | 13F | Barry Investment Advisors, LLC | 28.393 | 4,97 | 1.672 | 6,70 | ||||
| 2026-02-03 | 13F | Sequoia Financial Advisors, LLC | 5.752.460 | 0,14 | 338.820 | 1,76 | ||||
| 2026-02-05 | 13F | AlphaCore Capital LLC | 873.102 | -7,60 | 51.426 | -6,11 | ||||
| 2025-10-22 | 13F | Geneos Wealth Management Inc. | 0 | -100,00 | 0 | |||||
| 2026-01-29 | 13F | ODonnell Financial Services, LLC | 496.841 | 1,69 | 29.264 | 3,34 | ||||
| 2026-02-03 | 13F | Orion Capital Management LLC | 180.879 | 2,35 | 10.654 | 4,01 | ||||
| 2026-01-12 | 13F | Certified Advisory Corp | 6.794 | 0,00 | 400 | 1,78 | ||||
| 2026-02-17 | 13F | Qube Research & Technologies Ltd | 43.907 | 138,07 | 2.586 | 142,13 | ||||
| 2026-02-06 | 13F | Sierra Summit Advisors Llc | 13.723 | 808 | ||||||
| 2026-02-05 | 13F | Stonebridge Financial Planning Group, LLC | 67.338 | -1,24 | 3.966 | 0,35 | ||||
| 2026-02-13 | 13F | Sunbeam Capital Management, LLC | 169.136 | -6,44 | 9.962 | -4,92 | ||||
| 2026-01-08 | 13F | Wealth Enhancement Advisory Services, Llc | 2.530.366 | 5,29 | 151.581 | 8,71 | ||||
| 2026-02-17 | 13F | Glenmede Trust Co Na | 0 | -100,00 | 0 | |||||
| 2026-02-17 | 13F | Royal Bank Of Canada | 7.225 | -5,57 | 425 | -4,06 | ||||
| 2026-02-10 | 13F | Operose Advisors LLC | 681 | 0,00 | 40 | 2,56 | ||||
| 2026-01-21 | 13F | Clayton Financial Group LLC | 4.655 | 0,32 | 274 | 2,24 | ||||
| 2026-02-13 | 13F | Level Four Advisory Services, Llc | 293.793 | 2,93 | 17.304 | 4,61 | ||||
| 2026-02-10 | 13F | Goldman Sachs Group Inc | 0 | -100,00 | 0 | |||||
| 2026-03-04 | 13F | Rehmann Capital Advisory Group | 23.614 | -0,03 | 1.391 | 1,53 | ||||
| 2026-01-23 | 13F | Assetmark, Inc | 216 | 0,00 | 13 | 0,00 | ||||
| 2025-11-04 | 13F | Thrivent Financial For Lutherans | 0 | -100,00 | 0 | |||||
| 2026-02-17 | 13F | Imprint Wealth LLC | 65 | -43,97 | 4 | -50,00 | ||||
| 2026-02-17 | 13F | Two Sigma Securities, Llc | 0 | -100,00 | 0 | |||||
| 2026-01-14 | 13F | Global View Capital Management LLC | 9.194 | -8,78 | 542 | -7,36 | ||||
| 2026-01-21 | 13F | Modera Wealth Management, LLC | 3.432 | 202 | ||||||
| 2026-01-16 | 13F | Abacus Planning Group, Inc. | 1.419.594 | 2,63 | 83.614 | 4,29 | ||||
| 2025-10-22 | 13F | Oregon Pacific Wealth Management, LLC | 0 | -100,00 | 0 | |||||
| 2026-02-10 | 13F | Envestnet Asset Management Inc | 20.069 | -51,89 | 1.182 | -51,10 | ||||
| 2026-01-22 | 13F | Harwood Advisory Group, LLC | 83.862 | 16,14 | 4.940 | 18,02 | ||||
| 2026-01-27 | 13F | Wealth Enhancement Trust Services, Inc. | 37.737 | 2.223 | ||||||
| 2026-02-13 | 13F | Colony Group, LLC | 187.214 | -5,53 | 11.027 | -4,00 | ||||
| 2026-02-14 | 13F | Rockefeller Capital Management L.P. | 455.086 | 3,55 | 26.805 | 5,23 | ||||
| 2026-02-04 | 13F | Madison Asset Management, LLC | 943.332 | -13,47 | 55.562 | -12,06 | ||||
| 2026-02-05 | 13F | Sapient Capital Llc | 30.653 | 4,22 | 1.821 | 7,43 | ||||
| 2025-11-13 | 13F | Members Wealth Llc | 0 | -100,00 | 0 | |||||
| 2026-02-10 | 13F | Root Financial Partners, LLC | 0 | -100,00 | 0 | |||||
| 2026-02-11 | 13F | Buckingham Strategic Partners | 9.107 | 536 | ||||||
| 2026-02-17 | 13F | Quantinno Capital Management LP | 8.378 | 493 | ||||||
| 2025-11-18 | 13F | Apexium Financial, Lp | 247.578 | 4,82 | 14.350 | 9,77 | ||||
| 2026-01-06 | 13F | WealthCare Investment Partners, LLC | 9.980 | 0,32 | 588 | 1,73 | ||||
| 2025-11-12 | 13F | BlackRock, Inc. | 0 | -100,00 | 0 | |||||
| 2026-01-14 | 13F | Weil Company, Inc. | 68.794 | 30,67 | 4.052 | 32,78 | ||||
| 2026-01-23 | 13F | Meridian Financial, LLC | 7.000 | 1,45 | 412 | 3,26 | ||||
| 2026-02-13 | 13F | Gts Securities Llc | 0 | -100,00 | 0 | |||||
| 2026-02-17 | 13F | Advisor Group Holdings, Inc. | 76.821 | 9,92 | 4.526 | 12,59 | ||||
| 2026-01-29 | 13F | UBS Group AG | 5.913 | 15,94 | 348 | 17,97 | ||||
| 2026-02-05 | 13F | Allworth Financial LP | 0 | 0 | ||||||
| 2026-01-28 | 13F | Walleye Partners, LLC | 4.824 | 284 | ||||||
| 2026-01-27 | 13F | GHP Investment Advisors, Inc. | 60 | 0,00 | 4 | 0,00 | ||||
| 2026-02-11 | 13F | LPL Financial LLC | 577.130 | -28,38 | 33.993 | -27,22 | ||||
| 2026-02-17 | 13F | Jones Financial Companies Lllp | 1.859 | 109 | ||||||
| 2026-02-13 | 13F | Ausdal Financial Partners, Inc. | 16.897 | -47,33 | 995 | -46,48 | ||||
| 2025-09-19 | NP | MCNAX - Madison Conservative Allocation Fund Conservative Allocation Fund Class A | 25.466 | -26,59 | 1.396 | -23,42 | ||||
| 2026-02-09 | 13F | Huntington National Bank | 1.311 | 1,63 | ||||||
| 2026-02-04 | 13F | Oxbow Advisors, LLC | 158.927 | -27,30 | 9.361 | -26,12 | ||||
| 2026-02-10 | 13F | Meramec Financial Planners, LLC | 34.098 | 2.098 | ||||||
| 2026-02-17 | 13F | Hilltop Holdings Inc. | 31.683 | 3,28 | 1.866 | 4,95 | ||||
| 2026-01-13 | 13F | Team Financial Group, LLC | 1.777 | 73,20 | 105 | 76,27 | ||||
| 2026-01-09 | 13F | Diversified Trust Co | 4.028 | 0,00 | 237 | 1,72 | ||||
| 2026-02-13 | 13F | Pinnacle Wealth Planning Services, Inc. | 200 | 12 | ||||||
| 2026-02-17 | 13F | Bank Of America Corp /de/ | 8.968 | 3,19 | 528 | 4,97 | ||||
| 2026-01-08 | 13F | Adirondack Trust Co | 849 | 0,00 | 50 | 2,04 | ||||
| 2026-01-14 | 13F | Accurate Wealth Management, LLC | 9.694 | -11,43 | 584 | -7,15 | ||||
| 2026-02-04 | 13F | Ameritas Advisory Services, LLC | 0 | -100,00 | 0 | |||||
| 2026-02-06 | 13F | Axxcess Wealth Management, Llc | 83.514 | 4.919 | ||||||
| 2026-02-17 | 13F | United Capital Financial Advisers, Llc | 252.449 | 14.864 | ||||||
| 2026-02-17 | 13F | Citadel Advisors Llc | 0 | -100,00 | 0 | |||||
| 2025-11-13 | 13F | Tradition Wealth Management, LLC | 0 | -100,00 | 0 | |||||
| 2026-01-23 | 13F | SimpliFi, Inc. | 8.876 | -2,01 | 523 | -0,38 | ||||
| 2026-02-17 | 13F | Mercer Global Advisors Inc /adv | 4.053 | -6,25 | 239 | -4,80 | ||||
| 2026-02-06 | 13F | Quantify Chaos Advisors, Llc | 3.898 | 230 | ||||||
| 2026-02-12 | 13F | Empire Financial Management Company, LLC | 248.990 | -0,20 | 14.666 | 1,42 | ||||
| 2026-02-03 | 13F | Indivisible Partners | 287.395 | 16.928 | ||||||
| 2026-02-13 | 13F | Oxford Financial Group Ltd | 1.581.999 | -2,04 | 93.180 | -0,45 | ||||
| 2026-01-05 | 13F | Park Avenue Securities Llc | 105.046 | -34,70 | 6 | -33,33 | ||||
| 2026-02-11 | 13F | O'shaughnessy Asset Management, Llc | 4.229 | 4,42 | 249 | 6,41 | ||||
| 2026-02-17 | 13F | Perritt Capital Management Inc | 0 | -100,00 | 0 | |||||
| 2026-02-17 | 13F | Raymond James Financial Inc | 662.755 | 0,68 | 39.036 | 2,31 | ||||
| 2026-02-17 | 13F | Captrust Financial Advisors | 160.129 | -2,02 | 9.432 | -0,43 | ||||
| 2026-02-09 | 13F | Green Square Capital Advisors Llc | 583.307 | -3,77 | 34.357 | 2,40 | ||||
| 2026-02-17 | 13F | Gladstone Institutional Advisory LLC | 127.673 | 0,49 | 7.520 | 2,10 | ||||
| 2026-01-23 | 13F | Freestone Capital Holdings, LLC | 14.425 | 850 | ||||||
| 2026-02-13 | 13F | Saxon Interests, Inc. | 143.635 | 3.451,81 | 8.460 | 3.546,55 | ||||
| 2026-02-05 | 13F | Cambridge Investment Research Advisors, Inc. | 330.122 | 2,36 | 19 | 5,56 | ||||
| 2026-01-30 | 13F | BCU Wealth Advisors, LLC | 5.916 | 0,20 | 348 | 1,75 | ||||
| 2026-02-17 | 13F | Susquehanna International Group, Llp | 4.290 | 253 | ||||||
| 2025-11-14 | 13F | Hrt Financial Lp | 0 | -100,00 | 0 | |||||
| 2026-02-17 | 13F/A | Sentinus, LLC | 149.406 | 8.800 | ||||||
| 2026-02-10 | 13F/A | Northwestern Mutual Wealth Management Co | 2.139 | -13,01 | 126 | -11,27 | ||||
| 2026-02-13 | 13F | Mml Investors Services, Llc | 9.518 | 130,57 | 561 | 134,31 | ||||
| 2026-02-11 | 13F | Cerity Partners LLC | 317.955 | -45,56 | 18.728 | -44,67 | ||||
| 2026-01-29 | 13F | Sanctuary Advisors, LLC | 5.450 | -0,71 | 321 | 0,94 | ||||
| 2026-02-26 | 13F | Anchor Investment Management, LLC | 7.164 | 0,00 | 422 | 1,45 | ||||
| 2025-11-05 | 13F | Soundwatch Capital LLC | 0 | -100,00 | 0 | |||||
| 2026-02-12 | 13F | CIBC Private Wealth Group, LLC | 1.434 | 84 | ||||||
| 2026-01-26 | 13F | Berkeley, Inc | 355.154 | -7,26 | 20.919 | -5,75 | ||||
| 2026-02-03 | 13F | We Are One Seven, LLC | 28.972 | -29,63 | 1.706 | -28,50 | ||||
| 2026-02-17 | 13F | TCG Advisory Services, LLC | 6.272 | 369 | ||||||
| 2026-02-10 | 13F | CIBC World Markets Inc. | 17.819 | 34,51 | 1.050 | 36,77 | ||||
| 2026-01-21 | 13F | DMG Group, LLC | 0 | -100,00 | 0 | |||||
| 2026-02-24 | 13F | Astoria Portfolio Advisors LLC. | 4.631 | 10,50 | 284 | 15,98 | ||||
| 2026-02-03 | 13F | Legacy Wealth Managment, LLC/ID | 4.734 | 5,29 | 279 | 6,92 | ||||
| 2026-01-05 | 13F | Park National Corp /oh/ | 13.529 | -33,41 | 797 | -32,37 | ||||
| 2026-01-14 | 13F | Crumly & Associates Inc. | 366.485 | -3,37 | 21.586 | -1,81 | ||||
| 2026-02-11 | 13F | Vermillion Wealth Management, Inc. | 517 | -8,98 | 30 | -6,25 | ||||
| 2026-02-03 | 13F | Navigoe, LLC | 1.432 | 0,00 | 0 | |||||
| 2026-02-17 | 13F | Russell Investments Group, Ltd. | 2.023 | -0,15 | 119 | 1,71 | ||||
| 2026-02-13 | 13F | Morgan Stanley | 9.027 | -18,68 | 532 | -17,42 | ||||
| 2026-01-30 | 13F | Oakworth Capital, Inc. | 672 | 0,00 | 40 | 2,63 | ||||
| 2025-09-19 | NP | MAGSX - Madison Aggressive Allocation Fund Aggressive Allocation Fund Class A | 77.595 | -15,67 | 4.254 | -12,07 | ||||
| 2026-02-09 | 13F | Shufro Rose & Co Llc | 3.586 | -38,63 | 211 | -33,23 | ||||
| 2026-02-12 | 13F | Commonwealth Equity Services, Llc | 41.488 | -4,84 | 2.444 | 122.050,00 | ||||
| 2026-02-17 | 13F | Herold Advisors, Inc. | 71.362 | -16,05 | 4.203 | -14,69 | ||||
| 2026-01-26 | 13F | AE Wealth Management LLC | 63 | -11,27 | 4 | -25,00 | ||||
| 2026-01-21 | 13F | Flagship Harbor Advisors, Llc | 29.839 | 1,22 | 1.758 | 2,87 | ||||
| 2026-02-13 | 13F | Integrated Wealth Concepts LLC | 0 | -100,00 | 0 | |||||
| 2026-02-06 | 13F | Csenge Advisory Group | 59.508 | -6,91 | 3.505 | -5,40 | ||||
| 2026-02-17 | 13F | Advisory Services Network, LLC | 24.198 | -0,68 | 1.425 | 0,92 | ||||
| 2025-11-12 | 13F | Arete Wealth Advisors, LLC | 0 | -100,00 | 0 | |||||
| 2026-02-12 | 13F | Jane Street Group, Llc | 9.457 | 557 | ||||||
| 2026-01-27 | 13F | Belpointe Asset Management LLC | 4.594 | -11,00 | 271 | -9,70 | ||||
| 2026-02-02 | 13F | Truist Financial Corp | 10.533 | 0,05 | 620 | 1,64 | ||||
| 2026-02-12 | 13F | Steward Partners Investment Advisory, Llc | 1.637 | 0,00 | 96 | 2,13 | ||||
| 2026-01-21 | 13F | Capital Advisors, Ltd. LLC | 1.813 | 0,00 | 0 | |||||
| 2025-11-13 | 13F | SCS Capital Management LLC | 0 | -100,00 | 0 | -100,00 | ||||
| 2026-01-26 | 13F | Merit Financial Group, LLC | 63.539 | -4,07 | 3.742 | -2,50 | ||||
| 2026-01-30 | 13F | Us Bancorp \de\ | 5.777 | 0,00 | 340 | 1,80 | ||||
| 2026-02-13 | 13F | Wells Fargo & Company/mn | 76 | -90,08 | 4 | -90,91 | ||||
| 2025-11-12 | 13F | Blair William & Co/il | 0 | -100,00 | 0 | |||||
| 2026-02-17 | 13F/A | American Alpha Advisors, LLC | 25.423 | 15,23 | 1.497 | 17,14 | ||||
| 2025-11-10 | 13F | Hartland & Co., LLC | 0 | -100,00 | 0 | |||||
| 2026-02-03 | 13F | Centerpoint Advisory Group | 64.075 | -6,62 | 3.774 | -5,08 | ||||
| 2026-02-18 | 13F | Braeburn Wealth Management LLC | 22.705 | 1.337 | ||||||
| 2026-02-10 | 13F | Thoroughbred Financial Services, Llc | 35.008 | -14,49 | 2 | 0,00 | ||||
| 2026-01-23 | 13F | Farther Finance Advisors, LLC | 0 | -100,00 | 0 | |||||
| 2026-02-13 | 13F | Landmark Wealth Management, Inc. | 10.225 | 0,00 | 602 | 1,69 | ||||
| 2026-02-11 | 13F | Jpmorgan Chase & Co | 146.924 | 19,35 | 8.654 | 21,29 | ||||
| 2025-09-19 | NP | MMDAX - Madison Moderate Allocation Fund Moderate Allocation Fund Class A | 89.161 | -23,27 | 4.888 | -20,00 | ||||
| 2026-01-21 | 13F | Heritage Oak Wealth Advisors Llc | 18.149 | -0,75 | 1.069 | 0,85 |