Grundlæggende statistik
| Institutionelle aktier (lange) | 40.697.100 - 107,80% (ex 13D/G) - change of -11,09MM shares -21,42% MRQ |
| Institutionel værdi (lang) | $ 8.179.379 USD ($1000) |
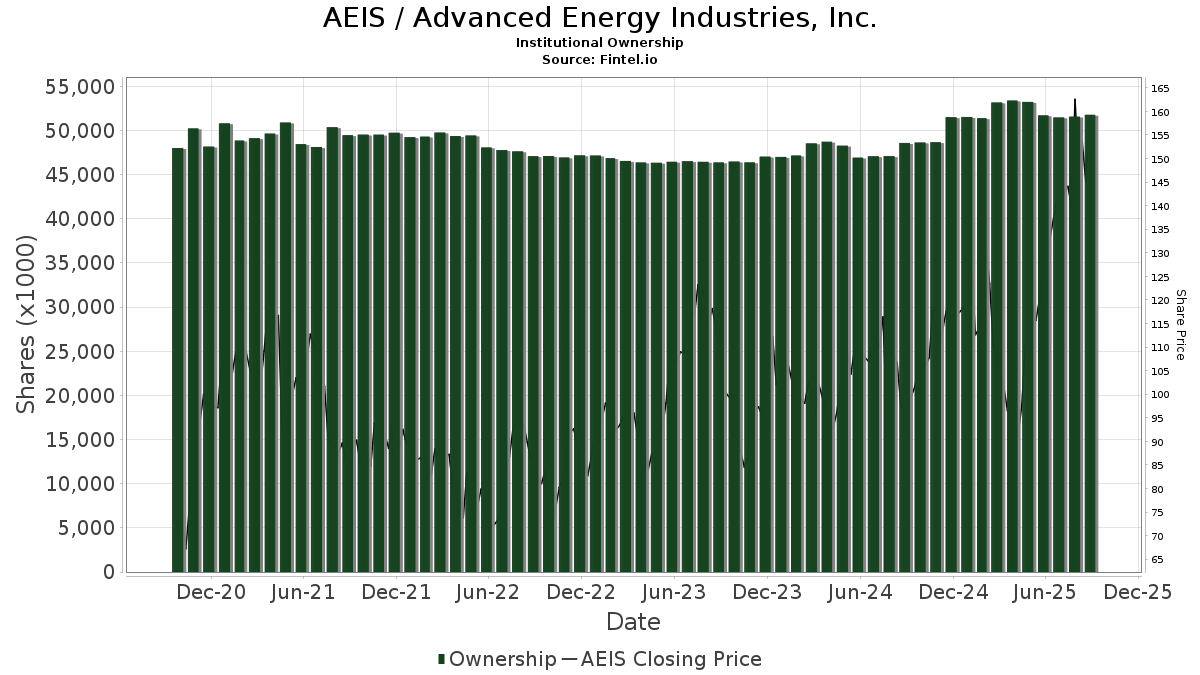
Institutionelt ejerskab og aktionærer
Advanced Energy Industries, Inc. (US:AEIS) har 492 institutionelle ejere og aktionærer, der har indsendt 13D/G- eller 13F-formularer til Securities Exchange Commission (SEC). Disse institutioner har i alt 40,723,400 aktier. Største aktionærer omfatter BlackRock, Inc., Vanguard Group Inc, Fmr Llc, Ameriprise Financial Inc, Invesco Ltd., State Street Corp, Earnest Partners Llc, Geode Capital Management, Llc, Bank Of America Corp /de/, and Neuberger Berman Group LLC .
Advanced Energy Industries, Inc. (NasdaqGS:AEIS) institutionel ejerskabsstruktur viser aktuelle positioner i virksomheden efter institutioner og fonde, samt seneste ændringer i positionsstørrelse. Større aktionærer kan omfatte individuelle investorer, investeringsforeninger, hedgefonde eller institutioner. Skema 13D angiver, at investoren besidder (eller besidder) mere end 5 % af virksomheden og har til hensigt (eller har til hensigt at) aktivt at forfølge en ændring i forretningsstrategi. Skema 13G indikerer en passiv investering på over 5%.
The share price as of March 27, 2026 is 310,76 / share. Previously, on March 31, 2025, the share price was 95,31 / share. This represents an increase of 226,05% over that period.
Fondens stemningsscore
Fund Sentiment Score (fka Ownership Accumulation Score) finder de aktier, der bliver mest købt af fonde. Det er resultatet af en sofistikeret, multi-faktor kvantitativ model, der identificerer virksomheder med de højeste niveauer af institutionel akkumulering. Scoringsmodellen bruger en kombination af den samlede stigning i oplyste ejere, ændringerne i porteføljeallokeringer i disse ejere og andre målinger. Tallet går fra 0 til 100, hvor højere tal indikerer et højere niveau af akkumulering for sine jævnaldrende, og 50 er gennemsnittet.
Opdateringsfrekvens: Dagligt
Se Ownership Explorer, som giver en liste over højest rangerende virksomheder.
AI+ Ask Fintel’s AI assistant about Advanced Energy Industries, Inc..
Select a question to share a public post with an AI-crafted answer.
Thinking of good questions…
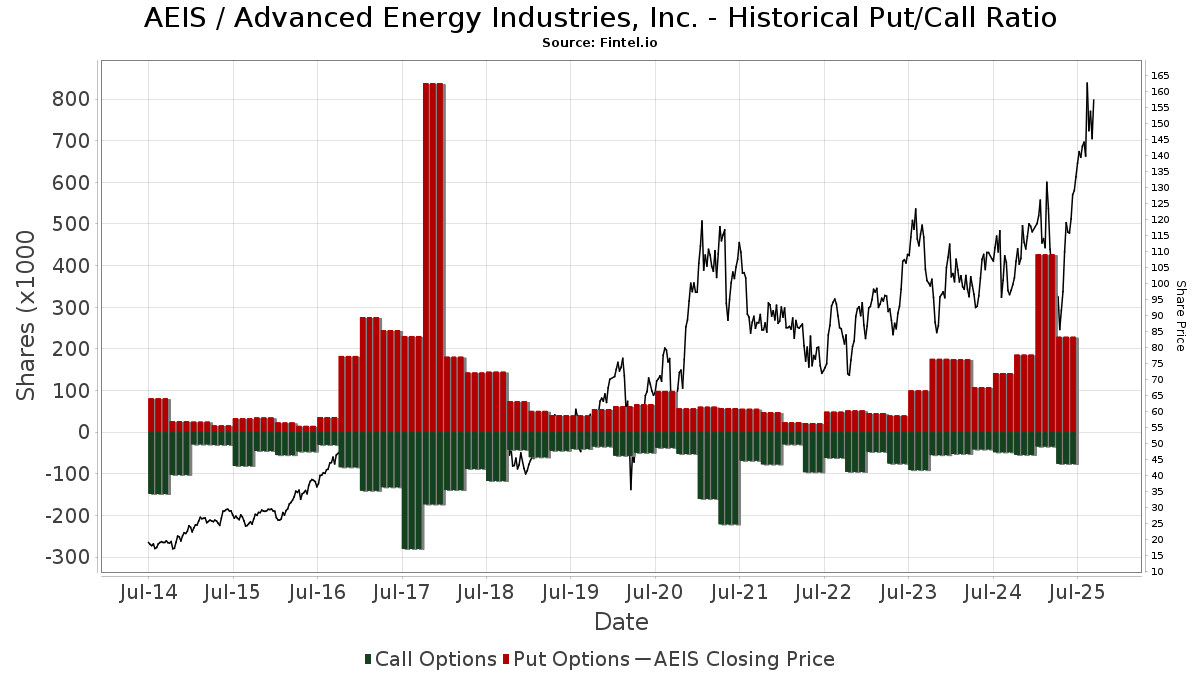
Institutionel Put/Call-forhold
Ud over at indberette standardaktie- og gældsudstedelser skal institutter med mere end 100 mill. aktiver under forvaltning også oplyse deres put- og call-optionsbeholdninger. Da salgsoptioner generelt indikerer negativ stemning, og købsoptioner indikerer positiv stemning, kan vi få en fornemmelse af den overordnede institutionelle stemning ved at plotte forholdet mellem put og kald. Diagrammet til højre viser det historiske put/call-forhold for dette instrument.
Brug af Put/Call Ratio som en indikator for investorernes stemning overvinder en af de vigtigste mangler ved at bruge totalt institutionelt ejerskab, som er, at en betydelig mængde af aktiver under forvaltning investeres passivt for at spore indekser. Passivt forvaltede fonde køber typisk ikke optioner, så indikatoren for put/call-forholdet følger mere nøje følelsen af aktivt forvaltede fonde.
13D/G-arkivering
Vi præsenterer 13D/G ansøgninger separat fra 13F ansøgninger på grund af den forskellige behandling af SEC. 13D/G-ansøgninger kan indgives af grupper af investorer (med én ledende), hvorimod 13F-ansøgninger ikke kan. Dette resulterer i situationer, hvor en investor kan indsende en 13D/G, der rapporterer én værdi for de samlede aktier (der repræsenterer alle de aktier, der ejes af investorgruppen), men derefter indsender en 13F, der rapporterer en anden værdi for de samlede aktier (der udelukkende repræsenterer deres egne) ejendomsret). Det betyder, at aktieejerskab af 13D/G-arkiver og 13F-arkiveringer ofte ikke er direkte sammenlignelige, så vi præsenterer dem separat.
Bemærk: Fra den 16. maj 2021 viser vi ikke længere ejere, der ikke har indsendt en 13D/G inden for det seneste år. Tidligere viste vi den fulde historie af 13D/G-arkiver. Generelt skal enheder, der er forpligtet til at indgive 13D/G-ansøgninger, indgive mindst årligt, før de indsender en afsluttende ansøgning. Dog forlader fonde nogle gange positioner uden at indsende en afsluttende ansøgning (dvs. de afvikler), så visning af den fulde historie resulterede nogle gange i forvirring om det nuværende ejerskab. For at undgå forvirring viser vi nu kun 'aktuelle' ejere - det vil sige - ejere, der har anmeldt inden for det seneste år.
Upgrade to unlock premium data.
| Fil dato | Form | Investor | Forrige Aktier |
Seneste Aktier |
Δ Aktier (Procent) |
Ejendomsret (Procent) |
Δ Ejerskab (Procent) |
|
|---|---|---|---|---|---|---|---|---|
| 2026-03-26 | VANGUARD GROUP INC | 4,913,669 | 0 | -100.00 | 0.00 | -100.00 | ||
| 2026-02-05 | FMR LLC | 2,803,703 | 1,962,779 | -29.99 | 5.20 | -29.73 | ||
| 2025-11-14 | AMERIPRISE FINANCIAL INC | 2,002,697 | 1,820,336 | -9.11 | 4.80 | -9.43 | ||
| 2025-07-18 | BlackRock, Inc. | 5,986,069 | 5,520,874 | -7.77 | 14.70 | -8.70 |
13F og NPORT arkivering
Detaljer om 13F-arkivering er gratis. Detaljer om NP-ansøgninger kræver et premium-medlemskab. Grønne rækker angiver nye positioner. Røde rækker angiver lukkede positioner. Klik på linket ikon for at se den fulde transaktionshistorik.
Opgrader
for at låse premium-data op og eksportere til Excel ![]() .
.
| Fil dato | Kilde | Investor | Type | Gennemsnitlig pris (Øst) |
Aktier | Δ Aktier (%) |
Rapporteret Værdi ($1000) |
Δ Værdi (%) |
Port Alloc (%) |
|
|---|---|---|---|---|---|---|---|---|---|---|
| 2026-01-16 | 13F | Tema Etfs Llc | 25.895 | 88,81 | 5.422 | 132,36 | ||||
| 2026-01-20 | 13F | Signaturefd, Llc | 1.198 | 2,48 | 251 | 26,26 | ||||
| 2026-02-05 | 13F | Isthmus Partners, Llc | 0 | -100,00 | 0 | |||||
| 2026-02-05 | 13F | HFM Investment Advisors, LLC | 11 | 450,00 | 2 | |||||
| 2026-02-13 | 13F | Analog Century Management LP | 463.939 | -0,72 | 97.135 | 22,17 | ||||
| 2026-02-13 | 13F | Financial Network Wealth Advisors LLC | 10 | 0,00 | 2 | 100,00 | ||||
| 2026-02-17 | 13F | Graham Capital Management, L.P. | 0 | -100,00 | 0 | |||||
| 2026-02-12 | 13F | Steward Partners Investment Advisory, Llc | 1.115 | -3,46 | 233 | 18,88 | ||||
| 2026-02-13 | 13F | Colony Group, LLC | 1.177 | -93,36 | 247 | -79,52 | ||||
| 2026-02-11 | 13F | Simplex Trading, Llc | Call | 9.300 | 1.450,00 | 1.947 | ||||
| 2026-01-30 | 13F | Us Bancorp \de\ | 4.860 | -40,86 | 1.018 | -27,25 | ||||
| 2026-01-23 | 13F | Freestone Capital Holdings, LLC | 2.281 | -15,20 | 478 | 4,38 | ||||
| 2026-02-12 | 13F | Advisors Asset Management, Inc. | 1.055 | 26,80 | 221 | 56,03 | ||||
| 2026-01-30 | 13F | Jennison Associates Llc | 7.952 | 1.665 | ||||||
| 2026-02-03 | 13F | Ethic Inc. | 4.911 | -5,16 | 1.028 | 16,69 | ||||
| 2026-01-20 | 13F | Thurston, Springer, Miller, Herd & Titak, Inc. | 65 | 14 | ||||||
| 2026-02-13 | 13F | Entropy Technologies, LP | 2.759 | 578 | ||||||
| 2026-02-17 | 13F | Signature Equity Partners, LLC | 17 | 4 | ||||||
| 2025-09-29 | NP | BOGSX - Black Oak Emerging Technology Fund | 17.560 | 0,00 | 2.439 | 42,63 | ||||
| 2026-02-12 | 13F | Ankerstar Wealth, LLC | 6 | 1 | ||||||
| 2025-09-29 | NP | LVOAX - Lord Abbett Value Opportunities Fund Class A | 139.410 | -31,42 | 19.367 | -2,19 | ||||
| 2026-01-23 | 13F | Twelve Points Wealth Management LLC | 1.034 | 227 | ||||||
| 2026-02-17 | 13F | Royal Bank Of Canada | 39.485 | 17,64 | 8.267 | 44,81 | ||||
| 2026-02-13 | 13F | Truvestments Capital Llc | 30 | 7,14 | 6 | 50,00 | ||||
| 2026-01-08 | 13F | Tompkins Financial Corp | 14 | 3 | ||||||
| 2025-09-29 | NP | SUNAMERICA SERIES TRUST - SA Small Cap Index Portfolio Class 1 | 4.289 | 0,78 | 596 | 43,72 | ||||
| 2026-02-17 | 13F | Cim Investment Mangement Inc | 2.872 | 0,00 | 601 | 23,16 | ||||
| 2026-01-28 | 13F | Arizona State Retirement System | 10.463 | -6,05 | 2.191 | 15,63 | ||||
| 2026-02-13 | 13F | Rhumbline Advisers | 104.067 | -8,02 | 21.788 | 13,19 | ||||
| 2026-02-11 | 13F | Compass Wealth Management LLC | 53.116 | 11.121 | ||||||
| 2026-02-11 | 13F | Rise Advisors, LLC | 0 | -100,00 | 0 | |||||
| 2026-02-06 | 13F | Pnc Financial Services Group, Inc. | 6.925 | -19,15 | 1.450 | -0,55 | ||||
| 2026-02-12 | 13F | Cibc World Markets Corp | 2.496 | -46,30 | 523 | -15,12 | ||||
| 2026-02-06 | 13F | Mach-1 Financial Group, Inc. | 1.010 | 211 | ||||||
| 2026-02-03 | 13F | Sequoia Financial Advisors, LLC | 2.141 | 38,85 | 448 | 70,99 | ||||
| 2026-01-16 | 13F | Longboard Asset Management, LP | 0 | -100,00 | 0 | |||||
| 2025-11-14 | 13F | Nomura Holdings Inc | 0 | -100,00 | 0 | -100,00 | ||||
| 2026-01-28 | 13F | Salomon & Ludwin, LLC | 271 | 2,65 | 62 | 35,56 | ||||
| 2026-02-06 | 13F | Tortoise Investment Management, LLC | 0 | -100,00 | 0 | |||||
| 2026-02-13 | 13F | Walleye Capital LLC | 0 | -100,00 | 0 | -100,00 | ||||
| 2026-02-13 | 13F | Public Sector Pension Investment Board | 0 | -100,00 | 0 | |||||
| 2026-01-09 | 13F | Congress Asset Management Co /ma | 226.882 | 47.502 | ||||||
| 2026-01-29 | 13F | Nbc Securities, Inc. | 109 | 23 | ||||||
| 2026-02-17 | 13F | CWM Advisors, LLC | 2.230 | -18,07 | 467 | 0,65 | ||||
| 2026-02-17 | 13F | Dean Investment Associates, Llc | 27.647 | -19,19 | 5.788 | -0,55 | ||||
| 2025-11-13 | 13F/A | Peak6 Llc | Put | 0 | -100,00 | 0 | -100,00 | |||
| 2026-02-05 | 13F | High Note Wealth, LLC | 35 | -5,41 | 7 | 16,67 | ||||
| 2026-02-12 | 13F | EAM Investors, LLC | 49.169 | -1,96 | 10.295 | 22,64 | ||||
| 2026-01-27 | 13F | Round Rock Advisors, LLC | 2.844 | -12,87 | 595 | 7,21 | ||||
| 2026-02-12 | 13F | Quadrant Capital Group Llc | 2.864 | 82,19 | 600 | 124,34 | ||||
| 2026-02-09 | 13F | Hartland & Co., LLC | 37 | 12,12 | 8 | 40,00 | ||||
| 2026-02-13 | 13F | Commerce Bank | 3.404 | -0,90 | 713 | 21,92 | ||||
| 2026-02-12 | 13F | Hrt Financial Lp | 0 | -100,00 | 0 | |||||
| 2026-02-17 | 13F | Elequin Capital Lp | 88 | 18 | ||||||
| 2026-02-03 | 13F | Mitsubishi UFJ Kokusai Asset Management Co., Ltd. | 72 | 0,00 | 16 | 25,00 | ||||
| 2026-01-16 | 13F | Louisiana State Employees Retirement System | 17.300 | 0,00 | 3.622 | 23,07 | ||||
| 2026-02-13 | 13F | Umb Bank N A/mo | 433 | 33,23 | 91 | 63,64 | ||||
| 2026-01-15 | 13F | Fifth Third Wealth Advisors LLC | 1.140 | 239 | ||||||
| 2026-02-17 | 13F | Wellington Management Group Llp | 427.898 | 45,10 | 89.589 | 78,56 | ||||
| 2026-01-21 | 13F | Yousif Capital Management, Llc | 10.208 | -13,15 | 2.562 | 28,11 | ||||
| 2026-02-13 | 13F | Baird Financial Group, Inc. | 2.530 | 2,93 | 530 | 26,56 | ||||
| 2026-02-17 | 13F | Credit Agricole S A | 35.212 | 109,37 | 7.372 | 157,67 | ||||
| 2026-02-11 | 13F | Fiera Capital Corp | 54.369 | 25,46 | 11.383 | 54,41 | ||||
| 2026-02-11 | 13F | Cookson Peirce & Co Inc | 17.274 | -0,74 | 3.617 | 22,16 | ||||
| 2026-02-17 | 13F | Advisor Group Holdings, Inc. | 31.856 | 486,45 | 6.670 | 692,98 | ||||
| 2026-02-13 | 13F | First Trust Advisors Lp | 168.116 | 25,25 | 35.198 | 54,13 | ||||
| 2026-02-06 | 13F | EverSource Wealth Advisors, LLC | 361 | -3,48 | 76 | 19,05 | ||||
| 2026-02-12 | 13F | Federated Hermes, Inc. | 107.951 | 137,09 | 22.602 | 191,78 | ||||
| 2025-11-12 | 13F | NewSquare Capital LLC | 0 | -100,00 | 0 | |||||
| 2025-11-14 | 13F | Balyasny Asset Management Llc | 0 | -100,00 | 0 | |||||
| 2026-02-17 | 13F | Brevan Howard Capital Management LP | 0 | -100,00 | 0 | |||||
| 2026-02-09 | 13F | Optimize Financial Inc | 2.084 | 1,36 | 436 | 24,93 | ||||
| 2026-02-12 | 13F | New York State Common Retirement Fund | 276.793 | -7,09 | 57.952 | 14,34 | ||||
| 2026-02-17 | 13F | Fmr Llc | 1.872.621 | -31,46 | 392.071 | -15,66 | ||||
| 2026-02-13 | 13F | Walleye Capital LLC | Call | 3.000 | 114,29 | 628 | 163,87 | |||
| 2026-02-03 | 13F | Pier Capital, LLC | 37.079 | 24,90 | 7.763 | 53,69 | ||||
| 2026-02-12 | 13F | Andra AP-fonden | 0 | -100,00 | 0 | |||||
| 2026-02-13 | 13F | Walleye Capital LLC | Put | 2.900 | 222,22 | 607 | 296,73 | |||
| 2026-01-14 | 13F | Baron Wealth Management LLC | 2.877 | 0,00 | 602 | 23,11 | ||||
| 2026-02-11 | 13F | Janney Montgomery Scott LLC | 3.027 | -11,77 | 1 | |||||
| 2025-11-14 | 13F | Aquatic Capital Management LLC | 0 | -100,00 | 0 | |||||
| 2026-01-28 | 13F | CAPROCK Group, Inc. | 2.285 | 15,40 | 478 | 61,49 | ||||
| 2026-02-17 | 13F | Aqr Capital Management Llc | 30.587 | 16,49 | 6.404 | 43,36 | ||||
| 2026-02-05 | 13F | Elyxium Wealth, LLC | 15 | 3 | ||||||
| 2026-01-21 | 13F | Flagship Harbor Advisors, Llc | 2 | 0 | ||||||
| 2026-02-17 | 13F | Sora Investors Llc | 175.528 | 472,98 | 36.750 | 605,10 | ||||
| 2026-02-13 | 13F | BNP Paribas Asset Management Holding S.A. | 209.722 | 9,23 | 44 | 34,38 | ||||
| 2026-02-12 | 13F | Hollencrest Capital Management | 5.542 | 1.160 | ||||||
| 2026-02-13 | 13F | SRS Capital Advisors, Inc. | 471 | -48,01 | 99 | -36,36 | ||||
| 2026-01-30 | 13F | North Star Investment Management Corp. | 16 | 3 | ||||||
| 2026-02-10 | 13F | Godfrey Financial Associates, Inc. | 450 | 94 | ||||||
| 2026-02-17 | 13F | Two Sigma Securities, Llc | 1.699 | 356 | ||||||
| 2026-02-17 | 13F | Russell Investments Group, Ltd. | 33.329 | 22,94 | 6.978 | 51,27 | ||||
| 2026-02-13 | 13F | Sterling Capital Management LLC | 246 | 167,39 | 52 | 240,00 | ||||
| 2026-01-28 | 13F | Klp Kapitalforvaltning As | 8.500 | 8,97 | 1.780 | 34,06 | ||||
| 2025-09-29 | NP | CAMSX - Cambiar Small Cap Fund Investor Class Shares | 11.140 | -30,98 | 1.548 | -1,59 | ||||
| 2026-02-09 | 13F | Employees Retirement System of Texas | 285 | 0 | ||||||
| 2026-02-19 | 13F | CI Private Wealth, LLC | 6.731 | -0,33 | 1.413 | 23,00 | ||||
| 2026-01-29 | 13F | Teachers Retirement System Of The State Of Kentucky | 12.088 | 13,61 | 3 | 100,00 | ||||
| 2026-02-05 | 13F | Cambridge Investment Research Advisors, Inc. | 1.683 | 8,09 | 0 | |||||
| 2026-02-17 | 13F | Advisory Services Network, LLC | 0 | -100,00 | 0 | |||||
| 2026-01-15 | 13F | Fortitude Family Office, LLC | 7 | -36,36 | 1 | 0,00 | ||||
| 2026-02-11 | 13F | Zions Bancorporation, National Association /ut/ | 8 | 2 | ||||||
| 2026-02-05 | 13F | Pinnacle Associates Ltd | 89.568 | -6,14 | 18.753 | 15,50 | ||||
| 2026-01-29 | 13F | IMC-Chicago, LLC | Call | 13.600 | 2.847 | |||||
| 2026-01-27 | 13F | Bayforest Capital Ltd | 137 | 29 | ||||||
| 2026-02-17 | 13F | Tudor Investment Corp Et Al | 7.248 | -52,81 | 1.518 | -41,94 | ||||
| 2026-02-11 | 13F | Fox Run Management, L.l.c. | 1.986 | -68,16 | 416 | -60,89 | ||||
| 2026-02-12 | 13F | Voya Investment Management Llc | 11.731 | 0,00 | 2.456 | 23,11 | ||||
| 2026-01-23 | 13F | Farther Finance Advisors, LLC | 554 | 220,23 | 116 | 296,55 | ||||
| 2025-10-30 | 13F | Twin Peaks Wealth Advisors, LLC | 0 | -100,00 | 0 | |||||
| 2026-02-06 | 13F | Vestmark Advisory Solutions, Inc. | 4.930 | 1.032 | ||||||
| 2026-02-17 | 13F | Freestone Grove Partners LP | 57.531 | 37,13 | 12.045 | 68,77 | ||||
| 2026-01-09 | 13F | SG Americas Securities, LLC | 6.837 | 5,84 | 1 | 0,00 | ||||
| 2026-02-11 | 13F | Cerity Partners LLC | 21.949 | -16,05 | 4.596 | 3,24 | ||||
| 2026-01-28 | 13F | Peregrine Capital Management Llc | 77.323 | -9,73 | 16.189 | 11,08 | ||||
| 2026-02-10 | 13F | Ellevest, Inc. | 1.560 | -5,05 | 327 | 16,85 | ||||
| 2026-02-17 | 13F | State Of Wisconsin Investment Board | 2.044 | -43,06 | 428 | -30,00 | ||||
| 2026-02-13 | 13F | Vontobel Holding Ltd. | 4.293 | -4,71 | 899 | 17,23 | ||||
| 2025-10-31 | 13F | Whittier Trust Co | 0 | -100,00 | 0 | |||||
| 2025-11-14 | 13F | Scientech Research LLC | 0 | -100,00 | 0 | |||||
| 2026-01-27 | 13F | First Horizon Corp | 5 | 0,00 | 1 | |||||
| 2026-02-03 | 13F | Everence Capital Management Inc | 2.780 | 0,00 | 1 | |||||
| 2026-02-09 | 13F | MQS Management LLC | 0 | -100,00 | 0 | |||||
| 2026-02-13 | 13F | Pathstone Holdings, LLC | 18.804 | 2,41 | 3.937 | 26,06 | ||||
| 2026-02-13 | 13F | Fiduciary Trust Co | 4.781 | -16,45 | 1.001 | 2,77 | ||||
| 2026-02-12 | 13F | Castleark Management Llc | 49.133 | 2,98 | 10.287 | 26,72 | ||||
| 2026-02-06 | 13F | Cullen/frost Bankers, Inc. | 194 | 40,58 | 41 | 73,91 | ||||
| 2026-01-20 | 13F | Sheets Smith Wealth Management | 6.544 | -14,32 | 1.370 | 5,47 | ||||
| 2025-10-08 | 13F | Sheets Smith Investment Management | 1.233 | 210 | ||||||
| 2026-02-17 | 13F | Jones Financial Companies Lllp | 404 | 192,75 | 85 | 281,82 | ||||
| 2026-02-17 | 13F | Aristotle Capital Boston, LLC | 187.854 | -19,47 | 39.331 | -0,89 | ||||
| 2026-02-17 | 13F | Oberweis Asset Management Inc/ | 39.700 | -43,04 | 8.312 | -29,91 | ||||
| 2026-02-04 | 13F | First Eagle Investment Management, LLC | 98.473 | -15,24 | 20.617 | 4,31 | ||||
| 2026-02-05 | 13F | Atria Investments Llc | 8.840 | -2,14 | 1.851 | 20,44 | ||||
| 2026-01-28 | 13F | B. Metzler seel. Sohn & Co. AG | 12.451 | 2.607 | ||||||
| 2026-02-10 | 13F | Commonwealth Of Pennsylvania Public School Empls Retrmt Sys | 9.344 | -2,57 | 1.956 | 19,93 | ||||
| 2026-02-12 | 13F | Xponance, Inc. | 2.972 | 0,47 | 622 | 23,66 | ||||
| 2026-02-02 | 13F | Bay Harbor Wealth Management, LLC | 5 | 25,00 | 1 | |||||
| 2026-02-12 | 13F | JPL Wealth Management, LLC | 0 | -100,00 | 0 | |||||
| 2026-02-17 | 13F | Susquehanna International Group, Llp | Put | 45.600 | -13,64 | 9.547 | 6,28 | |||
| 2026-02-04 | 13F | Oregon Public Employees Retirement Fund | 8.615 | 1,17 | 1.804 | 24,52 | ||||
| 2026-02-17 | 13F | Susquehanna International Group, Llp | Call | 55.000 | 42,49 | 11.515 | 75,35 | |||
| 2025-10-22 | 13F | Geneos Wealth Management Inc. | 0 | -100,00 | 0 | -100,00 | ||||
| 2026-02-06 | 13F | Envestnet Portfolio Solutions, Inc. | 8.571 | 9,21 | 1.795 | 34,38 | ||||
| 2026-02-17 | 13F | Susquehanna International Group, Llp | 2.738 | -40,18 | 573 | -26,35 | ||||
| 2026-01-23 | 13F | Private Wealth Management Group, LLC | 7 | 0,00 | 1 | 0,00 | ||||
| 2026-02-17 | 13F | Occudo Quantitative Strategies Lp | 2.662 | -21,03 | 557 | -2,79 | ||||
| 2026-02-17 | 13F | Man Group plc | 19.510 | 47,85 | 4.085 | 81,92 | ||||
| 2026-02-02 | 13F | Montag A & Associates Inc | 12 | -40,00 | 2 | -33,33 | ||||
| 2026-02-12 | 13F | Brinker Capital Investments, LLC | 15.223 | 3,84 | 3.187 | 27,79 | ||||
| 2026-02-13 | 13F | Great West Life Assurance Co /can/ | 33.502 | -24,28 | 7 | 0,00 | ||||
| 2026-02-02 | 13F | Wolverine Asset Management Llc | 5.289 | 1.107 | ||||||
| 2026-02-17 | 13F | Delaware Management Holdings, Inc. | 178.204 | 37.311 | ||||||
| 2026-01-05 | 13F | GAMMA Investing LLC | 2.592 | 14,44 | 543 | 40,78 | ||||
| 2026-02-11 | 13F | Cedar Mountain Advisors, LLC | 3 | 0,00 | 1 | |||||
| 2025-11-13 | 13F | Vestcor Inc | 0 | -100,00 | 0 | |||||
| 2026-01-20 | 13F | Harbor Capital Advisors, Inc. | 12.651 | 32,74 | 3 | 100,00 | ||||
| 2026-02-10 | 13F | State of Wyoming | 265 | 55 | ||||||
| 2026-02-04 | 13F | Swiss Life Asset Management Ltd | 2.965 | 65,83 | 621 | 103,95 | ||||
| 2026-02-09 | 13F | Legal & General Group Plc | 95.136 | -4,35 | 19.919 | 17,70 | ||||
| 2026-02-03 | 13F | Connable Office Inc | 4.200 | -7,55 | 879 | 13,86 | ||||
| 2026-02-12 | 13F | Bank Of Montreal /can/ | 76.756 | -30,31 | 16.070 | 3,48 | ||||
| 2026-02-11 | 13F | Deutsche Bank Ag\ | 72.277 | -6,41 | 15.133 | 15,17 | ||||
| 2026-02-17 | 13F | Lazard Asset Management Llc | 35.145 | 448,80 | 7.358 | 575,67 | ||||
| 2026-02-02 | 13F | Millstone Evans Group, LLC | 85 | 0,00 | 18 | 21,43 | ||||
| 2026-02-13 | 13F | Quarry LP | 16 | 3 | ||||||
| 2026-02-05 | 13F | Plante Moran Financial Advisors, LLC | 15 | 0,00 | 3 | 50,00 | ||||
| 2026-02-13 | 13F | Peak6 Llc | Call | 0 | -100,00 | 0 | ||||
| 2026-01-13 | 13F | Triangle Securities Wealth Management | 1.090 | 228 | ||||||
| 2026-02-09 | 13F | Huntington National Bank | 489 | -9,61 | 102 | 10,87 | ||||
| 2026-01-21 | 13F | Azzad Asset Management Inc /adv | 10.902 | 1,70 | 2.283 | 25,18 | ||||
| 2026-01-23 | 13F | Cambiar Investors Llc | 0 | -100,00 | 0 | -100,00 | ||||
| 2026-01-23 | 13F | Ritholtz Wealth Management | 1.117 | 234 | ||||||
| 2026-02-03 | 13F | SBI Securities Co., Ltd. | 49 | 16,67 | 10 | 42,86 | ||||
| 2026-02-20 | 13F | Dean Capital Management | 18.804 | -33,39 | 3.937 | -18,03 | ||||
| 2025-09-29 | NP | PBW - Invesco WilderHill Clean Energy ETF This fund is a listed as child fund of Invesco Ltd. and if that institution has disclosed ownership in this security, then these positions will not be double counted when calculating total shares and total value | 32.521 | -14,49 | 4.518 | 21,95 | ||||
| 2026-01-27 | 13F | Atlantic Edge Private Wealth Management, LLC | 23 | 0,00 | 5 | 33,33 | ||||
| 2026-02-10 | 13F | Re Advisers Corp | 32.762 | -24,96 | 6.859 | -7,66 | ||||
| 2026-01-30 | 13F | Pvg Asset Management Corp | 0 | -100,00 | 0 | |||||
| 2026-02-13 | 13F | Walleye Trading LLC | Put | 1.400 | -53,33 | 293 | -42,55 | |||
| 2026-02-13 | 13F | Walleye Trading LLC | Call | 49.600 | 2.154,55 | 10.385 | 2.676,47 | |||
| 2026-02-09 | 13F | Atlantic Trust, LLC | 0 | -100,00 | 0 | -100,00 | ||||
| 2026-02-13 | 13F | Police & Firemen's Retirement System of New Jersey | 10.175 | -2,57 | 2.130 | 19,93 | ||||
| 2026-02-13 | 13F | Fieldview Capital Management, LLC | 8.396 | 1.758 | ||||||
| 2026-02-09 | 13F | Wcm Investment Management, Llc | 101.392 | 21.638 | ||||||
| 2026-02-13 | 13F | Caitong International Asset Management Co., Ltd | 39 | 8 | ||||||
| 2026-02-17 | 13F | Kemnay Advisory Services Inc. | 121 | 25 | ||||||
| 2026-02-17 | 13F | Silvercrest Asset Management Group Llc | 382.562 | -17,07 | 80.098 | 2,05 | ||||
| 2026-02-11 | 13F | CenterBook Partners LP | 14.489 | 3.034 | ||||||
| 2026-02-17 | 13F | Price T Rowe Associates Inc /md/ | 70.145 | 103,30 | 15 | 180,00 | ||||
| 2026-03-06 | 13F | Hsbc Holdings Plc | 10.562 | -7,62 | 2.213 | 14,26 | ||||
| 2026-02-10 | 13F | Td Asset Management Inc | 8.328 | 1,81 | 1.744 | 25,31 | ||||
| 2026-02-12 | 13F | Snyder Capital Management L P | 323.075 | -12,62 | 67.642 | 7,53 | ||||
| 2026-02-10 | 13F | Bnp Paribas Arbitrage, Sa | 124.499 | -8,08 | 26.066 | 13,11 | ||||
| 2026-02-09 | 13F | Harbour Investments, Inc. | 1 | 0 | ||||||
| 2026-02-12 | 13F | Wealthspire Advisors, LLC | 0 | -100,00 | 0 | |||||
| 2026-02-09 | 13F | Geode Capital Management, Llc | 956.979 | 3,07 | 200.393 | 26,84 | ||||
| 2026-02-17 | 13F | WFA of San Diego, LLC | 0 | -100,00 | 0 | |||||
| 2026-02-12 | 13F | Mount Yale Investment Advisors, LLC | 4.913 | -3,06 | 1.029 | 19,26 | ||||
| 2026-02-17 | 13F | Public Employees Retirement System Of Ohio | 1.207 | 213,51 | 253 | 287,69 | ||||
| 2026-01-28 | 13F | Universal- Beteiligungs- und Servicegesellschaft mbH | 27.953 | 17,07 | 5.853 | 44,07 | ||||
| 2025-10-30 | 13F | Bailard, Inc. | 0 | -100,00 | 0 | -100,00 | ||||
| 2026-01-23 | 13F | State of Alaska, Department of Revenue | 20.844 | 1,53 | 4 | 33,33 | ||||
| 2026-01-29 | 13F | Comerica Bank | 19.938 | 46,85 | 4.174 | 80,77 | ||||
| 2026-01-23 | 13F | Rsm Us Wealth Management Llc | 1.935 | 10,63 | 413 | 38,72 | ||||
| 2026-01-26 | 13F | Private Trust Co Na | 165 | 8,55 | 35 | 36,00 | ||||
| 2026-02-17 | 13F | Gotham Asset Management, LLC | 10.378 | -7,70 | 2.173 | 13,54 | ||||
| 2026-02-12 | 13F | Earnest Partners Llc | 1.408.368 | -8,66 | 294.870 | 12,40 | ||||
| 2026-02-17 | 13F | Mirabella Financial Services Llp | 1.758 | 368 | ||||||
| 2026-01-12 | 13F | CVA Family Office, LLC | 6 | 0,00 | 1 | 0,00 | ||||
| 2026-02-13 | 13F | JustInvest LLC | 7.613 | 3,82 | 1.594 | 27,75 | ||||
| 2026-02-17 | 13F | Mercer Global Advisors Inc /adv | 2.694 | 22,68 | 564 | 50,94 | ||||
| 2026-02-09 | 13F | Coldstream Capital Management Inc | 2.856 | 2,33 | 598 | 25,95 | ||||
| 2026-02-17 | 13F | Ameriprise Financial Inc | 1.642.153 | -9,41 | 343.819 | 11,48 | ||||
| 2026-02-13 | 13F | Segall Bryant & Hamill, Llc | 159.035 | 12,03 | 33.297 | 37,86 | ||||
| 2026-02-02 | 13F | Oppenheimer Asset Management Inc. | 0 | -100,00 | 0 | |||||
| 2025-11-14 | 13F | Aigen Investment Management, Lp | 0 | -100,00 | 0 | |||||
| 2026-02-13 | 13F | Victory Capital Management Inc | 8.184 | -18,16 | 1.713 | 0,71 | ||||
| 2026-02-10 | 13F | Natixis Advisors, L.p. | 54.431 | 36,43 | 11 | 83,33 | ||||
| 2026-02-02 | 13F | Cornerstone Planning Group LLC | 124 | -76,11 | 33 | -75,76 | ||||
| 2026-02-17 | 13F | Engineers Gate Manager LP | 3.066 | 4,25 | 642 | 28,20 | ||||
| 2026-02-12 | 13F | BlackRock, Inc. | 6.085.026 | 6,39 | 1.274.022 | 30,93 | ||||
| 2026-02-13 | 13F | Kestra Advisory Services, LLC | 1.433 | 300 | ||||||
| 2026-02-13 | 13F | Anb Bank | 1.399 | 293 | ||||||
| 2026-02-13 | 13F | Resources Investment Advisors, LLC. | 2.171 | -22,93 | 455 | -5,22 | ||||
| 2026-02-12 | 13F | State Board Of Administration Of Florida Retirement System | 12.440 | 0,00 | 2.605 | 23,06 | ||||
| 2026-01-29 | 13F | Vanguard Group Inc | 4.737.657 | -2,78 | 991.923 | 19,64 | ||||
| 2026-02-13 | 13F | Kayne Anderson Rudnick Investment Management Llc | 2.944 | 62,56 | 616 | 100,00 | ||||
| 2026-02-12 | 13F | M&G Plc | 652 | 136 | ||||||
| 2026-02-13 | 13F | Barclays Plc | 61.058 | -10,10 | 12.784 | 78,86 | ||||
| 2026-01-07 | 13F | Retirement Wealth Solutions LLC | 34 | 13,33 | 7 | 40,00 | ||||
| 2026-02-13 | 13F | Bridgefront Capital, LLC | 0 | -100,00 | 0 | |||||
| 2026-02-13 | 13F | Dynamic Technology Lab Private Ltd | 6.890 | 299,42 | 1.443 | 392,49 | ||||
| 2026-01-29 | 13F | UBS Group AG | 188.063 | 119,09 | 39.375 | 169,61 | ||||
| 2026-02-10 | 13F | Peapack Gladstone Financial Corp | 0 | -100,00 | 0 | |||||
| 2026-02-10 | 13F | Connor, Clark & Lunn Investment Management Ltd. | 49.744 | 81,86 | 10.415 | 123,81 | ||||
| 2026-02-10 | 13F | Hillsdale Investment Management Inc. | 45 | -25,00 | 9 | -10,00 | ||||
| 2026-02-13 | 13F | Citigroup Inc | 99.719 | -30,86 | 20.878 | -14,91 | ||||
| 2025-11-12 | 13F | Creative Financial Designs Inc /adv | 0 | -100,00 | 0 | |||||
| 2026-01-21 | 13F | Portside Wealth Group, LLC | 1.434 | 300 | ||||||
| 2026-02-13 | 13F | MAI Capital Management | 360 | -3,49 | 75 | 19,05 | ||||
| 2025-11-20 | 13F/A | BRYN MAWR TRUST Co | 0 | -100,00 | 0 | -100,00 | ||||
| 2026-01-27 | 13F | Forum Financial Management, LP | 1.310 | 274 | ||||||
| 2026-02-11 | 13F | Inceptionr Llc | 3.009 | 78,58 | 630 | 119,93 | ||||
| 2026-02-17 | 13F | Zacks Investment Management | 17.779 | 65,97 | 3.722 | 104,28 | ||||
| 2025-11-06 | 13F | CENTRAL TRUST Co | 0 | -100,00 | 0 | |||||
| 2026-02-17 | 13F | Citadel Advisors Llc | 0 | -100,00 | 0 | |||||
| 2025-11-13 | 13F | Renaissance Technologies Llc | 0 | -100,00 | 0 | |||||
| 2026-02-02 | 13F | Strs Ohio | 30.900 | 692,31 | 6.470 | 875,72 | ||||
| 2026-01-30 | 13F | Moody Aldrich Partners Llc | 15.618 | -55,28 | 3.270 | -44,98 | ||||
| 2026-02-09 | 13F | Hantz Financial Services, Inc. | 25.448 | 18.611,76 | 5 | |||||
| 2026-02-10 | 13F/A | Northwestern Mutual Wealth Management Co | 1.624 | -27,01 | 340 | -10,05 | ||||
| 2026-02-24 | 13F | Bell Investment Advisors, Inc | 53 | 178,95 | 11 | 266,67 | ||||
| 2026-01-28 | 13F | Proathlete Wealth Management Llc | 137 | 0,00 | 29 | 21,74 | ||||
| 2026-02-12 | 13F | Rossby Financial, LCC | 5 | 25,00 | 1 | |||||
| 2026-02-02 | 13F | Principal Financial Group Inc | 579.542 | -3,44 | 121.339 | 18,83 | ||||
| 2026-02-17 | 13F | Raymond James Financial Inc | 84.857 | -5,07 | 17.766 | 16,82 | ||||
| 2026-02-11 | 13F | Harvest Fund Management Co., Ltd | 1.224 | 0,00 | 0 | |||||
| 2026-02-17 | 13F | Blair William & Co/il | 1.986 | -10,58 | 416 | 10,08 | ||||
| 2026-02-13 | 13F | Southernsun Asset Management, Llc | 123.450 | -28,07 | 25.847 | -11,49 | ||||
| 2026-02-24 | 13F | Amanah Holdings Trust | 85.000 | 17.796 | ||||||
| 2026-01-12 | 13F | Abound Wealth Management | 6 | 200,00 | 1 | |||||
| 2025-11-14 | 13F | Texas Permanent School Fund | 0 | -100,00 | 0 | -100,00 | ||||
| 2026-02-24 | 13F | MidFirst Bank | 2.016 | 5 | ||||||
| 2026-02-11 | 13F | Los Angeles Capital Management Llc | 33.986 | -7,44 | 6.988 | 11,85 | ||||
| 2026-02-17 | 13F | Shelton Capital Management | 1.441 | -7,92 | 302 | 13,16 | ||||
| 2026-02-17 | 13F | Summit Partners Public Asset Management, Llc | 320.918 | 27,96 | 67.191 | 57,47 | ||||
| 2026-02-06 | 13F | Larson Financial Group LLC | 101 | 13,48 | 21 | 40,00 | ||||
| 2026-02-12 | 13F | Oak Associates Ltd /oh/ | 25.014 | -7,19 | 5.237 | 130.825,00 | ||||
| 2025-09-29 | NP | LFVAX - Lord Abbett Focused Small Cap Value Fund Class A | 15.470 | -20,86 | 2.149 | 12,87 | ||||
| 2025-12-16 | 13F | Garde Capital, Inc. | 0 | -100,00 | 0 | |||||
| 2026-02-11 | 13F | Twin Tree Management, LP | 153 | 32 | ||||||
| 2026-02-17 | 13F | Susquehanna Fundamental Investments, Llc | 1.650 | 0,00 | 345 | 23,21 | ||||
| 2026-01-23 | 13F | Assetmark, Inc | 1.656 | 7,95 | 347 | 33,08 | ||||
| 2026-01-07 | 13F | Hilltop National Bank | 1.023 | -14,25 | 214 | 5,94 | ||||
| 2026-01-13 | 13F | Compton Wealth Advisory Group, LLC | 2.040 | 0,00 | 427 | 23,05 | ||||
| 2026-02-03 | 13F | Farmers & Merchants Investments Inc | 22 | -8,33 | 5 | 0,00 | ||||
| 2025-11-12 | 13F | Simplex Trading, Llc | Put | 0 | -100,00 | 0 | ||||
| 2026-01-13 | 13F | Fort Washington Investment Advisors Inc /oh/ | 85.162 | -15,28 | 17.830 | 4,26 | ||||
| 2026-02-13 | 13F | Squarepoint Ops LLC | 0 | -100,00 | 0 | |||||
| 2026-02-17 | 13F | SageView Advisory Group, LLC | 441 | 92 | ||||||
| 2025-11-14 | 13F | Bayesian Capital Management, LP | 0 | -100,00 | 0 | |||||
| 2026-01-23 | 13F | Burney Co/ | 2.975 | -35,47 | 623 | -20,66 | ||||
| 2026-02-12 | 13F | CIBC Private Wealth Group, LLC | 906 | 6,84 | 190 | 31,25 | ||||
| 2026-02-17 | 13F | Glenmede Trust Co Na | 4.470 | -53,67 | 936 | 1,74 | ||||
| 2026-02-13 | 13F | Visionary Wealth Advisors | 11.489 | 0,18 | 2.405 | 23,27 | ||||
| 2026-01-14 | 13F | Exchange Traded Concepts, Llc | 824 | 173 | ||||||
| 2026-02-17 | 13F | Bamco Inc /ny/ | 299.141 | -23,69 | 62.631 | -6,09 | ||||
| 2025-10-24 | 13F | Hemington Wealth Management | 86 | 3,61 | 0 | |||||
| 2025-09-29 | NP | KCXIX - Knights of Columbus U.S. All Cap Index Fund I Shares | 168 | 3,07 | 23 | 53,33 | ||||
| 2026-02-09 | 13F | New Age Alpha Advisors, LLC | 0 | -100,00 | 0 | |||||
| 2026-02-09 | 13F | Quest Partners LLC | 104 | -88,31 | 22 | -86,09 | ||||
| 2026-02-23 | 13F | Virtu Financial LLC | 5.131 | 1 | ||||||
| 2025-09-29 | NP | CRSSX - CATHOLIC RESPONSIBLE INVESTMENTS SMALL-CAP FUND Institutional Shares | 14.893 | -1,49 | 2.069 | 40,49 | ||||
| 2026-02-03 | 13F | Crossmark Global Holdings, Inc. | 2.059 | 1,48 | 431 | 24,93 | ||||
| 2026-02-13 | 13F | Smartleaf Asset Management LLC | 1.367 | 19,28 | 292 | 52,36 | ||||
| 2026-02-13 | 13F | Stifel Financial Corp | 22.352 | 10,78 | 4.680 | 36,33 | ||||
| 2026-02-17 | 13F | Maryland State Retirement & Pension System | 5.530 | 2,16 | 1.158 | 25,76 | ||||
| 2025-11-12 | 13F | Group One Trading, L.p. | Put | 0 | -100,00 | 0 | -100,00 | |||
| 2026-02-13 | 13F | Journey Strategic Wealth Llc | 1.166 | 244 | ||||||
| 2026-02-10 | 13F | Private Wealth Asset Management, LLC | 2 | 0,00 | 0 | |||||
| 2026-02-17 | 13F | Captrust Financial Advisors | 12.533 | 6,51 | 2.624 | 31,07 | ||||
| 2025-09-29 | NP | RSSL - Global X Russell 2000 ETF | 19.260 | -15,27 | 2.676 | 20,82 | ||||
| 2026-02-18 | 13F | GWM Advisors LLC | 0 | -100,00 | 0 | |||||
| 2026-02-06 | 13F | Handelsbanken Fonder AB | 91.446 | 83,66 | 19 | 137,50 | ||||
| 2026-01-20 | 13F | Savvy Advisors, Inc. | 1.712 | 0,47 | 358 | 23,88 | ||||
| 2026-02-10 | 13F | Goldman Sachs Group Inc | Call | 12.000 | 2.512 | |||||
| 2026-02-17 | 13F | Qube Research & Technologies Ltd | 98.119 | 20.543 | ||||||
| 2026-01-21 | 13F | SJS Investment Consulting Inc. | 3 | 50,00 | 1 | |||||
| 2026-02-13 | 13F | Arrowstreet Capital, Limited Partnership | 286.749 | 131,42 | 60.037 | 184,79 | ||||
| 2025-11-14 | 13F | Manchester Capital Management LLC | 325 | 0,00 | 55 | 27,91 | ||||
| 2026-01-23 | 13F | Hardman Johnston Global Advisors LLC | 121.984 | -12,75 | 25.540 | 7,36 | ||||
| 2026-02-10 | 13F | Goldman Sachs Group Inc | 532.565 | 43,96 | 111.503 | 77,15 | ||||
| 2026-02-11 | 13F | Ameritas Investment Partners, Inc. | 3.114 | 652 | ||||||
| 2026-02-17 | 13F | Atom Investors LP | 41.372 | 8.662 | ||||||
| 2026-02-09 | 13F | Keating Financial Advisory Services, Inc. | 44 | 9 | ||||||
| 2026-01-08 | 13F | Versant Capital Management, Inc | 956 | 0,00 | 200 | 23,46 | ||||
| 2026-02-13 | 13F | Morgan Stanley | 391.641 | 12,21 | 81.998 | 38,08 | ||||
| 2026-02-12 | 13F | Callan Family Office, LLC | 2.798 | 586 | ||||||
| 2026-02-11 | 13F | Financiere des Professionnels - Fonds d,investissement inc. | 2.696 | 0,00 | 564 | 23,14 | ||||
| 2026-02-17 | 13F | DV Trading LLC | 1 | 0 | ||||||
| 2025-09-29 | NP | RIVSX - River Oak Discovery Fund | 8.735 | -13,27 | 1.213 | 23,65 | ||||
| 2026-01-27 | 13F | Evergreen Capital Management Llc | 2.960 | 0,65 | 620 | 23,80 | ||||
| 2026-02-12 | 13F | Fuller & Thaler Asset Management, Inc. | 427.674 | 1.734,09 | 89.542 | 2.157,17 | ||||
| 2026-02-09 | 13F | Jefferies Financial Group Inc. | 7.650 | 1.602 | ||||||
| 2026-02-17 | 13F | Millennium Management Llc | 201.369 | 18,59 | 42.161 | 45,94 | ||||
| 2026-02-17 | 13F | G2 Investment Partners Management LLC | 82.759 | 47,67 | 17.327 | 81,72 | ||||
| 2025-09-29 | NP | CFSSX - Column Small Cap Select Fund | 8.699 | -0,33 | 1.302 | 30,07 | ||||
| 2026-01-15 | 13F | Trust Co | 5 | 1 | ||||||
| 2026-02-17 | 13F | Tower Research Capital LLC (TRC) | 1.885 | 57,48 | 395 | 94,09 | ||||
| 2026-02-12 | 13F | Nuveen, LLC | 99.206 | -0,05 | 20.771 | 22,99 | ||||
| 2026-02-10 | 13F/A | MJT & Associates Financial Advisory Group, Inc. | 40 | 0,00 | 8 | 33,33 | ||||
| 2026-02-11 | 13F | IMA Wealth, Inc. | 22 | 5 | ||||||
| 2026-02-10 | 13F | Norges Bank | 589.400 | 123.403 | ||||||
| 2026-02-12 | 13F | Principal Securities, Inc. | 1.152 | 8,47 | 241 | 33,89 | ||||
| 2026-02-17 | 13F | Optiver Holding B.V. | 10 | -79,17 | 2 | -75,00 | ||||
| 2026-02-05 | 13F | Dana Investment Advisors, Inc. | 64.236 | 11,67 | 13.449 | 37,43 | ||||
| 2026-02-17 | 13F | MIRAE ASSET GLOBAL ETFS HOLDINGS Ltd. | 17.478 | -0,27 | 3.659 | 22,74 | ||||
| 2026-01-29 | 13F | UMA Financial Services, Inc. | 12 | 100,00 | 3 | 100,00 | ||||
| 2025-09-29 | NP | CFSLX - Column Small Cap Fund | 1.486 | -2,24 | 222 | 27,59 | ||||
| 2026-02-13 | 13F | Neuberger Berman Group LLC | 753.753 | -19,91 | 157.813 | -1,44 | ||||
| 2026-01-27 | 13F | Zurcher Kantonalbank (Zurich Cantonalbank) | 13.010 | 2,70 | 2.724 | 26,36 | ||||
| 2026-02-17 | 13F | Weiss Asset Management LP | 10.168 | 2.129 | ||||||
| 2026-02-11 | 13F | Gilpin Wealth Management, Llc | 3 | 1 | ||||||
| 2026-02-09 | 13F | Fisher Asset Management, LLC | 394.186 | 36,15 | 82.531 | 67,54 | ||||
| 2026-01-30 | 13F | Keybank National Association/oh | 3.076 | 644 | ||||||
| 2026-02-12 | 13F | Robotti Robert | 2.725 | -42,33 | 571 | -29,02 | ||||
| 2026-02-17 | 13F | Guggenheim Capital Llc | 3.467 | 726 | ||||||
| 2026-02-06 | 13F | IFP Advisors, Inc | 21 | -30,00 | 4 | -20,00 | ||||
| 2026-02-13 | 13F | Charles Schwab Investment Management Inc | 471.510 | -2,61 | 98.720 | 19,85 | ||||
| 2026-02-13 | 13F | Lord, Abbett & Co. Llc | 114.170 | -49,07 | 24 | -39,47 | ||||
| 2026-01-15 | 13F | Nisa Investment Advisors, Llc | 5.069 | -0,39 | 1.061 | 22,66 | ||||
| 2026-02-17 | 13F | Banco Bilbao Vizcaya Argentaria, S.a. | 0 | -100,00 | 0 | |||||
| 2026-02-13 | 13F | Mml Investors Services, Llc | 7.717 | 7,23 | 1.616 | 31,94 | ||||
| 2026-01-30 | 13F | New York State Teachers Retirement System | 57.072 | -0,17 | 12 | 22,22 | ||||
| 2025-11-07 | 13F | Synovus Financial Corp | 7.515 | -24,89 | 1.279 | -3,55 | ||||
| 2026-01-21 | 13F | Greenleaf Trust | 1.055 | 221 | ||||||
| 2026-02-11 | 13F | Parallel Advisors, LLC | 436 | 1,63 | 91 | 26,39 | ||||
| 2026-01-12 | 13F | Heritage Family Offices, LLP | 1.927 | -20,70 | 403 | -2,42 | ||||
| 2026-02-02 | 13F | Fifth Third Bancorp | 665 | -1,63 | 139 | 20,87 | ||||
| 2026-02-09 | 13F | Jackson Creek Investment Advisors LLC | 2.127 | -37,44 | 0 | |||||
| 2026-01-07 | 13F | Massmutual Trust Co Fsb/adv | 180 | 25,87 | 38 | 54,17 | ||||
| 2025-11-14 | 13F | Trexquant Investment LP | 0 | -100,00 | 0 | |||||
| 2026-02-12 | 13F | Skopos Labs, Inc. | 1.804 | 392 | ||||||
| 2026-02-13 | 13F | Pinnacle Wealth Planning Services, Inc. | 801 | 168 | ||||||
| 2026-02-06 | 13F | ProShare Advisors LLC | 7.332 | 3,21 | 1.535 | 27,07 | ||||
| 2026-02-17 | 13F | 4D Advisors, LLC | 15.000 | 3.141 | ||||||
| 2026-02-10 | 13F | Root Financial Partners, LLC | 81 | 2,53 | 17 | 23,08 | ||||
| 2026-02-10 | 13F | CIBC Asset Management Inc | 1.226 | -49,92 | 257 | -38,46 | ||||
| 2026-01-30 | 13F/A | M&t Bank Corp | 8.959 | 16,67 | 1.876 | 43,68 | ||||
| 2025-11-13 | 13F | Riggs Asset Managment Co. Inc. | 0 | -100,00 | 0 | |||||
| 2026-02-12 | 13F | MetLife Investment Management, LLC | 82.991 | -27,30 | 17.376 | -10,54 | ||||
| 2026-02-05 | 13F | Integrated Investment Consultants, LLC | 2.741 | -3,42 | 574 | 18,88 | ||||
| 2026-02-13 | 13F | Ubs Asset Management Americas Inc | 95.785 | 2,21 | 20.055 | 25,79 | ||||
| 2026-02-12 | 13F | Ensign Peak Advisors, Inc | 4.036 | -46,30 | 845 | -33,88 | ||||
| 2026-02-13 | 13F | Macquarie Group Ltd | 0 | -100,00 | 0 | -100,00 | ||||
| 2026-01-22 | 13F | Massachusetts Financial Services Co /ma/ | 566.418 | -21,32 | 118.591 | -3,17 | ||||
| 2026-02-12 | 13F | Peterson Wealth Services | 6.399 | 70,50 | 1.340 | 20,85 | ||||
| 2026-01-29 | 13F | Pictet Asset Management Holding SA | 5.959 | 4,49 | 1.248 | 28,56 | ||||
| 2025-09-29 | NP | OWLLX - CHANNING INTRINSIC VALUE SMALL-CAP FUND Institutional Class | 1.642 | -20,06 | 228 | 14,00 | ||||
| 2026-01-26 | 13F | KBC Group NV | 1.144 | 0,00 | 0 | |||||
| 2026-02-13 | 13F | K2 Principal Fund, L.p. | Put | 2.000 | 419 | |||||
| 2025-11-21 | 13F/A | CIBC Bancorp USA Inc. | 4.021 | 684 | ||||||
| 2026-02-13 | 13F | Toroso Investments, LLC | 11.037 | 201,72 | 2.311 | 271,38 | ||||
| 2026-02-06 | 13F | Profund Advisors Llc | 1.692 | -0,24 | 354 | 22,92 | ||||
| 2026-02-09 | 13F | Roubaix Capital, LLC | 0 | -100,00 | 0 | |||||
| 2026-02-06 | 13F | Bare Financial Services, Inc | 90 | 4,65 | 19 | 28,57 | ||||
| 2026-01-27 | 13F | WealthCollab, LLC | 52 | 0,00 | 11 | 25,00 | ||||
| 2026-02-17 | 13F | Amundi | 11.297 | -9,10 | 2.365 | 8,14 | ||||
| 2026-02-12 | 13F | Cloud Capital Management, LLC | 0 | -100,00 | 0 | |||||
| 2026-01-07 | 13F | Central Pacific Bank - Trust Division | 590 | -22,37 | 124 | -4,65 | ||||
| 2026-02-11 | 13F | Vise Technologies, Inc. | 1.874 | 39,23 | 392 | 71,18 | ||||
| 2026-02-06 | 13F | HighTower Advisors, LLC | 16.755 | -6,96 | 3.508 | 14,46 | ||||
| 2026-02-12 | 13F | Chilton Capital Management Llc | 6 | 1 | ||||||
| 2026-01-30 | 13F | Turning Point Benefit Group, Inc. | 7 | 1 | ||||||
| 2026-02-12 | 13F | California Public Employees Retirement System | 65.758 | -2,38 | 13.768 | 20,13 | ||||
| 2026-02-26 | 13F | TD Capital Management LLC | 5 | 1 | ||||||
| 2026-02-12 | 13F | McMillan Office, Inc. | 27 | 6 | ||||||
| 2026-02-18 | 13F | State of Tennessee, Treasury Department | 15.097 | -7,99 | 3.855 | 38,12 | ||||
| 2026-01-28 | 13F | Teacher Retirement System Of Texas | 9.769 | -32,96 | 2.045 | -17,51 | ||||
| 2026-02-02 | 13F | Qrg Capital Management, Inc. | 5.790 | 13,55 | 1.212 | 39,79 | ||||
| 2026-02-13 | 13F | Kilter Group LLC | 17 | 4 | ||||||
| 2026-01-29 | 13F | Calamos Advisors LLC | 15.305 | 26,11 | 3.204 | 55,23 | ||||
| 2026-02-17 | 13F | Sandler Capital Management | 0 | -100,00 | 0 | |||||
| 2026-02-06 | 13F | Covestor Ltd | 86 | 0,00 | 0 | |||||
| 2026-02-12 | 13F | Commonwealth Equity Services, Llc | 2.154 | 6,74 | 451 | |||||
| 2026-02-14 | 13F | Howe & Rusling Inc | 1.676 | -22,73 | 351 | -5,15 | ||||
| 2026-02-12 | 13F | Integrated Quantitative Investments LLC | 8.944 | 1.873 | ||||||
| 2026-02-13 | 13F | Public Employees Retirement Association Of Colorado | 4.452 | 0,00 | 1 | |||||
| 2025-11-14 | 13F | ExodusPoint Capital Management, LP | 0 | -100,00 | 0 | -100,00 | ||||
| 2026-02-12 | 13F | Federation des caisses Desjardins du Quebec | 25 | 5 | ||||||
| 2026-02-10 | 13F | Globeflex Capital L P | 1.103 | 0,00 | 231 | 22,99 | ||||
| 2026-02-13 | 13F | Sei Investments Co | 203.463 | -12,81 | 42.599 | 7,29 | ||||
| 2026-02-10 | 13F | Bank of New York Mellon Corp | 258.372 | -12,02 | 54.095 | 8,26 | ||||
| 2026-02-09 | 13F | Royce & Associates Lp | 51.076 | -17,05 | 10.694 | 2,07 | ||||
| 2026-02-11 | 13F | Group One Trading, L.p. | Call | 3.400 | -32,00 | 712 | -16,35 | |||
| 2026-02-17 | 13F | Canada Pension Plan Investment Board | 1.600 | -52,94 | 335 | -42,21 | ||||
| 2026-02-12 | 13F | Jane Street Group, Llc | 19.562 | 26,03 | 4.096 | 55,11 | ||||
| 2026-01-26 | 13F | Merit Financial Group, LLC | 8.542 | 1.788 | ||||||
| 2026-02-12 | 13F | Jane Street Group, Llc | Put | 3.900 | 817 | |||||
| 2026-02-02 | 13F | Pinnacle Wealth Management Advisory Group, LLC | 1.455 | 0,00 | 305 | 23,08 | ||||
| 2026-02-12 | 13F | Jane Street Group, Llc | Call | 16.100 | 47,71 | 3.371 | 81,77 | |||
| 2026-01-22 | 13F | Ifrah Financial Services, Inc. | 2.019 | -10,11 | 423 | 10,47 | ||||
| 2026-02-17 | 13F | NorthRock Partners, LLC | 7.134 | -10,62 | 1.494 | 9,94 | ||||
| 2025-09-29 | NP | PSI - Invesco Dynamic Semiconductors ETF This fund is a listed as child fund of Invesco Ltd. and if that institution has disclosed ownership in this security, then these positions will not be double counted when calculating total shares and total value | 145.754 | -14,84 | 20.248 | 13,56 | ||||
| 2026-02-11 | 13F | Franklin Resources Inc | 487.494 | 55,42 | 102.067 | 91,72 | ||||
| 2026-01-12 | 13F | Legacy Wealth Asset Management, LLC | 1.604 | 336 | ||||||
| 2026-02-17 | 13F | Schonfeld Strategic Advisors LLC | 0 | -100,00 | 0 | |||||
| 2026-02-13 | 13F | Channing Capital Management, LLC | 297.581 | -20,95 | 62.305 | -2,72 | ||||
| 2026-02-11 | 13F | GW&K Investment Management, LLC | 681.560 | 143 | ||||||
| 2026-02-06 | 13F | Leonteq Securities AG | 217 | 12,44 | 45 | 40,63 | ||||
| 2026-02-14 | 13F | Rockefeller Capital Management L.P. | 1.334 | 47,73 | 279 | 82,35 | ||||
| 2026-01-16 | 13F | Ronald Blue Trust, Inc. | 3.241 | 0,28 | 679 | 23,50 | ||||
| 2025-09-29 | NP | SAWS - AAM SAWGRASS U.S. SMALL CAP QUALITY GROWTH ETF | 139 | 57,95 | 19 | 137,50 | ||||
| 2026-02-17 | 13F | California State Teachers Retirement System | 35.735 | 2,62 | 7.482 | 26,28 | ||||
| 2026-01-30 | 13F | State of New Jersey Common Pension Fund D | 13.704 | -9,42 | 2.869 | 11,46 | ||||
| 2026-02-17 | 13F | Creative Planning | 43.844 | 19,12 | 9.180 | 46,58 | ||||
| 2025-11-12 | 13F | Quantbot Technologies LP | 0 | -100,00 | 0 | |||||
| 2026-02-17 | 13F | Janus Henderson Group Plc | 17.122 | 7,54 | 3.582 | 32,19 | ||||
| 2026-01-14 | 13F | Jfs Wealth Advisors, Llc | 25 | 150,00 | 5 | 400,00 | ||||
| 2026-02-17 | 13F | Crawford Investment Counsel Inc | 50.883 | -15,65 | 10.653 | 3,80 | ||||
| 2026-02-17 | 13F | T. Rowe Price Investment Management, Inc. | 40.094 | -82,98 | 8 | -80,00 | ||||
| 2026-02-13 | 13F | American Century Companies Inc | 8.845 | 19,83 | 1.852 | 47,49 | ||||
| 2026-02-11 | 13F | LPL Financial LLC | 43.682 | 16,13 | 9.146 | 42,91 | ||||
| 2026-01-07 | 13F | Green Alpha Advisors, LLC | 10.319 | -1,47 | 2.161 | 21,28 | ||||
| 2026-02-17 | 13F | D. E. Shaw & Co., Inc. | 1.600 | -75,58 | 335 | -70,02 | ||||
| 2026-02-13 | 13F | Prudential Financial Inc | 54.103 | 43,78 | 11.328 | 76,93 | ||||
| 2026-02-12 | 13F | Pitcairn Co | 0 | -100,00 | 0 | |||||
| 2026-02-13 | 13F | State Street Corp | 1.537.888 | -5,75 | 321.988 | 15,98 | ||||
| 2026-01-30 | 13F | Sage Rhino Capital Llc | 1.342 | -1,40 | 281 | 21,21 | ||||
| 2026-02-10 | 13F | Intech Investment Management Llc | 12.345 | 0,00 | 2.585 | 23,05 | ||||
| 2026-02-17 | 13F | Bank Of America Corp /de/ | 909.748 | 2,42 | 190.474 | 26,04 | ||||
| 2025-11-14 | 13F | Verition Fund Management LLC | 0 | -100,00 | 0 | |||||
| 2026-01-08 | 13F | NorthCrest Asset Manangement, LLC | 8.832 | -0,06 | 2.011 | 31,46 | ||||
| 2026-01-08 | 13F | Cooper Financial Group | 1.000 | 209 | ||||||
| 2025-11-14 | 13F | Summit Partners Public Asset Management, Llc | Put | 0 | -100,00 | 0 | -100,00 | |||
| 2026-02-13 | 13F | Manufacturers Life Insurance Company, The | 0 | -100,00 | 0 | |||||
| 2026-02-11 | 13F | O'shaughnessy Asset Management, Llc | 7.091 | 19,78 | 1.485 | 47,37 | ||||
| 2026-02-13 | 13F | Marshall Wace, Llp | 8.540 | 1.788 | ||||||
| 2026-01-07 | 13F | IAM Advisory, LLC | 5.132 | 1.075 | ||||||
| 2026-01-09 | 13F | Park Place Capital Corp | 242 | 51 | ||||||
| 2026-02-13 | 13F | FORA Capital, LLC | 2.179 | 433 | ||||||
| 2026-01-21 | 13F | Sowell Financial Services LLC | 1.249 | 262 | ||||||
| 2026-02-19 | 13F | Invesco Ltd. | 1.574.009 | -1,41 | 329.550 | 21,32 | ||||
| 2026-02-05 | 13F | Thrivent Financial For Lutherans | 25.936 | -4,53 | 5 | 25,00 | ||||
| 2026-01-23 | 13F | Portman Square Capital LLP | Put | 56.200 | -63,44 | 11.767 | -55,01 | |||
| 2026-02-06 | 13F | Global Retirement Partners, LLC | 92 | 21,05 | 19 | 58,33 | ||||
| 2026-01-09 | 13F | Assenagon Asset Management S.A. | 14.671 | -27,20 | 3.072 | -10,41 | ||||
| 2026-02-02 | 13F | Horizon Investments, LLC | 824 | 173 | ||||||
| 2026-02-05 | 13F | Amalgamated Bank | 10.972 | 1,20 | 2 | 100,00 | ||||
| 2026-01-14 | 13F | USA Financial Portformulas Corp | 209 | -33,86 | 44 | -18,87 | ||||
| 2026-02-17 | 13F | Northern Trust Corp | 404.083 | -4,29 | 84.603 | 17,78 | ||||
| 2026-02-13 | 13F | Mariner, LLC | 5.949 | -37,87 | 1.245 | -23,63 | ||||
| 2026-02-17 | 13F | Pinnacle Financial Partners, Inc. | 8.563 | 1.793 | ||||||
| 2026-01-26 | 13F | Campbell Newman Asset Management Inc | 9.334 | 1.954 | ||||||
| 2026-02-17 | 13F | Point72 Asset Management, L.P. | 102.192 | 2.738,67 | 21.396 | 3.395,92 | ||||
| 2025-09-29 | NP | CVSIX - Calamos Market Neutral Income Fund Class A | Short | -26.300 | 20,64 | -3.654 | 72,07 | |||
| 2026-02-10 | 13F | Measured Wealth Private Client Group, LLC | 233 | 9,91 | 49 | 33,33 | ||||
| 2026-02-17 | 13F | Citadel Advisors Llc | Call | 47.700 | -34,48 | 9.987 | -19,38 | |||
| 2026-02-17 | 13F | Alliancebernstein L.p. | 563.547 | 1.131,77 | 117.990 | 1.415,79 | ||||
| 2026-02-17 | 13F | Wiley Bros.-aintree Capital, Llc | 15.516 | 63,69 | 3.248 | 101,49 | ||||
| 2026-02-17 | 13F | Citadel Advisors Llc | Put | 9.100 | 5,81 | 1.905 | 30,21 | |||
| 2026-02-13 | 13F | Wells Fargo & Company/mn | 291.931 | -6,10 | 61.122 | 15,56 | ||||
| 2026-02-11 | 13F | Picton Mahoney Asset Management | 4.297 | 900 | ||||||
| 2026-02-17 | 13F | Susquehanna Portfolio Strategies, LLC | 14.944 | 0,00 | 3.129 | 23,05 | ||||
| 2026-02-02 | 13F | Danske Bank A/s | 200 | 0,00 | 42 | 20,59 | ||||
| 2026-02-04 | 13F | Virginia Retirement Systems Et Al | 8.862 | 40,40 | 1.855 | 72,88 | ||||
| 2026-02-13 | 13F | Bridgewater Associates, LP | 4.849 | -48,81 | 1.015 | -37,00 | ||||
| 2026-02-04 | 13F | HighPoint Advisor Group LLC | 2.042 | 18,38 | 428 | 45,73 | ||||
| 2026-02-17 | 13F | Abel Hall, LLC | 2.214 | 464 | ||||||
| 2025-11-07 | 13F | Shell Asset Management Co | 519 | -59,45 | 0 | |||||
| 2026-02-12 | 13F | Loomis Sayles & Co L P | 489.500 | -7,27 | 102.487 | 14,11 | ||||
| 2026-02-17 | 13F | Cetera Investment Advisers | 22.551 | -7,26 | 4.722 | 14,12 | ||||
| 2026-01-26 | 13F | Cwm, Llc | 2.001 | 8,34 | 0 | |||||
| 2026-02-18 | 13F | Vident Advisory, LLC | 3.819 | -27,51 | 800 | -10,83 | ||||
| 2026-02-10 | 13F | Envestnet Asset Management Inc | 247.786 | -5,61 | 51.879 | 16,15 | ||||
| 2026-01-30 | 13F | Activest Wealth Management | 1 | 0,00 | 0 | |||||
| 2026-01-29 | 13F | Dunhill Financial, LLC | 1 | 0 | ||||||
| 2026-02-05 | 13F | Navalign, LLC | 1.020 | 214 | ||||||
| 2026-01-29 | 13F | D.a. Davidson & Co. | 1.842 | -0,97 | 386 | 21,84 | ||||
| 2026-02-17 | 13F | Boothbay Fund Management, Llc | 19.891 | 49,13 | 4.165 | 83,52 | ||||
| 2026-01-15 | 13F | Allspring Global Investments Holdings, LLC | 2.279 | 506 | ||||||
| 2025-09-29 | NP | CFMCX - Column Mid Cap Fund | 386 | 58 | ||||||
| 2026-02-18 | 13F | First Citizens Bank & Trust Co | 4.852 | 3,65 | 1.016 | 27,51 | ||||
| 2026-02-12 | 13F | Swiss National Bank | 74.300 | 1,78 | 15.556 | 25,25 | ||||
| 2026-02-17 | 13F | NEOS Investment Management LLC | 25.895 | 88,81 | 5.422 | 132,36 | ||||
| 2026-01-08 | 13F | Wealth Enhancement Advisory Services, Llc | 4.464 | 2,20 | 1.043 | 38,15 | ||||
| 2026-01-12 | 13F | Rialto Wealth Management, LLC | 17 | 0,00 | 4 | 50,00 | ||||
| 2026-02-05 | 13F | Gabelli Funds Llc | 7.000 | -31,04 | 1.466 | -15,17 | ||||
| 2026-02-10 | 13F | Rothschild Investment Llc | 39 | 11,43 | 8 | 60,00 | ||||
| 2025-11-14 | 13F | Dark Forest Capital Management Lp | 14.231 | 0,00 | 1.886 | 0,00 | ||||
| 2026-02-10 | 13F | Mutual Of America Capital Management Llc | 38.968 | -0,34 | 8.159 | 22,64 | ||||
| 2026-01-13 | 13F | Trust Point Inc. | 1.982 | -3,41 | 415 | 18,62 | ||||
| 2026-02-10 | 13F | Ritter Daniher Financial Advisory LLC / DE | 75 | 16 | ||||||
| 2026-02-09 | 13F | Hartline Investment Corp/ | 1.174 | -0,34 | 246 | 22,50 | ||||
| 2026-02-13 | 13F | Parkside Financial Bank & Trust | 171 | 8,23 | 36 | 34,62 | ||||
| 2026-02-11 | 13F | Hughes Financial Services, LLC | 10 | -16,67 | 2 | 0,00 | ||||
| 2026-01-05 | 13F | Park Avenue Securities Llc | 0 | -100,00 | 0 | |||||
| 2025-11-14 | 13F | Capstone Investment Advisors, Llc | 1.182 | 201 | ||||||
| 2026-01-16 | 13F | DiNuzzo Private Wealth, Inc. | 6 | 0,00 | 1 | |||||
| 2026-02-13 | 13F | Acumen Wealth Advisors, LLC | 61 | 13 | ||||||
| 2025-11-03 | 13F | Summit Global Investments | 0 | -100,00 | 0 | |||||
| 2026-02-13 | 13F | Transamerica Financial Advisors, Inc. | 10 | 2 | ||||||
| 2026-01-13 | 13F | Norden Group Llc | 2.032 | 425 | ||||||
| 2026-02-11 | 13F | Empowered Funds, LLC | 1.193 | -2,69 | 250 | 19,71 | ||||
| 2026-01-27 | 13F | Krilogy Financial LLC | 829 | 218 | ||||||
| 2026-02-06 | 13F | Legato Capital Management LLC | 21.203 | -6,65 | 4.439 | 14,88 | ||||
| 2026-02-10 | 13F | Acadian Asset Management Llc | 13.959 | 3 | ||||||
| 2026-02-13 | 13F | First National Bank Of Omaha | 4.613 | -14,27 | 966 | 5,46 | ||||
| 2026-01-30 | 13F | Archer Investment Corp | 150 | 0,00 | 31 | 24,00 | ||||
| 2026-02-13 | 13F | Wexford Capital Lp | 0 | -100,00 | 0 | |||||
| 2025-11-14 | 13F | Voloridge Investment Management, Llc | 0 | -100,00 | 0 | |||||
| 2026-02-12 | 13F | QSV Equity Investors LLC | 4.027 | -57,44 | 843 | -47,61 | ||||
| 2026-02-17 | 13F | Jump Financial, LLC | 2.200 | 461 | ||||||
| 2026-02-05 | 13F | Bessemer Group Inc | 40.599 | 2.806,16 | 9 | |||||
| 2026-02-12 | 13F | Symphony Financial Services, Inc. | 1.050 | 220 | ||||||
| 2026-03-04 | 13F | Rehmann Capital Advisory Group | 1.160 | 243 | ||||||
| 2025-11-13 | 13F/A | Peak6 Llc | 0 | -100,00 | 0 | -100,00 | ||||
| 2026-02-05 | 13F | Allworth Financial LP | 676 | 16,15 | 142 | 42,42 | ||||
| 2026-02-11 | 13F | Illinois Municipal Retirement Fund | 19.481 | 4,03 | 4.079 | 28,00 | ||||
| 2026-02-11 | 13F | Jpmorgan Chase & Co | 68.193 | -71,78 | 14.278 | -65,28 | ||||
| 2026-02-17 | 13F | Wealth Watch Advisors, INC | 8 | 0,00 | 2 | 0,00 | ||||
| 2026-02-18 | 13F | Mackenzie Financial Corp | 2.370 | 0,00 | 505 | 25,06 | ||||
| 2026-02-02 | 13F | Truist Financial Corp | 8.149 | -69,57 | 1.706 | -62,55 | ||||
| 2026-02-09 | 13F | Lisanti Capital Growth, LLC | 20.261 | -0,49 | 4.242 | 22,46 | ||||
| 2025-09-29 | NP | TRFM - AAM Transformers ETF | 2.164 | 62,34 | 301 | 108,33 | ||||
| 2025-11-14 | 13F | Wolverine Trading, Llc | Call | 3.500 | 584 | |||||
| 2026-02-09 | 13F | Putnam Fl Investment Management Co | 4.782 | 0,00 | 1.001 | 23,12 | ||||
| 2025-11-14 | 13F | Wolverine Trading, Llc | Put | 2.500 | 417 | |||||
| 2026-01-13 | 13F | Mather Group, Llc. | 0 | -100,00 | 0 | |||||
| 2026-02-10 | 13F | Andar Capital Management HK Ltd | 18.950 | 3.968 | ||||||
| 2026-02-03 | 13F | Bokf, Na | 2.936 | -0,84 | 615 | 22,07 | ||||
| 2025-09-29 | NP | PRFZ - Invesco FTSE RAFI US 1500 Small-Mid ETF This fund is a listed as child fund of Invesco Ltd. and if that institution has disclosed ownership in this security, then these positions will not be double counted when calculating total shares and total value | 36.455 | 25,24 | 5.064 | 78,62 | ||||
| 2026-01-12 | 13F | David J Yvars Group | 2.005 | 0,00 | 420 | 22,87 | ||||
| 2025-11-13 | 13F | Glenmede Investment Management, LP | 6.529 | -25,82 | 1.111 | -4,80 | ||||
| 2026-01-30 | 13F | Torren Management, LLC | 299 | 63 | ||||||
| 2026-02-17 | 13F | Quantinno Capital Management LP | 11.149 | 6,98 | 2.334 | 31,64 | ||||
| 2026-01-27 | 13F | Regions Financial Corp | 1.623 | 13,34 | 340 | 39,51 | ||||
| 2026-01-23 | 13F | Avion Wealth | 4 | 0,00 | 0 | |||||
| 2026-02-17 | 13F | Ardsley Advisory Partners Lp | 73.000 | 64,04 | 15.284 | 101,88 | ||||
| 2026-01-27 | 13F | Tributary Capital Management, LLC | 139.959 | -18,78 | 29.303 | -0,05 | ||||
| 2026-02-09 | 13F | Annis Gardner Whiting Capital Advisors, LLC | 21 | 0,00 | 4 | 33,33 | ||||
| 2026-02-12 | 13F | Dimensional Fund Advisors Lp | 678.901 | -9,02 | 142.150 | 11,97 | ||||
| 2026-01-08 | 13F | True Wealth Design, LLC | 72 | 0,00 | 15 | 25,00 | ||||
| 2025-11-07 | 13F | Sierra Ocean, Llc | 0 | -100,00 | 0 | |||||
| 2026-02-13 | 13F | Ceredex Value Advisors LLC | 79.650 | -17,67 | 16.676 | 1,31 | ||||
| 2026-01-21 | 13F | Sound Income Strategies, LLC | 95 | 24 | ||||||
| 2025-11-05 | 13F | Moloney Securities Asset Management, LLC | 2.156 | -18,64 | 367 | 4,27 |
Other Listings
| DE:AVX | 272,00 € |