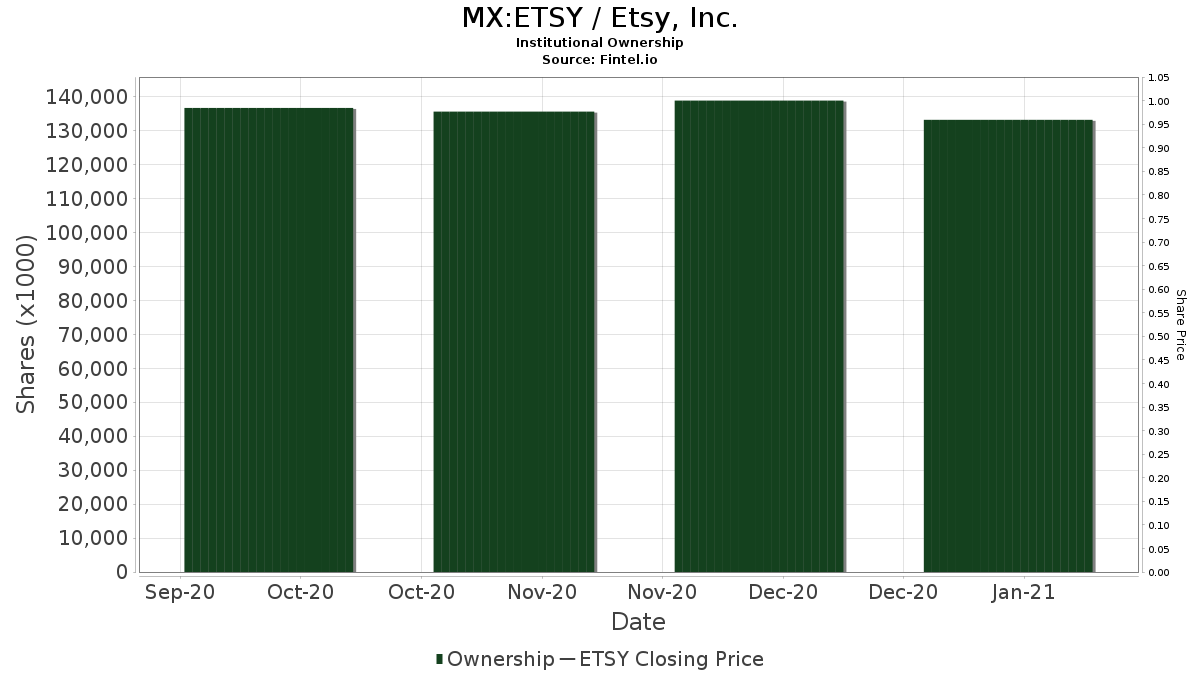
Institutionelt ejerskab og aktionærer
Etsy, Inc. (MX:ETSY) har 530 institutionelle ejere og aktionærer, der har indsendt 13D/G- eller 13F-formularer til Securities Exchange Commission (SEC). Disse institutioner har i alt 114,269,661 aktier. Største aktionærer omfatter BlackRock, Inc., Vanguard Group Inc, Renaissance Technologies Llc, Elliott Investment Management L.P., Goldman Sachs Group Inc, Aqr Capital Management Llc, Barclays Plc, Van Eck Associates Corp, State Street Corp, and Impactive Capital LP .
Etsy, Inc. (BMV:ETSY) institutionel ejerskabsstruktur viser aktuelle positioner i virksomheden efter institutioner og fonde, samt seneste ændringer i positionsstørrelse. Større aktionærer kan omfatte individuelle investorer, investeringsforeninger, hedgefonde eller institutioner. Skema 13D angiver, at investoren besidder (eller besidder) mere end 5 % af virksomheden og har til hensigt (eller har til hensigt at) aktivt at forfølge en ændring i forretningsstrategi. Skema 13G indikerer en passiv investering på over 5%.
Fondens stemningsscore
Fund Sentiment Score (fka Ownership Accumulation Score) finder de aktier, der bliver mest købt af fonde. Det er resultatet af en sofistikeret, multi-faktor kvantitativ model, der identificerer virksomheder med de højeste niveauer af institutionel akkumulering. Scoringsmodellen bruger en kombination af den samlede stigning i oplyste ejere, ændringerne i porteføljeallokeringer i disse ejere og andre målinger. Tallet går fra 0 til 100, hvor højere tal indikerer et højere niveau af akkumulering for sine jævnaldrende, og 50 er gennemsnittet.
Opdateringsfrekvens: Dagligt
Se Ownership Explorer, som giver en liste over højest rangerende virksomheder.
AI+ Ask Fintel’s AI assistant about Etsy, Inc..
Select a question to share a public post with an AI-crafted answer.
Thinking of good questions…
13F og NPORT arkivering
Detaljer om 13F-arkivering er gratis. Detaljer om NP-ansøgninger kræver et premium-medlemskab. Grønne rækker angiver nye positioner. Røde rækker angiver lukkede positioner. Klik på linket ikon for at se den fulde transaktionshistorik.
Opgrader
for at låse premium-data op og eksportere til Excel ![]() .
.
| Fil dato | Kilde | Investor | Type | Gennemsnitlig pris (Øst) |
Aktier | Δ Aktier (%) |
Rapporteret Værdi ($1000) |
Δ Værdi (%) |
Port Alloc (%) |
|
|---|---|---|---|---|---|---|---|---|---|---|
| 2026-01-20 | 13F | Stratos Wealth Partners, LTD. | 65.588 | -0,01 | 3.636 | -16,49 | ||||
| 2025-11-14 | 13F | Ilex Capital Partners (UK) LLP | 0 | -100,00 | 0 | -100,00 | ||||
| 2026-04-14 | 13F | Banque Pictet & Cie Sa | 135.916 | -0,91 | 6.793 | -10,67 | ||||
| 2026-02-13 | 13F | Neuberger Berman Group LLC | 14.567 | 5,46 | 808 | -12,00 | ||||
| 2026-02-10 | 13F | Savant Capital, LLC | 0 | -100,00 | 0 | |||||
| 2026-01-29 | 13F | UBS Group AG | Put | 318.700 | 0,00 | 17.669 | -16,49 | |||
| 2026-01-29 | 13F | UBS Group AG | Call | 1.086.550 | 0,00 | 60.238 | -16,49 | |||
| 2026-01-29 | 13F | UBS Group AG | 1.818.732 | -19,07 | 100.831 | -32,42 | ||||
| 2026-02-17 | 13F | Vinva Investment Management Ltd | 7.505 | -37,06 | 620 | -54,01 | ||||
| 2025-10-27 | 13F | First Horizon Corp | 0 | -100,00 | 0 | |||||
| 2026-02-05 | 13F | Qsemble Capital Management, LP | 0 | -100,00 | 0 | -100,00 | ||||
| 2026-02-17 | 13F | Prelude Capital Management, Llc | 0 | -100,00 | 0 | |||||
| 2026-02-13 | 13F | Squarepoint Ops LLC | Call | 95.200 | -75,07 | 5.278 | -79,18 | |||
| 2026-02-13 | 13F | Squarepoint Ops LLC | Put | 47.800 | -61,51 | 2.650 | -67,86 | |||
| 2026-02-13 | 13F | Squarepoint Ops LLC | 15.000 | 832 | ||||||
| 2025-11-07 | 13F | HighTower Advisors, LLC | Call | 0 | -100,00 | 0 | -100,00 | |||
| 2026-02-17 | 13F | Sciencast Management LP | 0 | -100,00 | 0 | |||||
| 2026-02-13 | 13F | State Street Corp | 3.225.793 | 0,73 | 178.838 | -15,88 | ||||
| 2026-04-15 | 13F | Activest Wealth Management | 63 | -57,43 | 3 | -62,50 | ||||
| 2026-02-13 | 13F | Marshall Wace, Llp | Put | 0 | -100,00 | 0 | ||||
| 2026-02-13 | 13F | Marshall Wace, Llp | Call | 0 | -100,00 | 0 | ||||
| 2026-02-17 | 13F | Price T Rowe Associates Inc /md/ | 82.075 | -79,26 | 5 | -84,62 | ||||
| 2026-02-06 | 13F | Tortoise Investment Management, LLC | 0 | -100,00 | 0 | |||||
| 2026-02-12 | 13F | Groupe la Francaise | 0 | -100,00 | 0 | |||||
| 2026-02-17 | 13F | Greenland Capital Management LP | 27.277 | 1.512 | ||||||
| 2026-02-17 | 13F | Advisor Group Holdings, Inc. | 7.821 | -61,68 | 434 | -65,05 | ||||
| 2026-02-18 | 13F | Mackenzie Financial Corp | 8.018 | -13,08 | 443 | -27,61 | ||||
| 2026-01-15 | 13F | Nisa Investment Advisors, Llc | 1.881 | -7,70 | 104 | -22,96 | ||||
| 2026-02-17 | 13F | Tudor Investment Corp Et Al | 374.285 | 20.750 | ||||||
| 2026-02-17 | 13F | Tudor Investment Corp Et Al | Put | 94.900 | 5.261 | |||||
| 2026-02-17 | 13F | Impactive Capital LP | 3.042.874 | -6,17 | 168.697 | -21,64 | ||||
| 2026-02-17 | 13F | Tudor Investment Corp Et Al | Call | 111.800 | 6.198 | |||||
| 2026-02-17 | 13F | Susquehanna Portfolio Strategies, LLC | 130.442 | 0,00 | 7.232 | -16,50 | ||||
| 2026-02-13 | 13F | Toroso Investments, LLC | Call | 26.000 | 1.441 | |||||
| 2026-02-13 | 13F | Toroso Investments, LLC | 19.275 | 8,10 | 1.069 | -9,72 | ||||
| 2026-02-17 | 13F | SummitTX Capital, L.P. | 4.537 | 0,15 | 252 | -16,33 | ||||
| 2026-02-06 | 13F | Handelsbanken Fonder AB | 31.200 | -13,81 | 2 | -50,00 | ||||
| 2026-02-12 | 13F | Steward Partners Investment Advisory, Llc | 25 | -91,44 | 1 | -94,74 | ||||
| 2026-02-13 | 13F | Level Four Advisory Services, Llc | 46.368 | -17,10 | 2.571 | -30,78 | ||||
| 2026-02-17 | 13F | Snowden Capital Advisors LLC | 7.101 | 0,72 | 394 | -16,03 | ||||
| 2026-02-10 | 13F | Bruce G. Allen Investments, LLC | 17 | 0,00 | 1 | -100,00 | ||||
| 2026-02-17 | 13F | Guggenheim Capital Llc | 18.008 | 73,60 | 998 | 45,06 | ||||
| 2025-11-12 | 13F | Ameliora Wealth Management Ltd. | 0 | -100,00 | 0 | -100,00 | ||||
| 2026-02-17 | 13F | Maryland State Retirement & Pension System | 19.665 | 1,05 | 1.090 | -15,63 | ||||
| 2025-11-04 | 13F | Flaharty Asset Management, LLC | 0 | -100,00 | 0 | |||||
| 2026-01-23 | 13F | Assetmark, Inc | 29.750 | -1,76 | 1.649 | -17,96 | ||||
| 2026-04-09 | 13F | Tompkins Financial Corp | 0 | -100,00 | 0 | |||||
| 2026-01-15 | 13F | Fifth Third Wealth Advisors LLC | 0 | -100,00 | 0 | |||||
| 2026-02-12 | 13F | Advisors Asset Management, Inc. | 59.833 | -34,45 | 3.317 | -45,25 | ||||
| 2026-02-13 | 13F | Public Employees Retirement Association Of Colorado | 9.880 | 0,00 | 1 | |||||
| 2025-10-30 | 13F | Traub Capital Management LLC | 0 | -100,00 | 0 | |||||
| 2026-02-04 | 13F | Virginia Retirement Systems Et Al | 18.300 | -15,28 | 1.015 | -29,29 | ||||
| 2026-02-11 | 13F | Picton Mahoney Asset Management | 580 | -99,39 | 32 | 433,33 | ||||
| 2026-02-17 | 13F | Creative Planning | 30.953 | 83,95 | 1.716 | 53,63 | ||||
| 2026-02-12 | 13F | Ensign Peak Advisors, Inc | 72.255 | 337,01 | 4.006 | 265,09 | ||||
| 2026-02-17 | 13F | Man Group plc | 209.017 | -12,13 | 11.588 | -26,63 | ||||
| 2025-11-14 | 13F | Oxford Asset Management Llp | 0 | -100,00 | 0 | -100,00 | ||||
| 2026-02-17 | 13F | Signature Equity Partners, LLC | 75 | 4 | ||||||
| 2026-01-30 | 13F | Us Bancorp \de\ | 5.955 | -27,25 | 330 | -39,23 | ||||
| 2025-11-13 | 13F | Promus Capital, LLC | 0 | -100,00 | 0 | -100,00 | ||||
| 2026-02-12 | 13F | DJE Kapital AG | 24.700 | 0,00 | 1.377 | 11,60 | ||||
| 2026-02-17 | 13F | Numerai GP LLC | 5.767 | 320 | ||||||
| 2026-02-03 | 13F | Crossmark Global Holdings, Inc. | 103.497 | 338,38 | 5.738 | 266,11 | ||||
| 2026-02-06 | 13F | Kimelman & Baird, LLC | 200 | 0,00 | 11 | -15,38 | ||||
| 2026-02-11 | 13F | Ing Groep Nv | 19.318 | -73,15 | 1.072 | -77,58 | ||||
| 2026-02-17 | 13F | Aqr Capital Management Llc | 4.111.639 | 40,12 | 227.785 | 16,93 | ||||
| 2026-01-21 | 13F | Sound Income Strategies, LLC | 316 | 1.164,00 | 20 | 1.800,00 | ||||
| 2025-11-14 | 13F | Binnacle Investments Inc | 27 | 0,00 | 2 | 0,00 | ||||
| 2026-03-12 | 13F | Nalls Sherbakoff Group, Llc | 0 | -100,00 | 0 | |||||
| 2026-02-12 | 13F | Penserra Capital Management LLC | 56.658 | -32,32 | 3 | -40,00 | ||||
| 2026-04-23 | 13F | Impact Partnership Wealth, LLC | 0 | -100,00 | 0 | |||||
| 2025-10-31 | 13F | Symphony Financial, Ltd. Co. | 0 | -100,00 | 0 | -100,00 | ||||
| 2026-02-10 | 13F | Norges Bank | 611.520 | 33.903 | ||||||
| 2026-02-17 | 13F | Northern Trust Corp | 693.006 | -4,48 | 38.420 | -20,24 | ||||
| 2026-04-13 | 13F | Hm Payson & Co | 300 | 0,00 | 15 | -12,50 | ||||
| 2026-02-03 | 13F | Mitsubishi UFJ Kokusai Asset Management Co., Ltd. | 225 | 0,00 | 13 | -14,29 | ||||
| 2026-02-06 | 13F | Lsv Asset Management | 1.300 | 0,00 | 0 | |||||
| 2026-02-11 | 13F | Illinois Municipal Retirement Fund | 83.115 | 30,73 | 4.608 | 9,17 | ||||
| 2026-02-18 | 13F | State of Tennessee, Treasury Department | 43.189 | -8,89 | 2.287 | -27,33 | ||||
| 2025-11-20 | 13F | Asset Dedication, LLC | 0 | -100,00 | 0 | -100,00 | ||||
| 2026-02-04 | 13F | LRI Investments, LLC | 52 | 0,00 | 3 | -33,33 | ||||
| 2026-01-28 | 13F | Financial Perspectives, Inc | 0 | -100,00 | 0 | |||||
| 2026-04-20 | 13F | State of Alaska, Department of Revenue | 53.786 | -2,76 | 3 | -33,33 | ||||
| 2026-02-05 | 13F | Cambridge Investment Research Advisors, Inc. | 0 | -100,00 | 0 | |||||
| 2025-10-28 | 13F | CarsonAllaria Wealth Management, Ltd. | 0 | -100,00 | 0 | |||||
| 2026-01-28 | 13F | Teacher Retirement System Of Texas | 19.967 | -20,96 | 1.107 | -34,05 | ||||
| 2026-04-17 | 13F | Monticello Wealth Management, Llc | 26.030 | 0,00 | 1.301 | -9,91 | ||||
| 2026-04-24 | 13F | Strs Ohio | 2.223 | -5,40 | 111 | -14,62 | ||||
| 2026-02-10 | 13F | Bnp Paribas Arbitrage, Sa | 205.771 | -32,94 | 11.408 | -44,00 | ||||
| 2026-02-06 | 13F | Leonteq Securities AG | 12.840 | 712 | ||||||
| 2026-02-10 | 13F | Bnp Paribas Arbitrage, Sa | Put | 2.619 | -2,71 | 14.520 | -18,76 | |||
| 2026-02-17 | 13F | Longaeva Partners L.P. | 35.000 | 1.940 | ||||||
| 2026-02-10 | 13F | Bnp Paribas Arbitrage, Sa | Call | 100 | -86,82 | 554 | -89,01 | |||
| 2026-02-12 | 13F | Litman Gregory Asset Management LLC | 125 | 7 | ||||||
| 2026-02-13 | 13F | Great West Life Assurance Co /can/ | 86.583 | -11,95 | 5 | -42,86 | ||||
| 2026-02-10 | 13F | Rothschild Investment Llc | 318 | 536,00 | 18 | 466,67 | ||||
| 2026-02-17 | 13F | Farringdon Capital, Ltd. | 5.464 | 303 | ||||||
| 2026-02-02 | 13F | Wolverine Asset Management Llc | Put | 217.400 | 0,00 | 12.053 | -16,50 | |||
| 2026-02-17 | 13F | Two Sigma Investments, Lp | Put | 27.600 | 0,00 | 1.530 | -16,48 | |||
| 2026-02-17 | 13F | Two Sigma Investments, Lp | 80.909 | -5,44 | 4.486 | -21,04 | ||||
| 2026-01-12 | 13F | Heartwood Wealth Advisors LLC | 0 | -100,00 | 0 | |||||
| 2026-02-17 | 13F | ISAM Funds (UK) Ltd | 0 | -100,00 | 0 | |||||
| 2026-04-16 | 13F | Evolve Private Wealth, Llc | 0 | -100,00 | 0 | |||||
| 2026-01-28 | 13F | Universal- Beteiligungs- und Servicegesellschaft mbH | 32.731 | 4,53 | 1.827 | -12,13 | ||||
| 2026-02-13 | 13F | Centiva Capital, LP | Put | 0 | -100,00 | 0 | ||||
| 2026-01-30 | 13F | Archer Investment Corp | 2.524 | 4,90 | 140 | -12,58 | ||||
| 2026-04-10 | 13F | Linden Thomas Advisory Services, LLC | 5.630 | 281 | ||||||
| 2026-01-30 | 13F | Mitsubishi UFJ Trust & Banking Corp | 38.033 | 37,44 | 2.109 | 14,75 | ||||
| 2026-02-17 | 13F | Lazard Asset Management Llc | 16.965 | 75,29 | 941 | 46,42 | ||||
| 2026-02-13 | 13F | Dynamic Technology Lab Private Ltd | 16.387 | 908 | ||||||
| 2026-02-17 | 13F | Boothbay Fund Management, Llc | 6.691 | 5,22 | 371 | -12,32 | ||||
| 2026-02-17 | 13F | Schonfeld Strategic Advisors LLC | 0 | -100,00 | 0 | |||||
| 2026-02-03 | 13F | Cheviot Value Management, LLC | 0 | -100,00 | 0 | |||||
| 2026-02-12 | 13F | Ankerstar Wealth, LLC | 15 | 1 | ||||||
| 2026-02-13 | 13F | Manufacturers Life Insurance Company, The | 0 | -100,00 | 0 | |||||
| 2026-02-11 | 13F | Zions Bancorporation, National Association /ut/ | 18 | 1 | ||||||
| 2026-02-11 | 13F | Allianz Asset Management GmbH | 851.322 | 20,47 | 47.197 | 0,60 | ||||
| 2026-02-17 | 13F | Millennium Management Llc | 208.720 | -76,42 | 11.571 | -80,31 | ||||
| 2026-02-13 | 13F | Kestra Advisory Services, LLC | 0 | -100,00 | 0 | |||||
| 2026-02-17 | 13F | Millennium Management Llc | Call | 428.800 | 131,91 | 23.773 | 93,66 | |||
| 2026-02-13 | 13F | Blueshift Asset Management, LLC | 0 | -100,00 | 0 | |||||
| 2026-02-17 | 13F | Millennium Management Llc | Put | 164.100 | -56,38 | 9.098 | -63,58 | |||
| 2025-11-14 | 13F | WealthTrak Capital Management LLC | 0 | -100,00 | 0 | |||||
| 2025-11-13 | 13F | Wells Fargo & Company/mn | Call | 0 | -100,00 | 0 | -100,00 | |||
| 2026-04-24 | 13F | Oakworth Capital, Inc. | 215 | 0,00 | 11 | -9,09 | ||||
| 2026-01-13 | 13F | Stephens Consulting, LLC | 100 | 0,00 | 6 | -16,67 | ||||
| 2026-02-17 | 13F | Ameriprise Financial Inc | 243.166 | 19,85 | 13.478 | 0,06 | ||||
| 2026-02-17 | 13F | Shelton Capital Management | 0 | -100,00 | 0 | -100,00 | ||||
| 2026-04-13 | 13F | Massmutual Trust Co Fsb/adv | 207 | 18,97 | 10 | 11,11 | ||||
| 2026-02-13 | 13F | Integrated Wealth Concepts LLC | 6.973 | -11,87 | 387 | -26,48 | ||||
| 2026-04-17 | 13F | Brown, Lisle/cummings, Inc. | 13 | 1 | ||||||
| 2026-02-11 | 13F | Havemeyer Place LP | 18.203 | 1.009 | ||||||
| 2026-02-17 | 13F | Polymer Capital Management (US) LLC | 37.906 | 229,88 | 2.102 | 175,72 | ||||
| 2026-02-17 | 13F | Mangrove Partners | 4.096 | 227 | ||||||
| 2026-02-12 | 13F | MetLife Investment Management, LLC | 274.851 | 6.290,40 | 15.238 | 5.246,32 | ||||
| 2026-02-17 | 13F | Advisory Services Network, LLC | 0 | -100,00 | 0 | |||||
| 2026-02-12 | 13F | Bank Of Montreal /can/ | 120.437 | 1.302,71 | 6.677 | 1.071,40 | ||||
| 2026-02-17 | 13F | Citadel Advisors Llc | 1.183.387 | 59,76 | 65.607 | 33,41 | ||||
| 2025-11-14 | 13F | ExodusPoint Capital Management, LP | 0 | -100,00 | 0 | |||||
| 2025-11-14 | 13F | Twinbeech Capital Lp | 0 | -100,00 | 0 | |||||
| 2026-02-17 | 13F | Optiver Holding B.V. | Put | 195.600 | -4,91 | 10.844 | -20,59 | |||
| 2026-02-17 | 13F | Optiver Holding B.V. | 55.164 | 3.058 | ||||||
| 2026-02-17 | 13F | Optiver Holding B.V. | Call | 250.200 | -38,42 | 13.871 | -48,58 | |||
| 2026-02-04 | 13F | Ameritas Advisory Services, LLC | 3.889 | 72,08 | 216 | 43,33 | ||||
| 2026-02-02 | 13F | Core Alternative Capital | 0 | -100,00 | 0 | |||||
| 2026-02-11 | 13F | Buckingham Strategic Partners | 20.606 | 12,07 | 1.142 | -1,64 | ||||
| 2026-02-13 | 13F | Barclays Plc | Call | 0 | -100,00 | 0 | -100,00 | |||
| 2026-02-17 | 13F | Citadel Advisors Llc | Call | 1.926.000 | -60,25 | 106.777 | -66,81 | |||
| 2026-01-26 | 13F | Great Hill Capital LLC | 77.653 | 15,46 | 4.305 | -3,58 | ||||
| 2026-02-17 | 13F | Citadel Advisors Llc | Put | 1.183.000 | -16,45 | 65.586 | -30,23 | |||
| 2026-01-26 | 13F | Great Hill Capital LLC | Call | 277.000 | -55,82 | 19.285 | -53,67 | |||
| 2026-01-30 | 13F | State of New Jersey Common Pension Fund D | 39.575 | 11,96 | 2.194 | -6,48 | ||||
| 2026-01-12 | 13F | Schaper Benz & Wise Investment Counsel Inc/wi | 30.773 | -27,52 | 1.706 | -39,46 | ||||
| 2026-02-17 | 13F | Sora Investors Llc | 0 | -100,00 | 0 | |||||
| 2026-02-06 | 13F | HighTower Advisors, LLC | 5.312 | -4,61 | 295 | -20,33 | ||||
| 2025-11-14 | 13F | Hook Mill Capital Partners, LP | 0 | -100,00 | 0 | |||||
| 2026-04-10 | 13F | Oak Thistle LLC | 13.224 | 0,00 | 661 | -9,96 | ||||
| 2026-02-04 | 13F | Pensionmark Financial Group, Llc | 0 | -100,00 | 0 | |||||
| 2026-01-23 | 13F | Transcend Wealth Collective, Llc | 4.202 | 233 | ||||||
| 2026-02-04 | 13F | Tsfg, Llc | 8 | 0 | ||||||
| 2026-04-22 | 13F | Sterling Capital Management LLC | 1.710 | -40,54 | 85 | -46,54 | ||||
| 2026-02-05 | 13F | Allworth Financial LP | 2.390 | 25,59 | 133 | 4,76 | ||||
| 2026-02-13 | 13F | Bridgewater Associates, LP | 439.413 | -12,89 | 24.361 | -27,26 | ||||
| 2026-02-06 | 13F | Covestor Ltd | 292 | -70,02 | 0 | |||||
| 2026-02-12 | 13F | Tripletail Wealth Management, LLC | 66 | 0,00 | 4 | -25,00 | ||||
| 2026-02-02 | 13F | Danske Bank A/s | 1.300 | 30,00 | 72 | 9,09 | ||||
| 2026-02-10 | 13F | Axq Capital, Lp | 16.127 | 894 | ||||||
| 2026-02-13 | 13F | Baird Financial Group, Inc. | 0 | -100,00 | 0 | |||||
| 2026-01-29 | 13F | Vanguard Group Inc | 10.468.334 | -0,91 | 580.364 | -17,25 | ||||
| 2026-02-13 | 13F | Pinnacle Wealth Planning Services, Inc. | 1.193 | 66 | ||||||
| 2026-02-12 | 13F | Brown Brothers Harriman & Co | 0 | -100,00 | 0 | |||||
| 2026-02-03 | 13F | SBI Securities Co., Ltd. | 1.093 | -4,79 | 61 | -21,05 | ||||
| 2026-02-11 | 13F | Fiera Capital Corp | 840.296 | 32,18 | 46.586 | 10,38 | ||||
| 2026-02-19 | 13F | Rare Wolf Capital LLC | 22.486 | 1.247 | ||||||
| 2026-01-30 | 13F | Keybank National Association/oh | 0 | -100,00 | 0 | -100,00 | ||||
| 2026-02-02 | 13F | Fifth Third Bancorp | 694 | 0,00 | 38 | -17,39 | ||||
| 2026-02-17 | 13F | Bank Of America Corp /de/ | Put | 0 | -100,00 | 0 | ||||
| 2026-02-13 | 13F | Police & Firemen's Retirement System of New Jersey | 41.647 | -5,64 | 2.309 | -21,23 | ||||
| 2026-02-03 | 13F | McIlrath & Eck, LLC | 47 | 0,00 | 3 | -33,33 | ||||
| 2026-02-17 | 13F | Bank Of America Corp /de/ | Call | 0 | -100,00 | 0 | ||||
| 2026-02-17 | 13F | Fred Alger Management, Llc | 5.605 | 311 | ||||||
| 2026-01-26 | 13F | Mirae Asset Global Investments Co., Ltd. | 10.806 | -40,96 | 599 | -50,70 | ||||
| 2026-02-11 | 13F | Fox Run Management, L.l.c. | 4.113 | -9,84 | 228 | -24,50 | ||||
| 2026-04-20 | 13F | Assenagon Asset Management S.A. | 1.090.241 | -32,34 | 54.490 | -39,01 | ||||
| 2026-02-05 | 13F | Eubel Brady & Suttman Asset Management Inc | 398.886 | 0,61 | 22 | -15,38 | ||||
| 2026-01-12 | 13F | Rialto Wealth Management, LLC | 4 | 0,00 | 0 | |||||
| 2026-02-13 | 13F | Transamerica Financial Advisors, Inc. | 2 | 0 | ||||||
| 2026-02-13 | 13F | Citigroup Inc | Call | 0 | -100,00 | 0 | -100,00 | |||
| 2026-04-13 | 13F | Mather Group, Llc. | 125 | 6 | ||||||
| 2026-04-24 | 13F | Yousif Capital Management, Llc | 26.854 | -0,52 | 1.342 | -15,60 | ||||
| 2026-02-13 | 13F | SRS Capital Advisors, Inc. | 1.098 | -98,37 | 61 | -98,66 | ||||
| 2026-02-17 | 13F | Titan Wealth (CI) Ltd | 260 | 14 | ||||||
| 2026-04-08 | 13F | Wealth Enhancement Advisory Services, Llc | 45.066 | -35,04 | 2.327 | -45,66 | ||||
| 2026-02-10 | 13F | Rational Advisors Llc | 0 | -100,00 | 0 | |||||
| 2025-11-14 | 13F | Lombard Odier Asset Management (Europe) Ltd | 2.306 | |||||||
| 2026-04-17 | 13F | IFC & Insurance Marketing, Inc. | 0 | -100,00 | 0 | |||||
| 2026-04-03 | 13F | Adirondack Trust Co | 165 | 0,00 | 8 | -11,11 | ||||
| 2026-02-11 | 13F | CLARET ASSET MANAGEMENT Corp | 4.519 | -0,24 | 0 | |||||
| 2026-02-17 | 13F | Elequin Capital Lp | 235 | 13 | ||||||
| 2025-11-14 | 13F | Bayesian Capital Management, LP | 0 | -100,00 | 0 | |||||
| 2026-04-13 | 13F | IFP Advisors, Inc | 14.208 | -2,42 | 710 | -12,02 | ||||
| 2026-04-08 | 13F | NorthCrest Asset Manangement, LLC | 0 | -100,00 | 0 | |||||
| 2026-04-16 | 13F | SG Americas Securities, LLC | Put | 62.000 | -63,53 | 0 | ||||
| 2026-04-27 | 13F | Y-Intercept (Hong Kong) Ltd | 0 | -100,00 | 0 | |||||
| 2026-02-05 | 13F | Elyxium Wealth, LLC | 5 | 0 | ||||||
| 2026-02-17 | 13F | Trexquant Investment LP | 223.589 | 12.396 | ||||||
| 2026-02-13 | 13F | Bridgefront Capital, LLC | 24.431 | 472,83 | 1.354 | 378,45 | ||||
| 2025-11-14 | 13F | Financial Network Wealth Management LLC | 0 | -100,00 | 0 | |||||
| 2026-02-17 | 13F | Alliancebernstein L.p. | 50.623 | -6,56 | 2.807 | -21,97 | ||||
| 2026-02-17 | 13F | Qube Research & Technologies Ltd | Put | 37.300 | 29,07 | 2.068 | 7,77 | |||
| 2026-02-17 | 13F | Qube Research & Technologies Ltd | Call | 128.200 | 82,10 | 7.107 | 52,09 | |||
| 2025-11-10 | 13F | Monaco Asset Management SAM | 0 | -100,00 | 0 | |||||
| 2026-02-17 | 13F | Qube Research & Technologies Ltd | 414.211 | 22.964 | ||||||
| 2026-02-10 | 13F | Bank of New York Mellon Corp | 615.868 | -3,58 | 34.144 | -19,48 | ||||
| 2026-01-28 | 13F | DekaBank Deutsche Girozentrale | 16.441 | 0,00 | 1 | 0,00 | ||||
| 2026-02-12 | 13F/A | Pinebridge Investments Llc | 16.018 | 888 | ||||||
| 2026-02-13 | 13F | Pathstone Holdings, LLC | 15.507 | -0,58 | 860 | -17,00 | ||||
| 2026-02-17 | 13F | Janus Henderson Group Plc | 38.421 | -9,61 | 2.131 | -24,49 | ||||
| 2026-01-29 | 13F | Quent Capital, LLC | 226 | 165,88 | 13 | 140,00 | ||||
| 2026-02-17 | 13F | Royal Bank Of Canada | 808.311 | -37,68 | 44.812 | -47,96 | ||||
| 2026-02-10 | 13F | Mutual Of America Capital Management Llc | 11.281 | 1,61 | 625 | -15,20 | ||||
| 2026-02-26 | 13F | Anchor Investment Management, LLC | 20 | 0,00 | 1 | 0,00 | ||||
| 2026-02-17 | 13F | DV Trading LLC | 4 | 0 | ||||||
| 2026-02-17 | 13F | Royal Bank Of Canada | Put | 228.900 | -32,30 | 12.690 | -43,46 | |||
| 2026-02-17 | 13F | Hampton Road Capital Management LP | 0 | -100,00 | 0 | |||||
| 2026-02-17 | 13F | Royal Bank Of Canada | Call | 693.200 | -6,73 | 38.431 | -22,11 | |||
| 2026-02-02 | 13F | Hussman Strategic Advisors, Inc. | 84.000 | 100,00 | 4.657 | 67,00 | ||||
| 2026-02-17 | 13F | State Of Wisconsin Investment Board | 39.321 | -16,39 | 2.180 | -30,20 | ||||
| 2026-02-17 | 13F | XTX Topco Ltd | 17.561 | 186,48 | 974 | 139,66 | ||||
| 2026-02-17 | 13F | Utah Retirement Systems | 5.256 | 0,00 | 291 | -16,38 | ||||
| 2026-02-12 | 13F | BRYN MAWR TRUST Co | 0 | -100,00 | 0 | |||||
| 2026-02-12 | 13F | Nuveen, LLC | 441.948 | -3,28 | 24.502 | -19,23 | ||||
| 2026-04-07 | 13F | CoreCap Advisors, LLC | 43 | 0,00 | 2 | 0,00 | ||||
| 2026-02-11 | 13F | Simplex Trading, Llc | Put | 182.200 | -69,83 | 10.101 | 25.152,50 | |||
| 2026-02-11 | 13F | Simplex Trading, Llc | Call | 592.900 | -21,31 | 32.870 | 65.640,00 | |||
| 2026-02-12 | 13F | Boussard & Gavaudan Investment Management LLP | Put | 0 | -100,00 | 0 | ||||
| 2026-02-18 | 13F | Sunstone Asset Management, L.P. | 10.900 | 604 | ||||||
| 2025-11-14 | 13F | Voloridge Investment Management, Llc | 0 | -100,00 | 0 | |||||
| 2026-02-13 | 13F | Ossiam | 156.472 | -0,95 | 8.675 | -17,29 | ||||
| 2026-01-20 | 13F | SOA Wealth Advisors, LLC. | 1 | 0,00 | 0 | |||||
| 2026-02-12 | 13F | Dimensional Fund Advisors Lp | 1.473.154 | 16,22 | 81.671 | -2,99 | ||||
| 2026-04-17 | 13F | Webster Bank, N. A. | 41 | 0,00 | 2 | 0,00 | ||||
| 2026-02-12 | 13F | Voya Investment Management Llc | 14.927 | -5,32 | 828 | -20,94 | ||||
| 2026-02-13 | 13F | PARK CIRCLE Co | 2.500 | 0,00 | 139 | -16,36 | ||||
| 2026-02-17 | 13F | Quantinno Capital Management LP | 508.471 | -37,95 | 28.190 | -48,18 | ||||
| 2026-02-11 | 13F | Commonwealth Retirement Investments LLC | 37 | 2 | ||||||
| 2026-02-12 | 13F | Cloud Capital Management, LLC | 0 | -100,00 | 0 | |||||
| 2026-02-17 | 13F | Balyasny Asset Management Llc | 2.120.727 | 78,46 | 117.573 | 49,03 | ||||
| 2026-02-17 | 13F | Balyasny Asset Management Llc | Put | 9.000 | -28,57 | 499 | -40,43 | |||
| 2026-02-17 | 13F | Algert Global Llc | 72.563 | -14,38 | 4 | -20,00 | ||||
| 2026-02-17 | 13F | Balyasny Asset Management Llc | Call | 75.200 | -31,45 | 4.169 | -42,75 | |||
| 2026-01-28 | 13F | Chicago Partners Investment Group LLC | 9.427 | -9,67 | 567 | -27,31 | ||||
| 2026-02-14 | 13F | Whipplewood Advisors, LLC | 9 | 0 | ||||||
| 2026-02-12 | 13F | SWAN Capital LLC | 307 | 0,00 | 17 | -15,00 | ||||
| 2026-02-17 | 13F | Quantitative Investment Management, LLC | 12.370 | -52,79 | 1 | -100,00 | ||||
| 2026-04-21 | 13F | Gagnon Securities Llc | 5.773 | 1,42 | 289 | -8,57 | ||||
| 2026-01-26 | 13F | Main Street Group, LTD | 0 | -100,00 | 0 | |||||
| 2026-02-10 | 13F | Godfrey Financial Associates, Inc. | 2 | 0 | ||||||
| 2026-02-13 | 13F/A | Ontario Teachers Pension Plan Board | 0 | -100,00 | 0 | |||||
| 2026-04-16 | 13F | SG Americas Securities, LLC | 1.497.174 | 823,59 | 75 | 825,00 | ||||
| 2026-04-20 | 13F | Cardinal Point Capital Management, ULC | 7.735 | 65,99 | 387 | 49,61 | ||||
| 2026-02-12 | 13F | Campbell & CO Investment Adviser LLC | 0 | -100,00 | 0 | |||||
| 2026-04-13 | 13F | Salem Investment Counselors Inc | 20 | 1 | ||||||
| 2026-02-10 | 13F | Hillsdale Investment Management Inc. | 350 | 0,00 | 19 | -17,39 | ||||
| 2026-02-10 | 13F | Commonwealth Of Pennsylvania Public School Empls Retrmt Sys | 24.436 | -3,19 | 1.355 | -19,16 | ||||
| 2026-02-17 | 13F | MIRAE ASSET GLOBAL ETFS HOLDINGS Ltd. | 47.266 | -12,03 | 2.620 | -26,55 | ||||
| 2026-01-20 | 13F | Steel Peak Wealth Management LLC | 4.100 | 0,00 | 227 | -16,54 | ||||
| 2026-02-13 | 13F | Rafferty Asset Management, LLC | 6.674 | 12,53 | 370 | -5,85 | ||||
| 2026-04-07 | 13F | Signaturefd, Llc | 355 | -33,40 | 18 | -41,38 | ||||
| 2026-02-12 | 13F | Miller Financial Services LLC | 5.722 | -5,37 | 317 | -20,95 | ||||
| 2026-01-30 | 13F | Sage Rhino Capital Llc | 0 | -100,00 | 0 | |||||
| 2026-02-13 | 13F | Motiv8 Investments LLC | 49 | 0 | ||||||
| 2026-01-29 | 13F | Sanctuary Advisors, LLC | 5.080 | 34,64 | 282 | 12,40 | ||||
| 2026-02-12 | 13F | CIBC Private Wealth Group, LLC | 763 | 6,56 | 42 | -10,64 | ||||
| 2026-02-12 | 13F | Ci Investments Inc. | 0 | -100,00 | 0 | |||||
| 2026-01-21 | 13F | Flagship Harbor Advisors, Llc | 98 | 5 | ||||||
| 2025-11-12 | 13F | Artisan Partners Limited Partnership | 0 | -100,00 | 0 | |||||
| 2026-01-14 | 13F | ORG Partners LLC | 0 | -100,00 | 0 | |||||
| 2026-02-17 | 13F | Capital Fund Management S.a. | Call | 227.800 | -7,59 | 12.629 | -22,83 | |||
| 2026-02-17 | 13F | Capital Fund Management S.a. | Put | 202.000 | -7,13 | 11.199 | -22,45 | |||
| 2026-02-17 | 13F | Cape Investment Advisory, Inc. | 133 | 137,50 | 7 | 133,33 | ||||
| 2026-02-09 | 13F | Legal & General Group Plc | 275.096 | -17,95 | 15.209 | -31,68 | ||||
| 2026-04-06 | 13F | Highline Wealth Partners Llc | 38 | 2 | ||||||
| 2026-02-10 | 13F | Goldman Sachs Group Inc | Put | 550.000 | -40,46 | 30.492 | -50,28 | |||
| 2026-04-15 | 13F | Compagnie Lombard Odier SCmA | 500 | 0,00 | 25 | -11,11 | ||||
| 2025-11-14 | 13F | PineBridge Investments, L.P. | 8.081 | 536 | ||||||
| 2026-02-17 | 13F | California State Teachers Retirement System | 88.775 | 0,18 | 4.922 | -16,35 | ||||
| 2025-11-14 | 13F | S&t Bank/pa | 0 | -100,00 | 0 | |||||
| 2026-02-05 | 13F | Bessemer Group Inc | 108.846 | 5.893,72 | 6 | |||||
| 2026-02-13 | 13F | Neo Ivy Capital Management | 0 | -100,00 | 0 | |||||
| 2026-02-10 | 13F | Goldman Sachs Group Inc | 4.557.730 | -4,33 | 252.681 | -20,11 | ||||
| 2026-02-13 | 13F | Stifel Financial Corp | 10.964 | -19,52 | 608 | -32,85 | ||||
| 2026-04-20 | 13F | Ronald Blue Trust, Inc. | 1.238 | 19,27 | 62 | 7,02 | ||||
| 2026-04-21 | 13F | Aaron Wealth Advisors LLC | 6.144 | 30,56 | 307 | 18,08 | ||||
| 2026-02-13 | 13F | Alyeska Investment Group, L.P. | 141.816 | -70,39 | 7.862 | -75,27 | ||||
| 2026-02-12 | 13F | Skandinaviska Enskilda Banken AB (publ) | 0 | -100,00 | 0 | |||||
| 2026-02-17 | 13F | Mirabella Financial Services Llp | 14.638 | 812 | ||||||
| 2026-04-23 | 13F | Oppenheimer Asset Management Inc. | 4.797 | 1,57 | 240 | -8,43 | ||||
| 2026-04-23 | 13F | waypoint wealth counsel | 0 | -100,00 | 0 | |||||
| 2026-02-09 | 13F | Prospera Financial Services Inc | 0 | -100,00 | 0 | |||||
| 2026-02-17 | 13F | Alphadyne Asset Management, LLC | Call | 0 | -100,00 | 0 | ||||
| 2026-04-17 | 13F | HHM Wealth Advisors, LLC | 4 | 0,00 | 0 | |||||
| 2026-02-23 | 13F | Mv Capital Management, Inc. | 11 | 0,00 | 1 | |||||
| 2026-04-16 | 13F | SG Americas Securities, LLC | Call | 1.604.200 | 25,82 | 1 | -50,00 | |||
| 2026-02-11 | 13F | Ameritas Investment Partners, Inc. | 10.431 | 578 | ||||||
| 2025-11-14 | 13F | Cubist Systematic Strategies, LLC | Put | 26.000 | 712,50 | 1.726 | 978,75 | |||
| 2026-02-12 | 13F | Swiss National Bank | 175.900 | -3,30 | 9.752 | -19,25 | ||||
| 2025-11-14 | 13F | Cubist Systematic Strategies, LLC | Call | 187.700 | 0,27 | 12.461 | 32,72 | |||
| 2026-02-11 | 13F | Inceptionr Llc | 7.380 | 24,45 | 409 | 4,07 | ||||
| 2025-11-13 | 13F | Hudson Bay Capital Management LP | 0 | -100,00 | 0 | |||||
| 2026-04-21 | 13F | Pallas Capital Advisors LLC | 16.152 | -38,45 | 807 | -44,50 | ||||
| 2026-02-17 | 13F | Credit Agricole S A | 6.038 | -24,99 | 335 | -37,45 | ||||
| 2026-02-12 | 13F | Xponance, Inc. | 11.413 | 1,62 | 633 | -15,17 | ||||
| 2026-02-17 | 13F | Summit Global Investments | 4.171 | -52,62 | 0 | |||||
| 2026-02-10 | 13F | Private Wealth Asset Management, LLC | 128 | 0,00 | 7 | -12,50 | ||||
| 2026-02-12 | 13F | Hrt Financial Lp | 0 | -100,00 | 0 | -100,00 | ||||
| 2026-04-16 | 13F | Diversified Trust Co | 21.786 | -4,24 | 1.089 | -13,72 | ||||
| 2026-02-06 | 13F | Bare Financial Services, Inc | 237 | 0,00 | 13 | -13,33 | ||||
| 2026-02-06 | 13F | Global Retirement Partners, LLC | 134 | -98,69 | 7 | -98,97 | ||||
| 2025-11-05 | 13F | Gallacher Capital Management LLC | 0 | -100,00 | 0 | |||||
| 2026-02-04 | 13F | Pier 88 Investment Partners Llc | 14.297 | -43,80 | 793 | -53,08 | ||||
| 2026-02-13 | 13F | BNP Paribas Asset Management Holding S.A. | 1.274 | 0 | ||||||
| 2026-02-13 | 13F | Jacobs Levy Equity Management, Inc | 192.646 | -18,61 | 10.680 | -32,04 | ||||
| 2026-02-12 | 13F | Great Lakes Advisors, Llc | 19.545 | -31,31 | 1.084 | -42,67 | ||||
| 2026-02-17 | 13F | Engineers Gate Manager LP | 47.499 | 2.633 | ||||||
| 2026-02-17 | 13F | Jones Financial Companies Lllp | 30.408 | 49,27 | 1.686 | 28,92 | ||||
| 2026-02-13 | 13F | Bank Of Nova Scotia | 380.563 | 1.341,80 | 21.098 | 1.104,22 | ||||
| 2026-02-11 | 13F | Jessup Wealth Management, Inc | 82 | 5 | ||||||
| 2026-02-20 | 13F | Sunbelt Securities, Inc. | 57 | 0,00 | 3 | 0,00 | ||||
| 2026-04-02 | 13F | Ahara Advisors LLC | 23.057 | 1.278 | ||||||
| 2026-01-28 | 13F | Oversea-Chinese Banking CORP Ltd | 0 | -100,00 | 0 | |||||
| 2026-02-12 | 13F | Elo Mutual Pension Insurance Co | 56.528 | 66,03 | 3.134 | 38,63 | ||||
| 2026-02-11 | 13F | SOUTH STATE Corp | 47 | 327,27 | 3 | |||||
| 2026-02-05 | 13F | High Note Wealth, LLC | 70 | -4,11 | 4 | -25,00 | ||||
| 2026-02-10 | 13F | Tidemark, LLC | 81 | 0,00 | 4 | -20,00 | ||||
| 2026-02-17 | 13F | SageView Advisory Group, LLC | 43 | 2 | ||||||
| 2026-02-03 | 13F | Ballentine Partners, LLC | 4.234 | -14,48 | 235 | -28,66 | ||||
| 2026-02-09 | 13F | Hantz Financial Services, Inc. | 1.712 | 167,50 | 0 | |||||
| 2026-02-11 | 13F | Prudential Plc | 0 | -100,00 | 0 | |||||
| 2026-02-10 | 13F | Envestnet Asset Management Inc | 48.499 | -9,57 | 2.689 | -24,49 | ||||
| 2026-04-15 | 13F | Sarver Vrooman Wealth Advisors | 0 | -100,00 | 0 | |||||
| 2026-01-26 | 13F | Whittier Trust Co Of Nevada Inc | 78 | -13,33 | 5 | -33,33 | ||||
| 2026-01-26 | 13F | Private Trust Co Na | 3 | 0,00 | 0 | |||||
| 2025-11-10 | 13F | Lion Street Advisors, LLC | 1.549 | 388 | ||||||
| 2026-02-02 | 13F | Principal Financial Group Inc | 468.589 | -1,36 | 25.979 | -17,63 | ||||
| 2026-02-11 | 13F | Prestige Wealth Management Group LLC | 0 | -100,00 | 0 | |||||
| 2026-01-28 | 13F | Arizona State Retirement System | 24.754 | -10,87 | 1.372 | -25,56 | ||||
| 2026-01-21 | 13F | Modera Wealth Management, LLC | 23.587 | 14,90 | 1.308 | -4,04 | ||||
| 2026-02-12 | 13F | Rossby Financial, LCC | 12 | 33,33 | 1 | |||||
| 2025-11-14 | 13F | Point72 Asia (Singapore) Pte. Ltd. | 14.385 | 955 | ||||||
| 2026-02-17 | 13F | Polar Asset Management Partners Inc. | 163.900 | -6,34 | 9.087 | -21,79 | ||||
| 2026-02-24 | 13F/A | Pacer Advisors, Inc. | 462.328 | -4,06 | 25.631 | -19,89 | ||||
| 2026-02-13 | 13F | Quinn Opportunity Partners LLC | 20.499 | 0,00 | 1.136 | -16,47 | ||||
| 2025-11-13 | 13F | GeoWealth Management, LLC | 0 | -100,00 | 0 | |||||
| 2026-02-17 | 13F | Susquehanna International Group, Llp | 250.569 | -11,14 | 13.892 | -25,80 | ||||
| 2026-02-17 | 13F | Susquehanna International Group, Llp | Put | 1.478.400 | -51,08 | 81.962 | -59,15 | |||
| 2026-03-06 | 13F | Hsbc Holdings Plc | Call | 0 | -100,00 | 0 | ||||
| 2026-03-06 | 13F | Hsbc Holdings Plc | Put | 0 | -100,00 | 0 | ||||
| 2026-04-20 | 13F | Louisiana State Employees Retirement System | 43.800 | -3,10 | 2.189 | -12,61 | ||||
| 2026-02-17 | 13F | Susquehanna International Group, Llp | Call | 2.029.400 | -40,11 | 112.510 | -49,99 | |||
| 2026-02-17 | 13F | Crawford Fund Management, LLC | Call | 18.500 | 54,17 | 1.026 | 28,77 | |||
| 2026-04-15 | 13F | Bayforest Capital Ltd | 3.386 | -56,29 | 169 | -60,61 | ||||
| 2026-02-02 | 13F | Sachetta, LLC | 28 | 0,00 | 2 | 0,00 | ||||
| 2026-02-17 | 13F | Lone Pine Capital Llc | 0 | -100,00 | 0 | -100,00 | ||||
| 2026-02-13 | 13F | National Bank Of Canada /fi/ | 557.929 | 27.896.350,00 | 30.932 | |||||
| 2026-02-09 | 13F | Hartland & Co., LLC | 309 | -17,38 | 17 | -29,17 | ||||
| 2026-02-13 | 13F | Glazer Capital, Llc | 0 | -100,00 | 0 | |||||
| 2026-02-17 | 13F | Tower Research Capital LLC (TRC) | 481 | -78,85 | 27 | -82,67 | ||||
| 2026-02-12 | 13F | Marex Group plc | 38.223 | -12,91 | 2.119 | -27,26 | ||||
| 2026-02-17 | 13F | Aequim Alternative Investments LP | 26.907 | 1.492 | ||||||
| 2026-02-13 | 13F | Natixis | 0 | -100,00 | 0 | |||||
| 2026-02-11 | 13F | Strategic Advocates LLC | 2 | -75,00 | 0 | |||||
| 2026-02-13 | 13F | American Century Companies Inc | 10.624 | -57,03 | 589 | -64,17 | ||||
| 2026-02-17 | 13F | Limestone Investment Advisors LP | 0 | -100,00 | 0 | |||||
| 2026-02-17 | 13F | Bank Of America Corp /de/ | 894.517 | -51,11 | 49.592 | -59,17 | ||||
| 2026-02-13 | 13F | Royal London Asset Management Ltd | 6.483 | 0,00 | 359 | -16,51 | ||||
| 2026-02-13 | 13F | Barclays Plc | Put | 157.400 | -55,71 | 8.726 | -63,02 | |||
| 2026-04-24 | 13F | ProShare Advisors LLC | 52.365 | -19,93 | 2.617 | -27,81 | ||||
| 2026-02-13 | 13F | Umb Bank N A/mo | 532 | 18,75 | 29 | 0,00 | ||||
| 2026-02-18 | 13F/A | Empowered Funds, LLC | 56.145 | 413,58 | 3.113 | 329,24 | ||||
| 2026-02-13 | 13F | Pin Oak Investment Advisors Inc | 42 | 0,00 | 0 | -100,00 | ||||
| 2026-01-22 | 13F | Massachusetts Financial Services Co /ma/ | 187.028 | 33,66 | 10.369 | 11,62 | ||||
| 2026-02-13 | 13F | First Trust Advisors Lp | 188.016 | 520,88 | 10.424 | 418,56 | ||||
| 2026-02-17 | 13F | Aquatic Capital Management LLC | 0 | -100,00 | 0 | |||||
| 2026-02-10 | 13F | Connor, Clark & Lunn Investment Management Ltd. | 13.505 | -98,56 | 749 | -98,80 | ||||
| 2026-02-04 | 13F | Fourth Dimension Wealth, LLC | 76 | 0,00 | 4 | -20,00 | ||||
| 2026-01-23 | 13F | Rsm Us Wealth Management Llc | 9.599 | -19,67 | 529 | -33,29 | ||||
| 2026-02-05 | 13F | Requisite Capital Management, LLC | 0 | -100,00 | 0 | |||||
| 2026-02-17 | 13F | TCG Advisory Services, LLC | Call | 0 | -100,00 | 0 | ||||
| 2025-11-13 | 13F | FORA Capital, LLC | 0 | -100,00 | 0 | -100,00 | ||||
| 2026-02-10 | 13F | State of Wyoming | 0 | -100,00 | 0 | |||||
| 2026-02-17 | 13F | Elliott Investment Management L.P. | 5.000.000 | 0,00 | 277.200 | -16,49 | ||||
| 2026-02-13 | 13F | Wells Fargo & Company/mn | Put | 425.000 | 286,36 | 23.562 | 222,68 | |||
| 2026-02-06 | 13F | Gsa Capital Partners Llp | 12.871 | 1 | ||||||
| 2026-02-13 | 13F | Wells Fargo & Company/mn | 100.931 | -59,72 | 5.596 | -66,37 | ||||
| 2025-11-03 | 13F | Pandora Wealth, Inc. | 0 | -100,00 | 0 | |||||
| 2026-02-17 | 13F | Public Employees Retirement System Of Ohio | 31.016 | -3,46 | 1.720 | -19,37 | ||||
| 2026-02-02 | 13F | Cornerstone Planning Group LLC | 12 | 50,00 | 1 | |||||
| 2026-02-13 | 13F | Barclays Plc | 4.041.220 | 6,63 | 224.045 | -10,95 | ||||
| 2026-02-17 | 13F | TCG Advisory Services, LLC | 0 | -100,00 | 0 | |||||
| 2026-02-19 | 13F | CI Private Wealth, LLC | 23.023 | 33,65 | 839 | -26,68 | ||||
| 2026-02-17 | 13F | III Capital Management | 20.000 | 1.109 | ||||||
| 2026-02-17 | 13F | 13D Management LLC | 71.836 | -7,71 | 3.983 | -22,93 | ||||
| 2026-01-20 | 13F | Family Legacy Financial Solutions, LLC | 0 | -100,00 | 0 | |||||
| 2026-01-28 | 13F | Salomon & Ludwin, LLC | 576 | -24,31 | 34 | -40,00 | ||||
| 2026-02-10 | 13F | Daiwa Securities Group Inc. | 0 | -100,00 | 0 | |||||
| 2026-04-24 | 13F | Vision Financial Markets Llc | 0 | -100,00 | 0 | |||||
| 2026-01-27 | 13F | Meritage Portfolio Management | 225.283 | -3,08 | 12.490 | -19,07 | ||||
| 2026-02-09 | 13F | Geode Capital Management, Llc | 1.741.506 | -4,27 | 96.570 | -20,05 | ||||
| 2026-02-17 | 13F | Ancora Advisors, LLC | 5 | 0 | ||||||
| 2026-02-10 | 13F | Natixis Advisors, L.p. | 11.937 | -24,10 | 1 | -100,00 | ||||
| 2025-11-04 | 13F | Guerra Advisors Inc | 30 | 2 | ||||||
| 2026-02-12 | 13F | Federation des caisses Desjardins du Quebec | 1.210 | 22,84 | 67 | 3,08 | ||||
| 2026-04-16 | 13F | Aegon Asset Management Uk Plc | 0 | -100,00 | 0 | |||||
| 2026-02-20 | 13F | Kovitz Investment Group Partners, LLC | 0 | -100,00 | 0 | |||||
| 2026-01-27 | 13F | Elevated Capital Advisors, LLC | 23 | 1 | ||||||
| 2026-02-13 | 13F | Alamea Verwaltungs GmbH | 0 | -100,00 | 0 | |||||
| 2026-01-12 | 13F | AllSquare Wealth Management LLC | 15 | 0,00 | 1 | |||||
| 2026-04-24 | 13F | Root Financial Partners, LLC | 2.209 | 0,18 | 110 | -9,84 | ||||
| 2025-11-12 | 13F | NewSquare Capital LLC | 0 | -100,00 | 0 | |||||
| 2026-02-17 | 13F | Redwood Investment Management, Llc | 19.903 | 11,70 | 1 | 0,00 | ||||
| 2026-02-12 | 13F | Aristides Capital LLC | 0 | -100,00 | 0 | |||||
| 2026-02-10 | 13F | Jupiter Asset Management Ltd | 519.312 | 48,70 | 28.791 | 24,18 | ||||
| 2026-02-09 | 13F | Jefferies Financial Group Inc. | Call | 66.500 | 166,00 | 3.687 | 122,18 | |||
| 2026-02-09 | 13F | Jefferies Financial Group Inc. | 26.584 | 56,38 | 1.474 | 30,59 | ||||
| 2025-11-04 | 13F | Pineridge Advisors LLC | 4 | 0,00 | 0 | |||||
| 2026-02-13 | 13F | Atlas Capital Advisors Llc | 16 | 1 | ||||||
| 2026-02-14 | 13F | Rockefeller Capital Management L.P. | 65.582 | -3,99 | 3.636 | -19,83 | ||||
| 2026-04-23 | 13F | SJS Investment Consulting Inc. | 133 | -55,22 | 7 | -62,50 | ||||
| 2026-02-17 | 13F | BlueCrest Capital Management Ltd | Call | 0 | -100,00 | 0 | -100,00 | |||
| 2026-01-28 | 13F | Universal- Beteiligungs- und Servicegesellschaft mbH | Call | 0 | -100,00 | 0 | -100,00 | |||
| 2026-02-17 | 13F | Capstone Investment Advisors, Llc | 0 | -100,00 | 0 | -100,00 | ||||
| 2026-02-12 | 13F | Renaissance Technologies Llc | 5.367.442 | -10,60 | 297.571 | -25,35 | ||||
| 2026-02-13 | 13F | Verition Fund Management LLC | Put | 7.700 | -76,88 | 427 | -80,72 | |||
| 2026-02-17 | 13F | Armistice Capital, Llc | 7.989 | 443 | ||||||
| 2026-02-13 | 13F | Verition Fund Management LLC | 40.939 | -80,78 | 2.270 | -83,96 | ||||
| 2026-04-20 | 13F/A | OP Asset Management Ltd | 0 | -100,00 | 0 | -100,00 | ||||
| 2026-02-13 | 13F | Itau Unibanco Holding S.A. | 0 | -100,00 | 0 | |||||
| 2025-11-14 | 13F | Virtu Financial LLC | 0 | -100,00 | 0 | |||||
| 2025-11-14 | 13F | Delta Global Management LP | 0 | -100,00 | 0 | -100,00 | ||||
| 2026-02-13 | 13F | Arkadios Wealth Advisors | 7.088 | -20,19 | 393 | -33,45 | ||||
| 2025-10-30 | 13F | Twin Peaks Wealth Advisors, LLC | 0 | -100,00 | 0 | -100,00 | ||||
| 2026-03-12 | 13F/A | Peak6 Llc | 0 | -100,00 | 0 | -100,00 | ||||
| 2026-02-11 | 13F | Winton Capital Group Ltd | 16.891 | 936 | ||||||
| 2026-01-30 | 13F | Bogart Wealth, LLC | 111 | 0,00 | 6 | -14,29 | ||||
| 2026-02-12 | 13F | Johnson Financial Group, Inc. | 1.399 | -8,62 | 78 | -23,76 | ||||
| 2026-04-17 | 13F | Vermillion Wealth Management, Inc. | 4 | 0 | ||||||
| 2026-04-21 | 13F | Gilpin Wealth Management, Llc | 316 | 2,60 | 16 | -11,76 | ||||
| 2026-02-12 | 13F | Distillate Capital Partners LLC | 2 | 100,00 | 0 | |||||
| 2026-02-17 | 13F | NorthRock Partners, LLC | 0 | -100,00 | 0 | |||||
| 2026-02-17 | 13F | DZ BANK AG Deutsche Zentral Genossenschafts Bank, Frankfurt am Main | 339 | 5.550,00 | 19 | |||||
| 2026-04-20 | 13F | Tower View Investment Management & Research LLC | 65 | 0,00 | 3 | 0,00 | ||||
| 2026-01-30 | 13F | Valued Wealth Advisors LLC | 85 | 0,00 | 5 | -20,00 | ||||
| 2026-01-30 | 13F | New York State Teachers Retirement System | 109.713 | 0,83 | 6 | -14,29 | ||||
| 2026-02-11 | 13F | IMA Wealth, Inc. | 3 | 0,00 | 0 | |||||
| 2026-01-21 | 13F | Newbridge Financial Services Group, Inc. | 0 | -100,00 | 0 | |||||
| 2025-11-14 | 13F | Wolverine Trading, Llc | Call | 669.000 | 6,87 | 49.733 | 56,89 | |||
| 2025-11-14 | 13F | Wolverine Trading, Llc | Put | 254.700 | 72,09 | 18.934 | 152,66 | |||
| 2026-02-11 | 13F | Group One Trading, L.p. | Put | 48.700 | -7,41 | 2.700 | -22,71 | |||
| 2026-02-11 | 13F | Group One Trading, L.p. | 9.623 | 533 | ||||||
| 2026-02-11 | 13F | Group One Trading, L.p. | Call | 172.500 | -44,14 | 9.563 | -53,35 | |||
| 2026-01-26 | 13F | Cwm, Llc | 102.113 | 17,40 | 6 | 0,00 | ||||
| 2025-11-07 | 13F | Shell Asset Management Co | 1.156 | -59,28 | 0 | |||||
| 2025-11-06 | 13F | Abich Financial Wealth Management LLC | 766 | 51 | ||||||
| 2026-04-22 | 13F | Spire Wealth Management | 31 | 14,81 | 2 | 0,00 | ||||
| 2026-02-09 | 13F | Atlantic Trust, LLC | 0 | -100,00 | 0 | |||||
| 2026-02-17 | 13F | Point72 Asset Management, L.P. | 2.724.902 | 48,05 | 151.069 | 23,63 | ||||
| 2026-02-17 | 13F | Point72 Asset Management, L.P. | Call | 625.800 | 400,64 | 34.694 | 318,10 | |||
| 2026-02-17 | 13F | Amundi | 725.085 | 116,94 | 40.199 | 71,82 | ||||
| 2026-02-17 | 13F | Caption Management, LLC | Put | 75.000 | 0,00 | 4.158 | -16,49 | |||
| 2026-02-12 | 13F | New York State Common Retirement Fund | 245.793 | 0,00 | 13.627 | -16,50 | ||||
| 2026-02-06 | 13F | GPS Wealth Strategies Group, LLC | 653 | -71,02 | 36 | -75,84 | ||||
| 2026-02-17 | 13F | Caption Management, LLC | 17.000 | 6,25 | 942 | -11,30 | ||||
| 2025-11-10 | 13F | Prakash Investment Advisors Llc | 0 | -100,00 | 0 | |||||
| 2026-01-23 | 13F | Nbt Bank N A /ny | 55 | -16,67 | 3 | -66,67 | ||||
| 2025-11-14 | 13F | Punch & Associates Investment Management, Inc. | 0 | -100,00 | 0 | |||||
| 2026-01-28 | 13F | Geneos Wealth Management Inc. | 0 | -100,00 | 0 | -100,00 | ||||
| 2026-02-09 | 13F | Annis Gardner Whiting Capital Advisors, LLC | 32 | -30,43 | 2 | -66,67 | ||||
| 2026-04-21 | 13F | Generali Investments Towarzystwo Funduszy Inwestycyjnych | 4.100 | -4,65 | 205 | -14,29 | ||||
| 2026-03-12 | 13F/A | Peak6 Llc | Put | 5.000 | -98,61 | 277 | -98,84 | |||
| 2026-03-12 | 13F/A | Peak6 Llc | Call | 172.800 | -64,58 | 9.580 | -70,42 | |||
| 2026-02-17 | 13F | Wellington Management Group Llp | 0 | -100,00 | 0 | |||||
| 2026-02-13 | 13F | Sei Investments Co | 166.551 | -9,00 | 9.234 | -24,01 | ||||
| 2026-01-27 | 13F | Evergreen Capital Management Llc | 4.222 | -38,10 | 234 | -48,23 | ||||
| 2026-02-10 | 13F | CIBC World Markets Inc. | 30.521 | 0,42 | 1.648 | -18,34 | ||||
| 2026-02-18 | 13F | EP Wealth Advisors, Inc. | 4.892 | -11,59 | 271 | -2,17 | ||||
| 2026-03-06 | 13F | Hsbc Holdings Plc | 176.746 | -56,76 | 9.785 | -64,53 | ||||
| 2026-01-26 | 13F | United Advisor Group, LLC | 0 | -100,00 | 0 | |||||
| 2025-11-05 | 13F | Optimize Financial Inc | 0 | -100,00 | 0 | |||||
| 2026-02-13 | 13F | Heron Bay Capital Management | 13.426 | -48,30 | 744 | -56,82 | ||||
| 2026-01-30 | 13F | Catalytic Wealth RIA, LLC | 0 | -100,00 | 0 | |||||
| 2026-02-10 | 13F | CIBC Asset Management Inc | 3.783 | -45,52 | 210 | -54,66 | ||||
| 2026-02-13 | 13F | Morgan Stanley | 2.100.092 | 4,03 | 116.429 | -13,13 | ||||
| 2026-02-17 | 13F | Polar Asset Management Partners Inc. | Put | 0 | -100,00 | 0 | ||||
| 2026-02-17 | 13F | Ardsley Advisory Partners Lp | 0 | -100,00 | 0 | |||||
| 2026-02-17 | 13F | Banco Bilbao Vizcaya Argentaria, S.a. | 0 | -100,00 | 0 | |||||
| 2025-11-14 | 13F | Two Sigma Advisers, Lp | 0 | -100,00 | 0 | -100,00 | ||||
| 2026-02-13 | 13F | Quarry LP | 820 | -67,83 | 45 | -73,37 | ||||
| 2026-01-30 | 13F/A | M&t Bank Corp | 5.953 | 56,37 | 329 | 30,56 | ||||
| 2025-11-14 | 13F | J. Goldman & Co LP | Call | 0 | -100,00 | 0 | ||||
| 2025-11-03 | 13F | Pilgrim Partners Asia Pte Ltd | 0 | -100,00 | 0 | |||||
| 2025-11-14 | 13F | J. Goldman & Co LP | 0 | -100,00 | 0 | |||||
| 2026-02-23 | 13F | Kera Capital Partners, Inc. | 8.974 | -2,87 | 475 | -22,51 | ||||
| 2026-02-12 | 13F | Brinker Capital Investments, LLC | 17.707 | -8,12 | 982 | -23,30 | ||||
| 2026-01-26 | 13F | KBC Group NV | 37.713 | 0,00 | 2 | 0,00 | ||||
| 2026-02-13 | 13F | Hurley Capital, LLC | 600 | 0,00 | 33 | -15,38 | ||||
| 2026-02-12 | 13F | Keel Point, LLC | 0 | -100,00 | 0 | |||||
| 2025-10-27 | 13F | Sumitomo Mitsui Trust Holdings, Inc. | 0 | -100,00 | 0 | -100,00 | ||||
| 2026-02-04 | 13F | Boyd Watterson Asset Management Llc/oh | 5.197 | 0,00 | 288 | -16,52 | ||||
| 2026-02-13 | 13F | Trillium Asset Management, Llc | 57.154 | -21,91 | 3.301 | -32,06 | ||||
| 2026-02-10 | 13F | Acadian Asset Management Llc | 1.442.270 | -28,51 | 80 | -40,60 | ||||
| 2026-02-13 | 13F | LGT Financial Advisors LLC | 1.000 | -50,00 | 55 | -58,33 | ||||
| 2026-02-11 | 13F | Capital Analysts, Inc. | 75 | 0,00 | 0 | |||||
| 2026-02-17 | 13F | Hidden Lake Asset Management LP | 130.850 | 41,05 | 7.254 | 17,80 | ||||
| 2026-01-26 | 13F | Whittier Trust Co | 199 | 0,00 | 12 | -14,29 | ||||
| 2026-04-24 | 13F | Bayban | 50 | 0,00 | 2 | 0,00 | ||||
| 2026-02-13 | 13F | Mariner, LLC | 50.232 | 43,35 | 2.784 | 19,69 | ||||
| 2026-02-17 | 13F | Two Sigma Securities, Llc | 0 | -100,00 | 0 | |||||
| 2026-02-13 | 13F | Edgestream Partners, L.P. | 5.914 | -81,97 | 328 | -84,98 | ||||
| 2026-02-12 | 13F | Skopos Labs, Inc. | 3.914 | -25,32 | 221 | -36,31 | ||||
| 2026-02-10 | 13F | Quantbot Technologies LP | 720 | 40 | ||||||
| 2026-04-17 | 13F | AdvisorNet Financial, Inc | 11 | -31,25 | 1 | |||||
| 2026-02-13 | 13F | Vontobel Holding Ltd. | 30.357 | 4,71 | 1.683 | -12,58 | ||||
| 2026-02-17 | 13F | Captrust Financial Advisors | 39.310 | 92,89 | 2.179 | 61,17 | ||||
| 2026-02-03 | 13F | Strengthening Families & Communities, LLC | 8 | -96,68 | 0 | -100,00 | ||||
| 2026-02-13 | 13F | Evelyn Partners Investment Management Services Ltd | 568 | 0,00 | 31 | -18,92 | ||||
| 2026-02-17 | 13F | Canada Pension Plan Investment Board | 742.700 | 34,52 | 41.175 | 12,34 | ||||
| 2025-11-14 | 13F | Scientech Research LLC | 0 | -100,00 | 0 | |||||
| 2026-02-13 | 13F | Golden State Wealth Management, LLC | 19 | 850,00 | 1 | |||||
| 2026-01-28 | 13F | CAPROCK Group, Inc. | 13.569 | -37,61 | 752 | -34,72 | ||||
| 2025-11-14 | 13F | Scopus Asset Management, L.p. | Put | 0 | -100,00 | 0 | -100,00 | |||
| 2026-02-09 | 13F | Quest Partners LLC | 5.783 | -32,61 | 321 | -43,76 | ||||
| 2026-02-17 | 13F | Cresset Asset Management, LLC | 0 | -100,00 | 0 | -100,00 | ||||
| 2026-01-09 | 13F | 180 Wealth Advisors, Llc | 12.492 | 8,84 | 693 | -9,07 | ||||
| 2026-02-03 | 13F | Lmcg Investments, Llc | 71.320 | 6,59 | 3.954 | -11,01 | ||||
| 2026-02-17 | 13F | Jain Global LLC | 0 | -100,00 | 0 | |||||
| 2026-02-12 | 13F | Colonial Trust Advisors | 45 | 0,00 | 2 | 0,00 | ||||
| 2026-02-11 | 13F | Modus Advisors, LLC | 1 | 0 | ||||||
| 2026-02-09 | 13F | Gs Investments, Inc. | 1 | 0,00 | 0 | |||||
| 2026-02-11 | 13F | LPL Financial LLC | 25.708 | -4,68 | 1.425 | -20,39 | ||||
| 2026-04-22 | 13F | Pictet Asset Management Holding SA | 15.776 | 5,86 | 788 | -4,60 | ||||
| 2026-01-20 | 13F | Cromwell Holdings LLC | 14 | 0,00 | 1 | |||||
| 2026-02-17 | 13F | Grace & Mercy Foundation, Inc. | 11.500 | 0,00 | 638 | -16,51 | ||||
| 2026-01-27 | 13F | Zurcher Kantonalbank (Zurich Cantonalbank) | 36.720 | 9,80 | 2.036 | -8,33 | ||||
| 2026-02-11 | 13F | Franklin Resources Inc | 130.790 | -34,60 | 7.251 | -45,39 | ||||
| 2026-02-13 | 13F | Aigen Investment Management, Lp | 13.599 | 754 | ||||||
| 2025-11-14 | 13F | Mount Yale Investment Advisors, LLC | 0 | -100,00 | 0 | -100,00 | ||||
| 2026-01-27 | 13F | Optas, LLC | 0 | -100,00 | 0 | |||||
| 2026-02-02 | 13F | Wolverine Asset Management Llc | 66.251 | -19,19 | 3.673 | -32,52 | ||||
| 2026-02-13 | 13F | Maverick Capital Ltd | 45.034 | 2.497 | ||||||
| 2026-01-21 | 13F | Provident Living Financial Services, Inc. | 15.856 | 879 | ||||||
| 2026-02-12 | 13F | Cibc World Markets Corp | 0 | -100,00 | 0 | |||||
| 2026-01-29 | 13F | Comerica Bank | 22.755 | -20,43 | 1.262 | -33,56 | ||||
| 2026-02-17 | 13F | Css Llc/il | 0 | -100,00 | 0 | |||||
| 2026-02-18 | 13F | Vident Advisory, LLC | 16.961 | -9,19 | 940 | -24,19 | ||||
| 2026-02-13 | 13F | Findlay Park Partners LLP | 974.300 | -16,83 | 54.015 | -30,55 | ||||
| 2026-02-04 | 13F | Atlantic Union Bankshares Corp | 81 | 55,77 | 4 | 33,33 | ||||
| 2026-02-05 | 13F | Blume Capital Management, Inc. | 206 | 0,00 | 11 | -15,38 | ||||
| 2026-02-09 | 13F | Keating Financial Advisory Services, Inc. | 22 | 1 | ||||||
| 2026-02-13 | 13F | Titan Investment Solutions Ltd | 128.717 | 7.136 | ||||||
| 2026-04-15 | 13F | DAVENPORT & Co LLC | 6.785 | -95,31 | 339 | -95,78 | ||||
| 2026-01-29 | 13F | Rakuten Securities, Inc. | 0 | -100,00 | 0 | -100,00 | ||||
| 2026-04-10 | 13F | Abound Wealth Management | 6 | -33,33 | 0 | |||||
| 2026-04-22 | 13F | Coston, McIsaac & Partners | 25 | 0,00 | 0 | |||||
| 2026-04-13 | 13F | Creative Financial Designs Inc /adv | 150 | 0,00 | 7 | -12,50 | ||||
| 2026-02-13 | 13F | OMERS ADMINISTRATION Corp | 4.158 | 0,00 | 231 | -16,67 | ||||
| 2026-04-17 | 13F | Bell Investment Advisors, Inc | 31 | 0,00 | 2 | 0,00 | ||||
| 2026-02-10 | 13F/A | Northwestern Mutual Wealth Management Co | 3.583 | -8,43 | 199 | -23,55 | ||||
| 2026-04-08 | 13F | DiNuzzo Private Wealth, Inc. | 12 | 0,00 | 1 | |||||
| 2026-02-13 | 13F | Glen Eagle Advisors, LLC | 100 | 0,00 | 6 | -16,67 | ||||
| 2026-02-17 | 13F | Capital Fund Management S.a. | 447.601 | 0,27 | 24.815 | -16,27 | ||||
| 2025-11-14 | 13F | Strategic Wealth Partners, Ltd. | 115 | -25,81 | 8 | 0,00 | ||||
| 2026-02-11 | 13F | Manchester Capital Management LLC | 47 | 3 | ||||||
| 2026-02-10 | 13F | Goldman Sachs Group Inc | Call | 0 | -100,00 | 0 | -100,00 | |||
| 2026-02-13 | 13F | Arrowstreet Capital, Limited Partnership | 2.165.603 | -10,09 | 120.061 | -24,92 | ||||
| 2026-02-17 | 13F | Russell Investments Group, Ltd. | 153.848 | -57,59 | 8.523 | -66,87 | ||||
| 2026-02-09 | 13F | Harbour Investments, Inc. | 149 | -9,70 | 8 | -20,00 | ||||
| 2025-11-20 | 13F | Ariadne Wealth Management, LP | 0 | -100,00 | 0 | |||||
| 2026-01-29 | 13F | Teachers Retirement System Of The State Of Kentucky | 24.806 | -10,93 | 1 | 0,00 | ||||
| 2026-04-21 | 13F | Robeco Institutional Asset Management B.V. | 360.925 | 5,88 | 18.039 | -4,54 | ||||
| 2026-02-09 | 13F | Employees Retirement System of Texas | 934 | 0,00 | 0 | |||||
| 2026-04-17 | 13F | Kaufman Rossin Wealth, LLC | 0 | -100,00 | 0 | |||||
| 2026-02-17 | 13F | Meridiem Capital Partners LP | Call | 200.000 | 11.088 | |||||
| 2026-02-17 | 13F | Meridiem Capital Partners LP | 485.995 | 74,27 | 26.944 | 45,53 | ||||
| 2026-02-13 | 13F | Charles Schwab Investment Management Inc | 1.009.084 | -1,25 | 55.944 | -17,53 | ||||
| 2025-11-14 | 13F | Nomura Holdings Inc | Call | 0 | -100,00 | 0 | -100,00 | |||
| 2026-04-22 | 13F | Parcion Private Wealth LLC | 0 | -100,00 | 0 | |||||
| 2026-04-07 | 13F | JBGlobal.com LLC | 5.137 | 257 | ||||||
| 2026-02-06 | 13F | Pnc Financial Services Group, Inc. | 7.550 | 2,44 | 419 | -14,52 | ||||
| 2026-02-03 | 13F | Everence Capital Management Inc | 4.920 | 0,00 | 0 | |||||
| 2026-02-12 | 13F | EAM Investors, LLC | 0 | -100,00 | 0 | |||||
| 2026-04-14 | 13F | Bay Harbor Wealth Management, LLC | 24 | 140,00 | 1 | |||||
| 2025-11-12 | 13F | HAP Trading, LLC | Call | 28.200 | 190 | |||||
| 2026-02-13 | 13F | Panagora Asset Management Inc | 16.070 | -0,09 | 891 | -16,59 | ||||
| 2026-02-13 | 13F | Wexford Capital Lp | 0 | -100,00 | 0 | |||||
| 2026-02-13 | 13F | Kilter Group LLC | 0 | -100,00 | 0 | |||||
| 2026-02-17 | 13F | North Capital, Inc. | 0 | -100,00 | 0 | |||||
| 2026-02-13 | 13F | Walleye Trading LLC | Put | 390.900 | 13,70 | 21.671 | -5,05 | |||
| 2026-02-13 | 13F | Walleye Trading LLC | Call | 210.800 | -48,22 | 11.687 | -56,76 | |||
| 2026-02-12 | 13F | Quadrant Capital Group Llc | 2.515 | 3,46 | 139 | -13,66 | ||||
| 2026-01-27 | 13F | Lecap Asset Management Ltd | 0 | -100,00 | 0 | |||||
| 2026-04-15 | 13F | Exchange Traded Concepts, Llc | 2.180 | 109 | ||||||
| 2026-02-17 | 13F | Shellback Capital, LP | 0 | -100,00 | 0 | |||||
| 2026-01-13 | 13F | Wynn Capital, LLC | 0 | -100,00 | 0 | |||||
| 2026-02-09 | 13F | Royce & Associates Lp | 8.266 | 0,00 | 458 | -16,42 | ||||
| 2026-02-13 | 13F | Van Eck Associates Corp | 3.734.156 | 1,06 | 207 | -15,51 | ||||
| 2025-10-29 | 13F | Royal Fund Management, LLC | Call | 0 | -100,00 | 0 | ||||
| 2025-10-29 | 13F | Royal Fund Management, LLC | 0 | -100,00 | 0 | |||||
| 2026-02-02 | 13F | VELA Investment Management, LLC | 20.075 | 1.113 | ||||||
| 2026-02-18 | 13F | Vermillion & White Wealth Management Group, LLC | 20 | 66,67 | 1 | |||||
| 2026-04-15 | 13F | Fortitude Family Office, LLC | 32 | 33,33 | 2 | 0,00 | ||||
| 2026-04-16 | 13F | Capital Advisors, Ltd. LLC | 1 | 0 | ||||||
| 2026-01-28 | 13F | Klp Kapitalforvaltning As | 24.700 | -2,37 | 1.369 | -18,46 | ||||
| 2026-02-17 | 13F | Invenomic Capital Management LP | 91.884 | 5.094 | ||||||
| 2026-02-11 | 13F | Winnow Wealth Llc | 0 | -100,00 | 0 | |||||
| 2026-02-17 | 13F | Occudo Quantitative Strategies Lp | 21.850 | 1.211 | ||||||
| 2025-11-14 | 13F | Sherbrooke Park Advisers Llc | 0 | -100,00 | 0 | -100,00 | ||||
| 2026-02-11 | 13F | Greykasell Wealth Strategies, Inc. | 200 | 0,00 | 11 | -15,38 | ||||
| 2026-04-14 | 13F | Pictet & Cie (Europe) SA | 8.071 | 18,15 | 403 | 6,61 | ||||
| 2026-02-13 | 13F | Parkside Financial Bank & Trust | 129 | 20,56 | 7 | 0,00 | ||||
| 2026-02-17 | 13F | Sig Brokerage, Lp | Put | 0 | -100,00 | 0 | ||||
| 2026-02-13 | 13F | Treasurer of the State of North Carolina | 41.104 | -6,81 | 2 | 0,00 | ||||
| 2026-02-19 | 13F | Atomi Financial Group, Inc. | 4.000 | 16,62 | 222 | -2,64 | ||||
| 2026-04-22 | 13F | Smallwood Wealth Investment Management, LLC | 6 | 0,00 | 0 | |||||
| 2026-01-30 | 13F | Camden Capital, LLC | 0 | -100,00 | 0 | |||||
| 2026-04-24 | 13F | Key FInancial Inc | 17 | 0,00 | 1 | |||||
| 2026-04-22 | 13F | Advocate Investing Services LLC | 5 | 0,00 | 0 | |||||
| 2026-02-17 | 13F | Caisse De Depot Et Placement Du Quebec | 107.471 | 5.958 | ||||||
| 2026-01-29 | 13F | IMC-Chicago, LLC | Put | 368.400 | -49,56 | 20.424 | -57,88 | |||
| 2026-01-29 | 13F | IMC-Chicago, LLC | Call | 802.000 | -34,53 | 44.463 | -45,33 | |||
| 2026-02-11 | 13F | O'shaughnessy Asset Management, Llc | 9.482 | 9,66 | 526 | -8,54 | ||||
| 2026-02-10 | 13F | Intech Investment Management Llc | 0 | -100,00 | 0 | |||||
| 2026-04-14 | 13F | Clean Yield Group | 138 | 0,00 | 7 | -14,29 | ||||
| 2026-02-17 | 13F | Lotus Technology Management, LP | 40.359 | 2.238 | ||||||
| 2026-02-17 | 13F | Aster Capital Management (DIFC) Ltd | 3.781 | 2.620,14 | 210 | 2.222,22 | ||||
| 2026-02-12 | 13F | Principal Securities, Inc. | 0 | -100,00 | 0 | -100,00 | ||||
| 2026-02-05 | 13F | Thrivent Financial For Lutherans | 81.535 | -41,70 | 5 | -55,56 | ||||
| 2026-02-12 | 13F | Jane Street Group, Llc | 9.675 | -85,22 | 536 | -87,66 | ||||
| 2026-02-02 | 13F | New England Capital Financial Advisors LLC | 0 | -100,00 | 0 | |||||
| 2026-02-12 | 13F | Jane Street Group, Llc | Call | 2.609.600 | -14,83 | 144.676 | -28,88 | |||
| 2026-02-12 | 13F | Jane Street Group, Llc | Put | 810.000 | 61,64 | 44.906 | 34,98 | |||
| 2026-04-13 | 13F | Global X Japan Co., Ltd. | 360 | 0,00 | 18 | -10,53 | ||||
| 2026-02-13 | 13F | Prudential Financial Inc | 97.459 | 2,59 | 5.403 | -14,32 | ||||
| 2026-02-12 | 13F | Wealthspire Advisors, LLC | 0 | -100,00 | 0 | |||||
| 2026-02-12 | 13F | Triumph Capital Management | 0 | -100,00 | 0 | |||||
| 2025-11-14 | 13F | Long Focus Capital Management, Llc | 0 | -100,00 | 0 | |||||
| 2026-04-17 | 13F | Murphy & Mullick Capital Management Corp | 13 | 0,00 | 1 | |||||
| 2026-04-06 | 13F | Versant Capital Management, Inc | 6.422 | -3,82 | 321 | -13,51 | ||||
| 2026-01-14 | 13F | Hunter Perkins Capital Management, LLC | 11.760 | -0,47 | 1 | |||||
| 2026-02-13 | 13F | Heritage Wealth Advisors | 490 | 0,00 | 27 | -15,62 | ||||
| 2026-02-12 | 13F | Commonwealth Equity Services, Llc | 9.303 | -12,09 | 516 | |||||
| 2025-11-14 | 13F | Texas Permanent School Fund | 0 | -100,00 | 0 | |||||
| 2026-02-05 | 13F | Atria Investments Llc | 0 | -100,00 | 0 | |||||
| 2026-02-06 | 13F | Evoke Wealth, Llc | 5.066 | 5,15 | 281 | -12,23 | ||||
| 2026-02-17 | 13F | Ardmore Road Asset Management LP | 0 | -100,00 | 0 | |||||
| 2026-02-13 | 13F | Smartleaf Asset Management LLC | 3.273 | 19,45 | 181 | -10,84 | ||||
| 2026-01-21 | 13F | Westfuller Advisors, LLC | 214 | 0,00 | 12 | -21,43 | ||||
| 2026-02-13 | 13F | Macquarie Group Ltd | 1.060.000 | 0,00 | 58.766 | -16,49 | ||||
| 2026-02-17 | 13F | Raymond James Financial Inc | 16.217 | 4,00 | 899 | -13,14 | ||||
| 2026-02-13 | 13F | Fieldview Capital Management, LLC | 4.917 | 5,83 | 273 | -11,69 | ||||
| 2026-02-13 | 13F | Rhumbline Advisers | 230.613 | -2,75 | 12.785 | -18,79 | ||||
| 2026-02-13 | 13F | Ieq Capital, Llc | 375.718 | 28,22 | 20.830 | 7,07 | ||||
| 2026-02-09 | 13F | Huntington National Bank | 68 | -8,11 | 4 | -25,00 | ||||
| 2026-04-09 | 13F | Park Place Capital Corp | 17 | 0,00 | 1 | |||||
| 2026-02-11 | 13F | Parallel Advisors, LLC | 1.283 | 15,48 | 71 | -2,74 | ||||
| 2026-02-13 | 13F | Walleye Capital LLC | Put | 97.100 | 3,41 | 5.383 | -13,65 | |||
| 2026-04-08 | 13F | Holos Integrated Wealth LLC | 100 | 0,00 | 5 | 0,00 | ||||
| 2026-04-13 | 13F | True Wealth Design, LLC | 1.039 | -48,21 | 52 | -54,05 | ||||
| 2026-02-13 | 13F | Walleye Capital LLC | 138.955 | 22,91 | 7.704 | 2,64 | ||||
| 2026-02-13 | 13F | Walleye Capital LLC | Call | 84.900 | 26,53 | 4.707 | 5,66 | |||
| 2026-02-11 | 13F | Deutsche Bank Ag\ | 1.378.170 | 68,75 | 76.406 | 40,92 | ||||
| 2026-02-12 | 13F | DRW Securities, LLC | 4.053 | 225 | ||||||
| 2026-02-13 | 13F | MAI Capital Management | 1.747 | 32,35 | 97 | 10,34 | ||||
| 2026-02-05 | 13F | HFM Investment Advisors, LLC | 4 | 0,00 | 0 | |||||
| 2026-02-13 | 13F | PYA Waltman Capital, LLC | 24.387 | -32,43 | 1.352 | -43,55 | ||||
| 2026-02-17 | 13F | Fmr Llc | 2.302.774 | 7,19 | 127.666 | -10,49 | ||||
| 2026-02-09 | 13F | Accent Capital Management, LLC | 101 | 0,00 | 6 | -16,67 | ||||
| 2026-02-13 | 13F | Landscape Capital Management, L.l.c. | 25.243 | -60,88 | 1.399 | -67,34 | ||||
| 2025-11-13 | 13F | Total Investment Management Inc | 0 | -100,00 | 0 | |||||
| 2026-02-17 | 13F | Agf Management Ltd | 0 | -100,00 | 0 | |||||
| 2026-04-07 | 13F | Farther Finance Advisors, LLC | 2.470 | -39,58 | 123 | -45,58 | ||||
| 2026-02-13 | 13F | Ubs Asset Management Americas Inc | 582.545 | -3,89 | 32.296 | -19,74 | ||||
| 2026-02-17 | 13F | Holocene Advisors, LP | 196.472 | -93,67 | 10.892 | -94,72 | ||||
| 2026-04-23 | 13F | McMillan Office, Inc. | 1.400 | -12,50 | 70 | -21,59 | ||||
| 2026-02-17 | 13F | Summit Trail Advisors, Llc | 38.459 | -30,09 | 2.132 | -41,62 | ||||
| 2026-02-17 | 13F | Weiss Asset Management LP | 0 | -100,00 | 0 | -100,00 | ||||
| 2026-04-22 | 13F | Janney Montgomery Scott LLC | 6.359 | 8,61 | 0 | |||||
| 2026-02-04 | 13F | Swiss Life Asset Management Ltd | 4.214 | -2,39 | 234 | -18,53 | ||||
| 2026-02-17 | 13F | Brevan Howard Capital Management LP | 54.546 | 223,60 | 3.024 | 170,24 | ||||
| 2026-02-13 | 13F | SYM FINANCIAL Corp | 4.386 | -12,59 | 243 | -27,03 | ||||
| 2026-02-13 | 13F | Verition Fund Management LLC | Call | 0 | -100,00 | 0 | -100,00 | |||
| 2025-11-06 | 13F | Ground Swell Capital, LLC | 0 | -100,00 | 0 | -100,00 | ||||
| 2026-04-22 | 13F | JNBA Financial Advisors | 150 | 0,00 | 7 | -12,50 | ||||
| 2026-02-11 | 13F | Harvest Fund Management Co., Ltd | 0 | -100,00 | 0 | |||||
| 2026-04-21 | 13F | Financial Consulate, Inc | 9 | -10,00 | 0 | |||||
| 2026-02-13 | 13F | Centiva Capital, LP | Call | 0 | -100,00 | 0 | ||||
| 2026-02-06 | 13F | FourThought Financial Partners, LLC | 0 | -100,00 | 0 | |||||
| 2026-02-10 | 13F | Baker Avenue Asset Management, LP | 4.920 | -24,98 | 273 | -37,47 | ||||
| 2026-04-14 | 13F | Zrc Wealth Management, Llc | 74 | 21,31 | 4 | 0,00 | ||||
| 2025-12-19 | 13F | Finivi Inc. | 0 | -100,00 | 0 | -100,00 | ||||
| 2026-04-14 | 13F | West Branch Capital LLC | 11 | 0,00 | 1 | |||||
| 2026-02-19 | 13F | Invesco Ltd. | 361.193 | 26,82 | 20.025 | 5,90 | ||||
| 2026-02-09 | 13F | Kazazian Asset Management, LLC | 41.270 | 0,00 | 2.288 | -16,47 | ||||
| 2026-02-11 | 13F | Los Angeles Capital Management Llc | 466 | -99,51 | 29 | -99,55 | ||||
| 2025-11-14 | 13F | Bares Capital Management, Inc. | 1.425.825 | -0,53 | 94.661 | 31,65 | ||||
| 2025-11-12 | 13F | 111 Capital | 0 | -100,00 | 0 | |||||
| 2026-02-09 | 13F | Catalyst Funds Management Pty Ltd | 0 | -100,00 | 0 | -100,00 | ||||
| 2026-02-20 | 13F/A | Capital Markets Trading UK LLP | 0 | -100,00 | 0 | |||||
| 2026-04-20 | 13F | Inscription Capital, LLC | 5.154 | -27,67 | 258 | -34,94 | ||||
| 2026-02-06 | 13F | EverSource Wealth Advisors, LLC | 3.774 | 11,23 | 209 | -7,11 | ||||
| 2026-03-31 | 13F | Sankala Group LLC | 109 | 0,00 | 5 | 0,00 | ||||
| 2026-02-17 | 13F | EFG International AG | 600 | 33 | ||||||
| 2025-11-13 | 13F | Schroder Investment Management Group | 0 | -100,00 | 0 | |||||
| 2026-02-17 | 13F | Cetera Investment Advisers | 9.927 | -2,02 | 550 | -18,15 | ||||
| 2026-02-11 | 13F | Waddell & Associates, Llc | 3.643 | 12,61 | 202 | -6,07 | ||||
| 2026-04-08 | 13F | TOWER TRUST & INVESTMENT Co | 140 | 0,00 | 7 | -14,29 | ||||
| 2026-04-20 | 13F | Jfs Wealth Advisors, Llc | 42 | -10,64 | 2 | 0,00 | ||||
| 2026-02-13 | 13F | JustInvest LLC | 5.592 | -6,63 | 310 | -21,91 | ||||
| 2026-02-12 | 13F | State Board Of Administration Of Florida Retirement System | 96.025 | -7,38 | 5.324 | -22,66 | ||||
| 2026-02-10 | 13F | Sivia Capital Partners, LLC | 6.990 | 92,93 | 388 | 61,25 | ||||
| 2026-02-12 | 13F | Northwest & Ethical Investments L.P. | 0 | -100,00 | 0 | |||||
| 2026-02-17 | 13F | D. E. Shaw & Co., Inc. | Put | 176.400 | 90,91 | 9.780 | 59,42 | |||
| 2026-02-17 | 13F | D. E. Shaw & Co., Inc. | Call | 346.800 | -25,29 | 19.227 | -37,61 | |||
| 2025-11-07 | 13F | Atticus Wealth Management, Llc | 0 | -100,00 | 0 | |||||
| 2026-02-17 | 13F | D. E. Shaw & Co., Inc. | 730.301 | 59,89 | 40.488 | 33,51 | ||||
| 2026-02-13 | 13F | Public Sector Pension Investment Board | 0 | -100,00 | 0 | |||||
| 2026-02-13 | 13F | Colony Group, LLC | 33.390 | 66,04 | 1.851 | 38,86 | ||||
| 2026-02-05 | 13F | Amalgamated Bank | 35.959 | 12,43 | 2 | -50,00 | ||||
| 2026-02-17 | 13F | Parallax Volatility Advisers, L.P. | Call | 30.900 | -61,23 | 1.713 | -67,62 | |||
| 2026-04-16 | 13F | Roble, Belko & Company, Inc | 300 | 0,00 | 0 | |||||
| 2026-02-17 | 13F | Parallax Volatility Advisers, L.P. | 44.676 | -73,75 | 2.477 | -78,09 | ||||
| 2026-02-10 | 13F | Eurizon Capital SGR S.p.A. | 1.435 | 79 | ||||||
| 2026-02-17 | 13F | Parallax Volatility Advisers, L.P. | Put | 133.500 | 8,71 | 7.401 | -9,21 | |||
| 2026-02-11 | 13F | Syon Capital Llc | 12.556 | 696 | ||||||
| 2026-02-17 | 13F | Nishkama Capital, LLC | 0 | -100,00 | 0 | |||||
| 2026-02-13 | 13F | Kennondale Capital Management LLC | 17.512 | 0,00 | 971 | -16,52 | ||||
| 2026-02-17 | 13F | Atom Investors LP | 46.444 | 442,63 | 2.575 | 353,17 | ||||
| 2026-02-17 | 13F | Mercer Global Advisors Inc /adv | 39.736 | 64,61 | 2.203 | 37,45 | ||||
| 2026-01-30 | 13F | American Capital Advisory, LLC | 0 | -100,00 | 0 | |||||
| 2026-04-15 | 13F | Merit Financial Group, LLC | 14.060 | -43,10 | 703 | -48,72 | ||||
| 2026-02-13 | 13F | Marshall Wace, Llp | 921.530 | 51.090 | ||||||
| 2026-02-09 | 13F | New Age Alpha Advisors, LLC | 0 | -100,00 | 0 | |||||
| 2026-02-13 | 13F | Rice Hall James & Associates, Llc | 160.271 | -1,94 | 8.885 | -18,12 | ||||
| 2026-01-27 | 13F | Brighton Jones Llc | 0 | -100,00 | 0 | |||||
| 2025-11-14 | 13F | Clearline Capital LP | 0 | -100,00 | 0 | |||||
| 2026-02-04 | 13F | Oregon Public Employees Retirement Fund | 22.547 | 1,00 | 1.250 | -15,65 | ||||
| 2026-04-06 | 13F | GAMMA Investing LLC | 3.050 | -8,49 | 152 | -17,39 | ||||
| 2026-02-12 | 13F | Empirical Finance, LLC | 3.632 | -4,17 | 201 | -19,92 | ||||
| 2026-04-17 | 13F | Krilogy Financial LLC | 7.228 | -48,97 | 431 | -49,47 | ||||
| 2026-02-17 | 13F | Kelly Lawrence W & Associates Inc/ca | 350 | 0,00 | 19 | -17,39 | ||||
| 2026-02-05 | 13F | Td Private Client Wealth Llc | 66 | -10,81 | 4 | -25,00 | ||||
| 2026-02-17 | 13F | Alphadyne Asset Management, LLC | 4.083 | 226 | ||||||
| 2026-02-17 | 13F | Alphadyne Asset Management, LLC | Put | 4.500 | -93,94 | 249 | -94,95 | |||
| 2026-02-11 | 13F | MCF Advisors LLC | 134 | 0,00 | 7 | -12,50 | ||||
| 2026-02-06 | 13F | Larson Financial Group LLC | 59 | -83,33 | 3 | -86,96 | ||||
| 2026-02-17 | 13F | Advisor Group Holdings, Inc. | Call | 0 | -100,00 | 0 | ||||
| 2026-02-12 | 13F | California Public Employees Retirement System | 212.128 | 7,26 | 11.760 | -10,43 | ||||
| 2026-02-17 | 13F | Sig Brokerage, Lp | Call | 0 | -100,00 | 0 | ||||
| 2026-02-13 | 13F | Citigroup Inc | 253.474 | -13,66 | 14.053 | -27,90 | ||||
| 2026-04-22 | 13F | Lam Group, Inc. | 186 | 9 | ||||||
| 2026-02-12 | 13F | BlackRock, Inc. | 13.396.425 | 4,39 | 742.698 | -12,83 | ||||
| 2026-02-11 | 13F | Cerity Partners LLC | 157.644 | 54,35 | 8.740 | 28,89 | ||||
| 2026-02-17 | 13F | Gotham Asset Management, LLC | 285.920 | 24,73 | 15.851 | 4,16 | ||||
| 2026-04-10 | 13F | Quaker Wealth Management, LLC | 1 | 0,00 | 0 | |||||
| 2026-02-17 | 13F | Wealth Watch Advisors, INC | 30 | 2 | ||||||
| 2026-01-29 | 13F | Dunhill Financial, LLC | 7 | 133,33 | 0 | |||||
| 2026-02-18 | 13F | GWM Advisors LLC | 0 | -100,00 | 0 | |||||
| 2025-11-14 | 13F | Point72 Asset Management, L.P. | Put | 0 | -100,00 | 0 | -100,00 | |||
| 2026-02-11 | 13F | Twin Tree Management, LP | Call | 48.300 | -18,82 | 2.678 | -32,23 | |||
| 2026-02-11 | 13F | Twin Tree Management, LP | Put | 12.400 | -89,16 | 687 | -90,95 | |||
| 2026-01-20 | 13F | Nvwm, Llc | 78 | 0,00 | 4 | -20,00 | ||||
| 2026-02-11 | 13F | Twin Tree Management, LP | 1.935 | 107 | ||||||
| 2026-01-27 | 13F | TD Waterhouse Canada Inc. | 30 | 50,00 | 2 | 0,00 | ||||
| 2025-11-13 | 13F | Jefferies Financial Group Inc. | Put | 0 | -100,00 | 0 | -100,00 | |||
| 2026-02-03 | 13F | Sequoia Financial Advisors, LLC | 4.358 | 242 | ||||||
| 2026-02-11 | 13F | Simplex Trading, Llc | 0 | -100,00 | 0 | -100,00 | ||||
| 2026-02-10 | 13F | Nomura Asset Management Co Ltd | 440 | 0,00 | 24 | -17,24 | ||||
| 2026-02-20 | 13F/A | Capital Markets Trading UK LLP | Put | 45.000 | 45,16 | 2 | 0,00 | |||
| 2026-02-20 | 13F/A | Capital Markets Trading UK LLP | Call | 42.300 | 123,81 | 2 | 100,00 | |||
| 2026-01-30 | 13F | Turning Point Benefit Group, Inc. | 10 | 1 | ||||||
| 2026-02-13 | 13F | Victory Capital Management Inc | 141.501 | -79,71 | 7.845 | -83,06 | ||||
| 2026-02-11 | 13F | Jpmorgan Chase & Co | Call | 180.000 | -29,27 | 9.979 | -40,94 | |||
| 2026-02-11 | 13F | Jpmorgan Chase & Co | Put | 330.000 | 18,07 | 18.295 | -1,41 | |||
| 2026-02-12 | 13F | denkapparat Operations GmbH | 0 | -100,00 | 0 | |||||
| 2026-02-17 | 13F | Nomura Holdings Inc | 247.377 | -38,89 | 13.715 | -48,97 | ||||
| 2026-02-17 | 13F | Nomura Holdings Inc | Put | 160.000 | 0,00 | 8.870 | -16,49 | |||
| 2026-02-11 | 13F | Jpmorgan Chase & Co | 795.864 | -12,66 | 44.123 | -27,07 | ||||
| 2026-02-12 | 13F | Systematic Alpha Investments, LLC | 7.528 | 0,00 | 417 | -16,43 | ||||
| 2026-02-17 | 13F | Dark Forest Capital Management Lp | 0 | -100,00 | 0 | |||||
| 2026-02-12 | 13F | Federated Hermes, Inc. | 3.773 | -4,31 | 209 | -19,92 | ||||
| 2025-11-17 | 13F | Hancock Prospecting Pty Ltd | 0 | -100,00 | 0 | |||||
| 2026-04-13 | 13F | Gill Capital Partners, Llc | 3 | 0 | ||||||
| 2025-11-19 | 13F | Caitong International Asset Management Co., Ltd | 0 | -100,00 | 0 |