Grundlæggende statistik
| Institutionelle ejere | 346 total, 341 long only, 1 short only, 4 long/short - change of 6,10% MRQ |
| Gennemsnitlig porteføljeallokering | 0.0463 % - change of -24,56% MRQ |
| Institutionelle aktier (lange) | 170.975.157 (ex 13D/G) - change of -11,57MM shares -11,21% MRQ |
| Institutionel værdi (lang) | $ 2.508.381 USD ($1000) |
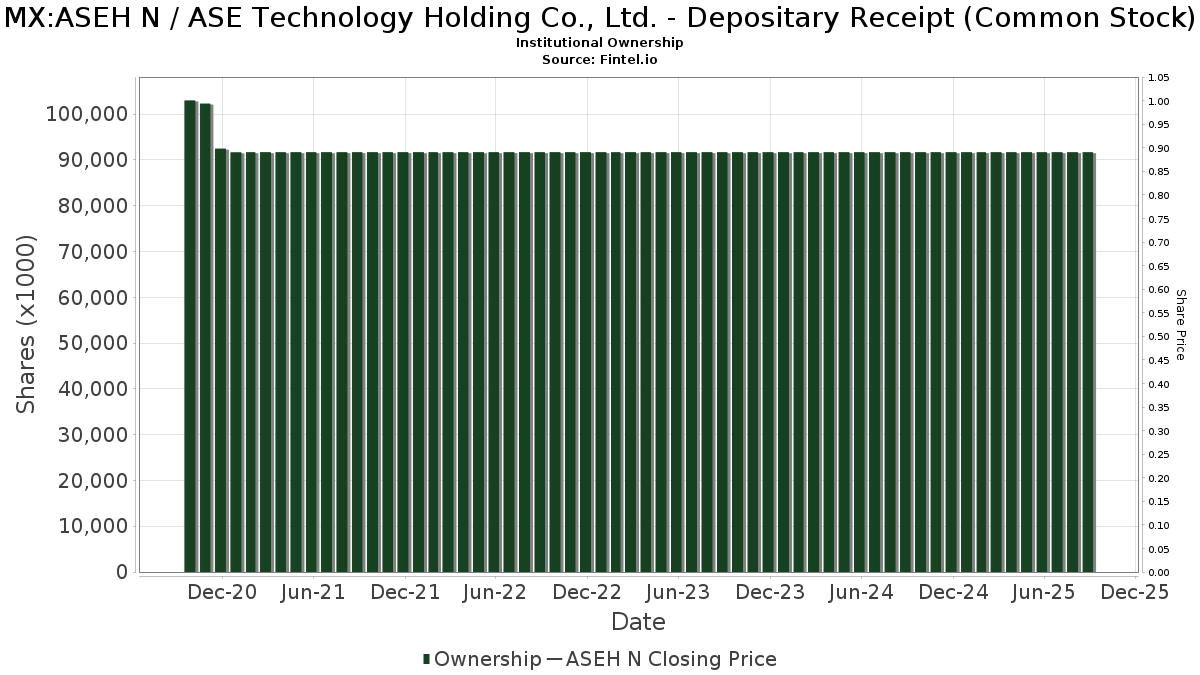
Institutionelt ejerskab og aktionærer
ASE Technology Holding Co., Ltd. - Depositary Receipt (Common Stock) (MX:ASEH N) har 346 institutionelle ejere og aktionærer, der har indsendt 13D/G- eller 13F-formularer til Securities Exchange Commission (SEC). Disse institutioner har i alt 170,975,157 aktier. Største aktionærer omfatter Lazard Asset Management Llc, BlackRock, Inc., Morgan Stanley, UBS Group AG, Bank Of America Corp /de/, Schroder Investment Management Group, SOXL - Direxion Daily Semiconductor Bull 3X Shares, Acadian Asset Management Llc, Goldman Sachs Group Inc, and Cullen Capital Management, LLC .
ASE Technology Holding Co., Ltd. - Depositary Receipt (Common Stock) (BMV:ASEH N) institutionel ejerskabsstruktur viser aktuelle positioner i virksomheden efter institutioner og fonde, samt seneste ændringer i positionsstørrelse. Større aktionærer kan omfatte individuelle investorer, investeringsforeninger, hedgefonde eller institutioner. Skema 13D angiver, at investoren besidder (eller besidder) mere end 5 % af virksomheden og har til hensigt (eller har til hensigt at) aktivt at forfølge en ændring i forretningsstrategi. Skema 13G indikerer en passiv investering på over 5%.
Fondens stemningsscore
Fund Sentiment Score (fka Ownership Accumulation Score) finder de aktier, der bliver mest købt af fonde. Det er resultatet af en sofistikeret, multi-faktor kvantitativ model, der identificerer virksomheder med de højeste niveauer af institutionel akkumulering. Scoringsmodellen bruger en kombination af den samlede stigning i oplyste ejere, ændringerne i porteføljeallokeringer i disse ejere og andre målinger. Tallet går fra 0 til 100, hvor højere tal indikerer et højere niveau af akkumulering for sine jævnaldrende, og 50 er gennemsnittet.
Opdateringsfrekvens: Dagligt
Se Ownership Explorer, som giver en liste over højest rangerende virksomheder.
AI+ Ask Fintel’s AI assistant about ASE Technology Holding Co., Ltd. - Depositary Receipt (Common Stock).
Select a question to share a public post with an AI-crafted answer.
Thinking of good questions…
13F og NPORT arkivering
Detaljer om 13F-arkivering er gratis. Detaljer om NP-ansøgninger kræver et premium-medlemskab. Grønne rækker angiver nye positioner. Røde rækker angiver lukkede positioner. Klik på linket ikon for at se den fulde transaktionshistorik.
Opgrader
for at låse premium-data op og eksportere til Excel ![]() .
.
| Fil dato | Kilde | Investor | Type | Gennemsnitlig pris (Øst) |
Aktier | Δ Aktier (%) |
Rapporteret Værdi ($1000) |
Δ Værdi (%) |
Port Alloc (%) |
|
|---|---|---|---|---|---|---|---|---|---|---|
| 2026-01-22 | 13F | Financial Consulate, Inc | 100 | 2 | ||||||
| 2026-01-29 | 13F | Sanctuary Advisors, LLC | 223.123 | 5,38 | 3.592 | 52,98 | ||||
| 2026-02-12 | 13F | Triumph Capital Management | 50 | 0,00 | 1 | |||||
| 2025-11-13 | 13F | Hsbc Holdings Plc | 1.596.858 | -10,98 | 17.705 | -4,55 | ||||
| 2026-01-16 | 13F | Empirical Financial Services, LLC d.b.a. Empirical Wealth Management | 40.754 | 273,10 | 656 | 442,15 | ||||
| 2026-02-13 | 13F | Wexford Capital Lp | 16.083 | 259 | ||||||
| 2026-02-12 | 13F | Laurel Oak Wealth Management, Llc | 11.403 | 184 | ||||||
| 2025-09-15 | 13F/A | Migdal Insurance & Financial Holdings Ltd. | 0 | -100,00 | 0 | |||||
| 2025-10-02 | 13F/A | Mirabella Financial Services Llp | 573.500 | -14,82 | 5.024 | -25,91 | ||||
| 2026-02-19 | 13F | CI Private Wealth, LLC | 171.263 | -0,13 | 2.709 | 42,45 | ||||
| 2026-01-15 | 13F | Highline Wealth Partners Llc | 674 | 6,31 | 11 | 42,86 | ||||
| 2026-02-13 | 13F | American Century Companies Inc | 4.231.316 | 15,14 | 68.124 | 67,16 | ||||
| 2026-02-17 | 13F | Two Sigma Advisers, Lp | 149.700 | -32,11 | 2.410 | -1,43 | ||||
| 2026-02-11 | 13F | Jpmorgan Chase & Co | 3.143.595 | 6,24 | 50.612 | 54,24 | ||||
| 2026-02-12 | 13F | Jane Street Group, Llc | Call | 54.400 | 876 | |||||
| 2026-02-12 | 13F | Jane Street Group, Llc | 652.417 | -57,96 | 10.504 | -38,98 | ||||
| 2026-02-12 | 13F | DRW Securities, LLC | 124.792 | 479,67 | 2.009 | 740,59 | ||||
| 2026-02-13 | 13F | BNP Paribas Asset Management Holding S.A. | 138.501 | 2 | ||||||
| 2025-11-13 | 13F | Riggs Asset Managment Co. Inc. | 0 | -100,00 | 0 | -100,00 | ||||
| 2025-11-14 | 13F | Axa S.a. | 0 | -100,00 | 0 | |||||
| 2026-02-03 | 13F | Ethic Inc. | 440.007 | -9,43 | 7.084 | 31,50 | ||||
| 2026-02-12 | 13F | Steward Partners Investment Advisory, Llc | 2.877 | 0,00 | 46 | 48,39 | ||||
| 2026-02-13 | 13F | Ieq Capital, Llc | 156.268 | 9,50 | 2.516 | 58,98 | ||||
| 2026-02-04 | 13F | Legacy Financial Advisors, Inc. | 0 | -100,00 | 0 | |||||
| 2026-01-09 | 13F | 180 Wealth Advisors, Llc | 10.506 | -14,61 | 169 | 24,26 | ||||
| 2026-02-12 | 13F | Xponance, Inc. | 19.699 | 8,16 | 317 | 57,71 | ||||
| 2026-02-17 | 13F | Point72 Asset Management, L.P. | 405.881 | -45,53 | 6.535 | -20,93 | ||||
| 2025-11-14 | 13F | Trexquant Investment LP | 0 | -100,00 | 0 | |||||
| 2026-02-13 | 13F | Marshall Wace, Llp | 657.607 | 10.587 | ||||||
| 2026-02-17 | 13F | Aquatic Capital Management LLC | 54.197 | -89,80 | 873 | -85,20 | ||||
| 2026-02-02 | 13F | Oppenheimer Asset Management Inc. | 640.723 | -2,19 | 10.316 | 42,00 | ||||
| 2026-02-17 | 13F | Schonfeld Strategic Advisors LLC | 13.881 | -76,31 | 223 | -65,64 | ||||
| 2026-01-29 | 13F | DecisionPoint Financial, LLC | 225 | 0,00 | 4 | 50,00 | ||||
| 2026-01-28 | 13F | CAPROCK Group, Inc. | 82.977 | 0,84 | 1.336 | 63,80 | ||||
| 2026-02-13 | 13F | Pathstone Holdings, LLC | 82.654 | 13,84 | 1.331 | 65,22 | ||||
| 2025-11-14 | 13F | Point72 Hong Kong Ltd | 330.600 | 3.666 | ||||||
| 2026-01-28 | 13F | HB Wealth Management, LLC | 23.625 | 20,31 | 380 | 75,12 | ||||
| 2026-01-30 | 13F | Us Bancorp \de\ | 255.586 | 43,12 | 4.115 | 107,78 | ||||
| 2026-02-12 | 13F | Principal Securities, Inc. | 0 | -100,00 | 0 | |||||
| 2026-02-11 | 13F | Janney Montgomery Scott LLC | 41.821 | -6,92 | 1 | |||||
| 2025-10-21 | 13F | Simon Quick Advisors, Llc | 0 | -100,00 | 0 | -100,00 | ||||
| 2026-02-18 | 13F | EP Wealth Advisors, Inc. | 14.314 | 230 | ||||||
| 2025-11-06 | 13F | Haven Private, LLC | 0 | -100,00 | 0 | -100,00 | ||||
| 2026-02-12 | 13F | Canopy Partners, LLC | 10.273 | 1,39 | 165 | 47,32 | ||||
| 2026-02-06 | 13F | Vestmark Advisory Solutions, Inc. | 100.958 | 1.625 | ||||||
| 2026-02-10 | 13F | Triglav Skladi, D.o.o. | 77.527 | 1.248 | ||||||
| 2026-01-30 | 13F | North Star Investment Management Corp. | 394 | 816,28 | 6 | |||||
| 2025-09-25 | NP | DFEV - Dimensional Emerging Markets Value ETF | 115.208 | 3,40 | 1.094 | 12,55 | ||||
| 2026-01-09 | 13F | Park Place Capital Corp | 280 | 5 | ||||||
| 2026-02-11 | 13F | Buckingham Strategic Partners | 26.698 | 27,49 | 430 | 66,28 | ||||
| 2026-02-13 | 13F | Squarepoint Ops LLC | 0 | -100,00 | 0 | |||||
| 2026-02-13 | 13F | Schroder Investment Management Group | 7.249.719 | -0,12 | 116.213 | 43,85 | ||||
| 2026-02-09 | 13F | Mondrian Investment Partners LTD | 11.645 | 73,94 | 187 | 152,70 | ||||
| 2026-02-06 | 13F | Pnc Financial Services Group, Inc. | 120.598 | 0,54 | 1.942 | 45,94 | ||||
| 2026-02-17 | 13F | United Capital Financial Advisers, Llc | 30.855 | 57,81 | 497 | 129,63 | ||||
| 2026-01-14 | 13F | Mitchell & Pahl Private Wealth, Llc | 26.898 | -0,20 | 433 | 45,30 | ||||
| 2026-01-16 | 13F | Ronald Blue Trust, Inc. | 82.307 | -16,19 | 1.325 | 21,67 | ||||
| 2026-02-13 | 13F | First Trust Advisors Lp | 271.353 | -22,68 | 4.369 | 12,26 | ||||
| 2026-02-17 | 13F | Cetera Investment Advisers | 193.414 | -4,81 | 3.114 | 38,17 | ||||
| 2026-02-06 | 13F | Cullen/frost Bankers, Inc. | 989 | 0,00 | 16 | 50,00 | ||||
| 2026-02-05 | 13F | Cambridge Investment Research Advisors, Inc. | 12.039 | -27,69 | 0 | |||||
| 2026-02-17 | 13F | Millennium Management Llc | 1.365.715 | -56,91 | 21.988 | -37,44 | ||||
| 2026-02-17 | 13F | CWM Advisors, LLC | 7.311 | 118 | ||||||
| 2026-01-28 | 13F | B. Metzler seel. Sohn & Co. AG | 24.986 | -80,79 | 402 | -72,12 | ||||
| 2026-02-13 | 13F | NLB Skladi, upravljanje premozenja, d.o.o. | 99.431 | 1.601 | ||||||
| 2025-11-13 | 13F/A | Peak6 Llc | Put | 0 | -100,00 | 0 | -100,00 | |||
| 2026-02-11 | 13F | O'shaughnessy Asset Management, Llc | 326.246 | 64,18 | 5.253 | 138,40 | ||||
| 2026-02-10 | 13F | Goldman Sachs Group Inc | 6.027.209 | -26,78 | 97.038 | 6,29 | ||||
| 2026-02-10 | 13F | Envestnet Asset Management Inc | 2.556.869 | 3,75 | 41.166 | 50,63 | ||||
| 2025-11-13 | 13F | Glenmede Investment Management, LP | 23.478 | 0,92 | 260 | 8,33 | ||||
| 2026-02-10 | 13F | Root Financial Partners, LLC | 693 | 6,45 | 11 | 57,14 | ||||
| 2025-09-25 | NP | DFSE - Dimensional Emerging Markets Sustainability Core 1 ETF | 4.870 | 0,00 | 46 | 9,52 | ||||
| 2026-02-13 | 13F | Arkadios Wealth Advisors | 35.734 | 25,63 | 575 | 82,54 | ||||
| 2026-02-13 | 13F | Stifel Financial Corp | 178.064 | 1,88 | 2.867 | 47,88 | ||||
| 2026-02-09 | 13F | Key FInancial Inc | 1.386 | 0,00 | 22 | 46,67 | ||||
| 2026-01-23 | 13F | Eagle Bay Advisors LLC | 1.974 | 32 | ||||||
| 2026-01-30 | 13F | Valued Wealth Advisors LLC | 676 | 0,00 | 11 | 42,86 | ||||
| 2026-02-13 | 13F | Golden State Wealth Management, LLC | 1.795 | 0,00 | 29 | 47,37 | ||||
| 2026-02-04 | 13F | BCJ Capital Management, LLC | 15.602 | 12,62 | 251 | 64,05 | ||||
| 2026-02-05 | 13F | May Hill Capital, LLC | 19.664 | 317 | ||||||
| 2026-02-10 | 13F | Acadian Asset Management Llc | 6.262.066 | 159,44 | 101 | 284,62 | ||||
| 2026-02-05 | 13F | Atria Investments Llc | 50.175 | -3,11 | 808 | 40,59 | ||||
| 2026-01-30 | 13F | Caldwell Securities, Inc | 666 | 0,00 | 11 | 42,86 | ||||
| 2025-09-29 | NP | SOXL - Direxion Daily Semiconductor Bull 3X Shares | 6.963.243 | 17,23 | 66.151 | 27,57 | ||||
| 2026-01-08 | 13F | Wealth Enhancement Advisory Services, Llc | 25.810 | 55,00 | 452 | 138,62 | ||||
| 2026-02-17 | 13F | Wiley Bros.-aintree Capital, Llc | 83.945 | 94,22 | 1.352 | 181,46 | ||||
| 2026-02-10 | 13F | Basepoint Wealth LLC | 212 | 3 | ||||||
| 2026-01-14 | 13F | Jfs Wealth Advisors, Llc | 2.088 | 24,43 | 34 | 83,33 | ||||
| 2026-02-11 | 13F | First Command Advisory Services, Inc. | 271 | 4 | ||||||
| 2025-09-25 | NP | VEIEX - Vanguard Emerging Markets Stock Index Fund Investor Shares | 28.912 | 275 | ||||||
| 2026-02-13 | 13F | Sei Investments Co | 724.330 | 11,75 | 11.662 | 62,23 | ||||
| 2026-01-09 | 13F | Dynamic Advisor Solutions LLC | 10.373 | -2,97 | 167 | 41,53 | ||||
| 2026-02-13 | 13F | Walleye Capital LLC | Call | 144.700 | 3.429,27 | 2.330 | 5.075,56 | |||
| 2026-02-13 | 13F | Walleye Capital LLC | Put | 46.400 | 747 | |||||
| 2026-01-21 | 13F | Westfuller Advisors, LLC | 485 | 0,00 | 8 | 40,00 | ||||
| 2026-02-13 | 13F | JustInvest LLC | 366.300 | 7,61 | 5.897 | 56,25 | ||||
| 2026-02-13 | 13F | Polymer Capital Management (HK) LTD | 0 | -100,00 | 0 | |||||
| 2026-02-11 | 13F | Vise Technologies, Inc. | 61.138 | 8,30 | 984 | 57,19 | ||||
| 2026-01-27 | 13F | Proffitt & Goodson Inc | 652 | 0,00 | 10 | 42,86 | ||||
| 2026-02-17 | 13F | Fmr Llc | 136.503 | -2,82 | 2.198 | 41,10 | ||||
| 2026-02-06 | 13F | Kilter Group LLC | 0 | -100,00 | 0 | |||||
| 2026-02-12 | 13F | Quadrant Capital Group Llc | 373.439 | 0,38 | 6.012 | 45,75 | ||||
| 2026-02-10 | 13F/A | Northwestern Mutual Wealth Management Co | 12.831 | 43,24 | 207 | 108,08 | ||||
| 2026-02-17 | 13F | Silvercrest Asset Management Group Llc | 22.306 | 65,11 | 359 | 140,94 | ||||
| 2026-02-13 | 13F | Rafferty Asset Management, LLC | 4.653.904 | 4,46 | 74.928 | 51,65 | ||||
| 2026-02-09 | 13F | Coldstream Capital Management Inc | 75.699 | -11,83 | 1.219 | 27,94 | ||||
| 2026-02-17 | 13F | Laird Norton Trust Company, Llc | 290.450 | 4.676 | ||||||
| 2026-01-23 | 13F | Assetmark, Inc | 23.926 | 538,71 | 385 | 839,02 | ||||
| 2026-02-10 | 13F | Connor, Clark & Lunn Investment Management Ltd. | 362.939 | -64,32 | 5.843 | -48,21 | ||||
| 2026-02-17 | 13F | Voloridge Investment Management, Llc | 694.560 | 410,39 | 11.182 | 641,02 | ||||
| 2026-02-17 | 13F | Warren Averett Asset Management, LLC | 24.770 | 34,14 | 399 | 95,10 | ||||
| 2026-02-05 | 13F | Td Private Client Wealth Llc | 54.286 | 18,38 | 874 | 72,05 | ||||
| 2026-02-13 | 13F | Walleye Capital LLC | 20.943 | -10,05 | 337 | 30,62 | ||||
| 2026-02-13 | 13F | Ariadne Wealth Management, LP | 16.753 | -0,23 | 393 | 60,41 | ||||
| 2026-01-16 | 13F | Pictet & Cie (Europe) SA | 165.464 | 31,45 | 2.664 | 90,90 | ||||
| 2026-01-05 | 13F | Confluence Investment Management Llc | 21.200 | 0,00 | 341 | 45,11 | ||||
| 2026-01-29 | 13F | Vanguard Group Inc | 1.251.302 | -33,37 | 20.146 | -3,27 | ||||
| 2026-02-13 | 13F | Caitong International Asset Management Co., Ltd | 446 | 44.500,00 | 7 | |||||
| 2026-01-07 | 13F | Retirement Wealth Solutions LLC | 1.530 | 0,00 | 25 | 50,00 | ||||
| 2025-09-25 | NP | VMNVX - Vanguard Global Minimum Volatility Fund Admiral Shares | 1.612.923 | 4,94 | 15.323 | 14,19 | ||||
| 2026-02-05 | 13F | Elyxium Wealth, LLC | 55 | 1 | ||||||
| 2026-02-17 | 13F | SageView Advisory Group, LLC | 132.001 | -4,91 | 2.125 | 38,08 | ||||
| 2026-02-09 | 13F | Geode Capital Management, Llc | 0 | -100,00 | 0 | |||||
| 2026-02-12 | 13F | Renaissance Technologies Llc | 0 | -100,00 | 0 | |||||
| 2026-01-05 | 13F | Union Bancaire Privee, UBP SA | 0 | -100,00 | 0 | |||||
| 2026-01-21 | 13F | Delphi Management Inc /ma/ | 98.529 | -25,10 | 2 | 0,00 | ||||
| 2026-01-20 | 13F | Signaturefd, Llc | 87.211 | -4,62 | 1.404 | 38,60 | ||||
| 2026-01-21 | 13F | Stone House Investment Management, LLC | 250 | 0,00 | 4 | 100,00 | ||||
| 2026-02-09 | 13F | Harbour Investments, Inc. | 101 | 0,00 | 2 | 0,00 | ||||
| 2026-02-19 | 13F | Atomi Financial Group, Inc. | 42.975 | 15,13 | 692 | 67,31 | ||||
| 2026-02-10 | 13F | Greenspring Advisors, LLC | 18.021 | 290 | ||||||
| 2026-02-13 | 13F | FORA Capital, LLC | 0 | -100,00 | 0 | |||||
| 2026-02-12 | 13F | Campbell & CO Investment Adviser LLC | 0 | -100,00 | 0 | |||||
| 2026-01-23 | 13F | Rsm Us Wealth Management Llc | 13.829 | 3,56 | 222 | 49,32 | ||||
| 2026-02-24 | 13F | Bell Investment Advisors, Inc | 1.937 | 193,93 | 31 | 342,86 | ||||
| 2025-11-14 | 13F | Eqis Capital Management, Inc. | 0 | -100,00 | 0 | |||||
| 2026-02-17 | 13F | Russell Investments Group, Ltd. | 8.039 | -13,24 | 129 | 26,47 | ||||
| 2026-01-20 | 13F | Princeton Global Asset Management LLC | 301 | 0,00 | 5 | 33,33 | ||||
| 2025-11-12 | 13F | NewSquare Capital LLC | 0 | -100,00 | 0 | |||||
| 2026-01-23 | 13F | Farther Finance Advisors, LLC | 11.061 | 127,97 | 178 | 235,85 | ||||
| 2026-01-29 | 13F | Rakuten Securities, Inc. | 1.350 | 22 | ||||||
| 2026-02-10 | 13F | Natixis Advisors, L.p. | 2.543.138 | 1,70 | 41 | 48,15 | ||||
| 2026-02-13 | 13F | Colony Group, LLC | 35.873 | 71,30 | 578 | 140,42 | ||||
| 2026-02-09 | 13F | Hantz Financial Services, Inc. | 62.543 | 84,90 | 1 | |||||
| 2025-09-24 | NP | EMQAX - Ashmore Emerging Markets Active Equity Fund CLASS A | 15.700 | -51,69 | 149 | -47,35 | ||||
| 2025-09-05 | 13F | Abn Amro Investment Solutions | 0 | -100,00 | 0 | -100,00 | ||||
| 2026-02-09 | 13F | Huntington National Bank | 1.047 | 42,26 | 17 | 100,00 | ||||
| 2026-02-17 | 13F | Summit Global Investments | 28.905 | -50,31 | 0 | |||||
| 2026-02-17 | 13F | Bank Of America Corp /de/ | 8.769.918 | -9,23 | 141.196 | 31,78 | ||||
| 2026-02-03 | 13F | Sequoia Financial Advisors, LLC | 138.624 | 4,30 | 2.232 | 51,36 | ||||
| 2025-11-14 | 13F | AXA Investment Managers S.A. | 179.031 | 1.985 | ||||||
| 2026-02-12 | 13F | Wealthspire Advisors, LLC | 11.179 | 15.006,76 | 180 | |||||
| 2026-02-17 | 13F | FIL Ltd | 57.769 | 930 | ||||||
| 2026-02-13 | 13F | Peak6 Llc | Call | 77.100 | 1.241 | |||||
| 2026-02-17 | 13F | Advisory Services Network, LLC | 0 | -100,00 | 0 | |||||
| 2026-02-17 | 13F | Mercer Global Advisors Inc /adv | 21.550 | -3,74 | 347 | 39,52 | ||||
| 2026-02-27 | 13F | Groupama Asset Managment | 81.792 | 1,67 | 1.317 | 47,53 | ||||
| 2026-02-05 | 13F | Allworth Financial LP | 8.091 | 15,22 | 130 | 68,83 | ||||
| 2026-01-16 | 13F | Banque Pictet & Cie Sa | 328.446 | -1,83 | 5.288 | 42,51 | ||||
| 2026-02-11 | 13F | Syon Capital Llc | 13.223 | 213 | ||||||
| 2026-02-13 | 13F | Umb Bank N A/mo | 1.999 | 32 | ||||||
| 2026-02-13 | 13F | Verition Fund Management LLC | 266.600 | -80,33 | 4.292 | -71,44 | ||||
| 2026-02-12 | 13F | Earnest Partners Llc | 1.985.057 | -44,56 | 31.959 | -19,52 | ||||
| 2026-01-28 | 13F | WPG Advisers, LLC | 451 | 0,00 | 7 | 40,00 | ||||
| 2026-02-06 | 13F | Americana Partners, LLC | 17.451 | 9,49 | 281 | 59,09 | ||||
| 2026-02-14 | 13F | Frec Markets, Inc. | 19.765 | 318 | ||||||
| 2026-02-10 | 13F | Bnp Paribas Arbitrage, Sa | 898.625 | 59,71 | 14.468 | 131,88 | ||||
| 2026-02-17 | 13F | GeoWealth Management, LLC | 11.781 | -14,30 | 190 | 24,34 | ||||
| 2026-02-17 | 13F | Aqr Capital Management Llc | 34.302 | 552 | ||||||
| 2026-01-12 | 13F | Abound Wealth Management | 87 | -20,91 | 1 | 0,00 | ||||
| 2026-02-11 | 13F | West Family Investments, Inc. | 37.452 | -29,01 | 603 | 2,91 | ||||
| 2026-02-12 | 13F | Federated Hermes, Inc. | 70.584 | -10,92 | 1.136 | 29,38 | ||||
| 2026-02-13 | 13F | FirstWave Capital Management LLC | 84.380 | 1.359 | ||||||
| 2026-02-17 | 13F | Nomura Holdings Inc | 135.000 | -29,87 | 2.174 | 1,83 | ||||
| 2026-01-23 | 13F | BSW Wealth Partners | 53.998 | -0,15 | 869 | 45,08 | ||||
| 2026-02-17 | 13F | Ameriprise Financial Inc | 59.291 | 11,70 | 955 | 62,24 | ||||
| 2026-02-13 | 13F | Wells Fargo & Company/mn | 1.456.181 | 15,73 | 23.445 | 68,01 | ||||
| 2026-02-02 | 13F | Nkcfo Llc | 7.000 | 0 | ||||||
| 2026-02-03 | 13F | We Are One Seven, LLC | 11.026 | 1,10 | 178 | 47,50 | ||||
| 2026-02-11 | 13F | Cerity Partners LLC | 177.473 | -4,04 | 2.857 | 39,37 | ||||
| 2026-02-13 | 13F | Mariner, LLC | 224.081 | 6,20 | 3.604 | 54,02 | ||||
| 2026-02-17 | 13F | NorthRock Partners, LLC | 0 | -100,00 | 0 | |||||
| 2026-02-17 | 13F | Atom Investors LP | 0 | -100,00 | 0 | |||||
| 2025-10-22 | 13F | Geneos Wealth Management Inc. | 0 | -100,00 | 0 | |||||
| 2026-01-08 | 13F | Tuttle Tactical Management LLC | 45.240 | 728 | ||||||
| 2026-02-11 | 13F | Group One Trading, L.p. | 19.961 | 321 | ||||||
| 2026-02-13 | 13F | Citigroup Inc | 3.160.889 | 24,30 | 50.890 | 80,46 | ||||
| 2026-02-17 | 13F | Susquehanna International Group, Llp | Call | 28.900 | -22,93 | 465 | 12,05 | |||
| 2026-02-09 | 13F | Hartland & Co., LLC | 715 | 0,00 | 12 | 57,14 | ||||
| 2026-02-11 | 13F | LPL Financial LLC | 174.198 | 50,10 | 2.805 | 117,87 | ||||
| 2026-02-11 | 13F | Erste Asset Management GmbH | 0 | 0 | ||||||
| 2026-02-17 | 13F | Ancora Advisors, LLC | 794 | 13 | ||||||
| 2026-02-17 | 13F | Susquehanna International Group, Llp | 322.860 | 187,24 | 5.198 | 317,17 | ||||
| 2025-10-31 | 13F | Whittier Trust Co | 0 | -100,00 | 0 | -100,00 | ||||
| 2026-02-17 | 13F | Susquehanna International Group, Llp | Put | 19.400 | 312 | |||||
| 2026-02-17 | 13F | Scientech Research LLC | 24.505 | 395 | ||||||
| 2026-02-24 | 13F | SG Trading Solutions, LLC | 28.107 | 0 | ||||||
| 2026-01-15 | 13F | Frank, Rimerman Advisors LLC | 37.500 | 1,96 | 604 | 48,16 | ||||
| 2025-11-20 | 13F | First Affirmative Financial Network | 40.686 | 18,47 | 451 | 27,40 | ||||
| 2026-01-16 | 13F | Crewe Advisors LLC | 306 | 0,00 | 5 | 33,33 | ||||
| 2026-01-23 | 13F | U.S. Capital Wealth Advisors, LLC | 18.294 | 0,80 | 295 | 46,27 | ||||
| 2026-02-09 | 13F | Bleakley Financial Group, LLC | 12.956 | 209 | ||||||
| 2026-02-17 | 13F | Brevan Howard Capital Management LP | 0 | -100,00 | 0 | |||||
| 2026-01-26 | 13F | Private Trust Co Na | 574 | 89,44 | 9 | 200,00 | ||||
| 2026-02-13 | 13F | Toroso Investments, LLC | Call | 7.900 | 127 | |||||
| 2026-02-09 | 13F | Legal & General Group Plc | 4.323 | -72,37 | 70 | -60,12 | ||||
| 2026-02-13 | 13F | Walleye Trading LLC | Put | 15.000 | 242 | |||||
| 2026-02-11 | 13F | Deutsche Bank Ag\ | 17.677 | 31,40 | 285 | 90,60 | ||||
| 2026-01-23 | 13F | Bridgewater Advisors Inc. | 30.810 | 4,05 | 585 | 28,35 | ||||
| 2025-11-12 | 13F | Thornburg Investment Management Inc | 0 | -100,00 | 0 | |||||
| 2026-02-13 | 13F | Walleye Trading LLC | Call | 166.000 | 2.673 | |||||
| 2026-02-06 | 13F | HighTower Advisors, LLC | 43.176 | 2,99 | 695 | 49,78 | ||||
| 2025-11-13 | 13F | Healthcare Of Ontario Pension Plan Trust Fund | 0 | -100,00 | 0 | -100,00 | ||||
| 2026-02-12 | 13F | Dimensional Fund Advisors Lp | 1.274.229 | 7,77 | 20.515 | 56,46 | ||||
| 2025-09-25 | NP | VIHAX - Vanguard International High Dividend Yield Index Fund Admiral Shares | 148.022 | 0,00 | 1.406 | 8,82 | ||||
| 2026-01-22 | 13F | Venturi Wealth Management, LLC | 14.034 | 226 | ||||||
| 2026-02-17 | 13F | Guggenheim Capital Llc | 276.723 | -0,85 | 4.455 | 43,94 | ||||
| 2026-02-12 | 13F | Bank Of Montreal /can/ | 29.903 | 144,91 | 481 | 256,30 | ||||
| 2026-01-21 | 13F | Leo Wealth, LLC | 14.341 | 3,18 | 231 | 49,35 | ||||
| 2026-02-03 | 13F | Ballentine Partners, LLC | 116.390 | -1,08 | 1.874 | 43,63 | ||||
| 2026-01-27 | 13F | Evergreen Capital Management Llc | 27.797 | -1,27 | 448 | 43,27 | ||||
| 2026-02-11 | 13F | Franklin Resources Inc | 16.326 | 0,00 | 263 | 44,75 | ||||
| 2025-09-26 | 13F | Capital A Wealth Management, LLC | 0 | -100,00 | 0 | |||||
| 2026-02-09 | 13F | Fisher Asset Management, LLC | 4.641.965 | -1,80 | 74.736 | 42,56 | ||||
| 2026-02-14 | 13F | Rockefeller Capital Management L.P. | 12.299 | 26,90 | 198 | 85,05 | ||||
| 2026-02-13 | 13F | Kestra Advisory Services, LLC | 0 | -100,00 | 0 | |||||
| 2026-02-13 | 13F | Smartleaf Asset Management LLC | 5.740 | 116,36 | 92 | 217,24 | ||||
| 2026-02-13 | 13F | Fortitude Advisory Group L.L.C. | 30.475 | 0,68 | 491 | 46,27 | ||||
| 2026-02-02 | 13F | Truist Financial Corp | 19.109 | 21,79 | 308 | 76,44 | ||||
| 2026-02-06 | 13F | Larson Financial Group LLC | 282.111 | -2,02 | 4.542 | 42,22 | ||||
| 2026-02-13 | 13F | SRS Capital Advisors, Inc. | 15.493 | 816,20 | 249 | 1.283,33 | ||||
| 2026-02-13 | 13F | Barclays Plc | 3.748.570 | 27,34 | 60.352 | 84,86 | ||||
| 2026-02-12 | 13F | BlackRock, Inc. | 19.460.980 | -0,19 | 313.322 | 44,90 | ||||
| 2026-02-17 | 13F | Amundi | 171.930 | 0,00 | 2.768 | 41,37 | ||||
| 2026-02-13 | 13F | Y-Intercept (Hong Kong) Ltd | 0 | -100,00 | 0 | |||||
| 2026-02-13 | 13F | Cullen Capital Management, LLC | 5.607.381 | -0,20 | 90.279 | 44,88 | ||||
| 2026-02-13 | 13F | Neuberger Berman Group LLC | 197.090 | 2,60 | 3.173 | 48,97 | ||||
| 2026-02-17 | 13F | D. E. Shaw & Co., Inc. | 22.002 | -97,06 | 354 | -95,74 | ||||
| 2025-11-14 | 13F | Wetherby Asset Management Inc | 188.734 | 4,20 | 2.093 | 11,93 | ||||
| 2026-02-17 | 13F | Citadel Advisors Llc | Put | 58.200 | 380,99 | 937 | 599,25 | |||
| 2026-02-17 | 13F | Citadel Advisors Llc | Call | 61.300 | 987 | |||||
| 2025-11-14 | 13F | Point72 Asia (Singapore) Pte. Ltd. | 44.597 | -78,70 | 495 | -77,16 | ||||
| 2026-02-17 | 13F | Public Employees Retirement System Of Ohio | 0 | -100,00 | 0 | |||||
| 2026-01-21 | 13F | Greenleaf Trust | 13.246 | 12,15 | 213 | 63,85 | ||||
| 2026-01-26 | 13F | Merit Financial Group, LLC | 47.388 | 10,38 | 763 | 60,08 | ||||
| 2025-11-13 | 13F | Rehmann Capital Advisory Group | 11.302 | 1,56 | 125 | 9,65 | ||||
| 2026-01-29 | 13F | Aprio Wealth Management, LLC | 12.852 | 19,31 | 207 | 73,11 | ||||
| 2026-02-02 | 13F | Fifth Third Bancorp | 577 | 0,00 | 9 | 50,00 | ||||
| 2026-02-11 | 13F | Ovata Capital Management Ltd | 352.320 | -62,79 | 5.785 | -44,23 | ||||
| 2026-02-13 | 13F | Inspire Advisors, LLC | 12.361 | -8,96 | 199 | 32,67 | ||||
| 2026-02-06 | 13F | IFP Advisors, Inc | 456 | 0,00 | 7 | 40,00 | ||||
| 2026-02-12 | 13F | Rossby Financial, LCC | 65 | 0,00 | 1 | |||||
| 2026-02-13 | 13F | Morgan Stanley | 10.607.588 | 14,34 | 170.782 | 66,00 | ||||
| 2025-09-25 | NP | DFEM - Dimensional Emerging Markets Core Equity 2 ETF | 138.000 | 64,29 | 1.311 | 78,85 | ||||
| 2026-01-23 | 13F | Westside Investment Management, Inc. | 1.545 | 11,63 | 26 | 66,67 | ||||
| 2025-09-25 | NP | DFAE - Dimensional Emerging Core Equity Market ETF | 386.500 | 31,91 | 3.672 | 43,57 | ||||
| 2026-02-17 | 13F | Aspen Grove Capital, LLC | 31.718 | -7,76 | 511 | 33,86 | ||||
| 2026-02-04 | 13F | Drive Wealth Management, Llc | 15.090 | 0,82 | 243 | 45,78 | ||||
| 2026-02-12 | 13F | Brown Brothers Harriman & Co | 951 | 32,27 | 15 | 114,29 | ||||
| 2026-02-17 | 13F | Aureus Asset Management, LLC | 15.608 | 34,64 | 251 | 96,09 | ||||
| 2026-01-27 | 13F | WealthCollab, LLC | 4.850 | 0,00 | 78 | 47,17 | ||||
| 2025-11-04 | 13F | High Note Wealth, LLC | 0 | -100,00 | 0 | |||||
| 2026-01-14 | 13F | Exchange Traded Concepts, Llc | 8.109 | -52,79 | 131 | -31,58 | ||||
| 2025-09-24 | NP | SGIDX - Steward Global Equity Income Fund Class A | 804.777 | 0,85 | 7.645 | 9,75 | ||||
| 2026-02-13 | 13F | Capula Management Ltd | 44.160 | -93,21 | 711 | -90,16 | ||||
| 2026-01-08 | 13F | Grove Bank & Trust | 10.628 | -3,57 | 171 | 40,16 | ||||
| 2026-01-26 | 13F | Cwm, Llc | 17.306 | -1,55 | 0 | |||||
| 2026-02-02 | 13F | Qrg Capital Management, Inc. | 33.241 | 9,15 | 535 | 58,75 | ||||
| 2026-01-30 | 13F | Turning Point Benefit Group, Inc. | 82 | 0,00 | 1 | |||||
| 2026-02-17 | 13F | Raymond James Financial Inc | 227.821 | 41,44 | 3.666 | 105,21 | ||||
| 2026-02-23 | 13F | Virtu Financial LLC | 0 | -100,00 | 0 | |||||
| 2026-02-10 | 13F | NINE MASTS CAPITAL Ltd | 739.619 | -12,13 | 11.908 | 27,57 | ||||
| 2025-12-09 | 13F/A | Tudor Investment Corp Et Al | 12.886 | 143 | ||||||
| 2026-02-17 | 13F | Old Mission Capital Llc | 58.058 | 935 | ||||||
| 2025-11-06 | 13F | Lsv Asset Management | 0 | -100,00 | 0 | -100,00 | ||||
| 2026-02-12 | 13F | Brinker Capital Investments, LLC | 169.204 | -2,61 | 2.724 | 41,43 | ||||
| 2026-02-03 | 13F | NewEdge Wealth, LLC | 43.769 | 18,02 | 705 | 19,93 | ||||
| 2026-02-17 | 13F | Tower Research Capital LLC (TRC) | 137.976 | 59.117,17 | 2.221 | 110.950,00 | ||||
| 2026-02-17 | 13F | Creative Planning | 1.369.918 | 20,76 | 22.056 | 75,32 | ||||
| 2025-11-14 | 13F | Balyasny Asset Management Llc | 0 | -100,00 | 0 | |||||
| 2026-02-12 | 13F | BRYN MAWR TRUST Co | 0 | -100,00 | 0 | -100,00 | ||||
| 2025-10-09 | 13F | Bartlett & Co. Wealth Management Llc | 0 | -100,00 | 0 | -100,00 | ||||
| 2026-01-30 | 13F/A | M&t Bank Corp | 12.932 | 0,00 | 208 | 45,45 | ||||
| 2026-02-13 | 13F | OpenArc Corporate Advisory, LLC | 25.499 | 411 | ||||||
| 2026-02-11 | 13F | Havemeyer Place LP | 84.971 | 1.368 | ||||||
| 2026-02-12 | 13F | Hrt Financial Lp | 0 | -100,00 | 0 | |||||
| 2026-01-15 | 13F | Nisa Investment Advisors, Llc | 1.669 | 27 | ||||||
| 2026-01-12 | 13F | Legacy Wealth Asset Management, LLC | 172.413 | -31,16 | 2.776 | -0,07 | ||||
| 2026-02-11 | 13F | Dorsey & Whitney Trust CO LLC | 10.276 | -23,01 | 165 | 11,49 | ||||
| 2026-02-13 | 13F | Cornerstone Financial Management LLC | 420 | 7 | ||||||
| 2026-01-21 | 13F | Yousif Capital Management, Llc | 34.577 | 0,00 | 654 | 70,50 | ||||
| 2026-02-17 | 13F | Royal Bank Of Canada | 580.831 | 13,47 | 9.352 | 64,73 | ||||
| 2025-10-15 | 13F | Enterprise Financial Services Corp | 0 | -100,00 | 0 | |||||
| 2026-02-06 | 13F | Banque Cantonale Vaudoise | 66.357 | 0,08 | 1.069 | |||||
| 2026-01-21 | 13F | Aaron Wealth Advisors LLC | 31.507 | 11,23 | 507 | 61,46 | ||||
| 2026-02-17 | 13F | Advisor Group Holdings, Inc. | 17.118 | -5,90 | 276 | 41,03 | ||||
| 2026-01-14 | 13F | Spire Wealth Management | 124 | 2 | ||||||
| 2026-02-13 | 13F | MAI Capital Management | 901 | 0,00 | 15 | 55,56 | ||||
| 2026-02-17 | 13F | Lazard Asset Management Llc | 20.010.829 | 11,09 | 322.174 | 61,28 | ||||
| 2026-02-12 | 13F | Skopos Labs, Inc. | 98.429 | 239,04 | 1.577 | 413,36 | ||||
| 2026-01-23 | 13F | Ritholtz Wealth Management | 42.953 | 2,50 | 692 | 48,92 | ||||
| 2026-02-14 | 13F | Whipplewood Advisors, LLC | 439 | 7 | ||||||
| 2026-01-16 | 13F | CogentBlue Wealth Advisors, LLC | 20.299 | 60,71 | 327 | 132,86 | ||||
| 2026-02-18 | 13F | GWM Advisors LLC | 13.669 | -0,18 | 220 | 45,70 | ||||
| 2025-10-30 | 13F | Twin Peaks Wealth Advisors, LLC | 0 | -100,00 | 0 | -100,00 | ||||
| 2026-02-13 | 13F | Resources Investment Advisors, LLC. | 16.527 | -9,76 | 266 | 31,03 | ||||
| 2026-02-17 | 13F | Jain Global LLC | 0 | -100,00 | 0 | |||||
| 2026-02-10 | 13F | Eurizon Capital SGR S.p.A. | 165.722 | 2.653 | ||||||
| 2026-02-11 | 13F | Parallel Advisors, LLC | 25.975 | 1,89 | 418 | 48,23 | ||||
| 2026-02-10 | 13F | Td Asset Management Inc | 11.526 | 186 | ||||||
| 2025-10-08 | 13F | Armstrong Advisory Group, Inc | 0 | -100,00 | 0 | -100,00 | ||||
| 2026-02-17 | 13F | Farringdon Capital, Ltd. | 0 | -100,00 | 0 | |||||
| 2026-02-17 | 13F | Engineers Gate Manager LP | 14.490 | -89,66 | 233 | -85,01 | ||||
| 2026-02-13 | 13F | Pinpoint Asset Management (Singapore) Pte. Ltd. | 0 | -100,00 | 0 | |||||
| 2026-02-13 | 13F | Rhumbline Advisers | 504.292 | -20,11 | 8.119 | 15,99 | ||||
| 2026-02-17 | 13F | Henry James International Management Inc. | 20.027 | -2,58 | 322 | 41,85 | ||||
| 2026-02-24 | 13F | DGS Capital Management, LLC | 67.430 | -5,16 | 1.086 | 37,69 | ||||
| 2026-02-17 | 13F | Citadel Advisors Llc | 0 | -100,00 | 0 | |||||
| 2026-01-12 | 13F | Foster Group, Inc. | 15.766 | -3,82 | 254 | 39,78 | ||||
| 2025-09-26 | NP | FTLS - First Trust Long/Short Equity ETF This fund is a listed as child fund of First Trust Advisors Lp and if that institution has disclosed ownership in this security, then these positions will not be double counted when calculating total shares and total value | Short | -391.367 | -3.718 | |||||
| 2026-02-17 | 13F | Qube Research & Technologies Ltd | 0 | -100,00 | 0 | |||||
| 2026-02-13 | 13F | Parkside Financial Bank & Trust | 2.350 | 0,00 | 38 | 42,31 | ||||
| 2026-02-17 | 13F | Graham Capital Management, L.P. | 72.900 | -37,86 | 1.174 | -9,77 | ||||
| 2025-09-29 | NP | SOXY - YieldMax(TM) Target 12(TM) Semiconductor Option Income ETF | 3.958 | 3,97 | 38 | 12,12 | ||||
| 2025-09-25 | NP | DFAX - Dimensional World ex U.S. Core Equity 2 ETF | 79.484 | 0,00 | 755 | 8,95 | ||||
| 2026-02-13 | 13F | Itau Unibanco Holding S.A. | 802 | 13 | ||||||
| 2026-01-23 | 13F | Lester Murray Antman dba SimplyRich | 17.749 | 0 | ||||||
| 2026-01-15 | 13F | Allspring Global Investments Holdings, LLC | 27.394 | 81,85 | 462 | 176,05 | ||||
| 2026-02-13 | 13F | Atlas Capital Advisors Llc | 16.342 | 13,60 | 263 | 77,70 | ||||
| 2025-11-06 | 13F | Wealthstream Advisors, Inc. | 17.574 | 19,87 | 195 | 28,48 | ||||
| 2026-02-05 | 13F | Bessemer Group Inc | 611 | 55,08 | 0 | |||||
| 2026-02-17 | 13F | Boothbay Fund Management, Llc | 185.421 | -8,57 | 2.985 | 32,73 | ||||
| 2025-11-14 | 13F | Mount Yale Investment Advisors, LLC | 0 | -100,00 | 0 | -100,00 | ||||
| 2025-11-12 | 13F | Headlands Technologies LLC | 0 | -100,00 | 0 | -100,00 | ||||
| 2026-02-13 | 13F | Aigen Investment Management, Lp | 0 | -100,00 | 0 | |||||
| 2026-02-17 | 13F | Signature Equity Partners, LLC | 479 | 8 | ||||||
| 2026-01-08 | 13F | True Wealth Design, LLC | 692 | 77,44 | 11 | 175,00 | ||||
| 2026-01-29 | 13F | UBS Group AG | 9.038.322 | 11,37 | 145.517 | 61,68 | ||||
| 2026-02-06 | 13F | GPS Wealth Strategies Group, LLC | 1.125 | 0,00 | 18 | 50,00 | ||||
| 2026-02-17 | 13F | ExodusPoint Capital Management, LP | 0 | -100,00 | 0 | -100,00 | ||||
| 2026-02-17 | 13F | Weiss Asset Management LP | 0 | -100,00 | 0 | -100,00 | ||||
| 2026-01-26 | 13F | Mirae Asset Global Investments Co., Ltd. | 271.407 | 84,95 | 4.370 | 168,53 | ||||
| 2026-01-27 | 13F | Ninety One UK Ltd | 99.658 | -17,94 | 1.604 | 19,17 | ||||
| 2026-02-13 | 13F | Transamerica Financial Advisors, Inc. | 3.435 | 55 | ||||||
| 2026-02-18 | 13F | Vident Advisory, LLC | 540.844 | -5,58 | 8.708 | 37,07 | ||||
| 2026-02-17 | 13F | Jones Financial Companies Lllp | 13.837 | 15,64 | 223 | 66,92 | ||||
| 2025-11-13 | 13F | Barometer Capital Management Inc. | 0 | -100,00 | 0 | |||||
| 2026-02-10 | 13F | Savant Capital, LLC | 34.825 | -3,32 | 561 | 40,35 | ||||
| 2026-02-11 | 13F | Capital Wealth Planning, LLC | 577.950 | 111,89 | 9.744 | 222,22 | ||||
| 2026-02-17 | 13F | Quantinno Capital Management LP | 426.711 | 30,36 | 6.870 | 89,26 | ||||
| 2026-02-13 | 13F | Candriam Luxembourg S.C.A. | 22.469 | 0,00 | 362 | 44,98 | ||||
| 2026-02-12 | 13F | CIBC Private Wealth Group, LLC | 924 | 0,00 | 15 | 40,00 | ||||
| 2026-02-06 | 13F | Profund Advisors Llc | 112.432 | 21,07 | 1.810 | 75,90 | ||||
| 2026-01-23 | 13F | Cambiar Investors Llc | 11.150 | -33,23 | 180 | -3,24 | ||||
| 2026-02-17 | 13F | Jump Financial, LLC | 573.788 | 1.319,95 | 9.238 | 1.961,83 | ||||
| 2026-01-20 | 13F | Whalen Wealth Management Inc. | 19.100 | 308 | ||||||
| 2026-01-29 | 13F | Concurrent Investment Advisors, LLC | 10.624 | 171 | ||||||
| 2026-02-10 | 13F | Tidemark, LLC | 713 | 0,00 | 11 | 57,14 | ||||
| 2025-11-12 | 13F | Quantbot Technologies LP | 0 | -100,00 | 0 | |||||
| 2026-02-13 | 13F | National Bank Of Canada /fi/ | 0 | -100,00 | 0 | |||||
| 2026-02-06 | 13F | Global Retirement Partners, LLC | 70.865 | 1.096,84 | 1.141 | 1.653,85 | ||||
| 2025-10-27 | 13F | First Horizon Corp | 0 | -100,00 | 0 | |||||
| 2026-02-02 | 13F | Horizon Investments, LLC | 8.109 | -52,79 | 131 | -31,58 | ||||
| 2025-11-12 | 13F | Fox Run Management, L.l.c. | 0 | -100,00 | 0 | -100,00 | ||||
| 2026-01-26 | 13F | Moran Wealth Management, LLC | 379.781 | -34,00 | 6.114 | -4,18 | ||||
| 2025-09-24 | NP | SNTKX - Steward International Enhanced Index Fund Class A | 57.146 | 0,00 | 543 | 8,84 | ||||
| 2026-02-06 | 13F | EverSource Wealth Advisors, LLC | 22.765 | -1,68 | 367 | 42,97 | ||||
| 2026-01-30 | 13F | CBOE Vest Financial, LLC | 12.954 | 5,17 | 209 | 52,94 | ||||
| 2026-01-30 | 13F | Kiker Wealth Management, LLC | 0 | -100,00 | 0 | |||||
| 2026-02-12 | 13F | Advisors Asset Management, Inc. | 148.402 | 7,74 | 2.389 | 56,45 | ||||
| 2026-01-29 | 13F | Quest 10 Wealth Builders, Inc. | 0 | -100,00 | 0 | |||||
| 2026-02-03 | 13F | SBI Securities Co., Ltd. | 2.495 | 256,43 | 40 | 471,43 | ||||
| 2026-02-11 | 13F | Allianz Asset Management GmbH | 252.662 | 4.068 | ||||||
| 2026-02-17 | 13F | Capital Fund Management S.a. | 615.157 | 234,42 | 9.904 | 385,73 | ||||
| 2026-01-16 | 13F | Standard Life Aberdeen plc | 0 | -100,00 | 0 | -100,00 | ||||
| 2026-01-26 | 13F | PDS Planning, Inc | 47.500 | 0,34 | 765 | 45,80 | ||||
| 2025-09-25 | NP | DEHP - Dimensional Emerging Markets High Profitability ETF | 9.644 | 92 | ||||||
| 2026-01-23 | 13F | TT International Asset Management LTD | 1.236.070 | 69,84 | 20 | -99,76 | ||||
| 2025-11-14 | 13F | Two Sigma Securities, Llc | 0 | -100,00 | 0 | |||||
| 2026-01-05 | 13F | GAMMA Investing LLC | 28.368 | 16,99 | 457 | 70,15 | ||||
| 2026-02-17 | 13F | Northern Trust Corp | 1.251.538 | 13,30 | 20.150 | 64,48 | ||||
| 2026-02-19 | 13F | Invesco Ltd. | 132.402 | -6,15 | 2.132 | 36,25 | ||||
| 2026-02-05 | 13F | Abacus Wealth Partners, LLC | 55.864 | 387,90 | 899 | 613,49 | ||||
| 2025-09-29 | NP | TRFM - AAM Transformers ETF | 30.385 | 107,15 | 289 | 125,00 | ||||
| 2026-01-27 | 13F | Regions Financial Corp | 99.722 | -3,14 | 1.606 | 40,67 | ||||
| 2026-02-10 | 13F | Bank of New York Mellon Corp | 181.215 | 0,69 | 2.918 | 46,22 | ||||
| 2026-01-30 | 13F | Bogart Wealth, LLC | 139 | 0,00 | 2 | 100,00 | ||||
| 2026-02-13 | 13F | Ubs Asset Management Americas Inc | 3.910 | 63 | ||||||
| 2026-01-29 | 13F | Resonant Capital Advisors, LLC | 10.264 | 165 | ||||||
| 2026-02-11 | 13F | Winton Capital Group Ltd | 37.400 | 602 | ||||||
| 2026-01-15 | 13F | Trust Co | 132 | 2 | ||||||
| 2025-11-14 | 13F | Cubist Systematic Strategies, LLC | 150.719 | -76,52 | 1.671 | -74,80 | ||||
| 2026-01-27 | 13F | Brighton Jones Llc | 0 | -100,00 | 0 | |||||
| 2026-02-17 | 13F | Glenmede Trust Co Na | 22.202 | 3,84 | 357 | 90,91 | ||||
| 2025-09-25 | NP | DEXC - Dimensional Emerging Markets ex China Core Equity ETF | 40.500 | 32,79 | 385 | 44,36 | ||||
| 2026-01-13 | 13F | CoreCap Advisors, LLC | 156 | 0,00 | 3 | 100,00 | ||||
| 2026-02-13 | 13F | Victory Capital Management Inc | 0 | -100,00 | 0 | |||||
| 2026-02-12 | 13F | Callan Family Office, LLC | 36.465 | 35,59 | 587 | 96,98 | ||||
| 2026-02-03 | 13F | Crossmark Global Holdings, Inc. | 79.704 | -1,17 | 1.283 | 43,51 | ||||
| 2026-02-13 | 13F | Journey Strategic Wealth Llc | 14.119 | -11,54 | 227 | 28,98 | ||||
| 2026-01-20 | 13F | Ascent Group, LLC | 14.093 | 7,79 | 227 | 56,94 | ||||
| 2026-02-18 | 13F | Mackenzie Financial Corp | 502.165 | 120,17 | 8.034 | 217,64 | ||||
| 2025-09-26 | NP | AEMGX - Acadian Emerging Markets Portfolio Investor Class Shares | 87.821 | 63,00 | 834 | 52,75 | ||||
| 2026-02-10 | 13F | Sivia Capital Partners, LLC | 25.294 | -6,16 | 407 | 36,58 | ||||
| 2025-11-14 | 13F | Integrated Wealth Concepts LLC | 0 | -100,00 | 0 | -100,00 | ||||
| 2026-02-13 | 13F | Mml Investors Services, Llc | 66.960 | 26,55 | 1.078 | 83,96 | ||||
| 2025-11-06 | 13F | Johnson Investment Counsel Inc | 0 | -100,00 | 0 | -100,00 | ||||
| 2026-01-05 | 13F | Park Avenue Securities Llc | 43.034 | 16,91 | 1 | |||||
| 2026-01-29 | 13F | UMA Financial Services, Inc. | 458 | 20,84 | 7 | 75,00 | ||||
| 2026-02-12 | 13F | Commonwealth Equity Services, Llc | 11.223 | 5,54 | 181 | |||||
| 2026-02-13 | 13F | Wealth Alliance | 24.973 | -9,87 | 402 | 30,94 | ||||
| 2026-01-27 | 13F | Ninety One North America, Inc. | 474.381 | -4,51 | 7.638 | 38,63 | ||||
| 2025-10-08 | 13F/A | New York State Common Retirement Fund | 0 | -100,00 | 0 | -100,00 | ||||
| 2026-02-17 | 13F | Man Group plc | 0 | -100,00 | 0 | |||||
| 2026-02-13 | 13F | Pinnacle Wealth Planning Services, Inc. | 21.840 | -11,39 | 352 | 28,57 | ||||
| 2026-02-13 | 13F | Gts Securities Llc | 45.477 | 83,24 | 732 | 166,18 | ||||
| 2026-02-11 | 13F | Ramirez Asset Management, Inc. | 438.537 | 7.060 | ||||||
| 2026-02-17 | 13F | XTX Topco Ltd | 34.371 | -87,64 | 553 | -82,07 | ||||
| 2026-01-22 | 13F | Maseco Llp | 994 | 0,00 | 16 | 36,36 | ||||
| 2025-09-26 | NP | UUPIX - Ultraemerging Markets Profund Investor Class | 8.406 | 18,56 | 80 | 29,51 | ||||
| 2025-11-14 | 13F | Binnacle Investments Inc | 1.064 | -0,09 | 12 | 0,00 |