Grundlæggende statistik
| Institutionelle ejere | 425 total, 421 long only, 1 short only, 3 long/short - change of -24,51% MRQ |
| Gennemsnitlig porteføljeallokering | 0.4490 % - change of -14,37% MRQ |
| Institutionelle aktier (lange) | 214.274.860 (ex 13D/G) - change of -69,38MM shares -24,46% MRQ |
| Institutionel værdi (lang) | $ 14.760.211 USD ($1000) |
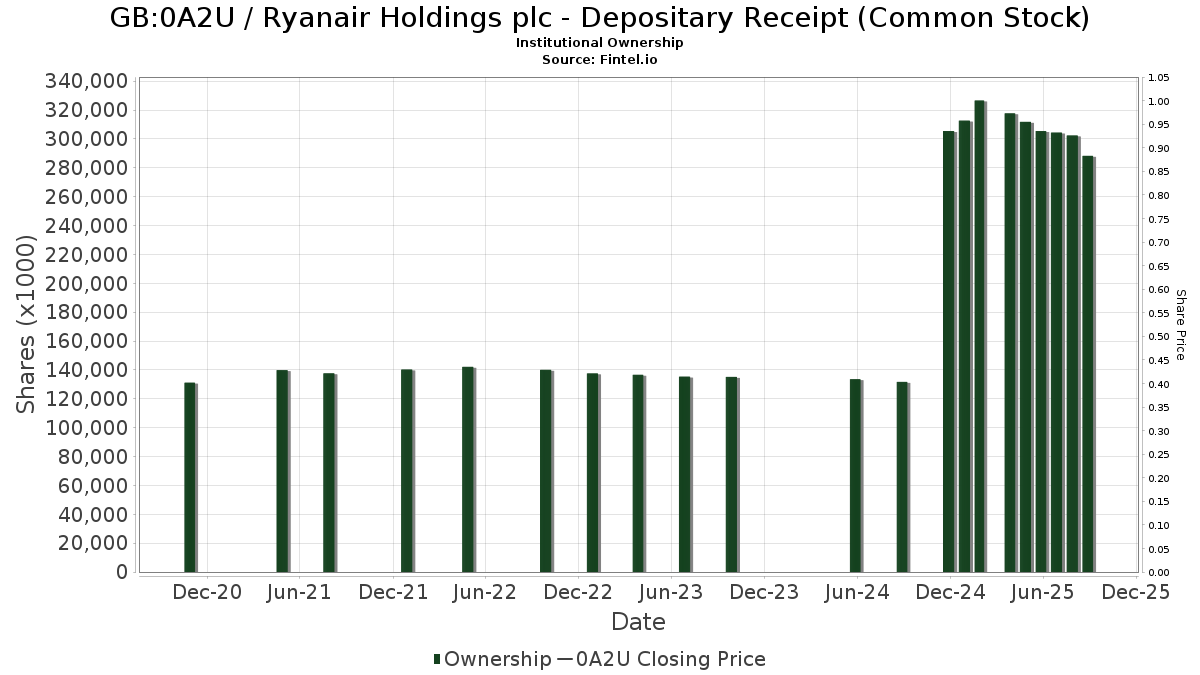
Institutionelt ejerskab og aktionærer
Ryanair Holdings plc - Depositary Receipt (Common Stock) (GB:0A2U) har 425 institutionelle ejere og aktionærer, der har indsendt 13D/G- eller 13F-formularer til Securities Exchange Commission (SEC). Disse institutioner har i alt 214,274,860 aktier. Største aktionærer omfatter Capital International Investors, Capital World Investors, Massachusetts Financial Services Co /ma/, Fmr Llc, Baillie Gifford & Co, Price T Rowe Associates Inc /md/, Janus Henderson Group Plc, Harding Loevner Lp, Sprucegrove Investment Management Ltd, and Wellington Management Group Llp .
Ryanair Holdings plc - Depositary Receipt (Common Stock) (LSE:0A2U) institutionel ejerskabsstruktur viser aktuelle positioner i virksomheden efter institutioner og fonde, samt seneste ændringer i positionsstørrelse. Større aktionærer kan omfatte individuelle investorer, investeringsforeninger, hedgefonde eller institutioner. Skema 13D angiver, at investoren besidder (eller besidder) mere end 5 % af virksomheden og har til hensigt (eller har til hensigt at) aktivt at forfølge en ændring i forretningsstrategi. Skema 13G indikerer en passiv investering på over 5%.
Fondens stemningsscore
Fund Sentiment Score (fka Ownership Accumulation Score) finder de aktier, der bliver mest købt af fonde. Det er resultatet af en sofistikeret, multi-faktor kvantitativ model, der identificerer virksomheder med de højeste niveauer af institutionel akkumulering. Scoringsmodellen bruger en kombination af den samlede stigning i oplyste ejere, ændringerne i porteføljeallokeringer i disse ejere og andre målinger. Tallet går fra 0 til 100, hvor højere tal indikerer et højere niveau af akkumulering for sine jævnaldrende, og 50 er gennemsnittet.
Opdateringsfrekvens: Dagligt
Se Ownership Explorer, som giver en liste over højest rangerende virksomheder.
AI+ Ask Fintel’s AI assistant about Ryanair Holdings plc - Depositary Receipt (Common Stock).
Select a question to share a public post with an AI-crafted answer.
Thinking of good questions…
13F og NPORT arkivering
Detaljer om 13F-arkivering er gratis. Detaljer om NP-ansøgninger kræver et premium-medlemskab. Grønne rækker angiver nye positioner. Røde rækker angiver lukkede positioner. Klik på linket ikon for at se den fulde transaktionshistorik.
Opgrader
for at låse premium-data op og eksportere til Excel ![]() .
.
| Fil dato | Kilde | Investor | Type | Gennemsnitlig pris (Øst) |
Aktier | Δ Aktier (%) |
Rapporteret Værdi ($1000) |
Δ Værdi (%) |
Port Alloc (%) |
|
|---|---|---|---|---|---|---|---|---|---|---|
| 2026-01-30 | 13F | North Star Investment Management Corp. | 23 | 0,00 | 2 | 0,00 | ||||
| 2026-02-09 | 13F | Harbour Investments, Inc. | 602 | 2,56 | 43 | 22,86 | ||||
| 2025-10-21 | 13F | Munro Partners | 0 | 0 | ||||||
| 2026-02-09 | 13F | Putnam Fl Investment Management Co | 9.214 | 68,17 | 665 | 102,13 | ||||
| 2026-02-11 | 13F | Capital Group Private Client Services, Inc. | 254.058 | -5,10 | 18.340 | 13,76 | ||||
| 2026-02-12 | 13F | CIBC Private Wealth Group, LLC | 669 | 41,74 | 48 | 71,43 | ||||
| 2026-02-17 | 13F | Voloridge Investment Management, Llc | 229.199 | -65,01 | 16.546 | -58,06 | ||||
| 2026-02-14 | 13F | Rockefeller Capital Management L.P. | 4.480 | 23,28 | 323 | 48,17 | ||||
| 2026-02-11 | 13F | Capital Analysts, Inc. | 159 | 0,00 | 0 | |||||
| 2026-03-26 | 13F | Merited Wealth, LLC | 27 | 2 | ||||||
| 2026-02-11 | 13F | Capital International Investors | 39.929.929 | 6,58 | 2.884.834 | 28,16 | ||||
| 2026-02-17 | 13F | Clear Street Markets Llc | 0 | -100,00 | 0 | |||||
| 2026-03-04 | 13F | Rehmann Capital Advisory Group | 7.883 | 19,02 | 570 | 42,96 | ||||
| 2026-02-11 | 13F | Cerity Partners LLC | 24.642 | 121,58 | 1.779 | 165,77 | ||||
| 2026-02-13 | 13F | Thomist Capital Management, LP | 0 | -100,00 | 0 | |||||
| 2025-11-06 | 13F | Blume Capital Management, Inc. | 0 | -100,00 | 0 | |||||
| 2026-02-13 | 13F | Panagora Asset Management Inc | 5.617 | 405 | ||||||
| 2026-02-17 | 13F | Jump Financial, LLC | 12.055 | -78,67 | 870 | -74,43 | ||||
| 2026-01-22 | 13F | Massachusetts Financial Services Co /ma/ | 26.929.829 | -5,99 | 1.944.064 | 12,69 | ||||
| 2026-02-06 | 13F | HighTower Advisors, LLC | 16.055 | 13,47 | 1.159 | 35,92 | ||||
| 2026-02-11 | 13F | Jpmorgan Chase & Co | 3.237.385 | 1,92 | 233.707 | 22,17 | ||||
| 2026-02-13 | 13F | Wells Fargo & Company/mn | 659.038 | 28,47 | 47.576 | 54,00 | ||||
| 2025-10-31 | 13F | Whittier Trust Co | 0 | -100,00 | 0 | -100,00 | ||||
| 2026-02-03 | 13F | Virtus Family Office LLC | 8.062 | -1,73 | 582 | 18,05 | ||||
| 2026-02-04 | 13F | Ameritas Advisory Services, LLC | 0 | -100,00 | 0 | |||||
| 2026-02-17 | 13F | Rexford Capital Inc | 268 | 0,00 | 19 | 18,75 | ||||
| 2026-02-12 | 13F | Steward Partners Investment Advisory, Llc | 799 | 7,25 | 58 | 29,55 | ||||
| 2026-02-17 | 13F | Citadel Advisors Llc | Put | 6.400 | 8,47 | 462 | 30,14 | |||
| 2026-02-17 | 13F | Citadel Advisors Llc | Call | 13.400 | -20,71 | 967 | -4,92 | |||
| 2026-02-17 | 13F | Raymond James Financial Inc | 589.696 | 29,64 | 42.570 | 55,41 | ||||
| 2026-02-13 | 13F | Wealth Alliance | 3.855 | 278 | ||||||
| 2026-01-20 | 13F | Ascent Group, LLC | 6.506 | 31,78 | 470 | 57,91 | ||||
| 2026-01-14 | 13F | LVW Advisors, LLC | 6.276 | 2,58 | 453 | 23,10 | ||||
| 2026-02-11 | 13F | Janney Montgomery Scott LLC | 12.932 | 11,34 | 1 | |||||
| 2026-02-12 | 13F | Jane Street Group, Llc | 0 | -100,00 | 0 | -100,00 | ||||
| 2026-02-17 | 13F | Russell Investments Group, Ltd. | 856.735 | -10,17 | 61.867 | 8,04 | ||||
| 2026-03-03 | 13F/A | Caitong International Asset Management Co., Ltd | 101 | -75,89 | 7 | -72,00 | ||||
| 2026-02-11 | 13F | GW&K Investment Management, LLC | 54 | 0 | ||||||
| 2026-02-13 | 13F | Colony Group, LLC | 16.090 | 49,23 | 1.162 | 78,89 | ||||
| 2026-02-17 | 13F | CWM Advisors, LLC | 38.421 | -10,34 | 2.774 | 7,48 | ||||
| 2026-02-13 | 13F | University Of Texas/texas Am Investment Managment Co | 717 | 52 | ||||||
| 2026-02-17 | 13F | Public Employees Retirement System Of Ohio | 12.932 | 0,00 | 934 | 19,92 | ||||
| 2026-02-17 | 13F | Old Mission Capital Llc | 214.891 | -22,17 | 15.513 | -6,71 | ||||
| 2025-11-14 | 13F | Two Sigma Securities, Llc | 0 | -100,00 | 0 | |||||
| 2026-02-12 | 13F | BRYN MAWR TRUST Co | 0 | -100,00 | 0 | -100,00 | ||||
| 2026-02-13 | 13F | SRS Capital Advisors, Inc. | 1.212 | -31,53 | 87 | -17,92 | ||||
| 2026-01-27 | 13F | Ninety One UK Ltd | 13.322 | 962 | ||||||
| 2026-02-13 | 13F | Kilter Group LLC | 4 | -66,67 | 0 | |||||
| 2026-01-22 | 13F | Hager Investment Management Services, Llc | 59 | 4 | ||||||
| 2026-02-13 | 13F | Barclays Plc | 90.469 | 2.408,15 | 6.531 | 2.909,22 | ||||
| 2026-02-17 | 13F | Creative Planning | 18.120 | 2,49 | 1.308 | 22,93 | ||||
| 2026-02-17 | 13F | Strategic Investment Advisors / MI | 3.781 | 273 | ||||||
| 2026-02-09 | 13F | Hartland & Co., LLC | 112 | 8 | ||||||
| 2026-02-17 | 13F | Citadel Advisors Llc | 14.606 | -90,38 | 1.054 | -88,47 | ||||
| 2026-02-17 | 13F | SageView Advisory Group, LLC | 232 | 17 | ||||||
| 2026-02-13 | 13F | Capula Management Ltd | 9.691 | -52,74 | 700 | -43,35 | ||||
| 2026-04-07 | 13F | Signaturefd, Llc | 1.243 | 2.290,38 | 72 | 2.266,67 | ||||
| 2026-02-03 | 13F | Gallacher Capital Management LLC | 12.899 | -0,29 | 931 | 19,51 | ||||
| 2026-02-10 | 13F | NS Partners Ltd | 12.775 | -14,69 | 922 | 2,33 | ||||
| 2026-02-13 | 13F | Flow Traders U.s. Llc | 3.615 | 0 | ||||||
| 2026-03-04 | 13F | SHP Wealth Management | 23 | 2 | ||||||
| 2026-01-29 | 13F | UMA Financial Services, Inc. | 87 | 0,00 | 6 | 20,00 | ||||
| 2026-01-20 | 13F | Red Door Wealth Management, LLC | 2.809 | 203 | ||||||
| 2026-02-13 | 13F | American Century Companies Inc | 48.307 | 183,09 | 3.487 | 239,53 | ||||
| 2026-01-30 | 13F | W.G. Shaheen & Associates DBA Whitney & Co | 213.449 | -0,60 | 15.409 | 19,16 | ||||
| 2026-02-13 | 13F | 1832 Asset Management L.P. | 10.339 | 0,00 | 746 | 19,94 | ||||
| 2026-01-22 | 13F | Maseco Llp | 917 | 66 | ||||||
| 2026-02-06 | 13F | IFP Advisors, Inc | 337 | 23,90 | 24 | 50,00 | ||||
| 2026-02-17 | 13F | Cape Investment Advisory, Inc. | 122 | 31,18 | 9 | 60,00 | ||||
| 2026-02-17 | 13F | Massar Capital Management, LP | 6.817 | 492 | ||||||
| 2026-01-30 | 13F | American Capital Advisory, LLC | 5 | 0,00 | 0 | |||||
| 2026-02-10 | 13F | Envestnet Asset Management Inc | 745.902 | 9,56 | 53.847 | 31,34 | ||||
| 2026-02-12 | 13F | Hyperion Capital Advisors LP | 71.375 | 0,00 | 5.153 | 19,87 | ||||
| 2026-02-03 | 13F | Sprucegrove Investment Management Ltd | 4.537.122 | -13,96 | 327.535 | 3,14 | ||||
| 2026-02-09 | 13F | Hantz Financial Services, Inc. | 11.163 | 144,43 | 1 | |||||
| 2026-02-12 | 13F | Principal Securities, Inc. | 0 | -100,00 | 0 | -100,00 | ||||
| 2026-02-17 | 13F | Summit Trail Advisors, Llc | 3.039 | 219 | ||||||
| 2026-01-22 | 13F | Pinnacle Bancorp, Inc. | 1.425 | 32,56 | 103 | 59,38 | ||||
| 2026-02-03 | 13F | Ethic Inc. | 0 | -100,00 | 0 | -100,00 | ||||
| 2026-01-26 | 13F | Private Trust Co Na | 620 | 24,00 | 45 | 46,67 | ||||
| 2025-11-13 | 13F | Deutsche Bank Ag\ | 0 | -100,00 | 0 | |||||
| 2026-04-07 | 13F | CoreCap Advisors, LLC | 5 | 0,00 | 0 | |||||
| 2026-02-06 | 13F | Cullen/frost Bankers, Inc. | 16 | 23,08 | 1 | |||||
| 2026-02-11 | 13F | Arrowpoint Investment Partners (Singapore) Pte. Ltd. | 5.387 | -79,76 | 389 | -75,78 | ||||
| 2026-01-29 | 13F | UBS Group AG | 286.248 | -19,55 | 20.664 | -3,56 | ||||
| 2026-02-02 | 13F | Millstone Evans Group, LLC | 555 | 0,00 | 40 | 21,21 | ||||
| 2026-02-17 | 13F | Fmr Llc | 12.534.595 | 8,00 | 904.872 | 29,47 | ||||
| 2026-02-17 | 13F | Spears Abacus Advisors LLC | 76.911 | -15,80 | 5.552 | 0,95 | ||||
| 2025-10-15 | 13F | Financial Management Professionals, Inc. | 0 | -100,00 | 0 | -100,00 | ||||
| 2026-02-13 | 13F | Parkside Financial Bank & Trust | 415 | 41,64 | 30 | 70,59 | ||||
| 2026-02-13 | 13F | Smartleaf Asset Management LLC | 1.498 | 41,72 | 109 | 78,69 | ||||
| 2026-01-22 | 13F | Richardson Financial Services Inc. | 12 | 1 | ||||||
| 2026-02-13 | 13F | Marshall Wace, Llp | 39.400 | 2.844 | ||||||
| 2026-02-11 | 13F | Capital Wealth Planning, LLC | 173.073 | 12.548 | ||||||
| 2026-04-09 | 13F | Park Place Capital Corp | 18 | 0,00 | 1 | 0,00 | ||||
| 2026-02-13 | 13F | Neuberger Berman Group LLC | 27.991 | -62,31 | 2.021 | -54,82 | ||||
| 2026-02-23 | 13F | Beaird Harris Wealth Management, LLC | 62 | 0,00 | 5 | 33,33 | ||||
| 2026-01-27 | 13F | First Horizon Corp | 264 | 13,30 | 19 | 35,71 | ||||
| 2026-02-11 | 13F | Deltroit Asset Management (UK) LLP | 100.299 | 7.241 | ||||||
| 2026-02-17 | 13F | Quantinno Capital Management LP | 100.292 | 55,45 | 7.240 | 86,36 | ||||
| 2026-02-13 | 13F | Motiv8 Investments LLC | 36 | 0 | ||||||
| 2026-02-17 | 13F | Alliancebernstein L.p. | 2.210.004 | -5,43 | 159.540 | 13,36 | ||||
| 2026-02-13 | 13F | State Street Corp | 395.920 | 4,39 | 28.586 | 25,15 | ||||
| 2026-02-11 | 13F | Clearbridge Investments, LLC | 847.079 | 61.151 | ||||||
| 2026-01-26 | 13F | Mirae Asset Global Investments Co., Ltd. | 28.825 | -18,10 | 2.081 | -1,84 | ||||
| 2026-02-11 | 13F | Stirlingshire Investments, Inc. | 3.141 | 227 | ||||||
| 2026-01-22 | 13F | Venturi Wealth Management, LLC | 12.584 | 56,48 | 908 | 87,60 | ||||
| 2026-02-10 | 13F | English Capital Management Llc | 105.000 | 0,00 | 7.580 | 19,86 | ||||
| 2026-02-17 | 13F | Millennium Management Llc | 180.952 | -50,14 | 13.063 | -40,23 | ||||
| 2026-02-13 | 13F | Arrowstreet Capital, Limited Partnership | 347.317 | 345,54 | 25.073 | 434,13 | ||||
| 2026-01-23 | 13F | Brown, Lisle/cummings, Inc. | 7 | 0,00 | 1 | |||||
| 2026-01-28 | 13F | Eagle Global Advisors Llc | 70.000 | 0,00 | 5.053 | 19,88 | ||||
| 2026-02-13 | 13F | Evelyn Partners Investment Management LLP | 11.411 | 0,00 | 824 | 19,80 | ||||
| 2026-02-12 | 13F | Bank Of Montreal /can/ | 213.327 | 94,48 | 15.400 | 133,16 | ||||
| 2026-02-17 | 13F | Aquatic Capital Management LLC | 26.517 | 193,26 | 1.914 | 251,84 | ||||
| 2026-02-17 | 13F/A | Beverly Hills Private Wealth, LLC | 2.980 | 215 | ||||||
| 2026-04-06 | 13F | Versant Capital Management, Inc | 6.934 | 24,80 | 401 | -0,25 | ||||
| 2026-02-17 | 13F | Harding Loevner Lp | 4.966.655 | -7,06 | 358.526 | 11,40 | ||||
| 2026-02-09 | 13F | Legal & General Group Plc | 144.371 | -2,01 | 10.421 | 17,45 | ||||
| 2026-02-18 | 13F | Vident Advisory, LLC | 11.196 | -7,35 | 808 | 11,14 | ||||
| 2026-02-23 | 13F | Mv Capital Management, Inc. | 3 | 0 | ||||||
| 2026-04-07 | 13F | Retirement Wealth Solutions LLC | 69 | 4,55 | 4 | -25,00 | ||||
| 2026-02-09 | 13F | Bleakley Financial Group, LLC | 32.570 | 6,57 | 2.351 | 27,77 | ||||
| 2026-02-13 | 13F | Pin Oak Investment Advisors Inc | 484 | 0,00 | 0 | -100,00 | ||||
| 2026-02-19 | 13F | CI Private Wealth, LLC | 3.261 | 235 | ||||||
| 2026-04-08 | 13F | Wealth Enhancement Advisory Services, Llc | 4.975 | -9,46 | 292 | -25,70 | ||||
| 2026-02-17 | 13F | Par Capital Management Inc | 345.000 | 0,00 | 24.906 | 19,88 | ||||
| 2026-04-10 | 13F | Abound Wealth Management | 3 | 0 | ||||||
| 2025-11-14 | 13F | Hbk Investments L P | 0 | -100,00 | 0 | -100,00 | ||||
| 2026-02-13 | 13F | Inspire Advisors, LLC | 9.844 | -0,29 | 711 | 19,53 | ||||
| 2026-02-12 | 13F | Brinker Capital Investments, LLC | 55.403 | 98,31 | 4.000 | 137,75 | ||||
| 2026-02-17 | 13F | United Capital Financial Advisers, Llc | 3.732 | 1,11 | 269 | 21,17 | ||||
| 2026-02-06 | 13F | Vestmark Advisory Solutions, Inc. | 40.643 | 194,96 | 2.934 | 253,92 | ||||
| 2026-02-03 | 13F | Strengthening Families & Communities, LLC | 0 | -100,00 | 0 | |||||
| 2026-02-11 | 13F | TCTC Holdings, LLC | 5.973 | 431 | ||||||
| 2026-02-17 | 13F | FIL Ltd | 1.541.168 | 29,66 | 111.257 | 55,43 | ||||
| 2026-02-03 | 13F | RFG Advisory, LLC | 3.586 | -0,77 | 259 | 18,89 | ||||
| 2026-02-04 | 13F | Twin Lakes Capital Management, LLC | 114 | 0,00 | 8 | 33,33 | ||||
| 2026-01-23 | 13F | Sage Investment Counsel LLC | 23.034 | -3,11 | 1.663 | 16,14 | ||||
| 2026-02-13 | 13F | Boston Partners | 418.602 | -0,87 | 30.219 | 18,84 | ||||
| 2026-02-13 | 13F | Ubs Asset Management Americas Inc | 3.657 | 264 | ||||||
| 2025-11-14 | 13F | Jane Street Group, Llc | Call | 0 | -100,00 | 0 | -100,00 | |||
| 2026-01-26 | 13F | Haven Global Partners, LLC | 401.425 | -1,23 | 28.979 | 18,40 | ||||
| 2026-02-17 | 13F | Brave Warrior Advisors, LLC | 3.056.698 | -25,16 | 220.663 | -10,28 | ||||
| 2026-01-13 | 13F | Kathmere Capital Management, LLC | 5.647 | 408 | ||||||
| 2026-02-10 | 13F | Savant Capital, LLC | 6.398 | 6,70 | 462 | 27,70 | ||||
| 2026-02-13 | 13F | Advyzon Investment Management, LLC | 3.903 | 282 | ||||||
| 2026-02-17 | 13F | Evolve Private Wealth, Llc | 17.181 | 1.240 | ||||||
| 2025-11-06 | 13F | Whipplewood Advisors, LLC | 0 | -100,00 | 0 | -100,00 | ||||
| 2026-01-27 | 13F | Osborne Partners Capital Management, Llc | 201.862 | -1,70 | 14.572 | 17,84 | ||||
| 2026-02-17 | 13F | Teewinot Capital Advisers, L.L.C. | 708.169 | 0,78 | 51.123 | 20,81 | ||||
| 2025-11-12 | 13F | R Squared Ltd | 0 | -100,00 | 0 | -100,00 | ||||
| 2026-02-17 | 13F | Susquehanna International Group, Llp | Call | 2.800 | -84,95 | 202 | -81,96 | |||
| 2026-02-10 | 13F | Goldman Sachs Group Inc | 179.913 | -57,27 | 12.988 | -48,78 | ||||
| 2026-02-03 | 13F | Legacy Wealth Managment, LLC/ID | 7 | 1 | ||||||
| 2026-02-05 | 13F | AustralianSuper Pty Ltd | 251.300 | 0,00 | 18.141 | 19,88 | ||||
| 2026-02-10 | 13F | State of Wyoming | 5.833 | 30,40 | 421 | 56,51 | ||||
| 2026-02-13 | 13F | National Bank Of Canada /fi/ | 2.954 | 345,55 | 213 | 446,15 | ||||
| 2026-02-03 | 13F | Morse Asset Management, Inc | 0 | -100,00 | 0 | |||||
| 2026-02-13 | 13F | Bridgefront Capital, LLC | 6.716 | 485 | ||||||
| 2026-01-08 | 13F | Gradient Investments LLC | 30.668 | 43,14 | 2.214 | 71,55 | ||||
| 2026-02-13 | 13F | Blueshift Asset Management, LLC | 0 | -100,00 | 0 | |||||
| 2026-02-13 | 13F | Macquarie Group Ltd | 0 | -100,00 | 0 | |||||
| 2026-02-05 | 13F | Atria Investments Llc | 26.917 | 14,72 | 1.943 | 37,61 | ||||
| 2026-02-17 | 13F | Wellington Management Group Llp | 3.895.021 | 57,99 | 281.182 | 89,39 | ||||
| 2026-02-12 | 13F | Federation des caisses Desjardins du Quebec | 14 | -99,97 | 1 | -99,97 | ||||
| 2026-02-17 | 13F | Warren Averett Asset Management, LLC | 4.061 | 293 | ||||||
| 2026-01-23 | 13F | Rsm Us Wealth Management Llc | 11.330 | -15,30 | 827 | 2,73 | ||||
| 2026-02-17 | 13F | Trexquant Investment LP | 0 | -100,00 | 0 | |||||
| 2026-02-17 | 13F | Bank Of America Corp /de/ | 1.882.435 | 30,39 | 135.893 | 56,31 | ||||
| 2025-11-07 | 13F | Synovus Financial Corp | 17.185 | 1.035 | ||||||
| 2026-02-03 | 13F | Manning & Napier Advisors Llc | 121 | 9 | ||||||
| 2026-02-09 | 13F | Huntington National Bank | 23 | -71,95 | 2 | -75,00 | ||||
| 2026-02-13 | 13F | Rhumbline Advisers | 7.503 | 71,30 | 542 | 105,70 | ||||
| 2026-02-10 | 13F/A | Northwestern Mutual Wealth Management Co | 813 | 88,19 | 59 | 123,08 | ||||
| 2026-02-02 | 13F | One Wealth Advisors, LLC | 6.225 | 3,06 | 449 | 23,69 | ||||
| 2026-02-11 | 13F | Capital International Ltd /ca/ | 383.164 | -1,77 | 27.661 | 17,75 | ||||
| 2026-02-10 | 13F | Natixis Advisors, L.p. | 926.291 | 7,10 | 67 | 26,92 | ||||
| 2026-02-10 | 13F | Root Financial Partners, LLC | 295 | 12,60 | 21 | 40,00 | ||||
| 2026-02-12 | 13F | Moneta Group Investment Advisors Llc | 3.325 | 240 | ||||||
| 2026-02-02 | 13F | Fifth Third Bancorp | 19.456 | -0,48 | 1.405 | 19,29 | ||||
| 2026-02-09 | 13F | William Blair Investment Management, Llc | 50.868 | 3.672 | ||||||
| 2026-02-11 | 13F | Capital International Sarl | 705.096 | 3,59 | 50.901 | 24,18 | ||||
| 2026-02-17 | 13F | Delaware Management Holdings, Inc. | 170.235 | 12.290 | ||||||
| 2026-01-27 | 13F | Regions Financial Corp | 7.582 | -1,66 | 547 | 17,89 | ||||
| 2026-01-16 | 13F | First Pacific Financial | 0 | -100,00 | 0 | |||||
| 2026-02-17 | 13F | Voleon Capital Management Lp | 3.418 | -90,33 | 247 | -88,45 | ||||
| 2026-01-28 | 13F | U S Global Investors Inc | 113.653 | -13,01 | 8.205 | 4,28 | ||||
| 2026-01-22 | 13F | City Holding Co | 68 | 0,00 | 5 | 0,00 | ||||
| 2026-02-12 | 13F | Triumph Capital Management | 27 | 0,00 | 2 | 0,00 | ||||
| 2026-02-17 | 13F | Cetera Investment Advisers | 36.359 | 40,71 | 2.625 | 68,64 | ||||
| 2026-04-09 | 13F | Pacifica Partners Inc. | 34 | 0,00 | 2 | -50,00 | ||||
| 2026-02-13 | 13F | Kayne Anderson Rudnick Investment Management Llc | 17.416 | 44,58 | 1.257 | 73,38 | ||||
| 2026-02-02 | 13F | Kornitzer Capital Management Inc /ks | 43.000 | 0,00 | 3.104 | 19,89 | ||||
| 2026-02-12 | 13F | Hrt Financial Lp | 0 | -100,00 | 0 | |||||
| 2026-03-03 | 13F/A | Ovata Capital Management Ltd | 981.383 | 262,68 | 71.969 | 343,26 | ||||
| 2026-02-03 | 13F | NewEdge Wealth, LLC | 84.731 | 9,77 | 6.117 | 23,46 | ||||
| 2026-04-07 | 13F | Park Avenue Securities Llc | 18.682 | 24,86 | 1 | 0,00 | ||||
| 2026-02-13 | 13F | Baird Financial Group, Inc. | 1.145.656 | -19,77 | 82.705 | -3,82 | ||||
| 2026-02-10 | 13F | Bnp Paribas Arbitrage, Sa | 96.664 | -76,31 | 6.978 | -71,61 | ||||
| 2025-11-14 | 13F | Strategic Wealth Partners, Ltd. | 15 | 0,00 | 1 | |||||
| 2026-02-11 | 13F | J.Safra Asset Management Corp | 131 | 9 | ||||||
| 2025-11-14 | 13F | Binnacle Investments Inc | 32 | 0,00 | 2 | 0,00 | ||||
| 2026-01-22 | 13F | Trinity Street Asset Management LLP | 3.680.298 | -1,48 | 265.681 | 18,10 | ||||
| 2026-02-17 | 13F | Price T Rowe Associates Inc /md/ | 7.304.889 | 15,60 | 527 | 38,68 | ||||
| 2026-02-17 | 13F | Redwood Park Advisors LLC | 975 | 0,00 | 70 | 20,69 | ||||
| 2026-02-17 | 13F | Beacon Investment Advisors Llc | 66.188 | 0,15 | 4.778 | 20,05 | ||||
| 2026-02-10 | 13F | Thoroughbred Financial Services, Llc | 12.159 | -2,09 | 1 | |||||
| 2026-02-13 | 13F | Palisade Asset Management, LLC | 0 | -100,00 | 0 | |||||
| 2025-11-07 | 13F | Coronation Fund Managers Ltd. | 0 | -100,00 | 0 | -100,00 | ||||
| 2026-01-12 | 13F | CVA Family Office, LLC | 82 | 0,00 | 6 | 25,00 | ||||
| 2026-02-13 | 13F | Citigroup Inc | 139.527 | 104,94 | 10.072 | 145,72 | ||||
| 2025-11-13 | 13F | Riggs Asset Managment Co. Inc. | 0 | -100,00 | 0 | -100,00 | ||||
| 2026-02-12 | 13F | BlackRock, Inc. | 17.936 | 39,14 | 1.295 | 66,75 | ||||
| 2026-02-17 | 13F | Advisory Services Network, LLC | 0 | -100,00 | 0 | |||||
| 2026-01-27 | 13F | Asset Management One Co., Ltd. | 78.475 | 0,44 | 5.707 | 21,32 | ||||
| 2026-02-11 | 13F | LPL Financial LLC | 89.622 | 34,66 | 6.470 | 61,44 | ||||
| 2026-02-24 | 13F | SG Trading Solutions, LLC | 2.932 | 0 | ||||||
| 2025-11-14 | 13F | Susquehanna International Group, Llp | 0 | -100,00 | 0 | -100,00 | ||||
| 2026-02-17 | 13F | Qube Research & Technologies Ltd | 38.740 | -78,39 | 2.797 | -74,09 | ||||
| 2026-02-17 | 13F | Agf Management Ltd | 22.137 | 0,00 | 1.598 | 19,88 | ||||
| 2026-01-14 | 13F | ORG Partners LLC | 37 | 0,00 | 3 | 0,00 | ||||
| 2026-02-03 | 13F | Credit Industriel Et Commercial | 195.439 | 56,85 | 14.115 | 88,36 | ||||
| 2026-02-10 | 13F | Commonwealth Of Pennsylvania Public School Empls Retrmt Sys | 346.663 | -15,78 | 25.026 | 0,96 | ||||
| 2026-02-11 | 13F | Holowesko Partners Ltd. | 35.000 | 0,00 | 2.527 | 19,89 | ||||
| 2026-02-17 | 13F | EFG International AG | 6.932 | 500 | ||||||
| 2026-01-27 | 13F | Hgk Asset Management Inc | 949.550 | -0,74 | 68.548 | 18,99 | ||||
| 2026-02-13 | 13F | Resources Investment Advisors, LLC. | 4.568 | 330 | ||||||
| 2026-02-10 | 13F | Lido Advisors, LLC | 4.001 | 0,05 | 241 | 0,00 | ||||
| 2026-01-27 | 13F | WealthCollab, LLC | 206 | 0,00 | 15 | 16,67 | ||||
| 2026-02-13 | 13F | Ieq Capital, Llc | 3.815 | 275 | ||||||
| 2026-02-13 | 13F | Polymer Capital Management (HK) LTD | 8.707 | 629 | ||||||
| 2026-04-07 | 13F | Farther Finance Advisors, LLC | 1.676 | -18,80 | 101 | -32,43 | ||||
| 2026-02-13 | 13F | Golden State Wealth Management, LLC | 481 | 0,00 | 35 | 21,43 | ||||
| 2026-01-15 | 13F/A | Persistent Asset Partners Ltd | 0 | -100,00 | 0 | -100,00 | ||||
| 2026-01-15 | 13F | Burns Matteson Capital Management, LLC | Call | 5.000 | 322 | |||||
| 2026-01-15 | 13F | Burns Matteson Capital Management, LLC | 4.477 | 10,54 | 323 | 32,92 | ||||
| 2025-11-06 | 13F | Advisors Asset Management, Inc. | 0 | -100,00 | 0 | -100,00 | ||||
| 2026-01-13 | 13F | Mather Group, Llc. | 0 | -100,00 | 0 | |||||
| 2026-02-17 | 13F | Bayesian Capital Management, LP | 0 | -100,00 | 0 | |||||
| 2025-11-12 | 13F | Transce3nd, LLC | 0 | -100,00 | 0 | -100,00 | ||||
| 2026-02-13 | 13F | Arkadios Wealth Advisors | 2.997 | 216 | ||||||
| 2026-02-12 | 13F | Loomis Sayles & Co L P | 27.444 | 0,00 | 1.981 | 19,92 | ||||
| 2026-01-07 | 13F | Sagespring Wealth Partners, Llc | 3.031 | 219 | ||||||
| 2026-02-17 | 13F | Roehl & Yi Investment Advisors, LLC | 4.296 | 310 | ||||||
| 2026-01-14 | 13F | Silchester International Investors LLP | 102.455 | -7,42 | 7.396 | 10,98 | ||||
| 2026-02-17 | 13F | Whitebox Advisors Llc | 116.658 | 8.422 | ||||||
| 2026-02-12 | 13F | Wealthspire Advisors, LLC | 0 | -100,00 | 0 | |||||
| 2026-01-28 | 13F | WPG Advisers, LLC | 102 | 0,00 | 7 | 16,67 | ||||
| 2025-11-14 | 13F | XTX Topco Ltd | 0 | -100,00 | 0 | -100,00 | ||||
| 2026-01-30 | 13F | Oakworth Capital, Inc. | 157 | 11 | ||||||
| 2026-01-14 | 13F | ORG Wealth Partners, LLC | 85 | 6,25 | 6 | 50,00 | ||||
| 2026-02-11 | 13F | Capital World Investors | 31.051.257 | 1,02 | 2.241.612 | 21,10 | ||||
| 2025-11-07 | 13F | Beacon Capital Management, LLC | 0 | -100,00 | 0 | |||||
| 2026-02-12 | 13F | Great Lakes Advisors, Llc | 528.213 | 0,45 | 38.132 | 20,42 | ||||
| 2026-02-06 | 13F | Addison Advisors LLC | 46 | 3 | ||||||
| 2026-01-28 | 13F | Kingswood Wealth Advisors, Llc | 3.849 | 278 | ||||||
| 2026-01-26 | 13F | Reyes Financial Architecture, Inc. | 33 | 2 | ||||||
| 2026-04-02 | 13F | Ares Financial Consulting, LLC | 520 | 1.200,00 | 31 | 1.450,00 | ||||
| 2026-02-23 | 13F | Wealth Preservation Advisors, LLC | 678 | 0,00 | 49 | 20,00 | ||||
| 2026-01-30 | 13F | Joseph Group Capital Management | 222 | 16 | ||||||
| 2026-02-06 | 13F | Pnc Financial Services Group, Inc. | 13.171 | 2,14 | 951 | 22,42 | ||||
| 2026-04-08 | 13F | Wealth Science Advisors LLC | 39 | 3 | ||||||
| 2026-02-10 | 13F | Acadian Asset Management Llc | 212.032 | -40,55 | 15 | -28,57 | ||||
| 2026-01-20 | 13F | Polunin Capital Partners Ltd | 0 | -100,00 | 0 | |||||
| 2026-02-24 | 13F | MidFirst Bank | 690 | 50 | ||||||
| 2026-02-11 | 13F | Simplex Trading, Llc | Put | 400 | -50,00 | 29 | ||||
| 2026-02-11 | 13F | Simplex Trading, Llc | Call | 200 | -96,08 | 14 | ||||
| 2026-02-13 | 13F | Transamerica Financial Advisors, Inc. | 53 | 4 | ||||||
| 2025-11-07 | 13F | Sierra Ocean, Llc | 0 | -100,00 | 0 | -100,00 | ||||
| 2026-02-04 | 13F | LRI Investments, LLC | 286 | 23,28 | 21 | 53,85 | ||||
| 2026-02-09 | 13F | Morningstar Investment Management LLC | 0 | -100,00 | 0 | -100,00 | ||||
| 2026-01-14 | 13F | Jfs Wealth Advisors, Llc | 52 | 0,00 | 4 | 0,00 | ||||
| 2026-02-04 | 13F | BCJ Capital Management, LLC | 3.231 | 233 | ||||||
| 2026-02-02 | 13F | Qrg Capital Management, Inc. | 65.709 | 56,99 | 4.744 | 88,21 | ||||
| 2026-01-13 | 13F | Stephens Consulting, LLC | 2.500 | 0,00 | 180 | 20,00 | ||||
| 2026-01-21 | 13F | Portside Wealth Group, LLC | 7.051 | 509 | ||||||
| 2026-02-12 | 13F | Lansforsakringar Fondforvaltning AB (publ) | 0 | -100,00 | 0 | |||||
| 2026-01-21 | 13F | Sound Income Strategies, LLC | 62 | 264,71 | 4 | 300,00 | ||||
| 2026-01-08 | 13F | True Wealth Design, LLC | 58 | 61,11 | 4 | 100,00 | ||||
| 2026-02-12 | 13F | Marsico Capital Management Llc | 97.164 | -13,65 | 7.014 | 3,51 | ||||
| 2026-02-06 | 13F | Profund Advisors Llc | 7.664 | -13,33 | 553 | 3,95 | ||||
| 2026-02-17 | 13F | Signature Equity Partners, LLC | 92 | 7 | ||||||
| 2026-02-17 | 13F | Royal Bank Of Canada | 3.313.095 | 1,90 | 239.171 | 22,16 | ||||
| 2026-01-20 | 13F | Independence Bank of Kentucky | 20 | 1 | ||||||
| 2026-02-13 | 13F | Mariner, LLC | 31.470 | 11,33 | 2.273 | 33,49 | ||||
| 2026-02-02 | 13F | Truist Financial Corp | 28.740 | 32,19 | 2.075 | 58,44 | ||||
| 2026-02-09 | 13F | Geode Capital Management, Llc | 184.427 | -2,64 | 13.314 | 16,71 | ||||
| 2026-01-28 | 13F | Salomon & Ludwin, LLC | 134 | 4.366,67 | 10 | |||||
| 2026-02-11 | 13F | Capital International Inc /ca/ | 1.360.934 | -7,23 | 98.246 | 11,21 | ||||
| 2026-02-13 | 13F | Verition Fund Management LLC | 9.995 | -69,14 | 722 | -63,03 | ||||
| 2026-01-30 | 13F | Mitsubishi UFJ Trust & Banking Corp | 189.103 | -40,51 | 13.651 | -28,68 | ||||
| 2026-02-13 | 13F | Integrated Wealth Concepts LLC | 0 | -100,00 | 0 | |||||
| 2026-02-13 | 13F | Pathstone Holdings, LLC | 29.619 | -8,21 | 2.138 | 10,04 | ||||
| 2026-01-30 | 13F | Archer Investment Corp | 62 | 0,00 | 4 | 33,33 | ||||
| 2026-01-16 | 13F | FNY Investment Advisers, LLC | 1.000 | 0 | ||||||
| 2026-02-05 | 13F | Northwestern Mutual Investment Management Company, Llc | 41.969 | -3,95 | 3.030 | 15,13 | ||||
| 2026-04-10 | 13F | Armstrong Advisory Group, Inc | 8 | 0,00 | 0 | |||||
| 2026-02-12 | 13F | Renaissance Technologies Llc | 2.111.046 | -12,46 | 152.396 | 4,95 | ||||
| 2026-02-02 | 13F | Montag A & Associates Inc | 0 | -100,00 | 0 | |||||
| 2026-02-11 | 13F | Fiduciary Management Inc /wi/ | 1.534.931 | -14,46 | 110.807 | 2,54 | ||||
| 2026-02-06 | 13F | Leonteq Securities AG | 123 | -89,56 | 9 | -88,57 | ||||
| 2026-02-13 | 13F | Y-Intercept (Hong Kong) Ltd | 0 | -100,00 | 0 | |||||
| 2026-01-29 | 13F | Ashton Thomas Private Wealth, LLC | 25.864 | -21,82 | 1.867 | -6,28 | ||||
| 2026-02-11 | 13F | IMA Wealth, Inc. | 48 | 3 | ||||||
| 2026-02-13 | 13F | Baldwin Investment Management, LLC | 20.689 | 0,00 | 1.494 | 19,92 | ||||
| 2026-02-13 | 13F | Chou Associates Management Inc. | 5.937 | 0,00 | 429 | 19,89 | ||||
| 2026-04-06 | 13F | CX Institutional | 0 | -100,00 | 0 | |||||
| 2026-02-03 | 13F | Sumitomo Mitsui DS Asset Management Company, Ltd | 10.950 | -20,04 | 790 | -4,13 | ||||
| 2026-02-10 | 13F | Daiwa Securities Group Inc. | 29.686 | -3,62 | 2 | 100,00 | ||||
| 2026-02-17 | 13F | Two Sigma Investments, Lp | 340.912 | -22,41 | 24.610 | -6,98 | ||||
| 2025-11-14 | 13F | Centiva Capital, LP | 0 | -100,00 | 0 | -100,00 | ||||
| 2026-02-10 | 13F | Bank of New York Mellon Corp | 132.638 | 14,02 | 9.575 | 36,69 | ||||
| 2026-01-27 | 13F | TD Waterhouse Canada Inc. | 330 | -10,57 | 24 | 9,52 | ||||
| 2026-02-10 | 13F | NINE MASTS CAPITAL Ltd | 131.521 | -21,95 | 9.495 | -6,44 | ||||
| 2025-11-13 | 13F | Quadrature Capital Ltd | 0 | -100,00 | 0 | -100,00 | ||||
| 2026-02-09 | 13F | Annis Gardner Whiting Capital Advisors, LLC | 228 | 16 | ||||||
| 2026-02-05 | 13F | Bessemer Group Inc | 141.899 | 18,76 | 10 | 42,86 | ||||
| 2026-01-09 | 13F | Assenagon Asset Management S.A. | 174.808 | 2.381,66 | 12.619 | 2.876,18 | ||||
| 2026-01-28 | 13F | Geneos Wealth Management Inc. | 25 | 0,00 | 2 | 0,00 | ||||
| 2026-02-12 | 13F | EntryPoint Capital, LLC | 0 | -100,00 | 0 | |||||
| 2026-02-17 | 13F | Advisor Group Holdings, Inc. | 9.051 | -40,50 | 654 | -28,79 | ||||
| 2026-02-17 | 13F | Point72 Asset Management, L.P. | 0 | -100,00 | 0 | |||||
| 2026-02-03 | 13F | Orion Capital Management LLC | 0 | -100,00 | 0 | |||||
| 2026-01-21 | 13F | Metropolis Capital Ltd | 3.563.802 | -23,88 | 257.271 | -8,75 | ||||
| 2026-02-10 | 13F | Bruce G. Allen Investments, LLC | 48 | 0,00 | 3 | 50,00 | ||||
| 2026-02-17 | 13F | Scientech Research LLC | 3.419 | 247 | ||||||
| 2026-02-03 | 13F | SBI Securities Co., Ltd. | 7 | 0,00 | 1 | |||||
| 2026-02-13 | 13F | Stifel Financial Corp | 129.552 | 17,04 | 9.352 | 40,32 | ||||
| 2026-02-06 | 13F | EverSource Wealth Advisors, LLC | 2.632 | 30,82 | 190 | 56,20 | ||||
| 2026-02-13 | 13F | Atlas Capital Advisors Llc | 5.822 | 420 | ||||||
| 2026-02-24 | 13F | Bell Investment Advisors, Inc | 265 | 26,19 | 19 | 58,33 | ||||
| 2026-02-13 | 13F | Pinnacle Wealth Planning Services, Inc. | 253 | 18 | ||||||
| 2026-01-22 | 13F | Personal Cfo Solutions, Llc | 6.276 | 12,53 | 453 | 35,22 | ||||
| 2026-02-11 | 13F | Parallel Advisors, LLC | 2.027 | 5.861,76 | 146 | 7.200,00 | ||||
| 2026-02-13 | 13F | Alerus Financial Na | 67 | -30,93 | 5 | -20,00 | ||||
| 2026-02-13 | 13F | Kestra Advisory Services, LLC | 3.008 | 217 | ||||||
| 2026-02-17 | 13F | Ameriprise Financial Inc | 854.662 | -3,38 | 61.698 | 15,83 | ||||
| 2026-02-13 | 13F | Charles Schwab Investment Management Inc | 51.564 | 38,37 | 3.722 | 65,86 | ||||
| 2026-02-03 | 13F | Crossmark Global Holdings, Inc. | 27.012 | 1,95 | 1.950 | 22,19 | ||||
| 2026-04-02 | 13F | Hilltop National Bank | 1.077 | 6,74 | 62 | -13,89 | ||||
| 2026-01-21 | 13F | Albion Financial Group /ut | 70 | 0,00 | 5 | 25,00 | ||||
| 2026-02-09 | 13F | Coldstream Capital Management Inc | 3.447 | 249 | ||||||
| 2026-02-10 | 13F | CIBC Asset Management Inc | 68.114 | 5,04 | 4.837 | 23,87 | ||||
| 2026-02-17 | 13F | Summit Global Investments | 3.036 | -84,24 | 0 | -100,00 | ||||
| 2026-02-17 | 13F | Pinnacle Financial Partners, Inc. | 17.898 | 1.292 | ||||||
| 2026-02-09 | 13F | Frazier Financial Advisors, LLC | 309 | 0,00 | 22 | 22,22 | ||||
| 2026-02-04 | 13F | Paradigm Asset Management Co Llc | 650 | -96,84 | 47 | -96,28 | ||||
| 2026-02-11 | 13F | Primecap Management Co/ca/ | 986.972 | -1,57 | 71.250 | 18,00 | ||||
| 2026-02-05 | 13F | Elyxium Wealth, LLC | 52 | 4 | ||||||
| 2026-02-17 | 13F | Mpwm Advisory Solutions, Llc | 0 | -100,00 | 0 | |||||
| 2026-02-17 | 13F | Susquehanna International Group, Llp | Put | 0 | -100,00 | 0 | -100,00 | |||
| 2026-01-22 | 13F | Bear Mountain Capital, Inc. | 0 | -100,00 | 0 | |||||
| 2026-01-23 | 13F | Freestone Capital Holdings, LLC | 3.938 | 2,53 | 284 | 22,94 | ||||
| 2026-02-04 | 13F | Hosking Partners LLP | 484.696 | -1,70 | 34.990 | 17,85 | ||||
| 2026-01-23 | 13F | Ritholtz Wealth Management | 31.047 | 55,53 | 2.241 | 86,44 | ||||
| 2026-02-17 | 13F | Immersion Capital LLP | 155.942 | -44,45 | 11.257 | -33,41 | ||||
| 2026-02-13 | 13F | Manufacturers Life Insurance Company, The | 0 | -100,00 | 0 | |||||
| 2026-02-02 | 13F | Artemis Investment Management LLP | 1.448.711 | -8,59 | 104.582 | 9,59 | ||||
| 2026-02-13 | 13F | MAI Capital Management | 340 | 5,59 | 25 | 26,32 | ||||
| 2026-02-06 | 13F | Larson Financial Group LLC | 653 | 64,90 | 47 | 104,35 | ||||
| 2026-02-13 | 13F | Sterling Capital Management LLC | 8.709 | -8,46 | 629 | 9,79 | ||||
| 2026-04-06 | 13F | Rosenberg Matthew Hamilton | 2.350 | 0,00 | 136 | -20,12 | ||||
| 2026-02-12 | 13F | Brown Brothers Harriman & Co | 515 | 2.929,41 | 37 | 3.600,00 | ||||
| 2026-02-12 | 13F | Benson Wealth Management INC | 32 | 2 | ||||||
| 2026-02-17 | 13F | Wiley Bros.-aintree Capital, Llc | 27.206 | 66,20 | 1.964 | 99,49 | ||||
| 2026-02-02 | 13F | Benjamin Edwards Inc | 7.644 | 25,07 | 552 | 50,14 | ||||
| 2026-02-18 | 13F | Caitlin John, LLC | 78 | 0,00 | 6 | 25,00 | ||||
| 2026-02-17 | 13F | Schonfeld Strategic Advisors LLC | 112.898 | 8.150 | ||||||
| 2026-02-12 | 13F | Hollencrest Capital Management | 150 | 0,00 | 11 | 11,11 | ||||
| 2026-01-23 | 13F | FSM Wealth Advisors, LLC | 3.597 | 260 | ||||||
| 2026-01-23 | 13F | Diversify Advisory Services, LLC | 9.170 | 20,26 | 626 | 26,46 | ||||
| 2026-01-26 | 13F | JNBA Financial Advisors | 15 | 1 | ||||||
| 2026-02-10 | 13F | Godfrey Financial Associates, Inc. | 19 | 1 | ||||||
| 2026-02-12 | 13F | New York State Common Retirement Fund | 73.510 | -6,23 | 5.307 | 12,42 | ||||
| 2026-02-13 | 13F | Evelyn Partners Investment Management Services Ltd | 480 | 0,00 | 35 | 21,43 | ||||
| 2026-02-19 | 13F | Invesco Ltd. | 96.337 | 7,03 | 6.955 | 28,30 | ||||
| 2026-02-02 | 13F | Cornerstone Planning Group LLC | 137 | 4.466,67 | 9 | |||||
| 2026-01-30 | 13F | Keybank National Association/oh | 12.409 | 9,49 | 896 | 31,23 | ||||
| 2025-10-21 | 13F | GAM Holding AG | 0 | -100,00 | 0 | -100,00 | ||||
| 2026-02-05 | 13F | Td Private Client Wealth Llc | 1.839 | -7,26 | 133 | 10,92 | ||||
| 2026-02-09 | 13F | Summitry Llc | 4.472 | 14,52 | 323 | 37,02 | ||||
| 2026-02-06 | 13F | Envestnet Portfolio Solutions, Inc. | 6.222 | 449 | ||||||
| 2026-02-12 | 13F | Callan Family Office, LLC | 27.412 | 106,21 | 1.979 | 147,25 | ||||
| 2026-02-10 | 13F | Principia Wealth Advisory, LLC | 22 | 4,76 | 2 | 0,00 | ||||
| 2026-01-26 | 13F | Merit Financial Group, LLC | 4.044 | 2,59 | 292 | 22,78 | ||||
| 2026-02-13 | 13F | Bridgewater Associates, LP | 795.029 | -18,92 | 57.393 | -2,81 | ||||
| 2026-02-13 | 13F | Dynamic Technology Lab Private Ltd | 0 | -100,00 | 0 | -100,00 | ||||
| 2026-02-17 | 13F | Northern Trust Corp | 363.995 | 23,36 | 26.277 | 47,88 | ||||
| 2025-11-14 | 13F | Walleye Trading LLC | Call | 0 | -100,00 | 0 | -100,00 | |||
| 2026-02-04 | 13F | Abc Arbitrage Sa | 38.512 | -68,35 | 2.780 | -62,05 | ||||
| 2025-11-14 | 13F | Walleye Trading LLC | Put | 0 | -100,00 | 0 | -100,00 | |||
| 2026-02-13 | 13F | First Trust Advisors Lp | 83.926 | -38,08 | 6.059 | -25,78 | ||||
| 2026-01-28 | 13F | CAPROCK Group, Inc. | 23.680 | 109,06 | 1.709 | 138,02 | ||||
| 2026-02-05 | 13F | May Hill Capital, LLC | 3.384 | 244 | ||||||
| 2026-02-11 | 13F | Zions Bancorporation, National Association /ut/ | 21 | -4,55 | 2 | 0,00 | ||||
| 2026-02-17 | 13F | Tudor Investment Corp Et Al | 0 | -100,00 | 0 | -100,00 | ||||
| 2026-02-20 | 13F | Dorsey Wright & Associates | 27.708 | 5,85 | 2.000 | 26,90 | ||||
| 2025-11-14 | 13F | L1 Capital Pty Ltd | 0 | -100,00 | 0 | |||||
| 2026-02-17 | 13F | Nissay Asset Management Corp /japan/ /adv | 0 | -100,00 | 0 | |||||
| 2026-04-08 | 13F | Arlington Trust Co LLC | 10 | 1 | ||||||
| 2026-02-17 | 13F | Harris Associates L P | 2.233.754 | -27,01 | 161.255 | -12,51 | ||||
| 2026-01-26 | 13F | Cwm, Llc | 6.563 | 313,81 | 0 | |||||
| 2026-02-03 | 13F | Sageworth Trust Co | 0 | -100,00 | 0 | |||||
| 2026-02-17 | 13F | Jones Financial Companies Lllp | 4.847 | 18,86 | 350 | 47,88 | ||||
| 2026-04-06 | 13F | GAMMA Investing LLC | 3.097 | 8,06 | 179 | -13,11 | ||||
| 2026-01-16 | 13F | Ronald Blue Trust, Inc. | 4.869 | -3,45 | 351 | 15,84 | ||||
| 2026-01-23 | 13F | Cambiar Investors Llc | 238.670 | -6,89 | 17.230 | 11,62 | ||||
| 2026-01-30 | 13F | Us Bancorp \de\ | 36.736 | 4,95 | 2.652 | 25,82 | ||||
| 2026-01-23 | 13F | Bingham Private Wealth, Llc | 3.147 | 227 | ||||||
| 2026-01-23 | 13F | Baillie Gifford & Co | 11.343.819 | -15,88 | 818.910 | 0,84 | ||||
| 2026-02-06 | 13F | Global Retirement Partners, LLC | 1.751 | 155,99 | 126 | 207,32 | ||||
| 2026-02-17 | 13F | Capstone Financial Advisors, Inc. | 5.000 | 0,00 | 361 | 19,60 | ||||
| 2026-01-16 | 13F | Crewe Advisors LLC | 6 | 0 | ||||||
| 2026-02-13 | 13F | Milford Funds Ltd | 545.491 | 39.379 | ||||||
| 2026-02-17 | 13F | Grantham, Mayo, Van Otterloo & Co. LLC | 87.398 | 222,05 | 6.309 | 286,11 | ||||
| 2025-10-24 | 13F | Hemington Wealth Management | 7 | 0 | ||||||
| 2026-02-11 | 13F | Capital Group Investment Management Pte. Ltd. | 77.827 | 3,15 | 5.618 | 23,66 | ||||
| 2026-02-13 | 13F | Headlands Technologies LLC | 0 | -100,00 | 0 | |||||
| 2026-02-12 | 13F | Quadrant Capital Group Llc | 867 | -32,53 | 63 | -19,48 | ||||
| 2026-02-12 | 13F | Rossby Financial, LCC | 2.058 | 149 | ||||||
| 2026-02-09 | 13F | Key FInancial Inc | 0 | -100,00 | 0 | |||||
| 2026-02-12 | 13F | Skopos Labs, Inc. | 14.320 | 261,07 | 1.041 | 360,62 | ||||
| 2026-02-17 | 13F | Guggenheim Capital Llc | 4.273 | 308 | ||||||
| 2026-01-27 | 13F | Bayforest Capital Ltd | 0 | -100,00 | 0 | |||||
| 2026-02-02 | 13F | Oppenheimer Asset Management Inc. | 157.102 | -4,13 | 11.341 | 14,93 | ||||
| 2026-02-13 | 13F | Aigen Investment Management, Lp | 0 | -100,00 | 0 | -100,00 | ||||
| 2026-01-23 | 13F | Sumitomo Mitsui Trust Holdings, Inc. | 48.702 | -12,31 | 3.516 | 5,11 | ||||
| 2026-02-13 | 13F | Schroder Investment Management Group | 219.313 | 127,55 | 16.014 | 187,14 | ||||
| 2026-02-17 | 13F | LMR Partners LLP | 95.024 | 6.860 | ||||||
| 2026-01-23 | 13F | Avion Wealth | 32 | 0,00 | 0 | |||||
| 2026-01-27 | 13F | Evergreen Capital Management Llc | 0 | -100,00 | 0 | |||||
| 2026-01-29 | 13F | Sanctuary Advisors, LLC | 45.956 | 2,71 | 3.318 | 23,13 | ||||
| 2026-02-13 | 13F | Maven Securities LTD | 155.905 | 11.255 | ||||||
| 2026-02-13 | 13F | Mml Investors Services, Llc | 68.328 | 102,32 | 4.933 | 142,60 | ||||
| 2026-02-17 | 13F | Ancora Advisors, LLC | 270 | 19 | ||||||
| 2026-01-22 | 13F | JCIC Asset Management Inc. | 68.308 | -1,12 | 4.931 | 18,53 | ||||
| 2026-02-13 | 13F | Cornerstone Financial Management LLC | 16 | 1 | ||||||
| 2026-02-17 | 13F | Jain Global LLC | 0 | -100,00 | 0 | |||||
| 2026-02-09 | 13F | AIA Group Ltd | 86.584 | -25,34 | 6.250 | -10,50 | ||||
| 2026-02-17 | 13F | Mercer Global Advisors Inc /adv | 42.238 | 0,99 | 3.049 | 21,09 | ||||
| 2025-11-14 | 13F | Wolverine Trading, Llc | Put | 3.500 | 203 | |||||
| 2026-02-11 | 13F | O'shaughnessy Asset Management, Llc | 173.101 | 50,74 | 12.496 | 80,71 | ||||
| 2025-11-14 | 13F | Cubist Systematic Strategies, LLC | 277.000 | 16.681 | ||||||
| 2026-02-17 | 13F | PharVision Advisers, LLC | 0 | -100,00 | 0 | |||||
| 2026-01-14 | 13F | USA Financial Portformulas Corp | 0 | -100,00 | 0 | |||||
| 2026-02-13 | 13F | JustInvest LLC | 31.667 | -0,17 | 2.286 | 19,56 | ||||
| 2026-02-11 | 13F | Vise Technologies, Inc. | 5.525 | -50,75 | 399 | -41,04 | ||||
| 2026-02-17 | 13F | Balyasny Asset Management Llc | 90.244 | -22,47 | 6.515 | -7,06 | ||||
| 2026-02-06 | 13F | GPS Wealth Strategies Group, LLC | 0 | -100,00 | 0 | |||||
| 2026-01-28 | 13F | Ruffer LLP | 0 | -100,00 | 0 | |||||
| 2026-02-17 | 13F | CHICAGO TRUST Co NA | 0 | -100,00 | 0 | |||||
| 2026-02-17 | 13F | Engineers Gate Manager LP | 21.235 | -59,87 | 1.533 | -51,91 | ||||
| 2026-04-06 | 13F | Highline Wealth Partners Llc | 37 | 0,00 | 2 | 0,00 | ||||
| 2026-02-11 | 13F | Franklin Resources Inc | 391.605 | 6,27 | 28.270 | 27,40 | ||||
| 2026-01-26 | 13F | Covenant Partners, LLC | 10.655 | 0,00 | 769 | 19,97 | ||||
| 2026-01-28 | 13F | Rothschild & Co Wealth Management UK Ltd | 114.095 | -22,42 | 8.237 | -7,00 | ||||
| 2026-02-13 | 13F | Morgan Stanley | 1.801.283 | 14,55 | 130.035 | 37,32 | ||||
| 2025-11-14 | 13F | Point72 Hong Kong Ltd | 8.260 | 497 | ||||||
| 2026-02-11 | 13F | Tacita Capital Inc | 600 | 0,00 | 43 | 19,44 | ||||
| 2026-02-17 | 13F | Lazard Asset Management Llc | 99.310 | -54,54 | 7.169 | -45,50 | ||||
| 2026-02-13 | 13F | Umb Bank N A/mo | 544 | 0,00 | 39 | 21,88 | ||||
| 2026-02-17 | 13F | Private Advisor Group, LLC | 4.904 | 354 | ||||||
| 2026-02-17 | 13F | Cantor Fitzgerald, L. P. | 0 | -100,00 | 0 | -100,00 | ||||
| 2026-02-12 | 13F | Integrated Quantitative Investments LLC | 22.510 | 1.625 | ||||||
| 2026-01-12 | 13F | DAVENPORT & Co LLC | 24.199 | -0,59 | 1.747 | 19,18 | ||||
| 2026-02-06 | 13F | Creative Financial Designs Inc /adv | 12 | 0,00 | 1 | |||||
| 2026-02-05 | 13F | Allworth Financial LP | 300 | 16,73 | 22 | 40,00 | ||||
| 2026-02-11 | 13F | Marks Group Wealth Management, Inc | 12.087 | 873 | ||||||
| 2026-02-12 | 13F | Pitcairn Co | 0 | -100,00 | 0 | |||||
| 2025-11-12 | 13F | DnB Asset Management AS | 0 | -100,00 | 0 | -100,00 | ||||
| 2026-02-17 | 13F | Snowden Capital Advisors LLC | 8.714 | 1,42 | 629 | 21,66 | ||||
| 2026-02-13 | 13F | Great West Life Assurance Co /can/ | 1.106.498 | 1,94 | 80 | 29,03 | ||||
| 2026-01-30 | 13F | Bogart Wealth, LLC | 1 | 0,00 | 0 | |||||
| 2025-11-12 | 13F | NewSquare Capital LLC | 0 | -100,00 | 0 | |||||
| 2026-01-15 | 13F | Fortitude Family Office, LLC | 1.257 | 0,00 | 91 | 20,00 | ||||
| 2026-02-05 | 13F | Cambridge Investment Research Advisors, Inc. | 11.207 | 1,87 | 1 | |||||
| 2026-02-12 | 13F | Hm Payson & Co | 0 | -100,00 | 0 | |||||
| 2026-02-12 | 13F | JPL Wealth Management, LLC | 0 | -100,00 | 0 | |||||
| 2026-02-06 | 13F | Signature Estate & Investment Advisors Llc | 5.391 | -1,08 | 389 | 18,60 | ||||
| 2026-02-17 | 13F | Capital Fund Management S.a. | 42.535 | -49,10 | 3.071 | -38,99 | ||||
| 2026-02-13 | 13F | Sei Investments Co | 1.617.288 | 37,13 | 116.752 | 64,38 | ||||
| 2026-02-03 | 13F | Diversify Wealth Management, Llc | 23.940 | 11,04 | 1.628 | 16,20 | ||||
| 2026-02-10 | 13F | SCS Capital Management LLC | 0 | -100,00 | 0 | |||||
| 2026-02-06 | 13F | Plan A Wealth LLC | 3.763 | 9,14 | 272 | 30,92 | ||||
| 2026-02-13 | 13F | Formula Growth Ltd | 62.388 | 0,00 | 4.504 | 19,86 | ||||
| 2026-02-10 | 13F | Quantbot Technologies LP | 0 | -100,00 | 0 | |||||
| 2026-02-11 | 13F | Nemes Rush Group LLC | 53 | 4 | ||||||
| 2026-02-12 | 13F | Commonwealth Equity Services, Llc | 14.867 | -2,73 | 1.073 | |||||
| 2025-10-30 | 13F | Ridgewood Investments LLC | 0 | -100,00 | 0 | -100,00 | ||||
| 2026-01-23 | 13F | Assetmark, Inc | 355.617 | 151,02 | 25.672 | 200,91 | ||||
| 2026-02-11 | 13F | Fox Run Management, L.l.c. | 7.492 | 541 | ||||||
| 2026-01-12 | 13F | Salem Investment Counselors Inc | 0 | -100,00 | 0 | |||||
| 2026-02-13 | 13F | Victory Capital Management Inc | 0 | -100,00 | 0 | |||||
| 2026-02-10 | 13F | AdvisorShares Investments LLC | 18.145 | 1,12 | 1.310 | 21,20 | ||||
| 2026-01-14 | 13F | Net Worth Advisory Group | 3.740 | 1,82 | 270 | 22,17 | ||||
| 2026-01-15 | 13F | Lodestone Wealth Management LLC | 24 | 2 | ||||||
| 2026-01-21 | 13F | Yousif Capital Management, Llc | 7.887 | 0,00 | 548 | 15,61 | ||||
| 2026-02-18 | 13F | GWM Advisors LLC | 0 | -100,00 | 0 | |||||
| 2026-02-17 | 13F | Wealth Watch Advisors, INC | 42 | 0,00 | 3 | 50,00 | ||||
| 2026-02-13 | 13F | Wexford Capital Lp | 0 | -100,00 | 0 | |||||
| 2026-04-06 | 13F | Washington Trust Advisors, Inc. | 19 | -81,19 | 1 | -85,71 | ||||
| 2026-01-16 | 13F | Empirical Financial Services, LLC d.b.a. Empirical Wealth Management | 7.213 | 521 | ||||||
| 2025-10-20 | 13F | Shilanski & Associates, Inc. | 4.242 | 255 | ||||||
| 2026-01-09 | 13F | SG Americas Securities, LLC | 5.860 | -39,44 | 0 | |||||
| 2026-02-17 | 13F | Janus Henderson Group Plc | 5.567.154 | 2,16 | 401.892 | 22,46 | ||||
| 2026-02-02 | 13F | CENTRAL TRUST Co | 1 | 0 | ||||||
| 2025-10-31 | 13F | Whittier Trust Co Of Nevada Inc | 0 | -100,00 | 0 | -100,00 | ||||
| 2025-10-30 | 13F | Twin Peaks Wealth Advisors, LLC | 0 | -100,00 | 0 | -100,00 | ||||
| 2026-02-17 | 13F | Captrust Financial Advisors | 25.787 | 43,45 | 1.862 | 72,00 | ||||
| 2026-02-10 | 13F | Norges Bank | 1.274.000 | 91.970 | ||||||
| 2026-02-17 | 13F | Two Sigma Advisers, Lp | 98.383 | -56,15 | 7.102 | -47,44 | ||||
| 2026-02-17 | 13F | Glenmede Trust Co Na | 6.260 | 452 | ||||||
| 2026-02-11 | 13F | Group One Trading, L.p. | Call | 200 | -88,24 | 14 | -86,27 | |||
| 2026-02-11 | 13F | Group One Trading, L.p. | Put | 1.000 | 900,00 | 72 | 1.100,00 | |||
| 2026-01-27 | 13F | Elevated Capital Advisors, LLC | 17 | 1 | ||||||
| 2026-02-11 | 13F | Group One Trading, L.p. | 343 | 1.170,37 | 25 | 2.300,00 | ||||
| 2026-02-17 | 13F | Tower Research Capital LLC (TRC) | 2.220 | 110,63 | 160 | 153,97 | ||||
| 2026-01-28 | 13F | Cortland Associates Inc/mo | 692.972 | -1,84 | 50.026 | 17,68 |