Grundlæggende statistik
| Institutionelle ejere | 254 total, 253 long only, 0 short only, 1 long/short - change of -6,45% MRQ |
| Del pris | 25,00 |
| Gennemsnitlig porteføljeallokering | 0.0913 % - change of -54,99% MRQ |
| Institutionelle aktier (lange) | 67.035.999 (ex 13D/G) - change of -6,08MM shares -8,27% MRQ |
| Institutionel værdi (lang) | $ 1.581.833 USD ($1000) |
Institutionelt ejerskab og aktionærer
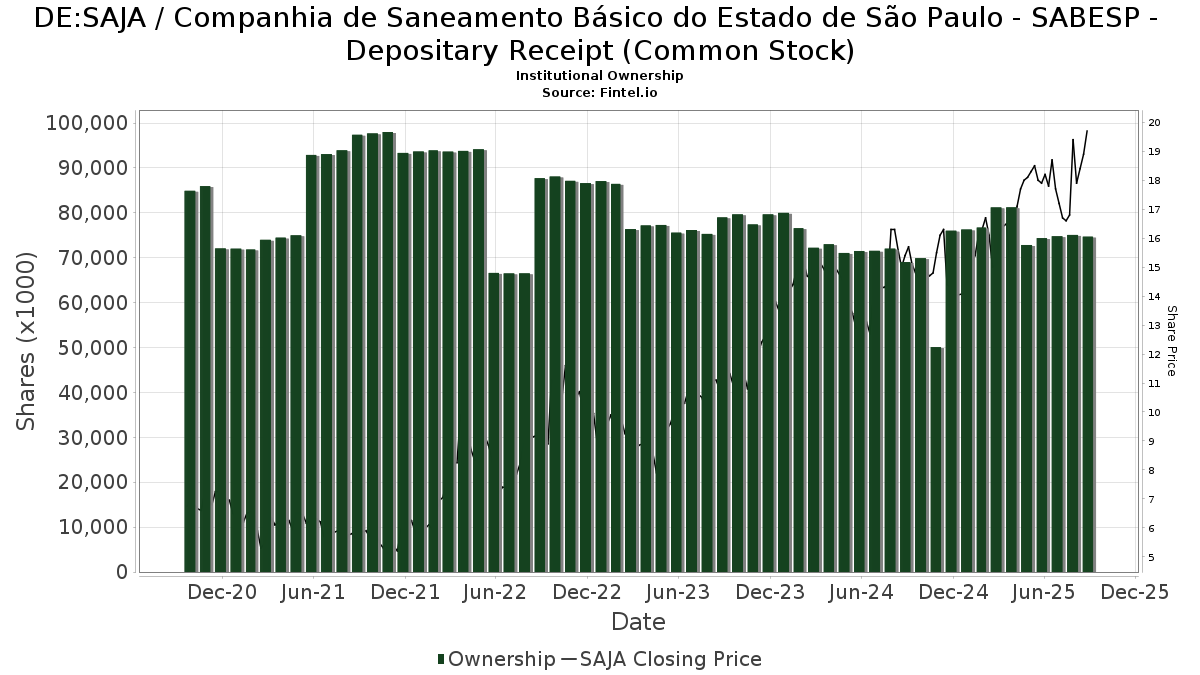
Companhia de Saneamento Básico do Estado de São Paulo - SABESP - Depositary Receipt (Common Stock) (DE:SAJA) har 254 institutionelle ejere og aktionærer, der har indsendt 13D/G- eller 13F-formularer til Securities Exchange Commission (SEC). Disse institutioner har i alt 67,035,999 aktier. Største aktionærer omfatter Impax Asset Management Group plc, BlackRock, Inc., Amundi, Deutsche Bank Ag\, Manning & Napier Advisors Llc, Bank Of America Corp /de/, Letko, Brosseau & Associates Inc, Mackenzie Financial Corp, Vanguard Group Inc, and Morgan Stanley .
Companhia de Saneamento Básico do Estado de São Paulo - SABESP - Depositary Receipt (Common Stock) (DB:SAJA) institutionel ejerskabsstruktur viser aktuelle positioner i virksomheden efter institutioner og fonde, samt seneste ændringer i positionsstørrelse. Større aktionærer kan omfatte individuelle investorer, investeringsforeninger, hedgefonde eller institutioner. Skema 13D angiver, at investoren besidder (eller besidder) mere end 5 % af virksomheden og har til hensigt (eller har til hensigt at) aktivt at forfølge en ændring i forretningsstrategi. Skema 13G indikerer en passiv investering på over 5%.
The share price as of February 25, 2026 is 25,00 / share. Previously, on March 3, 2025, the share price was 15,40 / share. This represents an increase of 62,34% over that period.
Fondens stemningsscore
Fund Sentiment Score (fka Ownership Accumulation Score) finder de aktier, der bliver mest købt af fonde. Det er resultatet af en sofistikeret, multi-faktor kvantitativ model, der identificerer virksomheder med de højeste niveauer af institutionel akkumulering. Scoringsmodellen bruger en kombination af den samlede stigning i oplyste ejere, ændringerne i porteføljeallokeringer i disse ejere og andre målinger. Tallet går fra 0 til 100, hvor højere tal indikerer et højere niveau af akkumulering for sine jævnaldrende, og 50 er gennemsnittet.
Opdateringsfrekvens: Dagligt
Se Ownership Explorer, som giver en liste over højest rangerende virksomheder.
AI+ Ask Fintel’s AI assistant about Companhia de Saneamento Básico do Estado de São Paulo - SABESP - Depositary Receipt (Common Stock).
Select a question to share a public post with an AI-crafted answer.
Thinking of good questions…
13F og NPORT arkivering
Detaljer om 13F-arkivering er gratis. Detaljer om NP-ansøgninger kræver et premium-medlemskab. Grønne rækker angiver nye positioner. Røde rækker angiver lukkede positioner. Klik på linket ikon for at se den fulde transaktionshistorik.
Opgrader
for at låse premium-data op og eksportere til Excel ![]() .
.
| Fil dato | Kilde | Investor | Type | Gennemsnitlig pris (Øst) |
Aktier | Δ Aktier (%) |
Rapporteret Værdi ($1000) |
Δ Værdi (%) |
Port Alloc (%) |
|
|---|---|---|---|---|---|---|---|---|---|---|
| 2026-02-11 | 13F | Simplex Trading, Llc | 0 | -100,00 | 0 | |||||
| 2026-02-17 | 13F | Ninepoint Partners LP | 84 | 2 | ||||||
| 2026-01-26 | 13F | Private Trust Co Na | 251 | -1,57 | 6 | -16,67 | ||||
| 2026-02-11 | 13F | Simplex Trading, Llc | Call | 0 | -100,00 | 0 | ||||
| 2026-02-06 | 13F | Banque Cantonale Vaudoise | 1.856 | 2,94 | 44 | |||||
| 2026-02-13 | 13F | SRS Capital Advisors, Inc. | 1.107 | 26 | ||||||
| 2026-02-17 | 13F | Massar Capital Management, LP | 0 | -100,00 | 0 | |||||
| 2026-02-13 | 13F | Inspire Advisors, LLC | 0 | -100,00 | 0 | |||||
| 2026-02-17 | 13F | Strategic Investment Advisors / MI | 13.502 | -5,55 | 322 | -9,30 | ||||
| 2025-11-12 | 13F | Simplex Trading, Llc | Put | 0 | -100,00 | 0 | ||||
| 2026-02-09 | 13F | Legal & General Group Plc | 1.085.894 | 5,92 | 25.902 | 1,51 | ||||
| 2026-01-26 | 13F | Mirae Asset Global Investments Co., Ltd. | 25.621 | 7,61 | 611 | 3,21 | ||||
| 2026-02-02 | 13F | Qrg Capital Management, Inc. | 24.575 | 20,82 | 586 | 15,81 | ||||
| 2026-02-17 | 13F | Point72 Asset Management, L.P. | 76.927 | 522,03 | 1.835 | 497,39 | ||||
| 2026-02-13 | 13F | Ubs Asset Management Americas Inc | 1.553.584 | 37.053 | ||||||
| 2026-02-11 | 13F | Erste Asset Management GmbH | 0 | 0 | ||||||
| 2026-01-28 | 13F | B. Metzler seel. Sohn & Co. AG | 78.406 | 43,10 | 1.870 | 37,12 | ||||
| 2026-02-17 | 13F | SageView Advisory Group, LLC | 228 | 5 | ||||||
| 2026-01-29 | 13F | UBS Group AG | 968.096 | 248,91 | 23.089 | 234,38 | ||||
| 2026-02-17 | 13F | DZ BANK AG Deutsche Zentral Genossenschafts Bank, Frankfurt am Main | 0 | -100,00 | 0 | |||||
| 2026-02-13 | 13F | Resources Investment Advisors, LLC. | 0 | -100,00 | 0 | |||||
| 2026-02-03 | 13F | SBI Securities Co., Ltd. | 1.933 | 4,60 | 46 | 2,22 | ||||
| 2026-02-02 | 13F | Principal Financial Group Inc | 48.449 | 12,21 | 1.156 | 7,54 | ||||
| 2026-02-13 | 13F | Schroder Investment Management Group | 0 | -100,00 | 0 | |||||
| 2025-11-06 | 13F | Advisors Asset Management, Inc. | 0 | -100,00 | 0 | |||||
| 2026-01-29 | 13F | Impax Asset Management Group plc | 7.236.477 | -11,78 | 172.590 | -15,12 | ||||
| 2026-02-06 | 13F | Profund Advisors Llc | 23.451 | 13,85 | 559 | 9,18 | ||||
| 2026-02-09 | 13F | Hantz Financial Services, Inc. | 15.356 | 74,18 | 0 | |||||
| 2026-02-03 | 13F | Ethic Inc. | 12.085 | -0,73 | 288 | -4,95 | ||||
| 2026-02-17 | 13F | Citadel Advisors Llc | Call | 9.384 | -40,23 | 224 | -42,82 | |||
| 2026-02-17 | 13F | Graham Capital Management, L.P. | 27.780 | 663 | ||||||
| 2025-09-25 | NP | DAADX - Emerging Markets ex China Core Equity Portfolio Institutional Class | 15.888 | 0,00 | 306 | -5,26 | ||||
| 2025-09-23 | NP | EXOSX - Overseas Series Class I | 353.323 | 65,33 | 6.812 | 56,81 | ||||
| 2026-02-10 | 13F | Quantbot Technologies LP | 232 | -99,73 | 6 | -99,77 | ||||
| 2026-02-17 | 13F | Northern Trust Corp | 1.530.321 | 7,45 | 36.498 | 2,96 | ||||
| 2025-09-26 | NP | JHAAX - Multi-Asset Absolute Return Fund Class A | 2.586 | -17,77 | 50 | -22,22 | ||||
| 2026-02-17 | 13F | Susquehanna International Group, Llp | Call | 0 | -100,00 | 0 | ||||
| 2025-11-12 | 13F | Victory Capital Management Inc | 0 | -100,00 | 0 | -100,00 | ||||
| 2026-01-09 | 13F | Diversified Trust Co | 12.330 | 294 | ||||||
| 2026-02-11 | 13F | Deutsche Bank Ag\ | 3.839.968 | -36,82 | 91.583 | -39,46 | ||||
| 2026-02-13 | 13F | Wells Fargo & Company/mn | 20.528 | -13,61 | 490 | -17,26 | ||||
| 2026-02-18 | 13F | Vident Advisory, LLC | 35.538 | 1,54 | 848 | -2,76 | ||||
| 2025-11-14 | 13F | Lazard Asset Management Llc | 0 | -100,00 | 0 | |||||
| 2026-02-13 | 13F | Centiva Capital, LP | 14.982 | 357 | ||||||
| 2026-02-10 | 13F | Natixis Advisors, L.p. | 19.798 | -0,92 | 0 | |||||
| 2025-09-24 | NP | DAEMX - Dunham Emerging Markets Stock Fund Class A | 3.900 | 75 | ||||||
| 2026-02-13 | 13F | Cullen Capital Management, LLC | 41.350 | 33,45 | 986 | 27,89 | ||||
| 2025-11-14 | 13F | Cubist Systematic Strategies, LLC | 4.154 | 103 | ||||||
| 2026-01-20 | 13F | Perpetual Ltd | 1.322.796 | -23,06 | 31.549 | -26,28 | ||||
| 2026-02-17 | 13F | Jones Financial Companies Lllp | 383 | 49,61 | 9 | 50,00 | ||||
| 2026-02-17 | 13F | Susquehanna International Group, Llp | 38.585 | -3,09 | 920 | -7,07 | ||||
| 2026-02-11 | 13F | Jpmorgan Chase & Co | 101.576 | 17,16 | 2.423 | 12,29 | ||||
| 2026-02-06 | 13F | HighTower Advisors, LLC | 74.453 | 103,91 | 1.776 | 95,48 | ||||
| 2026-01-26 | 13F | Duff & Phelps Investment Management Co | 1.444.628 | 7,13 | 34.454 | 2,66 | ||||
| 2025-09-25 | NP | VEIEX - Vanguard Emerging Markets Stock Index Fund Investor Shares | 1.166.239 | 0,00 | 22.485 | -5,16 | ||||
| 2026-01-16 | 13F | Perigon Wealth Management, LLC | 42.606 | 1.016 | ||||||
| 2026-01-16 | 13F | Ronald Blue Trust, Inc. | 21.274 | -0,25 | 509 | -4,15 | ||||
| 2026-02-17 | 13F | Raymond James Financial Inc | 9.588 | 18,33 | 229 | 13,43 | ||||
| 2026-02-19 | 13F | Invesco Ltd. | 841.957 | -3,61 | 20.081 | -7,64 | ||||
| 2026-01-13 | 13F | CoreCap Advisors, LLC | 1.170 | -95,29 | 28 | -95,62 | ||||
| 2026-02-13 | 13F | MAI Capital Management | 5.081 | 2,94 | 121 | -0,82 | ||||
| 2026-02-13 | 13F | First Trust Advisors Lp | 1.138.971 | 4,14 | 27.164 | -0,22 | ||||
| 2026-02-06 | 13F | EverSource Wealth Advisors, LLC | 2.330 | 13,77 | 56 | 10,00 | ||||
| 2026-02-13 | 13F | Marshall Wace, Llp | 290.372 | 6.925 | ||||||
| 2026-02-24 | 13F | Bell Investment Advisors, Inc | 148 | -28,16 | 4 | -40,00 | ||||
| 2026-02-09 | 13F | Key FInancial Inc | 32.773 | 2,96 | 782 | -0,26 | ||||
| 2026-02-17 | 13F | Cetera Investment Advisers | 49.128 | -2,11 | 1.172 | -6,24 | ||||
| 2026-02-05 | 13F | Cambridge Investment Research Advisors, Inc. | 26.742 | 0,27 | 1 | |||||
| 2025-11-14 | 13F | National Bank Of Canada /fi/ | 0 | -100,00 | 0 | |||||
| 2025-10-22 | 13F | Geneos Wealth Management Inc. | 0 | -100,00 | 0 | |||||
| 2026-02-12 | 13F/A | Pinebridge Investments Llc | 104.624 | 2.495 | ||||||
| 2026-02-13 | 13F | Arrowstreet Capital, Limited Partnership | 0 | -100,00 | 0 | |||||
| 2025-11-13 | 13F | Empowered Funds, LLC | 0 | -100,00 | 0 | |||||
| 2026-02-17 | 13F | Two Sigma Securities, Llc | 14.259 | 340 | ||||||
| 2026-02-17 | 13F | Public Employees Retirement System Of Ohio | 0 | -100,00 | 0 | |||||
| 2026-01-15 | 13F | Boston Common Asset Management, LLC | 216.467 | 5.163 | ||||||
| 2025-11-12 | 13F | Allianz Se | 0 | -100,00 | 0 | -100,00 | ||||
| 2026-02-12 | 13F | Federation des caisses Desjardins du Quebec | 90.996 | 18,46 | 2.170 | 13,49 | ||||
| 2025-11-13 | 13F | Hsbc Holdings Plc | 369.034 | 16,17 | 9.183 | 31,58 | ||||
| 2026-02-10 | 13F | NS Partners Ltd | 74.130 | 9,01 | 1.768 | 4,49 | ||||
| 2026-01-27 | 13F | Checchi Capital Advisers, LLC | 0 | -100,00 | 0 | |||||
| 2025-11-12 | 13F | Headlands Technologies LLC | 0 | -100,00 | 0 | |||||
| 2026-02-13 | 13F | Umb Bank N A/mo | 3.577 | 2,96 | 85 | -1,16 | ||||
| 2026-02-17 | 13F | Aquatic Capital Management LLC | 4.944 | 118 | ||||||
| 2025-09-24 | NP | SNTKX - Steward International Enhanced Index Fund Class A | 16.986 | -62,72 | 327 | -64,69 | ||||
| 2025-11-14 | 13F | PineBridge Investments, L.P. | 83.171 | 2.070 | ||||||
| 2026-01-08 | 13F | Nordea Investment Management Ab | 53.048 | -4,85 | 1.275 | -7,41 | ||||
| 2026-01-30 | 13F | American Capital Advisory, LLC | 813 | 19 | ||||||
| 2026-02-12 | 13F | Skopos Labs, Inc. | 28.980 | 195,20 | 683 | 233,17 | ||||
| 2026-02-13 | 13F | Pinnacle Wealth Planning Services, Inc. | 1.904 | -89,96 | 45 | -28,57 | ||||
| 2026-02-11 | 13F | Lifestyle Asset Management, Inc. | 72.093 | 7,24 | 1.719 | 2,75 | ||||
| 2025-09-25 | NP | VGTSX - Vanguard Total International Stock Index Fund Investor Shares | 698.508 | 0,00 | 13.467 | -5,16 | ||||
| 2026-02-03 | 13F | Sequoia Financial Advisors, LLC | 18.343 | 2,26 | 437 | -2,02 | ||||
| 2026-02-11 | 13F | IMA Wealth, Inc. | 110 | 3 | ||||||
| 2026-02-10 | 13F | Daiwa Securities Group Inc. | 46.672 | -6,08 | 1 | 0,00 | ||||
| 2026-02-12 | 13F | Groupe la Francaise | 81.895 | 5,34 | 1.952 | 0,83 | ||||
| 2026-02-17 | 13F | Advisor Group Holdings, Inc. | 9.126 | -87,08 | 218 | -87,63 | ||||
| 2026-02-09 | 13F | Hartland & Co., LLC | 282 | 2,92 | 7 | 0,00 | ||||
| 2026-02-17 | 13F | Laird Norton Trust Company, Llc | 30.590 | 744 | ||||||
| 2025-11-20 | 13F | Asset Dedication, LLC | 0 | -100,00 | 0 | |||||
| 2026-02-17 | 13F | Snowden Capital Advisors LLC | 8.958 | 3,44 | 218 | 0,93 | ||||
| 2026-02-12 | 13F | Qtron Investments LLC | 0 | -100,00 | 0 | |||||
| 2026-02-13 | 13F | Neuberger Berman Group LLC | 68.197 | 1,92 | 1.634 | -1,15 | ||||
| 2026-02-17 | 13F | Fmr Llc | 176.423 | 2,37 | 4.208 | -1,91 | ||||
| 2025-11-12 | 13F | NewSquare Capital LLC | 0 | -100,00 | 0 | -100,00 | ||||
| 2026-02-12 | 13F | Quadrant Capital Group Llc | 10.344 | 4,98 | 247 | 0,41 | ||||
| 2025-09-25 | NP | DEXC - Dimensional Emerging Markets ex China Core Equity ETF | 8.000 | 15,94 | 154 | 10,00 | ||||
| 2026-02-06 | 13F | Larson Financial Group LLC | 1.350 | -31,19 | 32 | -33,33 | ||||
| 2026-02-11 | 13F | Janney Montgomery Scott LLC | 13.723 | 34,74 | 0 | |||||
| 2026-02-11 | 13F | Metis Global Partners, LLC | 32.972 | -0,34 | 786 | -4,50 | ||||
| 2026-02-10 | 13F | Nomura Asset Management Co Ltd | 0 | 0 | ||||||
| 2026-02-12 | 13F | Federated Hermes, Inc. | 61.566 | 2,96 | 1.468 | -1,34 | ||||
| 2026-02-17 | 13F | Optiver Holding B.V. | Put | 26.100 | -0,76 | 622 | -4,89 | |||
| 2026-01-21 | 13F | Quilter Plc | 629.154 | -10,47 | 15.005 | -14,21 | ||||
| 2025-09-29 | NP | KBIWX - KBI GLOBAL INVESTORS AQUARIUS FUND Institutional Shares | 48.524 | 9,33 | 936 | 3,66 | ||||
| 2026-02-06 | 13F | Creative Financial Designs Inc /adv | 6.148 | 15,67 | 147 | 10,61 | ||||
| 2026-02-13 | 13F | Atlas Capital Advisors Llc | 3.615 | 2,96 | 86 | 11,69 | ||||
| 2026-02-12 | 13F | Bank Of Montreal /can/ | 145.193 | -6,87 | 3.463 | -10,77 | ||||
| 2026-02-12 | 13F | Pitcairn Co | 0 | -100,00 | 0 | |||||
| 2026-02-11 | 13F | Cerity Partners LLC | 15.162 | -0,30 | 362 | -4,50 | ||||
| 2026-02-13 | 13F | American Century Companies Inc | 1.563.421 | 9,29 | 37.288 | 4,72 | ||||
| 2026-02-13 | 13F | Sei Investments Co | 100.983 | 30,77 | 2.408 | 25,29 | ||||
| 2026-02-17 | 13F | Optiver Holding B.V. | 115.317 | -23,42 | 2.750 | -26,61 | ||||
| 2026-02-18 | 13F | Mackenzie Financial Corp | 2.161.328 | 2,28 | 52.072 | -1,00 | ||||
| 2026-02-17 | 13F | Mercer Global Advisors Inc /adv | 10.139 | -0,24 | 242 | -4,37 | ||||
| 2026-02-02 | 13F | Fifth Third Bancorp | 56 | 0,00 | 1 | 0,00 | ||||
| 2026-02-13 | 13F | Manufacturers Life Insurance Company, The | 0 | -100,00 | 0 | |||||
| 2026-02-19 | 13F | CI Private Wealth, LLC | 39.057 | 2,09 | 931 | -2,21 | ||||
| 2026-02-12 | 13F | Jane Street Group, Llc | 103.262 | 761,23 | 2.463 | 726,17 | ||||
| 2026-02-17 | 13F | Wellington Management Group Llp | 0 | -100,00 | 0 | |||||
| 2026-02-12 | 13F | Brown Brothers Harriman & Co | 1.426 | 9,27 | 34 | 6,25 | ||||
| 2026-01-15 | 13F | Highline Wealth Partners Llc | 69 | 0,00 | 2 | 0,00 | ||||
| 2026-02-06 | 13F | Handelsbanken Fonder AB | 46.277 | 2,96 | 1 | 0,00 | ||||
| 2026-02-17 | 13F/A | Intesa Sanpaolo S.p.a. | 15.000 | 362 | ||||||
| 2026-02-17 | 13F | Ameriprise Financial Inc | 36.912 | 6,32 | 892 | 3,13 | ||||
| 2026-02-17 | 13F | Maryland State Retirement & Pension System | 538.053 | -3,08 | 12.833 | -7,13 | ||||
| 2026-01-26 | 13F | Cwm, Llc | 5.474 | 30,96 | 0 | |||||
| 2026-02-17 | 13F | CWM Advisors, LLC | 3.732 | 89 | ||||||
| 2026-02-10 | 13F/A | Northwestern Mutual Wealth Management Co | 1.101 | 0,00 | 26 | -3,70 | ||||
| 2025-10-29 | 13F/A | J.Safra Asset Management Corp | 0 | -100,00 | 0 | |||||
| 2026-02-17 | 13F | Citadel Advisors Llc | 0 | -100,00 | 0 | |||||
| 2026-02-17 | 13F | Ancora Advisors, LLC | 22 | 1 | ||||||
| 2026-02-13 | 13F | Kestra Advisory Services, LLC | 9.509 | -5,20 | 227 | -9,24 | ||||
| 2026-02-19 | 13F | Atomi Financial Group, Inc. | 14.827 | 6,81 | 354 | 2,32 | ||||
| 2026-02-09 | 13F | Wcm Investment Management, Llc | 442.683 | 76,13 | 10.686 | 73,76 | ||||
| 2025-09-25 | NP | DFAX - Dimensional World ex U.S. Core Equity 2 ETF | 32.228 | 10,64 | 621 | 4,90 | ||||
| 2026-01-29 | 13F | UMA Financial Services, Inc. | 1.008 | 4,89 | 24 | 4,35 | ||||
| 2026-02-06 | 13F | ProShare Advisors LLC | 53.387 | 8,14 | 1.273 | 3,66 | ||||
| 2026-02-09 | 13F | Harbour Investments, Inc. | 600 | 8,70 | 14 | 7,69 | ||||
| 2025-11-14 | 13F | Bridgefront Capital, LLC | 0 | -100,00 | 0 | -100,00 | ||||
| 2026-02-13 | 13F | Pingora Partners LLC | 1.998 | 0,00 | 48 | -4,08 | ||||
| 2025-09-25 | NP | DFA INVESTMENT DIMENSIONS GROUP INC - World ex U.S. Core Equity Portfolio Institutional Class Shares | 2.100 | -69,57 | 40 | -52,38 | ||||
| 2026-01-08 | 13F | Adirondack Trust Co | 157 | 4 | ||||||
| 2025-09-29 | NP | PHO - Invesco Water Resources ETF This fund is a listed as child fund of Invesco Ltd. and if that institution has disclosed ownership in this security, then these positions will not be double counted when calculating total shares and total value | 972.181 | 23,21 | 18.744 | 16,84 | ||||
| 2026-01-12 | 13F | Abound Wealth Management | 11 | 0,00 | 0 | |||||
| 2026-02-17 | 13F | Guggenheim Capital Llc | 11.732 | 6,79 | 280 | 2,20 | ||||
| 2026-02-10 | 13F | Envestnet Asset Management Inc | 259.657 | 38,39 | 6.193 | 32,59 | ||||
| 2026-02-11 | 13F | CenterBook Partners LP | 107.340 | 2.560 | ||||||
| 2025-09-24 | NP | Innovator ETFs Trust - Innovator IBD Breakout Opportunities ETF | 0 | -100,00 | 0 | -100,00 | ||||
| 2026-02-13 | 13F | Toroso Investments, LLC | 32.044 | 124,13 | 764 | 115,21 | ||||
| 2026-02-03 | 13F | Manning & Napier Advisors Llc | 2.803.426 | -9,25 | 67.675 | -11,99 | ||||
| 2025-11-04 | 13F | Gitterman Wealth Management, LLC | 38.295 | 60,01 | 953 | 81,52 | ||||
| 2026-02-12 | 13F | Barometer Capital Management Inc. | 19.200 | -43,03 | 1.221 | 45,70 | ||||
| 2026-01-23 | 13F | Farther Finance Advisors, LLC | 6.670 | 21,16 | 159 | 16,06 | ||||
| 2026-02-17 | 13F | Bayesian Capital Management, LP | 0 | -100,00 | 0 | -100,00 | ||||
| 2025-09-25 | NP | DFA INVESTMENT DIMENSIONS GROUP INC - Emerging Markets Sustainability Core 1 Portfolio Institutional Class This fund is a listed as child fund of Dimensional Fund Advisors Lp and if that institution has disclosed ownership in this security, then these positions will not be double counted when calculating total shares and total value | 5.079 | 0,00 | 98 | -5,83 | ||||
| 2026-02-12 | 13F | Campbell & CO Investment Adviser LLC | 20.874 | 12,38 | 498 | 7,58 | ||||
| 2026-02-13 | 13F | Itau Unibanco Holding S.A. | 351.501 | 2,70 | 8.414 | -1,23 | ||||
| 2026-02-13 | 13F | Rhumbline Advisers | 102.256 | -7,65 | 2.439 | -11,54 | ||||
| 2026-02-06 | 13F | Global Retirement Partners, LLC | 42.633 | 10.859,64 | 1.017 | 11.188,89 | ||||
| 2026-02-02 | 13F | Ativo Capital Management LLC | 65.412 | -9,72 | 1.560 | -13,48 | ||||
| 2026-01-29 | 13F | Pictet Asset Management Holding SA | 560.998 | 32,70 | 13.376 | 27,21 | ||||
| 2026-02-13 | 13F | Absolute Gestao de Investimentos Ltda. | 0 | -100,00 | 0 | |||||
| 2026-02-03 | 13F | Crossmark Global Holdings, Inc. | 24.440 | 3,12 | 583 | -1,19 | ||||
| 2026-02-17 | 13F | Schonfeld Strategic Advisors LLC | 111.470 | 2.659 | ||||||
| 2026-02-05 | 13F | Allworth Financial LP | 400 | 63,27 | 10 | 50,00 | ||||
| 2026-02-06 | 13F | Pnc Financial Services Group, Inc. | 19.975 | 6,46 | 476 | 1,93 | ||||
| 2026-02-13 | 13F | Pathstone Holdings, LLC | 12.704 | 5,68 | 303 | 1,34 | ||||
| 2026-02-10 | 13F | Measured Wealth Private Client Group, LLC | 17.936 | 14,42 | 428 | 9,49 | ||||
| 2026-02-12 | 13F | Integrated Quantitative Investments LLC | 0 | -100,00 | 0 | |||||
| 2026-02-13 | 13F | Mariner, LLC | 17.284 | 0,18 | 413 | -3,96 | ||||
| 2026-02-03 | 13F | Legacy Wealth Managment, LLC/ID | 182 | 2,82 | 4 | 0,00 | ||||
| 2026-02-11 | 13F | LPL Financial LLC | 68.337 | 41,62 | 1.630 | 35,64 | ||||
| 2025-09-25 | NP | Dfa Investment Trust Co - The Emerging Markets Series This fund is a listed as child fund of Dimensional Fund Advisors Lp and if that institution has disclosed ownership in this security, then these positions will not be double counted when calculating total shares and total value | 131.581 | 0,00 | 2.537 | -5,20 | ||||
| 2026-01-14 | 13F | Exchange Traded Concepts, Llc | 61.095 | -12,13 | 1.457 | -15,78 | ||||
| 2026-02-13 | 13F | BNP Paribas Asset Management Holding S.A. | 6.506 | 0 | ||||||
| 2026-02-17 | 13F | Prelude Capital Management, Llc | 9.266 | -37,38 | 221 | -40,22 | ||||
| 2026-02-13 | 13F | Acumen Wealth Advisors, LLC | 147 | 4 | ||||||
| 2026-02-11 | 13F | Capital Wealth Planning, LLC | 268.584 | 41,64 | 6.545 | 38,69 | ||||
| 2026-02-17 | 13F | Creative Planning | 41.483 | 33,17 | 989 | 27,61 | ||||
| 2026-02-17 | 13F | Alliancebernstein L.p. | 767.019 | -9,66 | 18.293 | -13,43 | ||||
| 2026-02-17 | 13F | Tower Research Capital LLC (TRC) | 4.852 | 10.927,27 | 116 | 11.400,00 | ||||
| 2025-09-23 | NP | SLANX - DWS Latin America Equity Fund Class A | 40.250 | 0,00 | 776 | -5,13 | ||||
| 2025-11-14 | 13F | Point72 Asia (Singapore) Pte. Ltd. | 1.903 | 47 | ||||||
| 2026-02-11 | 13F | Group One Trading, L.p. | Put | 0 | -100,00 | 0 | -100,00 | |||
| 2026-01-05 | 13F | GAMMA Investing LLC | 1.534 | 3,51 | 37 | 0,00 | ||||
| 2026-02-02 | 13F | Strs Ohio | 1.430.456 | -12,33 | 34.116 | -16,00 | ||||
| 2026-02-10 | 13F | Acadian Asset Management Llc | 0 | -100,00 | 0 | |||||
| 2025-11-14 | 13F | Manchester Capital Management LLC | 44.836 | -21,11 | 1.116 | -10,66 | ||||
| 2025-11-13 | 13F | Riggs Asset Managment Co. Inc. | 0 | -100,00 | 0 | |||||
| 2026-02-11 | 13F | Group One Trading, L.p. | Call | 300 | -72,73 | 7 | -74,07 | |||
| 2025-10-30 | 13F | Twin Peaks Wealth Advisors, LLC | 0 | -100,00 | 0 | |||||
| 2026-01-23 | 13F | Diversify Advisory Services, LLC | 10.003 | -0,37 | 229 | -8,03 | ||||
| 2026-02-14 | 13F | Rockefeller Capital Management L.P. | 1.561 | -71,35 | 37 | -72,59 | ||||
| 2026-02-13 | 13F | Hurley Capital, LLC | 611 | 15 | ||||||
| 2026-02-11 | 13F | O'shaughnessy Asset Management, Llc | 26.436 | 10,15 | 630 | 5,53 | ||||
| 2026-01-29 | 13F | Vanguard Group Inc | 2.094.992 | 2,37 | 49.966 | -1,90 | ||||
| 2026-02-12 | 13F | Raiffeisen Bank International AG | 0 | -100,00 | 0 | |||||
| 2026-02-12 | 13F | Renaissance Technologies Llc | 1.786.418 | -3,63 | 42.606 | -7,66 | ||||
| 2026-02-13 | 13F | Morgan Stanley | 1.835.646 | 17,72 | 43.780 | 12,80 | ||||
| 2026-02-17 | 13F | Millennium Management Llc | 182.021 | -9,02 | 4.341 | -12,81 | ||||
| 2026-02-12 | 13F | BlackRock, Inc. | 5.988.679 | 70,86 | 142.830 | 63,72 | ||||
| 2026-02-17 | 13F | D. E. Shaw & Co., Inc. | 0 | -100,00 | 0 | |||||
| 2026-02-17 | 13F | Russell Investments Group, Ltd. | 56.067 | 3,11 | 1.337 | -1,18 | ||||
| 2025-11-14 | 13F | AXA Investment Managers S.A. | 21.051 | 524 | ||||||
| 2026-01-23 | 13F | Sumitomo Mitsui Trust Holdings, Inc. | 19.072 | 0,73 | 455 | -3,61 | ||||
| 2026-02-10 | 13F | Private Wealth Asset Management, LLC | 20 | 0,00 | 0 | |||||
| 2026-02-17 | 13F | Amundi | 5.359.661 | -1,84 | 127.847 | -5,06 | ||||
| 2026-02-17 | 13F | Cape Investment Advisory, Inc. | 104 | 2 | ||||||
| 2026-02-13 | 13F | Caitong International Asset Management Co., Ltd | 2.265 | 54 | ||||||
| 2026-01-26 | 13F | KBC Group NV | 48.368 | 2,14 | 1 | 0,00 | ||||
| 2026-01-28 | 13F | Kapitalo Investimentos Ltda | 0 | -100,00 | 0 | |||||
| 2026-02-13 | 13F | Ieq Capital, Llc | 8.485 | 202 | ||||||
| 2026-02-04 | 13F | Schwartz Investment Counsel Inc | 122.300 | 0,00 | 2.917 | -4,20 | ||||
| 2026-02-06 | 13F | GPS Wealth Strategies Group, LLC | 0 | -100,00 | 0 | |||||
| 2026-02-10 | 13F | Goldman Sachs Group Inc | 250.910 | -24,14 | 5.984 | -27,31 | ||||
| 2026-02-17 | 13F | XTX Topco Ltd | 72.460 | 260,77 | 1.728 | 246,29 | ||||
| 2026-02-12 | 13F | Dimensional Fund Advisors Lp | 717.194 | 8,02 | 17.123 | 3,79 | ||||
| 2026-02-13 | 13F | SPX Equities Gestao de Recursos Ltda | 348.052 | 65,33 | 8.301 | 58,45 | ||||
| 2026-02-10 | 13F | Bnp Paribas Arbitrage, Sa | 23.365 | 7,47 | 557 | 2,96 | ||||
| 2025-11-14 | 13F | Binnacle Investments Inc | 285 | -24,80 | 7 | -12,50 | ||||
| 2026-02-04 | 13F | ELCO Management Co., LLC | 13.317 | 0,00 | 318 | -4,23 | ||||
| 2025-09-26 | NP | UUPIX - Ultraemerging Markets Profund Investor Class | 2.231 | 28,74 | 43 | 22,86 | ||||
| 2026-01-14 | 13F | Generali Investments CEE, investicni spolecnost, a.s. | 97.491 | -11,36 | 2.325 | -15,05 | ||||
| 2026-01-23 | 13F | Lester Murray Antman dba SimplyRich | 21.678 | 2,54 | 1 | |||||
| 2025-11-14 | 13F | Axa S.a. | 0 | -100,00 | 0 | |||||
| 2025-10-14 | 13F | Yousif Capital Management, Llc | 0 | -100,00 | 0 | |||||
| 2025-09-25 | NP | DFAE - Dimensional Emerging Core Equity Market ETF | 111.040 | 20,64 | 2.141 | 14,38 | ||||
| 2026-02-18 | 13F | Garton & Associates Financial Advisors LLC | 1.841 | 44 | ||||||
| 2026-02-17 | 13F | Optiver Holding B.V. | Call | 0 | -100,00 | 0 | ||||
| 2026-02-13 | 13F | Citigroup Inc | 227.373 | -88,89 | 5.423 | -89,35 | ||||
| 2026-02-13 | 13F | Verition Fund Management LLC | 49.490 | -36,99 | 1.180 | -39,61 | ||||
| 2025-09-22 | NP | GRASX - Goldman Sachs Multi-Manager Real Assets Strategy Fund Class R6 Shares | 166.596 | 12,25 | 3.212 | 6,43 | ||||
| 2026-01-08 | 13F | True Wealth Design, LLC | 45 | 2,27 | 1 | 0,00 | ||||
| 2026-01-20 | 13F | Signaturefd, Llc | 9.750 | 5,22 | 233 | 0,87 | ||||
| 2026-02-17 | 13F | Quantinno Capital Management LP | 59.403 | 32,37 | 1.417 | 26,88 | ||||
| 2026-02-12 | 13F | Principal Securities, Inc. | 0 | -100,00 | 0 | |||||
| 2026-02-17 | 13F | Qube Research & Technologies Ltd | 63.664 | -85,72 | 1.518 | -86,32 | ||||
| 2026-02-13 | 13F | VPR Management LLC | 29.056 | 1,31 | 693 | -2,95 | ||||
| 2026-02-11 | 13F | Parallel Advisors, LLC | 2.122 | -15,59 | 51 | -19,35 | ||||
| 2025-09-26 | NP | UBPIX - Ultralatin America Profund Investor Class | 10.369 | 14,07 | 200 | 8,15 | ||||
| 2026-02-12 | 13F | Wealthspire Advisors, LLC | 0 | -100,00 | 0 | |||||
| 2025-11-20 | 13F | First Affirmative Financial Network | 18.084 | -3,61 | 450 | 9,22 | ||||
| 2026-02-11 | 13F | Hughes Financial Services, LLC | 500 | 0,00 | 12 | -8,33 | ||||
| 2026-01-30 | 13F | North Star Investment Management Corp. | 150 | 500,00 | 4 | |||||
| 2026-01-30 | 13F | Mitsubishi UFJ Trust & Banking Corp | 38.539 | 259,94 | 919 | 245,49 | ||||
| 2026-02-03 | 13F | Ballentine Partners, LLC | 9.907 | 6,73 | 236 | 2,16 | ||||
| 2026-01-26 | 13F | Whittier Trust Co | 22.683 | 550 | ||||||
| 2026-02-11 | 13F | Letko, Brosseau & Associates Inc | 2.216.854 | -1,39 | 52.872 | -5,51 | ||||
| 2026-02-12 | 13F | Steward Partners Investment Advisory, Llc | 6.315 | 3,47 | 151 | -0,66 | ||||
| 2026-02-06 | 13F | Leonteq Securities AG | 685 | 36,73 | 16 | 33,33 | ||||
| 2026-02-13 | 13F | Parkside Financial Bank & Trust | 41 | 2,50 | 1 | |||||
| 2026-02-13 | 13F | Vontobel Holding Ltd. | 81.973 | 3,03 | 1.955 | -1,26 | ||||
| 2025-09-26 | NP | RTXAX - Tax-Managed Real Assets Fund Class A | 36.851 | 0,00 | 710 | -5,21 | ||||
| 2026-02-13 | 13F | Great West Life Assurance Co /can/ | 368.725 | 0,38 | 9 | 0,00 | ||||
| 2026-01-30 | 13F | Us Bancorp \de\ | 22.219 | 10,93 | 530 | 6,22 | ||||
| 2026-02-05 | 13F | Atria Investments Llc | 57.929 | 9,84 | 1.382 | 5,26 | ||||
| 2026-01-22 | 13F | Financial Consulate, Inc | 23 | 1 | ||||||
| 2026-02-17 | 13F | Modern Wealth Management, LLC | 10.696 | 11,08 | 255 | 6,69 | ||||
| 2026-01-23 | 13F | Assetmark, Inc | 985.400 | 3,82 | 23.502 | -0,52 | ||||
| 2026-02-05 | 13F | Thrivent Financial For Lutherans | 21.157 | 1 | ||||||
| 2026-02-12 | 13F | Brinker Capital Investments, LLC | 29.314 | -6,26 | 699 | -10,15 | ||||
| 2026-02-05 | 13F | Pinnacle Associates Ltd | 11.017 | 2,96 | 263 | -1,50 | ||||
| 2025-11-14 | 13F | Wetherby Asset Management Inc | 19.073 | -0,95 | 475 | 12,06 | ||||
| 2026-02-10 | 13F | Connor, Clark & Lunn Investment Management Ltd. | 0 | -100,00 | 0 | |||||
| 2026-01-23 | 13F | Robeco Institutional Asset Management B.V. | 1.050.226 | 13,04 | 25.048 | 8,32 | ||||
| 2026-02-10 | 13F | Eurizon Capital SGR S.p.A. | 8.981 | 216 | ||||||
| 2026-01-05 | 13F | Park Avenue Securities Llc | 10.647 | -0,71 | 0 | |||||
| 2026-02-13 | 13F | Smartleaf Asset Management LLC | 1.515 | 6,39 | 37 | 5,88 | ||||
| 2026-02-17 | 13F | Royal Bank Of Canada | 20.726 | -90,22 | 494 | -90,64 | ||||
| 2026-02-09 | 13F | Geode Capital Management, Llc | 26.405 | -3,15 | 630 | -7,23 | ||||
| 2026-02-13 | 13F | State Street Corp | 442.565 | 0,52 | 10.758 | -1,83 | ||||
| 2026-02-11 | 13F | Allianz Asset Management GmbH | 804.171 | 19.179 | ||||||
| 2025-09-25 | NP | DFSE - Dimensional Emerging Markets Sustainability Core 1 ETF | 10.400 | 0,00 | 201 | -5,21 | ||||
| 2026-02-12 | 13F | Banco BTG Pactual S.A. | 212.083 | 5.058 | ||||||
| 2025-11-12 | 13F | Park Square Financial Group, LLC | 0 | -100,00 | 0 | |||||
| 2026-01-26 | 13F | Whittier Trust Co Of Nevada Inc | 8.668 | 210 | ||||||
| 2026-02-02 | 13F | Nkcfo Llc | 6.178 | -67,48 | 0 | |||||
| 2026-02-12 | 13F | Rossby Financial, LCC | 7.873 | -0,82 | 188 | -4,10 | ||||
| 2025-09-25 | NP | DFEM - Dimensional Emerging Markets Core Equity 2 ETF | 129.358 | 4,95 | 2.494 | -0,44 | ||||
| 2026-01-12 | 13F | Kozak & Associates, Inc. | 439 | 2,81 | 11 | -9,09 | ||||
| 2025-11-14 | 13F | Point72 (DIFC) Ltd | 314 | 8 | ||||||
| 2026-02-05 | 13F | LGT Group Foundation | 12.675 | 306 | ||||||
| 2025-11-07 | 13F | Sierra Ocean, Llc | 0 | -100,00 | 0 | |||||
| 2026-02-17 | 13F | Bank Of America Corp /de/ | 2.276.326 | 231,10 | 54.290 | 217,28 | ||||
| 2026-01-28 | 13F | CAPROCK Group, Inc. | 9.389 | -0,02 | 228 | 7,55 | ||||
| 2026-02-13 | 13F | Squarepoint Ops LLC | 40.626 | 969 | ||||||
| 2026-02-13 | 13F | JustInvest LLC | 37.355 | 18,40 | 891 | 13,38 | ||||
| 2026-02-06 | 13F | Abn Amro Investment Solutions | 216.467 | 5.163 | ||||||
| 2026-02-11 | 13F | RWC Asset Management LLP | 28.250 | 2,96 | 674 | -1,32 | ||||
| 2026-02-12 | 13F | Commonwealth Equity Services, Llc | 59.378 | -0,90 | 1.416 | 141.500,00 | ||||
| 2026-01-14 | 13F | Jfs Wealth Advisors, Llc | 263 | 3,14 | 6 | 0,00 | ||||
| 2026-01-27 | 13F | WealthCollab, LLC | 1.462 | 2,96 | 35 | -2,86 | ||||
| 2026-02-11 | 13F | Fox Run Management, L.l.c. | 16.890 | 403 | ||||||
| 2026-02-17 | 13F | Aqr Capital Management Llc | 39.436 | 42,95 | 941 | 37,03 | ||||
| 2026-01-23 | 13F | Westside Investment Management, Inc. | 78 | 2 | ||||||
| 2026-02-17 | 13F | Two Sigma Advisers, Lp | 0 | -100,00 | 0 |
Other Listings
| US:SBS | 30,01 $ |