Grundlæggende statistik
| Institutionelle aktier (lange) | 126.164.854 - 60,49% (ex 13D/G) - change of -54,13MM shares -30,02% MRQ |
| Institutionel værdi (lang) | $ 3.287.195 USD ($1000) |
Institutionelt ejerskab og aktionærer
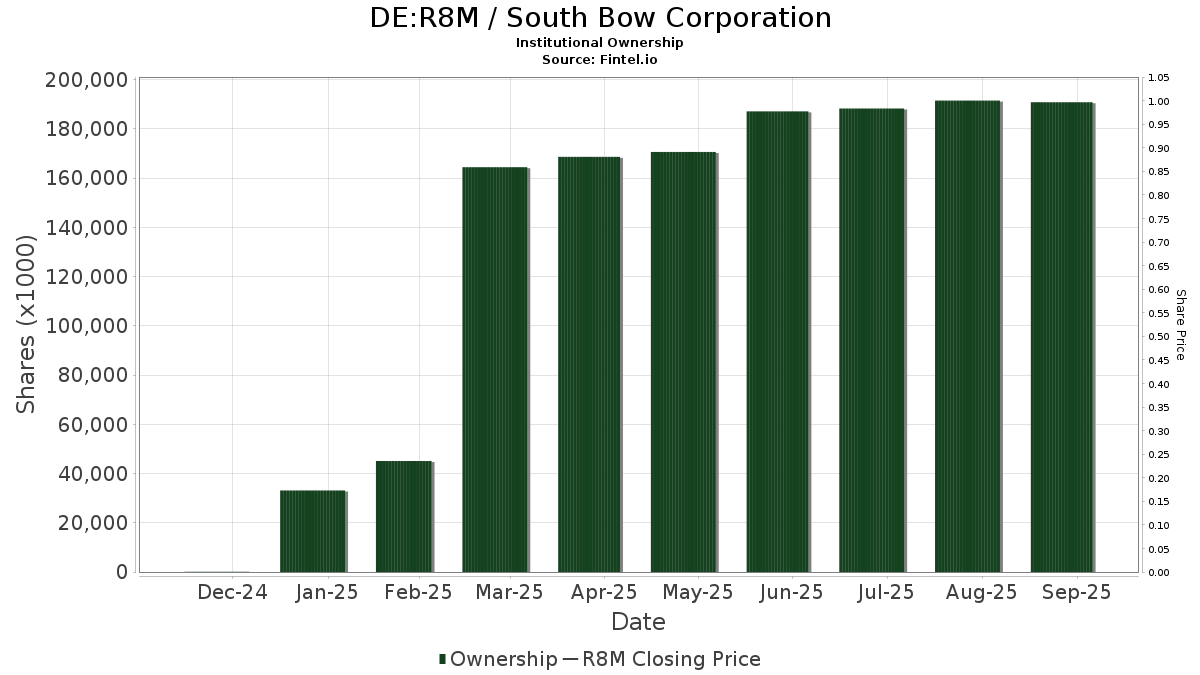
South Bow Corporation (DE:R8M) har 284 institutionelle ejere og aktionærer, der har indsendt 13D/G- eller 13F-formularer til Securities Exchange Commission (SEC). Disse institutioner har i alt 126,164,854 aktier. Største aktionærer omfatter Royal Bank Of Canada, Capital International Investors, Fmr Llc, Vanguard Group Inc, Clearbridge Investments, LLC, Price T Rowe Associates Inc /md/, Bank Of Montreal /can/, CIBC World Markets Inc., Thornburg Investment Management Inc, and MIRAE ASSET GLOBAL ETFS HOLDINGS Ltd. .
South Bow Corporation (DB:R8M) institutionel ejerskabsstruktur viser aktuelle positioner i virksomheden efter institutioner og fonde, samt seneste ændringer i positionsstørrelse. Større aktionærer kan omfatte individuelle investorer, investeringsforeninger, hedgefonde eller institutioner. Skema 13D angiver, at investoren besidder (eller besidder) mere end 5 % af virksomheden og har til hensigt (eller har til hensigt at) aktivt at forfølge en ændring i forretningsstrategi. Skema 13G indikerer en passiv investering på over 5%.
Fondens stemningsscore
Fund Sentiment Score (fka Ownership Accumulation Score) finder de aktier, der bliver mest købt af fonde. Det er resultatet af en sofistikeret, multi-faktor kvantitativ model, der identificerer virksomheder med de højeste niveauer af institutionel akkumulering. Scoringsmodellen bruger en kombination af den samlede stigning i oplyste ejere, ændringerne i porteføljeallokeringer i disse ejere og andre målinger. Tallet går fra 0 til 100, hvor højere tal indikerer et højere niveau af akkumulering for sine jævnaldrende, og 50 er gennemsnittet.
Opdateringsfrekvens: Dagligt
Se Ownership Explorer, som giver en liste over højest rangerende virksomheder.
AI+ Ask Fintel’s AI assistant about South Bow Corporation.
Select a question to share a public post with an AI-crafted answer.
Thinking of good questions…
13F og NPORT arkivering
Detaljer om 13F-arkivering er gratis. Detaljer om NP-ansøgninger kræver et premium-medlemskab. Grønne rækker angiver nye positioner. Røde rækker angiver lukkede positioner. Klik på linket ikon for at se den fulde transaktionshistorik.
Opgrader
for at låse premium-data op og eksportere til Excel ![]() .
.
| Fil dato | Kilde | Investor | Type | Gennemsnitlig pris (Øst) |
Aktier | Δ Aktier (%) |
Rapporteret Værdi ($1000) |
Δ Værdi (%) |
Port Alloc (%) |
|
|---|---|---|---|---|---|---|---|---|---|---|
| 2026-02-17 | 13F | SIG North Trading, ULC | Call | 157.800 | -20,94 | 4.335 | -23,24 | |||
| 2026-02-13 | 13F | Gts Securities Llc | 8.928 | 245 | ||||||
| 2026-02-17 | 13F | Quantinno Capital Management LP | 13.011 | 19,48 | 358 | 15,91 | ||||
| 2026-02-17 | 13F | Northern Trust Corp | 98.697 | -9,91 | 2.711 | -12,52 | ||||
| 2025-11-14 | 13F | Credit Agricole S A | 0 | -100,00 | 0 | -100,00 | ||||
| 2026-01-30 | 13F | Archer Investment Corp | 265 | 0,00 | 7 | 0,00 | ||||
| 2026-02-17 | 13F | Creative Planning | 27.332 | -3,02 | 751 | -5,90 | ||||
| 2026-02-17 | 13F | Advisor Group Holdings, Inc. | 8.511 | -1,61 | 234 | -2,50 | ||||
| 2026-02-12 | 13F | BRYN MAWR TRUST Co | 603 | 0,00 | 17 | -5,88 | ||||
| 2026-02-12 | 13F | SWAN Capital LLC | 0 | -100,00 | 0 | |||||
| 2025-11-14 | 13F | Zimmer Partners, LP | 0 | -100,00 | 0 | -100,00 | ||||
| 2025-11-14 | 13F | Corigliano Investment Advisers, LLC | 0 | -100,00 | 0 | -100,00 | ||||
| 2026-01-30 | 13F | Caldwell Securities, Inc | 31 | 0,00 | 1 | |||||
| 2026-02-17 | 13F | SIG North Trading, ULC | 53.498 | 1.470 | ||||||
| 2025-11-14 | 13F | Ameriprise Financial Inc | 0 | -100,00 | 0 | -100,00 | ||||
| 2026-02-06 | 13F | Larson Financial Group LLC | 300 | 125,56 | 8 | 166,67 | ||||
| 2026-02-17 | 13F | SIG North Trading, ULC | Put | 59.900 | 4,54 | 1.645 | 1,48 | |||
| 2026-02-13 | 13F | Squarepoint Ops LLC | 11.776 | 323 | ||||||
| 2026-01-12 | 13F | Rialto Wealth Management, LLC | 31 | 0,00 | 1 | |||||
| 2026-02-17 | 13F | Alliancebernstein L.p. | 29.793 | 0,04 | 818 | -2,85 | ||||
| 2026-02-17 | 13F | Citadel Advisors Llc | 700.200 | 2.954,84 | 19.234 | 2.868,21 | ||||
| 2026-01-20 | 13F | Cromwell Holdings LLC | 0 | -100,00 | 0 | |||||
| 2026-01-29 | 13F | Camelot Portfolios, LLC | 206 | 6 | ||||||
| 2026-02-09 | 13F | Legal & General Group Plc | 1.855.728 | -9,63 | 51.106 | -12,07 | ||||
| 2026-01-09 | 13F | Pacifica Partners Inc. | 285 | 0,00 | 8 | 0,00 | ||||
| 2026-02-04 | 13F | Heronetta Management, L.P. | 46.497 | 0,00 | 1.733 | -4,10 | ||||
| 2026-01-15 | 13F | Spirit Of America Management Corp/ny | 13.765 | -6,77 | 378 | -9,35 | ||||
| 2026-02-13 | 13F | MAI Capital Management | 325 | -10,47 | 9 | -20,00 | ||||
| 2026-02-09 | 13F | Mondrian Investment Partners LTD | 3.597 | 0,00 | 136 | -4,26 | ||||
| 2026-02-10 | 13F | CIBC World Markets Inc. | 3.571.092 | 11,79 | 98.241 | 8,70 | ||||
| 2026-02-12 | 13F | Nuveen, LLC | 155.622 | 0,00 | 4.286 | -2,70 | ||||
| 2026-01-21 | 13F | Hartford Financial Management Inc. | 98 | 0,00 | 3 | 0,00 | ||||
| 2026-02-13 | 13F | Rhumbline Advisers | 1.020 | 0,00 | 28 | 0,00 | ||||
| 2026-02-17 | 13F | Susquehanna International Group, Llp | Put | 0 | -100,00 | 0 | ||||
| 2026-01-27 | 13F | Duncker Streett & Co Inc | 80 | 0,00 | 2 | 0,00 | ||||
| 2026-02-11 | 13F | Capital Group Private Client Services, Inc. | 106.354 | -9,34 | 2.925 | -11,87 | ||||
| 2026-01-30 | 13F | Us Bancorp \de\ | 6.397 | -5,12 | 176 | -7,89 | ||||
| 2026-01-15 | 13F | Hara Capital LLC | 63 | 0,00 | 2 | 0,00 | ||||
| 2026-01-23 | 13F | Smallwood Wealth Investment Management, LLC | 97 | 0,00 | 3 | 0,00 | ||||
| 2025-11-07 | 13F | Beacon Capital Management, LLC | 0 | -100,00 | 0 | |||||
| 2026-02-24 | 13F | Bell Investment Advisors, Inc | 27 | 1.250,00 | 1 | |||||
| 2026-01-13 | 13F | Mather Group, Llc. | 0 | -100,00 | 0 | |||||
| 2026-01-15 | 13F | apricus wealth, LLC | 14.580 | 10,92 | 401 | 7,82 | ||||
| 2026-02-11 | 13F | Parallel Advisors, LLC | 353 | 1,73 | 10 | 0,00 | ||||
| 2026-02-13 | 13F | Toroso Investments, LLC | 22.033 | 64,59 | 605 | 60,05 | ||||
| 2026-01-28 | 13F | Gold Investment Management Ltd. | 176 | -18,89 | 5 | -33,33 | ||||
| 2026-02-06 | 13F | EverSource Wealth Advisors, LLC | 1.062 | 0,66 | 29 | 0,00 | ||||
| 2026-02-06 | 13F | Americana Partners, LLC | 0 | -100,00 | 0 | |||||
| 2026-02-11 | 13F | Capital International Investors | 15.483.085 | 0,62 | 425.840 | -2,20 | ||||
| 2026-01-26 | 13F | Harbor Asset Planning, Inc. | 176 | 0,00 | 5 | 0,00 | ||||
| 2026-01-07 | 13F | Hilltop National Bank | 131 | 0,00 | 4 | 0,00 | ||||
| 2026-01-29 | 13F | Pictet Asset Management Holding SA | 49.916 | -91,66 | 1.375 | -91,89 | ||||
| 2026-02-19 | 13F | Invesco Ltd. | 1.523.169 | 1,08 | 41.841 | -1,85 | ||||
| 2026-02-13 | 13F | Bollard Group LLC | 416 | 0,00 | 0 | |||||
| 2026-01-22 | 13F | Vision Financial Markets Llc | 570 | 0,00 | 16 | -6,25 | ||||
| 2026-02-12 | 13F | Swiss National Bank | 412.320 | 1,28 | 11.363 | -1,40 | ||||
| 2025-11-14 | 13F | Infrastructure Capital Advisors, Llc | 0 | -100,00 | 0 | |||||
| 2026-02-13 | 13F | Macquarie Group Ltd | 0 | -100,00 | 0 | |||||
| 2026-01-15 | 13F | Fortitude Family Office, LLC | 2 | 0,00 | 0 | |||||
| 2026-02-11 | 13F | Clearbridge Investments, LLC | 7.262.965 | 2,98 | 199.514 | -0,01 | ||||
| 2026-02-11 | 13F | O'shaughnessy Asset Management, Llc | 0 | -100,00 | 0 | |||||
| 2026-02-13 | 13F | Y-Intercept (Hong Kong) Ltd | 0 | -100,00 | 0 | |||||
| 2026-02-17 | 13F | MIRAE ASSET GLOBAL ETFS HOLDINGS Ltd. | 2.391.584 | 9,78 | 65.697 | 6,59 | ||||
| 2025-11-10 | 13F | Alerus Financial Na | 0 | -100,00 | 0 | -100,00 | ||||
| 2026-02-24 | 13F/A | Pacer Advisors, Inc. | 75.155 | 2.065 | ||||||
| 2026-02-13 | 13F | Ubs Asset Management Americas Inc | 135 | 4 | ||||||
| 2026-02-02 | 13F | Millstone Evans Group, LLC | 19 | 0,00 | 1 | |||||
| 2026-02-13 | 13F | 1832 Asset Management L.P. | 98.363 | 0,14 | 2.702 | -2,74 | ||||
| 2026-02-13 | 13F | Recurrent Investment Advisors LLC | 1.370.635 | -14,65 | 37.787 | -17,09 | ||||
| 2026-02-05 | 13F | Td Private Client Wealth Llc | 8 | 0 | ||||||
| 2026-02-10 | 13F | Godfrey Financial Associates, Inc. | 4 | 0 | ||||||
| 2026-02-11 | 13F | Picton Mahoney Asset Management | 29.522 | 96,68 | 813 | |||||
| 2026-01-22 | 13F | Pinnacle Bancorp, Inc. | 50 | 0,00 | 1 | 0,00 | ||||
| 2026-02-13 | 13F | Natixis | 1.468 | 0,00 | 42 | 0,00 | ||||
| 2026-02-04 | 13F | Atlantic Union Bankshares Corp | 100 | 3 | ||||||
| 2026-02-12 | 13F | BlackRock, Inc. | 279.356 | 49,20 | 7.674 | 44,88 | ||||
| 2026-02-18 | 13F | Mackenzie Financial Corp | 463.475 | 61,79 | 13.127 | 61,99 | ||||
| 2026-02-17 | 13F | Basso Capital Management, L.p. | 2.674 | 0,00 | 73 | -2,67 | ||||
| 2026-02-17 | 13F | D. E. Shaw & Co., Inc. | 9.227 | -97,32 | 254 | -97,40 | ||||
| 2026-02-17 | 13F | D. E. Shaw & Co., Inc. | Put | 140.000 | 0,00 | 3.851 | -2,78 | |||
| 2026-02-17 | 13F | Murchinson Ltd. | Put | 1.467.400 | 40.309 | |||||
| 2026-02-18 | 13F | Vident Advisory, LLC | 55.465 | -4,82 | 1.527 | -7,40 | ||||
| 2026-01-27 | 13F | Zurcher Kantonalbank (Zurich Cantonalbank) | 44.490 | 11,81 | 1.225 | 8,79 | ||||
| 2026-02-10 | 13F | CIBC Asset Management Inc | 315.155 | 0,83 | 8.673 | -1,82 | ||||
| 2025-11-14 | 13F | Sofos Investments, Inc. | 0 | -100,00 | 0 | |||||
| 2026-01-20 | 13F | Wall Street Access Asset Management, LLC | 1.870 | 51 | ||||||
| 2026-02-12 | 13F | Colonial Trust Co / SC | 260 | 333,33 | 7 | 600,00 | ||||
| 2026-02-17 | 13F | Aquatic Capital Management LLC | 37.793 | 1.038 | ||||||
| 2026-02-10 | 13F/A | Northwestern Mutual Wealth Management Co | 1.449 | 8,13 | 40 | 5,41 | ||||
| 2026-01-21 | 13F | Steadtrust LLC | 34.320 | -0,49 | 943 | -3,38 | ||||
| 2026-02-13 | 13F | Alberta Investment Management Corp | 77.528 | -57,41 | 2.132 | -58,59 | ||||
| 2025-11-14 | 13F | Citadel Advisors Llc | Put | 0 | -100,00 | 0 | -100,00 | |||
| 2026-02-17 | 13F | Toronto Dominion Bank | 1.194.847 | 71,73 | 32.864 | 67,03 | ||||
| 2026-02-17 | 13F | Toronto Dominion Bank | Call | 244.200 | -4,87 | 6.717 | -7,52 | |||
| 2026-02-05 | 13F | Cardinal Point Capital Management, ULC | 18.907 | -2,88 | 521 | -5,45 | ||||
| 2026-02-17 | 13F | Toronto Dominion Bank | Put | 8.700 | -7,45 | 239 | -9,81 | |||
| 2026-02-10 | 13F | Catalyst Capital Advisors LLC | 161.679 | -20,73 | 4.441 | -23,03 | ||||
| 2026-02-13 | 13F | Healthcare Of Ontario Pension Plan Trust Fund | 0 | -100,00 | 0 | |||||
| 2026-01-07 | 13F | Massmutual Trust Co Fsb/adv | 244 | -2,79 | 7 | -14,29 | ||||
| 2026-02-12 | 13F | Alps Advisors Inc | 41.498 | 31,35 | 1.140 | 27,55 | ||||
| 2025-11-12 | 13F | K.J. Harrison & Partners Inc | 0 | -100,00 | 0 | -100,00 | ||||
| 2025-11-19 | 13F/A | Danske Bank A/s | 0 | -100,00 | 0 | |||||
| 2026-01-14 | 13F | Spire Wealth Management | 440 | -20,43 | 12 | -20,00 | ||||
| 2026-02-12 | 13F | Dividend Asset Capital, Llc | 11.686 | -4,36 | 321 | -6,96 | ||||
| 2026-02-17 | 13F | Wiley Bros.-aintree Capital, Llc | 67.030 | 402,47 | 1.849 | 390,19 | ||||
| 2026-01-15 | 13F | Lodestone Wealth Management LLC | 8 | 0 | ||||||
| 2026-02-17 | 13F | FIL Ltd | 293.627 | 8,50 | 8.076 | 5,46 | ||||
| 2025-10-21 | 13F | Galibier Capital Management Ltd. | 363 | 0,00 | 10 | 11,11 | ||||
| 2026-02-12 | 13F | Federation des caisses Desjardins du Quebec | 306.731 | -0,24 | 8.429 | -2,23 | ||||
| 2026-02-14 | 13F | Rockefeller Capital Management L.P. | 1.247 | -6,66 | 34 | -8,11 | ||||
| 2026-02-17 | 13F | Voloridge Investment Management, Llc | 0 | -100,00 | 0 | |||||
| 2026-02-17 | 13F | XTX Topco Ltd | 32.446 | -38,49 | 891 | -40,28 | ||||
| 2026-01-12 | 13F | Kozak & Associates, Inc. | 2 | -97,83 | 0 | -100,00 | ||||
| 2026-02-02 | 13F | Mutual Advisors, LLC | 17.071 | -28,61 | 469 | -25,60 | ||||
| 2026-02-17 | 13F | Guardian Partners Inc. | 13.961 | -2,47 | 399 | -0,75 | ||||
| 2026-01-29 | 13F | Vanguard Group Inc | 8.667.365 | 1,38 | 238.387 | -1,46 | ||||
| 2026-02-12 | 13F | Brown Brothers Harriman & Co | 93 | 304,35 | 3 | |||||
| 2026-02-11 | 13F | Jpmorgan Chase & Co | 57.607 | -51,59 | 1.582 | -53,00 | ||||
| 2026-02-13 | 13F | Sovereign Investment Advisors, LLC | 10.513 | -4,85 | 295 | -5,77 | ||||
| 2026-02-13 | 13F | Aviso Financial Inc. | 0 | -100,00 | 0 | |||||
| 2026-02-17 | 13F | Schonfeld Strategic Advisors LLC | 23.975 | -37,62 | 659 | -39,47 | ||||
| 2026-02-05 | 13F | Tucker Asset Management Llc | 3 | 0 | ||||||
| 2026-02-10 | 13F | Connor, Clark & Lunn Investment Management Ltd. | 1.612.433 | 44,14 | 44.349 | 40,14 | ||||
| 2026-02-13 | 13F | Van Eck Associates Corp | 137.289 | 4,45 | 4 | 0,00 | ||||
| 2026-02-11 | 13F | Metis Global Partners, LLC | 21.184 | 19,27 | 583 | 15,94 | ||||
| 2026-02-17 | 13F | Brevan Howard Capital Management LP | 0 | -100,00 | 0 | |||||
| 2026-01-26 | 13F | JNBA Financial Advisors | 31 | 0,00 | 1 | |||||
| 2026-02-11 | 13F | LPL Financial LLC | 38.499 | 1,62 | 1.058 | -1,31 | ||||
| 2026-02-17 | 13F | Quadrature Capital Ltd | 141.500 | -69,70 | 3.897 | -70,52 | ||||
| 2026-01-05 | 13F | GAMMA Investing LLC | 27 | 0,00 | 1 | |||||
| 2026-02-05 | 13F | Heathbridge Capital Management Ltd. | 419.950 | 104,06 | 11.566 | 98,71 | ||||
| 2026-02-17 | 13F | Citadel Advisors Llc | Call | 0 | -100,00 | 0 | ||||
| 2026-02-17 | 13F | Rakuten Investment Management, Inc. | 0 | -100,00 | 0 | |||||
| 2026-02-13 | 13F | Diametric Capital, LP | 0 | -100,00 | 0 | |||||
| 2026-02-17 | 13F | Royal Bank Of Canada | 16.592.199 | -26,54 | 455.787 | -28,67 | ||||
| 2026-01-21 | 13F | Sound Income Strategies, LLC | 20 | 0,00 | 1 | |||||
| 2026-02-17 | 13F | Cetera Investment Advisers | 19.119 | 46,38 | 526 | 42,55 | ||||
| 2025-11-10 | 13F | Colonial Trust Advisors | 0 | -100,00 | 0 | -100,00 | ||||
| 2026-02-02 | 13F | Cornerstone Planning Group LLC | 22 | -99,15 | 1 | -100,00 | ||||
| 2025-11-13 | 13F | Prudential Financial Inc | 0 | -100,00 | 0 | -100,00 | ||||
| 2026-01-08 | 13F | Versant Capital Management, Inc | 141 | 0,00 | 4 | 0,00 | ||||
| 2026-02-13 | 13F | Thornburg Investment Management Inc | 2.829.875 | 41,68 | 77.840 | 37,76 | ||||
| 2026-02-17 | 13F | Canada Pension Plan Investment Board | 1.650.000 | 23,60 | 45.382 | 20,16 | ||||
| 2025-11-14 | 13F | Murchinson Ltd. | 0 | -100,00 | 0 | -100,00 | ||||
| 2026-02-04 | 13F | Swiss Life Asset Management Ltd | 9.625 | 0,00 | 265 | -2,94 | ||||
| 2026-02-13 | 13F | Pin Oak Investment Advisors Inc | 52 | 0,00 | 0 | -100,00 | ||||
| 2026-01-22 | 13F | Kennebec Savings Bank | 20 | 0,00 | 1 | |||||
| 2026-01-27 | 13F | First Horizon Corp | 130 | -10,34 | 4 | -25,00 | ||||
| 2026-02-02 | 13F | Triasima Portfolio Management inc. | 118.400 | 5,16 | 3.261 | 2,32 | ||||
| 2026-02-13 | 13F | Manufacturers Life Insurance Company, The | 0 | -100,00 | 0 | |||||
| 2026-01-29 | 13F | UBS Group AG | 125.364 | 6,26 | 3.444 | 3,18 | ||||
| 2026-02-13 | 13F | Ingalls & Snyder Llc | 0 | -100,00 | 0 | |||||
| 2026-02-06 | 13F | FourThought Financial Partners, LLC | 0 | -100,00 | 0 | |||||
| 2026-02-11 | 13F | Manchester Capital Management LLC | 86 | 2 | ||||||
| 2026-02-13 | 13F | Morgan Stanley | 1.511.797 | -2,40 | 41.529 | -5,23 | ||||
| 2026-02-10 | 13F | Quantbot Technologies LP | 71.811 | -26,09 | 1.973 | -28,24 | ||||
| 2026-02-13 | 13F | Meixler Investment Management, Ltd. | 0 | -100,00 | 0 | -100,00 | ||||
| 2026-01-14 | 13F | Eastern Bank | 700 | 0,00 | 19 | 0,00 | ||||
| 2026-02-10 | 13F | Bnp Paribas Arbitrage, Sa | 0 | -100,00 | 0 | |||||
| 2026-02-17 | 13F | Two Sigma Investments, Lp | 765.932 | -0,65 | 21.040 | -3,53 | ||||
| 2026-02-13 | 13F | Boston Partners | 1.311.881 | -1,39 | 35.845 | -4,91 | ||||
| 2026-01-22 | 13F | HHM Wealth Advisors, LLC | 52 | 0,00 | 1 | 0,00 | ||||
| 2026-02-17 | 13F | Silvercrest Asset Management Group Llc | 25.260 | -6,90 | 694 | -9,65 | ||||
| 2026-02-02 | 13F | Fifth Third Bancorp | 0 | -100,00 | 0 | |||||
| 2026-02-06 | 13F | GPS Wealth Strategies Group, LLC | 0 | -100,00 | 0 | |||||
| 2026-02-10 | 13F | Manitou Investment Management Ltd. | 1.700 | 0,00 | 47 | -4,17 | ||||
| 2026-02-13 | 13F | Marshall Wace, Llp | 0 | -100,00 | 0 | |||||
| 2026-02-17 | 13F | Greenline Partners, LLC | 49.867 | -0,43 | 1.370 | -3,32 | ||||
| 2025-11-12 | 13F | Simplex Trading, Llc | 0 | -100,00 | 0 | |||||
| 2026-02-11 | 13F | Gilpin Wealth Management, Llc | 402 | 11 | ||||||
| 2026-02-13 | 13F | Aigen Investment Management, Lp | 0 | -100,00 | 0 | |||||
| 2026-01-14 | 13F | ORG Partners LLC | 7 | 0,00 | 0 | |||||
| 2026-01-26 | 13F | Dakota Community Bank & Trust NA | 0 | -100,00 | 0 | |||||
| 2026-02-11 | 13F | Fiera Capital Corp | 10.842 | -12,82 | 298 | -15,10 | ||||
| 2025-11-17 | 13F | PDT Partners, LLC | 0 | -100,00 | 0 | |||||
| 2026-02-12 | 13F | Steward Partners Investment Advisory, Llc | 289 | 0,00 | 8 | -12,50 | ||||
| 2026-01-09 | 13F | Park Place Capital Corp | 6 | 0,00 | 0 | |||||
| 2026-02-17 | 13F | Tower Research Capital LLC (TRC) | 787 | 91,48 | 22 | 90,91 | ||||
| 2026-01-12 | 13F | Seacrest Wealth Management, Llc | 15.907 | 75,34 | 415 | 61,48 | ||||
| 2026-02-06 | 13F | Pnc Financial Services Group, Inc. | 6.426 | -1,68 | 177 | -4,35 | ||||
| 2025-10-30 | 13F | Jennison Associates Llc | 0 | -100,00 | 0 | |||||
| 2026-02-24 | 13F | Chelsea Counsel Co | 8.630 | 0,00 | 240 | -2,83 | ||||
| 2026-02-03 | 13F | SBI Securities Co., Ltd. | 246 | 18,84 | 7 | 20,00 | ||||
| 2026-02-05 | 13F | 1620 Investment Advisors, Inc. | 160 | 0,00 | 4 | 0,00 | ||||
| 2025-10-27 | 13F | Canal Insurance CO | 0 | -100,00 | 0 | |||||
| 2025-11-04 | 13F | Guerra Advisors Inc | 2 | 0 | ||||||
| 2026-02-09 | 13F | Key FInancial Inc | 4 | 0,00 | 0 | |||||
| 2026-02-17 | 13F | Qube Research & Technologies Ltd | 532.722 | -32,10 | 14.634 | -34,07 | ||||
| 2026-01-16 | 13F | Crewe Advisors LLC | 2 | 0 | ||||||
| 2026-02-17 | 13F | Trexquant Investment LP | 99.351 | -36,98 | 2.729 | -38,80 | ||||
| 2026-02-17 | 13F | Investment Management Corp of Ontario | 37.341 | 91,32 | 1.026 | 85,69 | ||||
| 2026-02-03 | 13F | Fulcrum Asset Management LLP | 88 | 23 | ||||||
| 2026-02-12 | 13F | Jane Street Group, Llc | 46.495 | -85,17 | 1.279 | -85,58 | ||||
| 2026-02-23 | 13F | Virtu Financial LLC | 0 | -100,00 | 0 | |||||
| 2026-02-06 | 13F | ProShare Advisors LLC | 23.767 | 5,88 | 654 | 2,83 | ||||
| 2026-02-05 | 13F | Allworth Financial LP | 294 | -5,16 | 8 | 0,00 | ||||
| 2026-02-13 | 13F | Bank Of Nova Scotia | 385.197 | 53,44 | 10.594 | 49,11 | ||||
| 2026-02-11 | 13F | CNB Bank | 181 | -26,12 | 5 | -33,33 | ||||
| 2026-02-13 | 13F | Wells Fargo & Company/mn | 23.515 | 58,17 | 647 | 54,05 | ||||
| 2026-02-17 | 13F | Susquehanna International Group, Llp | Call | 13.700 | -94,56 | 376 | -94,72 | |||
| 2026-02-26 | 13F | Anchor Investment Management, LLC | 20 | 0,00 | 1 | |||||
| 2026-03-03 | 13F/A | Caitong International Asset Management Co., Ltd | 0 | -100,00 | 0 | |||||
| 2026-01-12 | 13F | CVA Family Office, LLC | 17 | 0,00 | 0 | |||||
| 2026-02-09 | 13F | Harbour Investments, Inc. | 416 | 0,24 | 11 | 0,00 | ||||
| 2026-02-13 | 13F | JustInvest LLC | 27.391 | 37,91 | 752 | 33,57 | ||||
| 2026-01-13 | 13F | Ausbil Investment Management Ltd | 106.483 | 0,00 | 2.933 | -1,58 | ||||
| 2026-01-26 | 13F | Lipe & Dalton | 10.074 | -1,52 | 0 | |||||
| 2026-02-02 | 13F | Principal Financial Group Inc | 30.954 | 8,79 | 852 | 5,84 | ||||
| 2026-02-02 | 13F | Oppenheimer & Co Inc | 37.858 | -4,39 | 1.040 | -7,23 | ||||
| 2025-11-12 | 13F | 111 Capital | 22.787 | 10,93 | 644 | 20,83 | ||||
| 2026-02-13 | 13F | Towarzystwo Funduszy Inwestycyjnych Pzu Sa | 0 | -100,00 | 0 | |||||
| 2026-01-30 | 13F | Bogart Wealth, LLC | 228 | 0,00 | 6 | 0,00 | ||||
| 2026-02-06 | 13F | IFP Advisors, Inc | 1.267 | 5,06 | 35 | 0,00 | ||||
| 2026-01-20 | 13F | YANKCOM Partnership | 0 | -100,00 | 0 | |||||
| 2026-01-05 | 13F | Roxbury Financial LLC | 1.152 | 0,17 | 32 | -3,12 | ||||
| 2026-01-22 | 13F | Bartlett & Co. Wealth Management Llc | 222 | 0,00 | 6 | 0,00 | ||||
| 2026-02-12 | 13F | Renaissance Technologies Llc | 0 | -100,00 | 0 | |||||
| 2026-02-11 | 13F | Hilton Head Capital Partners, LLC | 32 | 1 | ||||||
| 2026-02-13 | 13F | Beutel, Goodman & Co Ltd. | 10 | 0,00 | 0 | |||||
| 2026-01-27 | 13F | Miller Howard Investments Inc /ny | 798.348 | 4,63 | 21.931 | 1,60 | ||||
| 2026-02-11 | 13F | Franklin Resources Inc | 132.887 | 9,78 | 3.655 | 6,72 | ||||
| 2026-02-12 | 13F | Commonwealth Equity Services, Llc | 71.693 | 0,92 | 1.969 | 98.350,00 | ||||
| 2026-02-03 | 13F | CGC Financial Services, LLC | 57 | 0,00 | 2 | 0,00 | ||||
| 2026-02-13 | 13F | Entropy Technologies, LP | 0 | -100,00 | 0 | |||||
| 2025-10-31 | 13F | Whittier Trust Co Of Nevada Inc | 0 | -100,00 | 0 | |||||
| 2026-02-11 | 13F | Capital International Ltd /ca/ | 66.555 | 20,10 | 1.831 | 16,71 | ||||
| 2026-02-12 | 13F | Northwest & Ethical Investments L.P. | 24.990 | 37,38 | 687 | 33,66 | ||||
| 2026-02-13 | 13F | Barclays Plc | 748.859 | -3,80 | 20.571 | -6,58 | ||||
| 2026-02-17 | 13F | Tcw Group Inc | 123.700 | 0,00 | 3.398 | -2,89 | ||||
| 2025-10-15 | 13F | Atwood & Palmer Inc | 0 | -100,00 | 0 | |||||
| 2026-01-08 | 13F | Sl Advisors, Llc | 21.336 | 586 | ||||||
| 2026-02-06 | 13F | Global Retirement Partners, LLC | 280 | -9,68 | 8 | -12,50 | ||||
| 2026-02-10 | 13F | Moors & Cabot, Inc. | 124.151 | 1,39 | 3.410 | -1,56 | ||||
| 2026-02-11 | 13F | Capital Group Investment Management Pte. Ltd. | 15.099 | 14,54 | 416 | 11,26 | ||||
| 2026-02-17 | 13F | Kelly Lawrence W & Associates Inc/ca | 0 | -100,00 | 0 | |||||
| 2026-02-12 | 13F | Wealthspire Advisors, LLC | 0 | -100,00 | 0 | |||||
| 2026-01-16 | 13F | Ronald Blue Trust, Inc. | 44 | -90,18 | 1 | -91,67 | ||||
| 2026-01-23 | 13F | Avion Wealth | 16 | 0,00 | 0 | |||||
| 2026-02-12 | 13F | Scotia Capital Inc. | 2.053.500 | 14,26 | 56.402 | 11,94 | ||||
| 2025-11-07 | 13F | Sierra Ocean, Llc | 0 | -100,00 | 0 | |||||
| 2026-02-09 | 13F | Geode Capital Management, Llc | 692.541 | 238,42 | 19.131 | 228,99 | ||||
| 2025-11-07 | 13F | Shell Asset Management Co | 3.154 | -72,25 | 0 | |||||
| 2026-01-14 | 13F | Exchange Traded Concepts, Llc | 178.575 | -14,74 | 4.905 | -17,22 | ||||
| 2025-11-14 | 13F | Capstone Investment Advisors, Llc | 37.116 | 1.050 | ||||||
| 2026-02-11 | 13F | Deutsche Bank Ag\ | 103.476 | 3,05 | 2.842 | 0,07 | ||||
| 2026-02-17 | 13F | Advisory Services Network, LLC | 0 | -100,00 | 0 | -100,00 | ||||
| 2026-02-13 | 13F | Brookfield Asset Management Inc. | 1.212.156 | -6,77 | 33.298 | -9,47 | ||||
| 2026-01-20 | 13F | Signaturefd, Llc | 1.754 | -7,24 | 48 | -9,43 | ||||
| 2026-02-13 | 13F | BRITISH COLUMBIA INVESTMENT MANAGEMENT Corp | 110.620 | -8,84 | 3.043 | -11,36 | ||||
| 2026-01-23 | 13F | Farther Finance Advisors, LLC | 171 | -0,58 | 5 | 0,00 | ||||
| 2026-02-02 | 13F | CENTRAL TRUST Co | 2.057 | 0,00 | 57 | -3,45 | ||||
| 2026-02-17 | 13F | Russell Investments Group, Ltd. | 128.345 | 12,26 | 3.534 | 9,24 | ||||
| 2026-02-17 | 13F | Price T Rowe Associates Inc /md/ | 6.456.032 | -29,31 | 177 | -31,40 | ||||
| 2026-02-10 | 13F | Root Financial Partners, LLC | 20 | 1 | ||||||
| 2026-02-03 | 13F | Generali Asset Management SPA SGR | 990 | 5,88 | 37 | 2,78 | ||||
| 2026-02-12 | 13F | Advisors Asset Management, Inc. | 7.133 | -7,78 | 196 | -10,55 | ||||
| 2026-02-06 | 13F | HighTower Advisors, LLC | 70.328 | 3,63 | 1.932 | 0,63 | ||||
| 2026-01-16 | 13F | Louisbourg Investments Inc. | 1.195 | 0,00 | 33 | -3,03 | ||||
| 2026-02-12 | 13F | Portland Investment Counsel Inc. | 751.044 | 0,00 | 20.656 | -2,80 | ||||
| 2025-10-24 | 13F | Hemington Wealth Management | 79 | 0,00 | 0 | |||||
| 2026-01-14 | 13F | Jfs Wealth Advisors, Llc | 58 | 0,00 | 2 | 0,00 | ||||
| 2026-02-11 | 13F | Capital International Sarl | 145.403 | -0,47 | 4.003 | -3,19 | ||||
| 2026-02-13 | 13F | Golden State Wealth Management, LLC | 5 | -85,29 | 0 | |||||
| 2026-02-12 | 13F | Hrt Financial Lp | 15.689 | 0,19 | 0 | |||||
| 2026-02-04 | 13F | Ameritas Advisory Services, LLC | 0 | -100,00 | 0 | |||||
| 2026-02-10 | 13F | Rothschild Investment Llc | 38 | 0,00 | 1 | 0,00 | ||||
| 2026-02-10 | 13F | Bruce G. Allen Investments, LLC | 58 | 7,41 | 2 | 0,00 | ||||
| 2026-02-17 | 13F | Two Sigma Advisers, Lp | 253.100 | -39,09 | 6.953 | -40,85 | ||||
| 2025-11-14 | 13F | Jain Global LLC | 0 | -100,00 | 0 | |||||
| 2026-01-20 | 13F | Hanson & Doremus Investment Management | 226 | 0,00 | 0 | |||||
| 2026-01-22 | 13F | City Holding Co | 1.000 | 277,36 | 27 | 285,71 | ||||
| 2026-01-20 | 13F | AdvisorNet Financial, Inc | 120 | 0,84 | 3 | 0,00 | ||||
| 2026-01-27 | 13F | Godsey & Gibb Associates | 31 | 0,00 | 1 | |||||
| 2026-02-13 | 13F | Kestra Advisory Services, LLC | 2.209 | 61 | ||||||
| 2026-01-07 | 13F | Aventura Private Wealth, LLC | 246 | -13,99 | 7 | -25,00 | ||||
| 2026-02-10 | 13F | Private Wealth Asset Management, LLC | 0 | -100,00 | 0 | |||||
| 2026-01-23 | 13F | Assetmark, Inc | 1.259 | 1,78 | 35 | 0,00 | ||||
| 2026-02-10 | 13F | Td Asset Management Inc | 2.055.635 | 21,17 | 56.612 | 17,90 | ||||
| 2026-01-09 | 13F | SG Americas Securities, LLC | 0 | -100,00 | 0 | |||||
| 2026-02-17 | 13F | Engineers Gate Manager LP | 0 | -100,00 | 0 | |||||
| 2025-11-21 | 13F/A | Royal Bank Of Canada | Put | 0 | -100,00 | 0 | -100,00 | |||
| 2026-01-13 | 13F | Olistico Wealth, LLC | 280 | 8 | ||||||
| 2026-01-22 | 13F | JCIC Asset Management Inc. | 205 | -29,31 | 6 | -37,50 | ||||
| 2026-02-13 | 13F | Centiva Capital, LP | 18.862 | 518 | ||||||
| 2026-02-02 | 13F | Intact Investment Management Inc. | 964.360 | 19,61 | 26.522 | 16,24 | ||||
| 2026-02-17 | 13F | Tortoise Capital Advisors, L.l.c. | 942.091 | -0,08 | 25.879 | -2,97 | ||||
| 2026-02-13 | 13F | OMERS ADMINISTRATION Corp | 330.000 | 3.373,68 | 9.088 | 3.291,04 | ||||
| 2026-02-10 | 13F | Ritter Daniher Financial Advisory LLC / DE | 20 | 0,00 | 1 | |||||
| 2026-02-13 | 13F | Nfj Investment Group, Llc | 0 | 0 | ||||||
| 2026-01-08 | 13F | True Wealth Design, LLC | 5 | 0,00 | 0 | |||||
| 2026-01-27 | 13F | Cushing Asset Management, Lp | 1.490.500 | -2,61 | 40.944 | -5,43 | ||||
| 2026-02-10 | 13F | Envestnet Asset Management Inc | 71.510 | 219,84 | 1.964 | 210,76 | ||||
| 2026-02-17 | 13F | Millennium Management Llc | 240.475 | 440,43 | 6.606 | 425,04 | ||||
| 2026-02-11 | 13F | Allianz Asset Management GmbH | 18.258 | -17,20 | 503 | -19,55 | ||||
| 2026-02-12 | 13F | Principal Securities, Inc. | 0 | -100,00 | 0 | -100,00 | ||||
| 2026-02-17 | 13F | Agf Management Ltd | 26.914 | 0,65 | 740 | -2,12 | ||||
| 2026-02-12 | 13F | Quadrant Capital Group Llc | 3.051 | -0,91 | 84 | -4,60 | ||||
| 2026-01-12 | 13F | Salem Investment Counselors Inc | 0 | -100,00 | 0 | |||||
| 2026-02-17 | 13F | Raymond James Financial Inc | 55.319 | 0,55 | 1.520 | -2,38 | ||||
| 2026-01-30 | 13F | United Community Bank | 314 | 9 | ||||||
| 2026-02-17 | 13F | Maryland State Retirement & Pension System | 237.732 | -5,82 | 6.542 | -8,39 | ||||
| 2026-02-10 | 13F | Norges Bank | 893.176 | 24.566 | ||||||
| 2026-01-12 | 13F | Viking Fund Management Llc | 12.000 | 100,00 | 330 | 94,67 | ||||
| 2026-01-30 | 13F | Rogco, Lp | 100 | 0,00 | 3 | 0,00 | ||||
| 2026-02-20 | 13F | Sunbelt Securities, Inc. | 38 | -24,00 | 1 | 0,00 | ||||
| 2026-02-13 | 13F | Dynamic Technology Lab Private Ltd | 18.085 | 497 | ||||||
| 2026-02-19 | 13F | Mcguire Capital Advisors Inc | 15 | 0 | ||||||
| 2026-02-12 | 13F | CIBC Private Wealth Group, LLC | 1.718 | -20,46 | 47 | -22,95 | ||||
| 2026-02-13 | 13F | Bornite Capital Management LP | 0 | -100,00 | 0 | |||||
| 2026-01-26 | 13F | Main Street Group, LTD | 0 | -100,00 | 0 | |||||
| 2026-02-18 | 13F | GWM Advisors LLC | 238 | 1,71 | 7 | 0,00 | ||||
| 2026-02-17 | 13F | Fmr Llc | 10.082.858 | -26,15 | 277.314 | -28,22 | ||||
| 2026-01-26 | 13F | American Wealth Advisors, LLC | 14 | 0,00 | 0 | |||||
| 2026-02-11 | 13F | CenterBook Partners LP | 29.853 | 820 | ||||||
| 2026-02-13 | 13F | Smartleaf Asset Management LLC | 247 | 99,19 | 7 | 133,33 | ||||
| 2026-01-29 | 13F | UMA Financial Services, Inc. | 700 | 0,00 | 19 | 0,00 | ||||
| 2026-01-26 | 13F | Private Trust Co Na | 789 | 0,00 | 22 | -4,55 | ||||
| 2026-02-17 | 13F | Public Employees Retirement System Of Ohio | 66.718 | 8,60 | 1.837 | 5,70 | ||||
| 2026-02-10 | 13F | Goldman Sachs Group Inc | 1.050.023 | -54,29 | 28.844 | -55,61 | ||||
| 2026-02-12 | 13F | Bank Of Nova Scotia Trust Co | 23.600 | -0,59 | 648 | -3,43 | ||||
| 2026-02-17 | 13F | Jones Financial Companies Lllp | 18.960 | 22,05 | 521 | 18,45 | ||||
| 2026-01-26 | 13F | Asset Dedication, LLC | 12 | 0,00 | 0 | |||||
| 2026-02-10 | 13F | Arcadia Investment Management Corp/mi | 200 | 0,00 | 5 | 0,00 | ||||
| 2025-11-12 | 13F | Burgundy Asset Management Ltd. | 8.272 | 0,00 | 229 | 7,01 | ||||
| 2026-02-12 | 13F | Bank Of Montreal /can/ | Call | 100.000 | -20,00 | 2.750 | 8,27 | |||
| 2026-02-12 | 13F | Bank Of Montreal /can/ | 6.145.325 | -0,21 | 169.022 | 35,05 | ||||
| 2026-02-17 | 13F | Westwood Holdings Group Inc | 1.077.286 | 3,28 | 29.593 | 0,29 | ||||
| 2026-02-13 | 13F | National Bank Of Canada /fi/ | 696.794 | 34,44 | 18.994 | 31,74 | ||||
| 2026-01-27 | 13F | TD Waterhouse Canada Inc. | 1.336.103 | 7,55 | 36.700 | 6,01 | ||||
| 2026-02-13 | 13F | Gen-Wealth Partners Inc | 274 | 0,00 | 8 | 0,00 | ||||
| 2026-02-17 | 13F | Ninepoint Partners LP | 250.000 | -9,29 | 6.868 | -11,92 | ||||
| 2025-10-30 | 13F | Ridgewood Investments LLC | 0 | -100,00 | 0 | |||||
| 2026-02-09 | 13F | Hartland & Co., LLC | 2.150 | 192,52 | 59 | 195,00 | ||||
| 2026-02-10 | 13F | ESL Trust Services, LLC | 100 | 0,00 | 3 | 0,00 | ||||
| 2026-02-13 | 13F | Charles Schwab Investment Management Inc | 441.204 | -0,18 | 12.151 | -2,87 | ||||
| 2026-02-13 | 13F | Verition Fund Management LLC | 0 | -100,00 | 0 | |||||
| 2026-02-11 | 13F | Capital International Inc /ca/ | 31.473 | -14,30 | 866 | -16,75 | ||||
| 2026-02-17 | 13F | Scarborough Advisors, LLC | 10 | 0,00 | 0 | |||||
| 2026-02-13 | 13F | Pinnacle Wealth Planning Services, Inc. | 34 | 1 | ||||||
| 2026-02-13 | 13F | Neuberger Berman Group LLC | 25.923 | -74,98 | 714 | -75,68 | ||||
| 2026-02-17 | 13F | Blackstone Group Inc | 709.098 | -67,33 | 19.479 | -68,28 | ||||
| 2026-02-09 | 13F | MTM Investment Management, LLC | 18 | 0,00 | 0 | |||||
| 2026-02-13 | 13F | Parkside Financial Bank & Trust | 3.770 | 10,04 | 104 | 7,29 | ||||
| 2026-02-17 | 13F | North Capital, Inc. | 0 | -100,00 | 0 | |||||
| 2025-10-27 | 13F | Kiker Wealth Management, LLC | 0 | -100,00 | 0 | |||||
| 2026-02-13 | 13F | American Century Companies Inc | 1.529.980 | 59,53 | 42.080 | 55,06 | ||||
| 2026-01-21 | 13F | Flagship Harbor Advisors, Llc | 1.412 | 39 | ||||||
| 2026-01-29 | 13F | Nbc Securities, Inc. | 126 | 0,00 | 3 | 0,00 | ||||
| 2026-02-17 | 13F | Man Group plc | 117.671 | 3.232 | ||||||
| 2026-01-26 | 13F | Cwm, Llc | 330 | -27,79 | 0 | |||||
| 2026-02-13 | 13F | SRS Capital Advisors, Inc. | 328 | -14,14 | 9 | -10,00 | ||||
| 2026-02-13 | 13F | Citigroup Inc | 2.274 | -86,98 | 63 | -87,45 | ||||
| 2026-02-17 | 13F | Susquehanna International Group, Llp | 0 | -100,00 | 0 | |||||
| 2026-03-20 | 13F | Purpose Unlimited Inc. | 222.293 | 6.114 | ||||||
| 2026-02-12 | 13F | Dimensional Fund Advisors Lp | 2.348.827 | 51,62 | 64.541 | 47,30 | ||||
| 2026-02-13 | 13F | Cornerstone Financial Management LLC | 19 | 1 | ||||||
| 2026-02-17 | 13F | Bank Of America Corp /de/ | 1.617.660 | -31,23 | 44.437 | -33,23 | ||||
| 2026-02-02 | 13F | CX Institutional | 70 | 20,69 | 0 | |||||
| 2026-02-05 | 13F | Bessemer Group Inc | 207 | 15,64 | 0 | |||||
| 2026-02-18 | 13F | Garton & Associates Financial Advisors LLC | 35 | 1 | ||||||
| 2026-02-11 | 13F | GW&K Investment Management, LLC | 1 | 0 |