Grundlæggende statistik
| Institutionelle aktier (lange) | 319.005.797 - 101,59% (ex 13D/G) - change of -27,81MM shares -8,02% MRQ |
| Institutionel værdi (lang) | $ 4.463.809 USD ($1000) |
Institutionelt ejerskab og aktionærer
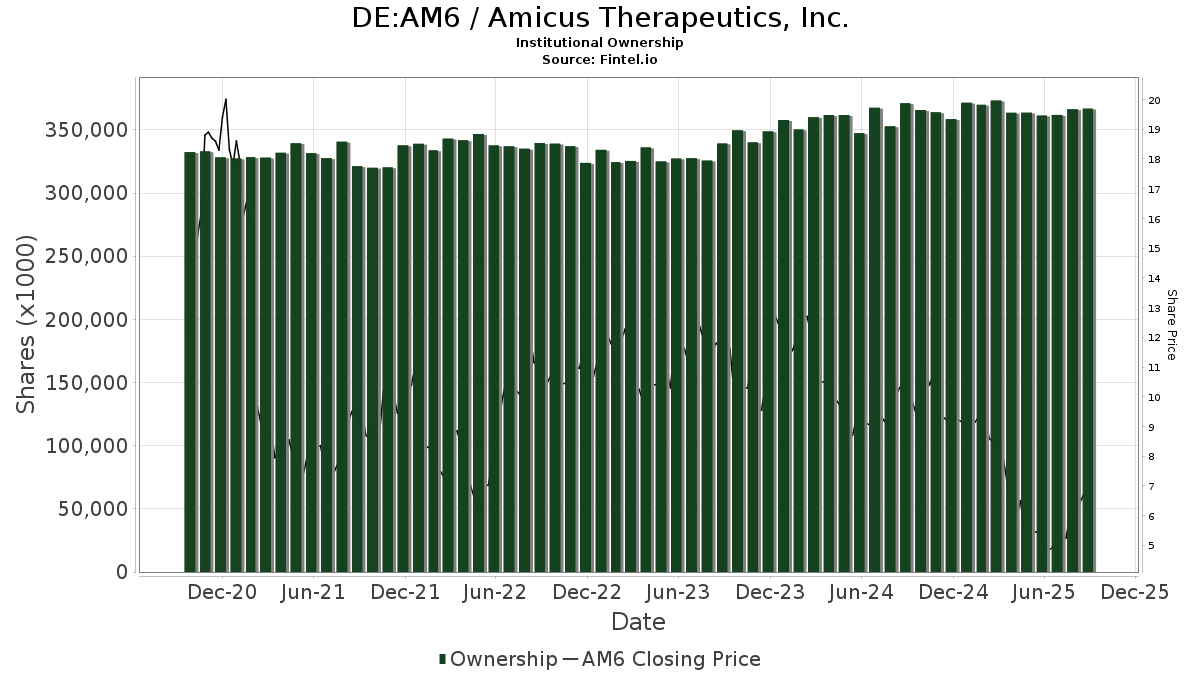
Amicus Therapeutics, Inc. (DE:AM6) har 335 institutionelle ejere og aktionærer, der har indsendt 13D/G- eller 13F-formularer til Securities Exchange Commission (SEC). Disse institutioner har i alt 319,005,797 aktier. Største aktionærer omfatter BlackRock, Inc., Vanguard Group Inc, Hbk Investments L P, State Street Corp, Pentwater Capital Management LP, Bellevue Group AG, William Blair Investment Management, Llc, Geode Capital Management, Llc, Perceptive Advisors Llc, and Goldman Sachs Group Inc .
Amicus Therapeutics, Inc. (DB:AM6) institutionel ejerskabsstruktur viser aktuelle positioner i virksomheden efter institutioner og fonde, samt seneste ændringer i positionsstørrelse. Større aktionærer kan omfatte individuelle investorer, investeringsforeninger, hedgefonde eller institutioner. Skema 13D angiver, at investoren besidder (eller besidder) mere end 5 % af virksomheden og har til hensigt (eller har til hensigt at) aktivt at forfølge en ændring i forretningsstrategi. Skema 13G indikerer en passiv investering på over 5%.
The share price as of April 24, 2026 is 12,30 / share. Previously, on April 28, 2025, the share price was 6,40 / share. This represents an increase of 92,11% over that period.
Fondens stemningsscore
Fund Sentiment Score (fka Ownership Accumulation Score) finder de aktier, der bliver mest købt af fonde. Det er resultatet af en sofistikeret, multi-faktor kvantitativ model, der identificerer virksomheder med de højeste niveauer af institutionel akkumulering. Scoringsmodellen bruger en kombination af den samlede stigning i oplyste ejere, ændringerne i porteføljeallokeringer i disse ejere og andre målinger. Tallet går fra 0 til 100, hvor højere tal indikerer et højere niveau af akkumulering for sine jævnaldrende, og 50 er gennemsnittet.
Opdateringsfrekvens: Dagligt
Se Ownership Explorer, som giver en liste over højest rangerende virksomheder.
AI+ Ask Fintel’s AI assistant about Amicus Therapeutics, Inc..
Select a question to share a public post with an AI-crafted answer.
Thinking of good questions…
13F og NPORT arkivering
Detaljer om 13F-arkivering er gratis. Detaljer om NP-ansøgninger kræver et premium-medlemskab. Grønne rækker angiver nye positioner. Røde rækker angiver lukkede positioner. Klik på linket ikon for at se den fulde transaktionshistorik.
Opgrader
for at låse premium-data op og eksportere til Excel ![]() .
.
| Fil dato | Kilde | Investor | Type | Gennemsnitlig pris (Øst) |
Aktier | Δ Aktier (%) |
Rapporteret Værdi ($1000) |
Δ Værdi (%) |
Port Alloc (%) |
|
|---|---|---|---|---|---|---|---|---|---|---|
| 2026-02-06 | 13F | Gsa Capital Partners Llp | 0 | -100,00 | 0 | |||||
| 2026-02-13 | 13F | First Trust Advisors Lp | 533.507 | 240,54 | 7.597 | 515,64 | ||||
| 2026-04-07 | 13F | Farther Finance Advisors, LLC | 1.930 | 3,15 | 28 | 3,85 | ||||
| 2026-01-26 | 13F | Cwm, Llc | 50.788 | 39,87 | 1 | |||||
| 2026-02-11 | 13F | Inceptionr Llc | 0 | -100,00 | 0 | |||||
| 2026-02-17 | 13F | Ishara Investments LP | 360.000 | 5.126 | ||||||
| 2025-11-12 | 13F | Nomura Asset Management Co Ltd | 0 | 0 | ||||||
| 2026-02-12 | 13F | Ensign Peak Advisors, Inc | 0 | -100,00 | 0 | |||||
| 2026-02-13 | 13F | Macquarie Group Ltd | 0 | -100,00 | 0 | |||||
| 2026-02-17 | 13F | Redmile Group, LLC | 0 | -100,00 | 0 | |||||
| 2026-02-17 | 13F | Aqr Capital Management Llc | 966.795 | 138,96 | 13.767 | 331,84 | ||||
| 2025-11-06 | 13F | Tempus Wealth Planning, LLC | 0 | -100,00 | 0 | -100,00 | ||||
| 2025-11-14 | 13F | Twinbeech Capital Lp | 0 | -100,00 | 0 | |||||
| 2026-02-17 | 13F | Cim Investment Mangement Inc | 32.305 | 0,00 | 460 | 81,10 | ||||
| 2026-02-13 | 13F | Nfj Investment Group, Llc | 306.013 | -9,13 | 4.358 | 64,23 | ||||
| 2026-02-05 | 13F | Allworth Financial LP | 5.067 | 8,32 | 72 | 100,00 | ||||
| 2026-02-17 | 13F | Bank Of America Corp /de/ | 3.438.241 | -51,64 | 48.961 | -12,60 | ||||
| 2026-02-05 | 13F | Stephens Inc /ar/ | 0 | -100,00 | 0 | |||||
| 2026-02-17 | 13F | Shay Capital LLC | 30.000 | 427 | ||||||
| 2026-02-11 | 13F | Vestcor Inc | 257.412 | 4 | ||||||
| 2026-02-17 | 13F | Tudor Investment Corp Et Al | Call | 37.500 | 534 | |||||
| 2026-02-17 | 13F | Tudor Investment Corp Et Al | 900.000 | 432,59 | 12.816 | 862,89 | ||||
| 2026-02-09 | 13F | Hartland & Co., LLC | 33 | 3.200,00 | 0 | |||||
| 2026-02-17 | 13F | Tudor Investment Corp Et Al | Put | 37.500 | 534 | |||||
| 2026-02-03 | 13F | Mitsubishi UFJ Kokusai Asset Management Co., Ltd. | 402 | 0,00 | 6 | 66,67 | ||||
| 2025-11-14 | 13F | Skopos Labs, Inc. | 0 | -100,00 | 0 | |||||
| 2026-02-17 | 13F | XTX Topco Ltd | 0 | -100,00 | 0 | |||||
| 2026-04-13 | 13F | Wedge Capital Management L L P/nc | 0 | -100,00 | 0 | |||||
| 2026-02-05 | 13F | Bessemer Group Inc | 0 | -100,00 | 0 | |||||
| 2026-02-13 | 13F | Verition Fund Management LLC | 649.562 | 332,88 | 9.250 | 682,49 | ||||
| 2026-01-30 | 13F | R Squared Ltd | 13.788 | -46,61 | 196 | -3,45 | ||||
| 2026-02-12 | 13F | Federated Hermes, Inc. | 1.145 | -36,81 | 16 | 14,29 | ||||
| 2026-02-10 | 13F | Axq Capital, Lp | 11.128 | 158 | ||||||
| 2026-02-06 | 13F | Vestmark Advisory Solutions, Inc. | 367.557 | 5.234 | ||||||
| 2026-01-21 | 13F | Flagship Harbor Advisors, Llc | 200 | 3 | ||||||
| 2026-02-10 | 13F | Godfrey Financial Associates, Inc. | 121 | 2 | ||||||
| 2026-02-12 | 13F | DRW Securities, LLC | 21.000 | -48,81 | 299 | -5,97 | ||||
| 2026-02-05 | 13F | Stephens Investment Management Group LLC | 1.351.814 | 7,23 | 19.250 | 93,79 | ||||
| 2026-01-28 | 13F | Klp Kapitalforvaltning As | 59.200 | 19,35 | 843 | 116,15 | ||||
| 2026-02-09 | 13F | Sectoral Asset Management Inc | 43.300 | -63,65 | 617 | -34,33 | ||||
| 2026-02-11 | 13F | Cerity Partners LLC | 63.081 | 78,80 | 898 | 223,02 | ||||
| 2026-02-02 | 13F | Truist Financial Corp | 0 | -100,00 | 0 | |||||
| 2026-02-12 | 13F | Mount Yale Investment Advisors, LLC | 367.557 | -2,17 | 5.234 | 76,82 | ||||
| 2026-02-13 | 13F | Wells Fargo & Company/mn | 339.426 | 76,32 | 4.833 | 218,80 | ||||
| 2026-02-11 | 13F | LPL Financial LLC | 35.805 | -21,97 | 510 | 41,00 | ||||
| 2026-02-17 | 13F | Two Sigma Advisers, Lp | 590.676 | 71,02 | 8.411 | 209,11 | ||||
| 2026-02-11 | 13F | LPL Financial LLC | Put | 10.000 | 142 | |||||
| 2025-11-14 | 13F | Point72 Asia (Singapore) Pte. Ltd. | 0 | -100,00 | 0 | |||||
| 2026-01-09 | 13F | Diversified Trust Co | 0 | -100,00 | 0 | -100,00 | ||||
| 2025-11-07 | 13F | Readystate Asset Management Lp | 0 | -100,00 | 0 | |||||
| 2026-02-11 | 13F | Ameritas Investment Partners, Inc. | 24.184 | 344 | ||||||
| 2026-04-15 | 13F | Gf Fund Management Co. Ltd. | 6.929 | 14,28 | 100 | 16,28 | ||||
| 2026-02-13 | 13F | Virtus ETF Advisers LLC | 1.523 | -66,33 | 22 | -40,00 | ||||
| 2026-02-13 | 13F | Healthcare Of Ontario Pension Plan Trust Fund | 800.000 | 1.214,56 | 11.392 | 2.278,29 | ||||
| 2025-11-14 | 13F | Point72 Hong Kong Ltd | 13.524 | 107 | ||||||
| 2026-02-13 | 13F | Soros Fund Management Llc | 5.000.000 | 71.200 | ||||||
| 2026-03-03 | 13F/A | Caitong International Asset Management Co., Ltd | 4.231 | 60 | ||||||
| 2026-01-30 | 13F | NJ State Employees Deferred Compensation Plan | 0 | -100,00 | 0 | |||||
| 2026-02-03 | 13F | Credit Industriel Et Commercial | 240.000 | 3.418 | ||||||
| 2026-02-13 | 13F | State Street Corp | 14.833.314 | 28,28 | 211.226 | 131,82 | ||||
| 2026-02-09 | 13F | Knights of Columbus Asset Advisors LLC | 5.476 | -8,75 | 78 | 63,83 | ||||
| 2026-02-12 | 13F | CIBC Private Wealth Group, LLC | 0 | -100,00 | 0 | |||||
| 2026-01-30 | 13F | Caldwell Securities, Inc | 400 | 0,00 | 6 | 66,67 | ||||
| 2025-11-19 | 13F/A | Danske Bank A/s | 0 | -100,00 | 0 | -100,00 | ||||
| 2026-02-13 | 13F | Ieq Capital, Llc | 120.686 | 257,15 | 1.719 | 545,86 | ||||
| 2026-02-17 | 13F | Schonfeld Strategic Advisors LLC | 261.085 | -80,86 | 3.718 | -65,42 | ||||
| 2026-02-13 | 13F | Birchview Capital, LP | 253.000 | 0,00 | 3.603 | 80,73 | ||||
| 2026-02-17 | 13F | Jones Financial Companies Lllp | 278 | 0,00 | 4 | 50,00 | ||||
| 2026-02-17 | 13F | State Of Wisconsin Investment Board | 184.334 | -62,53 | 2.625 | -32,30 | ||||
| 2026-02-11 | 13F | Rise Advisors, LLC | 0 | -100,00 | 0 | |||||
| 2026-04-10 | 13F | Brucke Financial, Inc. | 10.567 | 153 | ||||||
| 2026-02-13 | 13F | American Century Companies Inc | 34.990 | 498 | ||||||
| 2026-02-13 | 13F | Pathstone Holdings, LLC | 100.110 | -1,66 | 1.426 | 77,68 | ||||
| 2026-02-13 | 13F | Prudential Financial Inc | 18.900 | -49,02 | 269 | -7,88 | ||||
| 2026-04-23 | 13F | Impact Partnership Wealth, LLC | 0 | -100,00 | 0 | |||||
| 2026-04-13 | 13F | E Fund Management Co., Ltd. | 40.461 | -12,66 | 585 | 120,75 | ||||
| 2026-02-04 | 13F | Versor Investments LP | 871.234 | 12.406 | ||||||
| 2026-02-17 | 13F | Polygon Management Ltd. | 260.771 | 115,14 | 3.713 | 288,80 | ||||
| 2026-02-13 | 13F | Squarepoint Ops LLC | 269.302 | 356,65 | 3.835 | 726,29 | ||||
| 2026-04-20 | 13F/A | OP Asset Management Ltd | 0 | -100,00 | 0 | -100,00 | ||||
| 2026-02-13 | 13F | Marshall Wace, Llp | 240.900 | 3.430 | ||||||
| 2026-02-12 | 13F | Xponance, Inc. | 23.532 | 7,51 | 335 | 94,77 | ||||
| 2026-03-04 | 13F | SHP Wealth Management | 25 | 0 | ||||||
| 2026-02-09 | 13F | William Blair Investment Management, Llc | 10.627.717 | -32,52 | 151.339 | 21,94 | ||||
| 2026-02-17 | 13F | Trails Edge Capital Partners, LP | 1.043.313 | 14.857 | ||||||
| 2026-02-17 | 13F | Palo Alto Investors LP | 0 | -100,00 | 0 | |||||
| 2025-11-13 | 13F | Capital Fund Management S.a. | 0 | -100,00 | 0 | -100,00 | ||||
| 2026-02-10 | 13F | Envestnet Asset Management Inc | 16.240 | -77,00 | 231 | -58,45 | ||||
| 2026-02-17 | 13F | Point72 Asset Management, L.P. | 2.068.454 | -71,10 | 29.455 | -47,77 | ||||
| 2026-01-30 | 13F | State of New Jersey Common Pension Fund D | 94.687 | 1.348 | ||||||
| 2026-02-19 | 13F | Invesco Ltd. | 1.259.225 | 172,58 | 17.931 | 392,61 | ||||
| 2026-02-17 | 13F | Royal Bank Of Canada | 25.392 | 65,98 | 361 | 200,83 | ||||
| 2026-02-17 | 13F | Northern Trust Corp | 2.644.213 | -20,77 | 37.654 | 43,18 | ||||
| 2026-02-17 | 13F | California State Teachers Retirement System | 265.511 | 12,56 | 3.781 | 103,44 | ||||
| 2026-02-17 | 13F | Janus Henderson Group Plc | 137.571 | -94,42 | 1.958 | -89,92 | ||||
| 2026-02-13 | 13F | Morgan Stanley | 5.479.689 | 71,31 | 78.031 | 209,58 | ||||
| 2026-02-17 | 13F | Bank Of America Corp /de/ | Call | 0 | -100,00 | 0 | ||||
| 2026-02-13 | 13F | Neo Ivy Capital Management | 420.275 | 753,11 | 5.985 | 1.442,27 | ||||
| 2026-02-17 | 13F | Adage Capital Partners Gp, L.l.c. | 1.650.000 | 23.496 | ||||||
| 2026-02-11 | 13F | Jpmorgan Chase & Co | 3.717.363 | 75,66 | 52.935 | 217,45 | ||||
| 2026-02-17 | 13F | Nomura Holdings Inc | Put | 0 | -100,00 | 0 | ||||
| 2025-11-14 | 13F | Point72 (DIFC) Ltd | 34.876 | -36,78 | 275 | -13,29 | ||||
| 2026-02-17 | 13F | Nomura Holdings Inc | Call | 0 | -100,00 | 0 | ||||
| 2026-01-27 | 13F | First Horizon Corp | 4.786 | 123,85 | 68 | 325,00 | ||||
| 2025-11-14 | 13F | Ion Asset Management Ltd. | 872.411 | 6.875 | ||||||
| 2026-02-17 | 13F | Orbimed Advisors Llc | 729.900 | -55,64 | 10.394 | -19,84 | ||||
| 2026-02-17 | 13F | Cetera Investment Advisers | 13.046 | -5,31 | 186 | 71,30 | ||||
| 2026-02-17 | 13F | Omni Event Management Ltd | 2.994.400 | 42.640 | ||||||
| 2026-04-21 | 13F | Wedbush Securities Inc | 11.456 | 0 | ||||||
| 2026-02-13 | 13F | Rafferty Asset Management, LLC | 493.088 | 30,20 | 7.022 | 135,29 | ||||
| 2026-02-13 | 13F | Prosight Management, LP | 1.150.000 | -32,73 | 16.376 | 21,56 | ||||
| 2026-02-13 | 13F | Manufacturers Life Insurance Company, The | 0 | -100,00 | 0 | |||||
| 2026-02-13 | 13F | BNP Paribas Asset Management Holding S.A. | 3.209 | 81,50 | 0 | |||||
| 2026-02-13 | 13F | MAI Capital Management | 89 | -96,03 | 1 | -94,12 | ||||
| 2026-02-13 | 13F | Brown Advisory Inc | 45.525 | 0,00 | 648 | 81,01 | ||||
| 2026-02-13 | 13F | Glazer Capital, Llc | 1.603.788 | 23 | ||||||
| 2026-04-13 | 13F | Trust Co | 61 | 0,00 | 1 | |||||
| 2026-02-12 | 13F | Elo Mutual Pension Insurance Co | 17.904 | 255 | ||||||
| 2026-02-13 | 13F | Panagora Asset Management Inc | 0 | -100,00 | 0 | |||||
| 2026-02-17 | 13F | Engineers Gate Manager LP | 78.659 | -66,12 | 1.120 | -38,76 | ||||
| 2026-02-13 | 13F | Van Eck Associates Corp | 12.126 | 115,08 | 0 | |||||
| 2026-04-20 | 13F | State of Alaska, Department of Revenue | 16.628 | 0,00 | 0 | |||||
| 2026-02-03 | 13F | SBI Securities Co., Ltd. | 352 | 0,00 | 5 | 150,00 | ||||
| 2026-04-24 | 13F | CIBRA Capital Ltd | 1.687.661 | 700,60 | 24.404 | 713,16 | ||||
| 2026-02-02 | 13F | Wolverine Asset Management Llc | 24.316 | 346 | ||||||
| 2026-04-07 | 13F | U.S. Capital Wealth Advisors, LLC | 0 | -100,00 | 0 | |||||
| 2026-02-17 | 13F | ExodusPoint Capital Management, LP | 0 | -100,00 | 0 | -100,00 | ||||
| 2026-02-17 | 13F | Cnh Partners Llc | 1.983.109 | 28.239 | ||||||
| 2026-02-13 | 13F | Vivaldi Asset Management, LLC | 1.088.721 | 15.503 | ||||||
| 2026-02-17 | 13F | 9823 Capital, L.P. | 12.847 | 183 | ||||||
| 2026-02-17 | 13F | Water Island Capital Llc | Call | 451.000 | 6.422 | |||||
| 2026-02-17 | 13F | Gotham Asset Management, LLC | 139.551 | 0,74 | 1.987 | 82,13 | ||||
| 2026-02-10 | 13F/A | Northwestern Mutual Wealth Management Co | 1.512 | 332,00 | 22 | 950,00 | ||||
| 2026-02-17 | 13F | Water Island Capital Llc | 706.617 | 10.062 | ||||||
| 2026-02-12 | 13F | Renaissance Technologies Llc | 1.211.693 | -37,64 | 17.255 | 12,68 | ||||
| 2026-02-13 | 13F | Hudson Bay Capital Management LP | 622.500 | -70,00 | 8.864 | -45,79 | ||||
| 2026-02-06 | 13F | Larson Financial Group LLC | 302 | -61,72 | 4 | -33,33 | ||||
| 2026-02-13 | 13F | Alberta Investment Management Corp | 939.200 | 13.374 | ||||||
| 2026-02-11 | 13F | Los Angeles Capital Management Llc | 76.624 | 46,03 | 682 | 64,89 | ||||
| 2026-02-11 | 13F | Erste Asset Management GmbH | 63.850 | 910 | ||||||
| 2026-02-17 | 13F | Kemnay Advisory Services Inc. | 8.767 | 125 | ||||||
| 2026-02-12 | 13F | Athos Capital Ltd | 600.000 | 9 | ||||||
| 2026-02-17 | 13F | Mercer Global Advisors Inc /adv | 16.964 | 242 | ||||||
| 2026-02-13 | 13F | Bridgefront Capital, LLC | 0 | -100,00 | 0 | |||||
| 2025-11-06 | 13F | Assetmark, Inc | 0 | -100,00 | 0 | |||||
| 2026-01-23 | 13F | Rsm Us Wealth Management Llc | 25.046 | 10,55 | 357 | 100,00 | ||||
| 2026-02-12 | 13F | Wealthspire Advisors, LLC | 0 | -100,00 | 0 | |||||
| 2026-02-17 | 13F | Parkman Healthcare Partners LLC | 1.487.283 | -11,86 | 21.179 | 59,28 | ||||
| 2026-02-17 | 13F | Algert Global Llc | 0 | -100,00 | 0 | -100,00 | ||||
| 2026-02-17 | 13F | Voloridge Investment Management, Llc | 561.133 | -18,24 | 7.991 | 47,74 | ||||
| 2026-02-13 | 13F | JustInvest LLC | 24.161 | -2,18 | 344 | 77,32 | ||||
| 2026-02-17 | 13F | Silvercrest Asset Management Group Llc | 945.628 | 0,12 | 13.466 | 80,93 | ||||
| 2026-02-12 | 13F | State Board Of Administration Of Florida Retirement System | 88.119 | 0,00 | 1.255 | 80,69 | ||||
| 2026-02-13 | 13F | P Schoenfeld Asset Management Lp | 363.000 | 5.169 | ||||||
| 2026-02-10 | 13F | Connor, Clark & Lunn Investment Management Ltd. | 1.218.000 | -39,69 | 17.344 | 8,99 | ||||
| 2026-02-13 | 13F | Rhumbline Advisers | 376.752 | -10,70 | 5.365 | 61,37 | ||||
| 2026-02-13 | 13F | Charles Schwab Investment Management Inc | 2.561.753 | -6,92 | 36.479 | 68,21 | ||||
| 2025-11-12 | 13F | Edgestream Partners, L.P. | 0 | -100,00 | 0 | -100,00 | ||||
| 2026-04-24 | 13F | Key FInancial Inc | 100 | 0,00 | 1 | 0,00 | ||||
| 2026-02-12 | 13F | Voya Investment Management Llc | 107.431 | -79,95 | 1.530 | -63,78 | ||||
| 2026-01-28 | 13F | Peregrine Capital Management Llc | 0 | -100,00 | 0 | -100,00 | ||||
| 2026-02-13 | 13F | Caxton Associates Llp | 11.396 | 162 | ||||||
| 2026-02-02 | 13F | Principal Financial Group Inc | 399.510 | 51,72 | 5.689 | 174,17 | ||||
| 2026-01-28 | 13F | Arizona State Retirement System | 77.329 | 6,15 | 1.101 | 91,81 | ||||
| 2026-04-08 | 13F | E Fund Management (Hong Kong) Co., Ltd. | 1.005 | 15 | ||||||
| 2026-02-17 | 13F | FIL Ltd | 957.000 | 13.628 | ||||||
| 2026-02-17 | 13F | Sphera Funds Management Ltd. | 658.377 | -33,57 | 9.375 | 20,04 | ||||
| 2026-02-11 | 13F | Hughes Financial Services, LLC | 83 | 0,00 | 1 | |||||
| 2026-02-05 | 13F | GABELLI & Co INVESTMENT ADVISERS, INC. | 485.950 | 6.920 | ||||||
| 2026-02-05 | 13F | DnB Asset Management AS | 0 | -100,00 | 0 | |||||
| 2026-02-17 | 13F | D. E. Shaw & Co., Inc. | 1.549.003 | -59,96 | 22.058 | -27,64 | ||||
| 2026-02-12 | 13F | Steward Partners Investment Advisory, Llc | 1.000 | 0,00 | 14 | 100,00 | ||||
| 2026-01-28 | 13F | WPG Advisers, LLC | 17 | 0,00 | 0 | |||||
| 2026-02-17 | 13F | Capstone Investment Advisors, Llc | 1.850.000 | 4.110,86 | 26.344 | 7.513,87 | ||||
| 2025-11-14 | 13F | Sherbrooke Park Advisers Llc | 0 | -100,00 | 0 | |||||
| 2026-02-10 | 13F | Intech Investment Management Llc | 103.539 | 0,00 | 1.474 | 80,86 | ||||
| 2026-02-17 | 13F | Two Sigma Securities, Llc | 0 | -100,00 | 0 | |||||
| 2026-02-17 | 13F | Fmr Llc | 178.432 | -64,58 | 2.541 | -36,00 | ||||
| 2025-11-14 | 13F | Raymond James Financial Inc | 0 | -100,00 | 0 | |||||
| 2026-01-28 | 13F | DekaBank Deutsche Girozentrale | 217.700 | 0,00 | 3 | 100,00 | ||||
| 2026-02-17 | 13F | Zacks Investment Management | 11.625 | 166 | ||||||
| 2026-02-17 | 13F | Caption Management, LLC | 0 | -100,00 | 0 | |||||
| 2026-02-17 | 13F | Cinctive Capital Management LP | 275.000 | 3.916 | ||||||
| 2026-02-06 | 13F | Global Retirement Partners, LLC | 57 | 23,91 | 1 | |||||
| 2026-02-17 | 13F | Cantor Fitzgerald, L. P. | 50.000 | 712 | ||||||
| 2026-02-13 | 13F | Walleye Capital LLC | Call | 100 | -98,39 | 1 | -97,92 | |||
| 2026-02-05 | 13F | Thrivent Financial For Lutherans | 0 | -100,00 | 0 | |||||
| 2026-02-13 | 13F | Walleye Capital LLC | Put | 5.500 | -75,11 | 78 | -55,17 | |||
| 2026-02-11 | 13F | Fox Run Management, L.l.c. | 0 | -100,00 | 0 | |||||
| 2026-02-13 | 13F | Walleye Capital LLC | 26.030 | -94,86 | 371 | -90,74 | ||||
| 2026-02-06 | 13F | Pnc Financial Services Group, Inc. | 543 | 20,67 | 8 | 133,33 | ||||
| 2026-02-09 | 13F | Hantz Financial Services, Inc. | 132 | 0 | ||||||
| 2026-02-12 | 13F | Quadrant Capital Group Llc | 1.350 | 0,00 | 19 | 90,00 | ||||
| 2026-02-12 | 13F | Granite Investment Partners, LLC | 0 | -100,00 | 0 | |||||
| 2026-02-13 | 13F | SRS Capital Advisors, Inc. | 620 | -63,51 | 9 | -38,46 | ||||
| 2026-02-17 | 13F | Angelo Gordon & Co., L.p. | 100.000 | 1.424 | ||||||
| 2026-02-17 | 13F | Citadel Advisors Llc | 5.096.796 | -38,22 | 72.578 | 11,64 | ||||
| 2026-02-13 | 13F | Carmignac Gestion | 194.887 | 2.775 | ||||||
| 2026-01-09 | 13F | Assenagon Asset Management S.A. | 0 | -100,00 | 0 | |||||
| 2026-02-17 | 13F | Citadel Advisors Llc | Put | 14.000 | -76,03 | 199 | -56,74 | |||
| 2026-02-17 | 13F | Citadel Advisors Llc | Call | 20.600 | -15,57 | 293 | 52,60 | |||
| 2026-02-11 | 13F | Parallel Advisors, LLC | 5.756 | 0,00 | 82 | 80,00 | ||||
| 2026-02-11 | 13F | Primecap Management Co/ca/ | 589.400 | -11,75 | 8.393 | 59,47 | ||||
| 2026-02-17 | 13F | Pentwater Capital Management LP | 11.500.000 | 163.760 | ||||||
| 2026-02-09 | 13F | Harbour Investments, Inc. | 0 | -100,00 | 0 | -100,00 | ||||
| 2026-04-13 | 13F | IFP Advisors, Inc | 814 | -21,43 | 12 | -21,43 | ||||
| 2026-02-04 | 13F | ELCO Management Co., LLC | 0 | -100,00 | 0 | |||||
| 2025-11-07 | 13F | M&G Plc | 0 | -100,00 | 0 | |||||
| 2026-02-17 | 13F | Polymer Capital Management (US) LLC | 21.841 | -41,50 | 311 | 5,78 | ||||
| 2026-04-21 | 13F | Mesirow Financial Investment Management, Inc. | 13.000 | 0,00 | 188 | 1,08 | ||||
| 2026-02-12 | 13F | Cibc World Markets Corp | 19.710 | -42,55 | 281 | 42,86 | ||||
| 2026-02-17 | 13F | Wellington Management Group Llp | 1.373.867 | -95,20 | 19.564 | -91,33 | ||||
| 2026-02-17 | 13F | Trexquant Investment LP | 0 | -100,00 | 0 | |||||
| 2026-02-17 | 13F | Sender Co & Partners, Inc. | 0 | -100,00 | 0 | -100,00 | ||||
| 2025-10-28 | 13F | Campbell & CO Investment Adviser LLC | 0 | -100,00 | 0 | |||||
| 2026-02-17 | 13F | Perceptive Advisors Llc | 6.370.851 | 0,00 | 90.721 | 80,71 | ||||
| 2026-02-17 | 13F | Russell Investments Group, Ltd. | 74.173 | -40,48 | 1.056 | 7,65 | ||||
| 2026-02-17 | 13F | Avoro Capital Advisors LLC | 0 | -100,00 | 0 | |||||
| 2026-02-17 | 13F | PenderFund Capital Management Ltd. | 11.900 | 169 | ||||||
| 2026-02-12 | 13F | New York State Common Retirement Fund | 88.516 | -72,57 | 1.260 | -50,45 | ||||
| 2026-02-17 | 13F | Jain Global LLC | 119.454 | 192,71 | 1.701 | 429,91 | ||||
| 2026-01-30 | 13F | Us Bancorp \de\ | 2.251 | 0,00 | 32 | 88,24 | ||||
| 2026-02-13 | 13F | Ubs Asset Management Americas Inc | 857.834 | 4,24 | 12.216 | 88,39 | ||||
| 2026-02-09 | 13F | Jefferies Financial Group Inc. | 165.485 | 0,00 | 2.357 | 80,67 | ||||
| 2026-01-29 | 13F | Dunhill Financial, LLC | 5 | 0 | ||||||
| 2025-11-14 | 13F | Cubist Systematic Strategies, LLC | 861.451 | -60,90 | 6.788 | -46,22 | ||||
| 2026-02-17 | 13F | Prelude Capital Management, Llc | 349.414 | 4.976 | ||||||
| 2026-02-17 | 13F | Optiver Holding B.V. | 6.976 | 287,13 | 99 | 607,14 | ||||
| 2026-02-10 | 13F | Norges Bank | 1.165.028 | 16.590 | ||||||
| 2026-02-10 | 13F | Bank of New York Mellon Corp | 829.904 | 1,27 | 11.818 | 83,01 | ||||
| 2026-02-12 | 13F | Alps Advisors Inc | 252.834 | 70,77 | 3.600 | 208,75 | ||||
| 2026-02-13 | 13F | Barclays Plc | Put | 0 | -100,00 | 0 | -100,00 | |||
| 2026-04-23 | 13F | Private Wealth Management Group, LLC | 102 | 0,00 | 1 | 0,00 | ||||
| 2026-02-10 | 13F | Close Asset Management Ltd | 600 | 0,00 | 0 | |||||
| 2026-02-05 | 13F | ANTIPODES PARTNERS Ltd | 3.926 | 0,00 | 56 | 83,33 | ||||
| 2026-02-13 | 13F | Pinnacle Wealth Planning Services, Inc. | 994 | 14 | ||||||
| 2026-02-17 | 13F | Creative Planning | 402.405 | 5,61 | 5.730 | 90,87 | ||||
| 2026-02-17 | 13F | Guggenheim Capital Llc | 89.180 | 2,97 | 1.270 | 86,07 | ||||
| 2025-11-12 | 13F | Advantage Alpha Capital Partners LP | 0 | -100,00 | 0 | |||||
| 2026-01-29 | 13F | UBS Group AG | 5.893.288 | 240,48 | 83.920 | 515,29 | ||||
| 2026-02-03 | 13F | Ballentine Partners, LLC | 13.620 | -1,94 | 194 | 77,06 | ||||
| 2026-01-27 | 13F | Zurcher Kantonalbank (Zurich Cantonalbank) | 79.336 | 31,81 | 1.130 | 138,19 | ||||
| 2026-02-17 | 13F | 683 Capital Management, LLC | 800.000 | -4,19 | 11.392 | 73,16 | ||||
| 2026-02-17 | 13F | Weiss Asset Management LP | 1.892.797 | 26.953 | ||||||
| 2026-02-12 | 13F | MetLife Investment Management, LLC | 164.210 | -0,69 | 2.338 | 79,57 | ||||
| 2026-02-04 | 13F | Abc Arbitrage Sa | 472.984 | 6.735 | ||||||
| 2025-11-13 | 13F | Quadrature Capital Ltd | 0 | -100,00 | 0 | |||||
| 2026-04-24 | 13F | Capricorn Fund Managers Ltd | 534.079 | 153,51 | 7.723 | 157,49 | ||||
| 2026-02-17 | 13F | Advisor Group Holdings, Inc. | 2.783 | -17,39 | 40 | 50,00 | ||||
| 2026-04-24 | 13F | Root Financial Partners, LLC | 180 | 3 | ||||||
| 2026-02-11 | 13F | Franklin Resources Inc | 91.869 | 62,49 | 1.308 | 193,93 | ||||
| 2026-02-13 | 13F | Toroso Investments, LLC | 51.156 | -3,83 | 728 | 73,75 | ||||
| 2026-02-12 | 13F | EntryPoint Capital, LLC | 0 | -100,00 | 0 | |||||
| 2026-02-17 | 13F | Superstring Capital Management Lp | 352.896 | 5.025 | ||||||
| 2026-01-22 | 13F | Massachusetts Financial Services Co /ma/ | 125.524 | -96,62 | 1.787 | -93,89 | ||||
| 2026-02-17 | 13F | Sand Grove Capital Management LLP | 1.647.030 | 23.454 | ||||||
| 2026-03-31 | 13F/A | Barclays Plc | Call | 0 | -100,00 | 0 | -100,00 | |||
| 2026-02-06 | 13F | Kingdom Financial Group LLC. | 15.045 | 214 | ||||||
| 2026-02-13 | 13F | Capula Management Ltd | 30.000 | 427 | ||||||
| 2026-04-07 | 13F | Eastern Bank | 525 | 0,00 | 8 | 0,00 | ||||
| 2025-11-21 | 13F | Nebula Research & Development LLC | 0 | -100,00 | 0 | |||||
| 2025-11-12 | 13F | 111 Capital | 0 | -100,00 | 0 | |||||
| 2026-02-13 | 13F | Public Employees Retirement Association Of Colorado | 30.145 | 0,00 | 0 | |||||
| 2026-02-17 | 13F | Meteora Capital, LLC | 507.951 | 7.233 | ||||||
| 2026-02-13 | 13F | Y-Intercept (Hong Kong) Ltd | 149.771 | -43,10 | 2.133 | 2,80 | ||||
| 2026-02-17 | 13F | Caption Management, LLC | Call | 120.000 | 140,00 | 1.709 | 333,50 | |||
| 2026-01-26 | 13F | KBC Group NV | 10.154 | 0,00 | 0 | |||||
| 2026-02-13 | 13F | Walleye Trading LLC | Call | 39.700 | 189,78 | 565 | 428,04 | |||
| 2026-02-13 | 13F | Walleye Trading LLC | 210.578 | 2.999 | ||||||
| 2026-02-13 | 13F | Walleye Trading LLC | Put | 282.800 | 2.593,33 | 4.027 | 4.810,98 | |||
| 2026-02-10 | 13F | NINE MASTS CAPITAL Ltd | 50.000 | 712 | ||||||
| 2025-11-14 | 13F | Osterweis Capital Management Inc | 0 | -100,00 | 0 | |||||
| 2026-02-17 | 13F | Virtus Investment Advisers, Inc. | 64.777 | -10,06 | 922 | 62,61 | ||||
| 2026-02-13 | 13F | Kilter Group LLC | 131 | 2 | ||||||
| 2026-01-28 | 13F | Teacher Retirement System Of Texas | 40.836 | -32,32 | 582 | 22,32 | ||||
| 2026-04-21 | 13F | Vise Technologies, Inc. | 69.715 | 0,00 | 993 | 0,00 | ||||
| 2026-02-04 | 13F | Twin Lakes Capital Management, LLC | 6.000 | 0,00 | 85 | 80,85 | ||||
| 2026-02-06 | 13F | Leonteq Securities AG | 2.757 | -79,19 | 39 | -62,50 | ||||
| 2026-02-11 | 13F | Deutsche Bank Ag\ | 3.457.228 | 39,37 | 49.231 | 151,85 | ||||
| 2026-02-06 | 13F | Covestor Ltd | 7.148 | -45,96 | 0 | |||||
| 2026-02-09 | 13F | Beck Bode, LLC | 32.792 | 467 | ||||||
| 2026-02-17 | 13F | Moore Capital Management, Lp | 137.000 | 1.951 | ||||||
| 2026-02-13 | 13F | Maven Securities LTD | 789.282 | 11.239 | ||||||
| 2026-04-23 | 13F | SJS Investment Consulting Inc. | 48 | 0,00 | 1 | |||||
| 2026-02-10 | 13F | Bnp Paribas Arbitrage, Sa | 2.251.710 | 23,92 | 32.064 | 123,94 | ||||
| 2026-02-09 | 13F | Legal & General Group Plc | 283.007 | 7,16 | 4.030 | 93,66 | ||||
| 2026-02-17 | 13F | Farallon Capital Management Llc | 16.000 | 0,00 | 228 | 80,16 | ||||
| 2025-11-14 | 13F | Point72 Europe (London) LLP | 5.877 | 46 | ||||||
| 2026-02-05 | 13F | Amalgamated Bank | 9.360 | 3,76 | 0 | |||||
| 2026-02-12 | 13F | Bank Of Montreal /can/ | 25.450 | 0,00 | 362 | 81,00 | ||||
| 2026-02-13 | 13F | Mariner, LLC | 36.677 | 217,80 | 522 | 480,00 | ||||
| 2026-02-17 | 13F | Man Group plc | 400.000 | 5.696 | ||||||
| 2026-02-09 | 13F | Geode Capital Management, Llc | 7.345.267 | 3,47 | 104.616 | 86,98 | ||||
| 2026-02-17 | 13F | Blackstone Group Inc | 2.574.204 | 4,34 | 36.657 | 88,56 | ||||
| 2026-04-06 | 13F | Versant Capital Management, Inc | 5.288 | 0,00 | 76 | 1,33 | ||||
| 2026-02-17 | 13F | Persistent Asset Partners Ltd | Call | 0 | -100,00 | 0 | -100,00 | |||
| 2026-02-17 | 13F | Canada Pension Plan Investment Board | 285.727 | 39,98 | 4.069 | 152,99 | ||||
| 2026-01-28 | 13F | Universal- Beteiligungs- und Servicegesellschaft mbH | 231.337 | -28,49 | 3.294 | 29,23 | ||||
| 2026-02-17 | 13F | TIG Advisors, LLC | 2.927.424 | 41.687 | ||||||
| 2026-02-10 | 13F | Daiwa Securities Group Inc. | 916 | -7,10 | 0 | |||||
| 2025-11-13 | 13F | Hsbc Holdings Plc | 0 | -100,00 | 0 | -100,00 | ||||
| 2026-02-12 | 13F | BlackRock, Inc. | 32.524.381 | 25,82 | 463.147 | 127,38 | ||||
| 2026-02-13 | 13F | Police & Firemen's Retirement System of New Jersey | 80.421 | 4,17 | 1.145 | 88,32 | ||||
| 2026-01-29 | 13F | Comerica Bank | 28.452 | -6,42 | 405 | 69,46 | ||||
| 2025-11-10 | 13F | Wrapmanager Inc | 0 | -100,00 | 0 | |||||
| 2026-02-18 | 13F/A | Empowered Funds, LLC | 112.707 | 113,81 | 1.605 | 101,76 | ||||
| 2026-04-22 | 13F | Sterling Capital Management LLC | 1.930 | -0,82 | 28 | 0,00 | ||||
| 2026-01-29 | 13F | Vanguard Group Inc | 29.702.696 | 0,57 | 422.966 | 81,74 | ||||
| 2026-02-17 | 13F | Delaware Management Holdings, Inc. | 5.069.590 | 72.191 | ||||||
| 2026-04-08 | 13F | Wealth Enhancement Advisory Services, Llc | 38.254 | 2,49 | 552 | 3,56 | ||||
| 2026-02-04 | 13F | Swiss Life Asset Management Ltd | 12.757 | 21,18 | 182 | 120,73 | ||||
| 2026-02-13 | 13F | Great West Life Assurance Co /can/ | 43.678 | -48,34 | 1 | |||||
| 2026-02-13 | 13F | Citigroup Inc | Call | 100.000 | 1.424 | |||||
| 2026-02-10 | 13F | State of Wyoming | 14.237 | 41,27 | 203 | 155,70 | ||||
| 2026-02-13 | 13F | Citigroup Inc | Put | 100.000 | 1.424 | |||||
| 2026-02-17 | 13F | Iron Triangle Partners LP | 0 | -100,00 | 0 | -100,00 | ||||
| 2026-02-09 | 13F | Huntington National Bank | 1 | 0,00 | 0 | |||||
| 2026-02-13 | 13F | Victory Capital Management Inc | 347.428 | 1,34 | 4.947 | 83,15 | ||||
| 2026-02-13 | 13F | Citigroup Inc | 1.648.547 | 1.368,52 | 23.475 | 2.555,54 | ||||
| 2026-01-08 | 13F | Nordea Investment Management Ab | 0 | -100,00 | 0 | -100,00 | ||||
| 2026-02-17 | 13F | PDT Partners, LLC | 449.999 | -11,08 | 6.408 | 60,70 | ||||
| 2026-02-17 | 13F | Lazard Asset Management Llc | 41.284 | 116,31 | 588 | 291,33 | ||||
| 2026-02-13 | 13F | Quarry LP | 36.280 | 1.721,29 | 517 | 3.340,00 | ||||
| 2026-02-12 | 13F | denkapparat Operations GmbH | 21.856 | 0,00 | 311 | 80,81 | ||||
| 2026-02-17 | 13F | Oxford Asset Management Llp | 0 | -100,00 | 0 | -100,00 | ||||
| 2026-02-13 | 13F | Barclays Plc | 1.134.639 | 17,03 | 16.157 | 111,51 | ||||
| 2026-02-17 | 13F | Alliancebernstein L.p. | 2.711.443 | 648,13 | 38.611 | 1.252,36 | ||||
| 2025-11-19 | 13F | Ambassador Advisors, LLC | 0 | -100,00 | 0 | |||||
| 2026-01-26 | 13F | Mirae Asset Global Investments Co., Ltd. | 14.993 | 25,81 | 214 | 129,03 | ||||
| 2026-02-10 | 13F | Mutual Of America Capital Management Llc | 276.044 | -0,60 | 3.931 | 79,62 | ||||
| 2026-02-10 | 13F | Goldman Sachs Group Inc | 6.142.956 | 62,33 | 87.476 | 193,35 | ||||
| 2026-02-17 | 13F | Harvest Management Llc | 250.000 | 3.560 | ||||||
| 2026-02-11 | 13F | Picton Mahoney Asset Management | 615.168 | 8.760 | ||||||
| 2026-04-23 | 13F | CWM Advisors, LLC | 35.931 | 7,98 | 520 | 9,73 | ||||
| 2026-02-17 | 13F | Magnetar Financial LLC | 3.967.915 | 56.503 | ||||||
| 2026-02-13 | 13F | PSquared Asset Management AG | 1.050.000 | 14.952 | ||||||
| 2026-02-10 | 13F | Acadian Asset Management Llc | 576.762 | 342,19 | 8 | 700,00 | ||||
| 2026-02-11 | 13F | Allianz Asset Management GmbH | 1.486.996 | 282,15 | 21.175 | 590,61 | ||||
| 2026-02-13 | 13F | Bridgewater Associates, LP | 32.274 | 460 | ||||||
| 2026-01-05 | 13F | Park National Corp /oh/ | 0 | -100,00 | 0 | -100,00 | ||||
| 2026-02-02 | 13F | Chicago Capital Management, LLC | 400.000 | 4.284 | ||||||
| 2026-04-16 | 13F | SG Americas Securities, LLC | 392.835 | 269,35 | 6 | 400,00 | ||||
| 2026-02-17 | 13F | Susquehanna Portfolio Strategies, LLC | 1.075.323 | 0,00 | 15.313 | 80,72 | ||||
| 2026-02-17 | 13F | Freestone Grove Partners LP | 0 | -100,00 | 0 | -100,00 | ||||
| 2026-02-10 | 13F | Hazlett, Burt & Watson, Inc. | 1.569 | 0,00 | 0 | |||||
| 2026-02-17 | 13F | Diadema Partners Lp | Call | 0 | -100,00 | 0 | ||||
| 2025-11-06 | 13F | Abich Financial Wealth Management LLC | 10.779 | 85 | ||||||
| 2026-02-17 | 13F | Bellevue Group AG | 10.735.195 | 152.869 | ||||||
| 2026-01-23 | 13F | Sumitomo Mitsui Trust Holdings, Inc. | 14.850 | 22,22 | 211 | 122,11 | ||||
| 2026-02-17 | 13F | Rock Springs Capital Management LP | 1.929.931 | -0,90 | 27.482 | 79,09 | ||||
| 2026-02-12 | 13F | Soleus Capital Management, L.P. | 5.207.284 | 11,03 | 74.152 | 100,64 | ||||
| 2026-02-13 | 13F | Sei Investments Co | 216.917 | -29,49 | 3.089 | 27,39 | ||||
| 2026-02-18 | 13F | Vident Advisory, LLC | 21.391 | -14,32 | 305 | 55,10 | ||||
| 2026-02-17 | 13F | Fortress Investment Group LLC | 110.000 | 1.566 | ||||||
| 2026-02-17 | 13F | Caption Management, LLC | Put | 0 | -100,00 | 0 | ||||
| 2026-02-13 | 13F | Headlands Technologies LLC | 0 | -100,00 | 0 | |||||
| 2025-11-21 | 13F/A | CIBC Bancorp USA Inc. | 29.682 | 234 | ||||||
| 2026-04-21 | 13F | Grimes & Company, Inc. | 20.987 | -13,93 | 303 | -12,68 | ||||
| 2026-02-05 | 13F | Gabelli Funds Llc | 552.950 | 7.874 | ||||||
| 2026-02-17 | 13F | Boothbay Fund Management, Llc | 233.657 | 3.327 | ||||||
| 2026-01-29 | 13F | Teachers Retirement System Of The State Of Kentucky | 0 | -100,00 | 0 | |||||
| 2026-02-06 | 13F | Legato Capital Management LLC | 43.553 | 8,31 | 620 | 96,20 | ||||
| 2026-02-17 | 13F | Two Sigma Investments, Lp | 1.473.341 | 51,13 | 20.980 | 173,11 | ||||
| 2026-02-12 | 13F | Groupe la Francaise | 234.202 | 3.335 | ||||||
| 2026-02-17 | 13F | Hbk Investments L P | 15.250.000 | 217.160 | ||||||
| 2026-02-17 | 13F | Susquehanna International Group, Llp | Put | 450.200 | 6,76 | 6.411 | 92,96 | |||
| 2026-02-17 | 13F | Susquehanna International Group, Llp | Call | 372.900 | -13,76 | 5.310 | 55,86 | |||
| 2026-02-17 | 13F | Susquehanna International Group, Llp | 144.763 | 570,73 | 2.061 | 1.112,35 | ||||
| 2025-11-14 | 13F | Wolverine Trading, Llc | 11.399 | -56,88 | 91 | -42,31 | ||||
| 2026-02-02 | 13F | CM Management, LLC | 370.000 | -17,78 | 5.269 | 48,56 | ||||
| 2025-11-14 | 13F | Wolverine Trading, Llc | Call | 28.600 | 227 | |||||
| 2025-11-14 | 13F | Wolverine Trading, Llc | Put | 20.500 | -4,65 | 163 | 27,56 | |||
| 2026-02-17 | 13F | Woodline Partners LP | 1.285.200 | 15,74 | 18.301 | 109,18 | ||||
| 2025-11-13 | 13F | Schroder Investment Management Group | 0 | -100,00 | 0 | |||||
| 2026-04-21 | 13F | Alpine Associates Management Inc. | 1.596.190 | 68,16 | 23.081 | 70,76 | ||||
| 2026-01-15 | 13F | Allspring Global Investments Holdings, LLC | 27.062 | 8,91 | 386 | 102,09 | ||||
| 2026-02-17 | 13F | PharVision Advisers, LLC | 0 | -100,00 | 0 | -100,00 | ||||
| 2026-02-11 | 13F | Simplex Trading, Llc | Call | 7.100 | -79,83 | 101 | ||||
| 2026-02-11 | 13F | Simplex Trading, Llc | Put | 21.300 | -33,64 | 303 | ||||
| 2026-02-11 | 13F | Simplex Trading, Llc | 18.857 | 269 | ||||||
| 2026-02-17 | 13F | Millennium Management Llc | Call | 50.000 | -71,01 | 712 | -47,61 | |||
| 2026-02-17 | 13F | Millennium Management Llc | 2.995.089 | -74,64 | 42.650 | -54,17 | ||||
| 2026-02-12 | 13F | Swiss National Bank | 547.000 | 14,51 | 7.789 | 106,93 | ||||
| 2026-02-13 | 13F | Parkside Financial Bank & Trust | 270 | 0,00 | 4 | 50,00 | ||||
| 2026-02-12 | 13F | Jane Street Group, Llc | 726.797 | -44,66 | 10.350 | 0,00 | ||||
| 2026-02-12 | 13F | Jane Street Group, Llc | Put | 158.200 | 10,86 | 2.253 | 100,36 | |||
| 2026-02-12 | 13F | Jane Street Group, Llc | Call | 27.200 | 39,49 | 387 | 152,94 | |||
| 2026-04-10 | 13F | Syquant Capital Sas | 25.000 | 0 | ||||||
| 2026-04-13 | 13F | True Wealth Design, LLC | 893 | 0,00 | 13 | 0,00 | ||||
| 2026-02-18 | 13F | Mackenzie Financial Corp | 17.446 | -88,19 | 248 | -78,69 | ||||
| 2026-02-11 | 13F | Group One Trading, L.p. | Call | 22.700 | 38,41 | 323 | 150,39 | |||
| 2026-02-11 | 13F | Group One Trading, L.p. | Put | 41.500 | -3,26 | 591 | 74,56 | |||
| 2026-02-11 | 13F | Group One Trading, L.p. | 13.469 | -68,78 | 192 | -43,82 | ||||
| 2026-02-14 | 13F | Rockefeller Capital Management L.P. | 1.462 | 7,50 | 21 | 100,00 | ||||
| 2026-01-07 | 13F | Aventura Private Wealth, LLC | 0 | -100,00 | 0 | -100,00 | ||||
| 2026-02-17 | 13F | Sovereign's Capital Management, LLC | 784.942 | -5,93 | 11.178 | 69,99 | ||||
| 2026-04-17 | 13F | RFG Advisory, LLC | 0 | -100,00 | 0 | |||||
| 2026-02-10 | 13F | Rothschild Investment Llc | 532 | 36,41 | 8 | 133,33 | ||||
| 2026-02-17 | 13F | Quantinno Capital Management LP | 34.980 | 20,12 | 498 | 117,47 | ||||
| 2026-04-17 | 13F | Bell Investment Advisors, Inc | 371 | 0,00 | 5 | 0,00 | ||||
| 2026-02-17 | 13F | LMR Partners LLP | Call | 9.700 | 138 | |||||
| 2026-02-17 | 13F | Jump Financial, LLC | 609.941 | -37,75 | 8.686 | 12,50 | ||||
| 2026-02-06 | 13F | EverSource Wealth Advisors, LLC | 5.796 | -30,30 | 83 | 26,15 | ||||
| 2026-02-17 | 13F | LMR Partners LLP | Put | 500.000 | 7.120 | |||||
| 2026-04-15 | 13F | FNY Investment Advisers, LLC | 278.670 | 680,59 | 4 | |||||
| 2026-02-17 | 13F | LMR Partners LLP | 1.157.200 | 16.479 | ||||||
| 2026-02-17 | 13F | Brevan Howard Capital Management LP | 0 | -100,00 | 0 | |||||
| 2026-02-13 | 13F | Ubs Oconnor Llc | 1.000.000 | 14.240 | ||||||
| 2026-02-17 | 13F | Aquatic Capital Management LLC | 0 | -100,00 | 0 | |||||
| 2026-02-17 | 13F | Ameriprise Financial Inc | 0 | -100,00 | 0 | |||||
| 2026-02-17 | 13F | Captrust Financial Advisors | 25.400 | 1,84 | 362 | 84,18 | ||||
| 2026-02-17 | 13F | Balyasny Asset Management Llc | Call | 59.500 | 847 | |||||
| 2026-04-13 | 13F | Massmutual Trust Co Fsb/adv | 453 | 0,00 | 7 | 0,00 | ||||
| 2026-02-17 | 13F | Balyasny Asset Management Llc | 5.124.427 | 272,13 | 72.972 | 572,48 | ||||
| 2026-01-23 | 13F | Avion Wealth | 227 | -17,15 | 0 | |||||
| 2026-01-30 | 13F | Torren Management, LLC | 174 | 2 | ||||||
| 2026-02-06 | 13F | Bare Financial Services, Inc | 216 | 60,00 | 3 | 200,00 | ||||
| 2026-02-13 | 13F | Smartleaf Asset Management LLC | 3.768 | 276,05 | 54 | 657,14 | ||||
| 2026-04-22 | 13F | Pictet Asset Management Holding SA | 893.901 | -55,19 | 12.900 | -54,62 | ||||
| 2026-02-17 | 13F | Polar Asset Management Partners Inc. | 243.000 | 3.460 | ||||||
| 2026-02-17 | 13F | Qube Research & Technologies Ltd | 4.434.679 | 153,47 | 63.150 | 358,07 | ||||
| 2026-02-12 | 13F | Brown Brothers Harriman & Co | 473 | 7 | ||||||
| 2025-11-13 | 13F | Barrow Hanley Mewhinney & Strauss Llc | 0 | -100,00 | 0 | |||||
| 2026-02-17 | 13F | Tower Research Capital LLC (TRC) | 2.363 | -81,24 | 34 | -66,67 | ||||
| 2026-02-13 | 13F | Stifel Financial Corp | 11.859 | -81,21 | 169 | -66,20 | ||||
| 2026-01-29 | 13F | China Universal Asset Management Co., Ltd. | 50.275 | -6,95 | 716 | 68,24 | ||||
| 2026-02-12 | 13F | Nuveen, LLC | 4.628.225 | 0,13 | 65.906 | 80,94 | ||||
| 2026-02-17 | 13F | Price T Rowe Associates Inc /md/ | 281.842 | -73,31 | 4 | -50,00 | ||||
| 2026-02-10 | 13F | Globeflex Capital L P | 86.878 | 1.237 | ||||||
| 2026-02-17 | 13F | One68 Global Capital, LLC | 30.000 | 427 | ||||||
| 2025-11-14 | 13F | Hrt Financial Lp | 0 | -100,00 | 0 | |||||
| 2026-02-06 | 13F | Profund Advisors Llc | 183.552 | 120,52 | 2.614 | 298,93 | ||||
| 2026-04-02 | 13F/A | Seven Fleet Capital Management LP | 82.500 | 1.175 | ||||||
| 2026-02-17 | 13F | MIRAE ASSET GLOBAL ETFS HOLDINGS Ltd. | 167.243 | 12,45 | 2.382 | 102,98 | ||||
| 2026-02-23 | 13F | Virtu Financial LLC | 117.063 | 177,66 | 2 | |||||
| 2026-04-06 | 13F | GAMMA Investing LLC | 2.432 | 22,40 | 35 | 25,00 | ||||
| 2026-02-02 | 13F | Fifth Third Bancorp | 0 | -100,00 | 0 | |||||
| 2026-02-17 | 13F | Torno Capital, Llc | Call | 0 | -100,00 | 0 | -100,00 | |||
| 2026-02-17 | 13F | Vazirani Asset Management LLC | 25.000 | 356 | ||||||
| 2026-02-17 | 13F | Dark Forest Capital Management Lp | 140.300 | 1.998 | ||||||
| 2026-02-17 | 13F | Torno Capital, Llc | Put | 0 | -100,00 | 0 | -100,00 | |||
| 2026-02-06 | 13F | Handelsbanken Fonder AB | 107.541 | 22,99 | 2 | |||||
| 2026-02-09 | 13F | Quest Partners LLC | 142.501 | 30,89 | 2.029 | 136,76 | ||||
| 2026-02-06 | 13F | ProShare Advisors LLC | 89.824 | 53,30 | 1.279 | 177,44 | ||||
| 2026-02-13 | 13F | Rice Hall James & Associates, Llc | 3.509.571 | 2,18 | 49.976 | 84,65 | ||||
| 2026-04-24 | 13F | Strs Ohio | 87.800 | 1.729,17 | 1.270 | 1.766,18 | ||||
| 2026-02-17 | 13F | Vestal Point Capital, LP | 0 | -100,00 | 0 | |||||
| 2026-04-07 | 13F | Signaturefd, Llc | 2.895 | 0,00 | 42 | 0,00 | ||||
| 2026-01-15 | 13F | Nisa Investment Advisors, Llc | 2.887 | 0,00 | 41 | 86,36 |